Article

Stability of Protein and Oil Content in Soybean across Dry and Normal Environments—A Case Study in Croatia

1
Faculty of Agriculture, University of Zagreb, Svetošimunska cesta 25, 10000 Zagreb, Croatia
2
Centre of Excellence for Biodiversity and Molecular Plant Breeding (CroP-BioDiv), Svetošimunska Cesta 25, 10000 Zagreb, Croatia
3
Faculty of Agrobiotechnical Sciences Osijek, University of Josip Juraj Strossmayer in Osijek, Vladimira Preloga 1, 31000 Osijek, Croatia
4
Agricultural Institute Osijek, Južno Predgrađe 17, 31000 Osijek, Croatia
5
Centre for Seed and Seedlings Based in Osijek, Croatian Agency for Agriculture and Food, Usorska 19, 31000 Osijek, Croatia
6
Institute of Agriculture and Tourism, Karla Huguesa 8, 52440 Porec, Croatia
7
Bc Institute for Breeding and Production of Field Crops, Dugoselska 7, 10370 Dugo Selo, Croatia
*
Author to whom correspondence should be addressed.
Agronomy 2022, 12(4), 915; https://doi.org/10.3390/agronomy12040915
Submission received: 17 March 2022 / Revised: 8 April 2022 / Accepted: 9 April 2022 / Published: 11 April 2022

Abstract

:
Soybean is generally grown as a rainfed crop worldwide and very often is exposed to drought and high temperatures. The objectives of this study were to determine the performance and stability of 32 elite soybean genotypes for seed protein and oil contents across six dry and eight normal environments and to determine the influence of environment on the relationship between the two traits. In the combined ANOVA, genotypes (G), environments (E) and G × E were significant for both traits with protein content being more sensitive to environmental changes than oil content. Mean seed protein content decreased by 4.5% under drought conditions compared to normal ones and ranged from 2.3% to 7.1% for individual genotypes. At the same time drought caused a slight increase in seed oil content of +1.2%, with a range of −1.3% to +4.5% for individual genotypes. Genotype stability in terms of regression coefficient (b) and coefficient of variation (CV) was in moderate to weak negative correlation with mean genotype performance for protein content, while no correlation was observed between genotype stability and mean genotype performance for oil content. Protein and oil content were significantly negatively correlated in normal environments (r = −0.33), while no correlation between the traits was observed in dry environments (r = −0.02).

1. Introduction

The main task of agriculture is to provide sufficient proteins, carbohydrates, oils, fibers, and other compounds crucial to humans and animals. In this context, soybean (Glycine max (L.) Merr.) is one of the most important protein and oil crops and is one of the five most important field crops in the world with a constantly increasing area and production. According to the FAOSTAT database, soybean harvested area increased by 92% or 58 million ha in the period 1994–2019, while production increased by 145% or 197 million tons [1]. Soybean accounts for more than half of the world’s oilseed production and more than a quarter of the protein used globally for human food and animal feed [2]. Compared to other legumes such as chickpea, mung bean, lentil, cowpea, pigeon pea, kidney bean, and moth bean, soybean is superior in protein, total lipids, minerals (P, K, Ca, Fe, Zn,) and vitamins (thiamine, riboflavin, vitamins C and E) [3]. The benefits of soybean products for human health have been described by Prasad et al. [4] and Igiehon et al. [5].
Soybean is generally grown as a rainfed crop worldwide and very often is exposed to various abiotic stresses. Problems such as salinity, acidity, desertification, etc. are mainly of regional importance, while climate change reduces crop yield and quality worldwide and threatens food security [6,7,8]. According to UN data [9], the global average temperature increased by 0.85 °C between 1880 and 2012. For comparison, for every degree of temperature increase, grain yields decrease by about 5%. Moreover, water scarcity, insufficient amount and frequency of precipitation, drought stress, and extremely high temperatures adversely affect soybean during all vegetative stages. Further, as climate change projections become increasingly negative, the cultivation of stable cultivars with high yields while maintaining high quality will be of exceptional importance [10].
While the adverse effects of high temperature and drought on soybean yield and yield components are well known and documented [11,12,13,14,15,16,17], previous studies have reported conflicting results on the effects of temperature and precipitation on the protein and oil composition of soybean seeds. For example, Piper and Boote [18] and Carrera et al. [19] showed that oil content increased with increasing temperature during seed filling, whereas the response of protein content vs. temperature exhibited a quadratic function. Piper and Boote [18] reported that protein content was low between 20 °C and 25 °C and increased at temperatures below 20 °C, or above 25 °C, which is similar to the pattern observed by Carrera et al. [19] who found that protein content decreased with increasing temperature between 14.1 °C and 19.3 °C and then increased with increasing temperature. Mourtzinis et al. [20] found that higher temperatures reduced protein content and favoured oil content in soybean seeds. In contrast, Dornbos and Mullen [21], Vollmann et al. [22] and Kumar et al. [23] found a positive relationship between temperature and protein concentration, but a negative relationship between temperature and oil concentration. In several other studies, high temperature tended to decrease [24] or increase [25,26] oil content without affecting protein content.
Regarding water availability, Maestri et al. [24] observed a significant negative correlation for both protein and oil content with total precipitation during the growing season. Dornbos and Mullen [21], Vollmann et al. [22], and Kumar et al. [23] observed an increase in protein content and a decrease in oil content in soybean seeds with decreasing precipitation, in contrast to Specht et al. [27] and Carrera et al. [19] who found a decrease in protein content and an increase in oil content with rising water deficit during the reproductive stages.
The complexity of the relationship between weather conditions and soybean seed composition has been demonstrated by Yaklich and Vynyard [28] and Song et al. [29] Yaklich and Vynyard [28] compared monthly temperature and precipitation variables during the growing season (April to September) with protein and oil data for the years 1959 to 1996 from the U.S.A. Uniform Soybean Tests. In their study, protein concentrations were most affected by temperature variables from the months of April and August, whereas the oil concentrations were best classified by August and September temperature variables and precipitation in May and September. Song et al. [29] collected a large number of soybean samples at many locations in China from 2010 to 2013 and found that, crude protein was positively correlated with mean daily temperature and precipitation on an annual average basis, while crude oil was negatively correlated with mean daily temperature. However, when the data were analyzed by year, some of the previously observed correlations were absent. Agricultural practice (seeding rate, row spacing, herbicide and fungicide treatments, seed treatments, and nitrogen application) is an additional factor that can alter environmental effects on soybean seed composition [30,31].
As a consequence of the complex relationship between weather variables and soybean seed composition, although the correlation between protein and oil content is generally negative [23,32,33,34,35,36], the strength of the correlation between protein and oil content can vary depending on the environment [18,22,37,38,39]. In addition, different sets of genotypes considered in the different studies may also have influenced the reported strength of correlations between protein and oil content. For example, Watanabe et al. [32] reported that the negative correlation between protein and oil content was stronger in smaller seeded than in larger seeded cultivars or lines, and Yaklich et al. [40] found stronger negative correlations between the two traits for late-maturing groups grown in the southern region of the U.S. than for early-maturing groups from the northern region. The conflicting results regarding environmental effects on protein and oil content of soybean seeds, along with the overall negative correlation between the two traits found in previous studies, make it extremely difficult to improve the two traits simultaneously in breeding programmes. Therefore, multi-environmental trials including a range of genotypes are needed to evaluate the effects of environment and genotype on seed oil and protein content, but also to assess the stability of genotypes for seed composition and possibly reveal their adaptation to specific environments. There are few published studies investigating the stability of protein and oil content in soybean, especially those involving a large number of genotypes and environments [41,42,43,44]. In the light of climate change and the expected increase in the frequency of adverse weather conditions, there is a need to test a large number of soybean genotypes in a range of different environments, including those characterized by different levels of random or managed abiotic stress conditions. This would provide useful information to breeders aiming at creating broadly adapted cultivars with high yields and quality, but also help farmers to select those genotypes that can perform at their maximum in favorable environments with minimal losses due to adverse conditions.
Thus, the objectives of this study were (i) to determine the protein and oil content of 32 elite soybean genotypes in 14 dry and normal environments (ii) to estimate the stability of soybean genotypes for seed protein and oil across environments, and (iii) to determine the environmental influence on the relationships between the two traits.

2. Materials and Methods

2.1. Plant Material

Thirty-two soybean genotypes including 24 cultivars and eight breeding lines of maturity groups ranging from 00 to I were used as the experimental material (Table 1). Representation of these cultivars on the arable land of the Republic of Croatia was more than 90% at the time when experiments took place.

2.2. Description of Field Trials

Field trials with 32 soybean genotypes were conducted during two consecutive growing seasons (2017 and 2018) under natural weather conditions at seven locations across the main soybean growing area in Croatia (Table 2). The trials were set up according to a randomized complete block design with four replicates. The size of the experimental plot in each trial was 10 m2. Sowing was performed in optimal agrotechnical terms in both years (Table 2) with a pneumatic seed drill at plant density recommended by seed companies. The inter-row spacing was 0.45 m, while the within-row spacing was adjusted to the expected stand of 50 plants per m2 for later cultivars and 60 plants per m2 for earlier cultivars. The seeding rate for each genotype was adjusted according to the corresponding germination rate determined each year by standard germination tests. All agrotechnical operations were carried out according to the requirements of intensive soybean production and mineral fertilization was applied at each location on the basis of chemical analysis of the soil. Seeds were not treated with any microorganisms.

2.3. Data Collection

After the harvest, seed samples (200 g) were collected from each plot and seed protein and oil contents of unground seeds were determined by the near-infrared reflectance spectroscopy using the SpectraStarTM XT infrared analyzer (Unity Scientific, Milford, MA 01757, USA). In each year, 30 reference samples were used to expand and validate the spectroscopic calibration equations for the accurate calculation of protein and oil content. Based on the reference values for moisture, oil and protein the original calibration from the factory”unground soybeans-070914” was modified. Seed protein and oil contents were expressed in percentages (%) on a dry matter basis.
The weather data (rainfalls, air temperature, and humidity) were collected by automatic weather stations (Vantage Vue DAV-6250EU, Davis Instruments) situated at each location. The amounts of precipitation and average air temperature were used to draw Heinrich Walter’s climate diagrams to estimate the favorableness of the weather situation for soybean growth and development at each location.

2.4. Statistical Analysis

Effects due to genotype, environment, and genotype × environment interaction for protein content and oil content were determined by the additive main effects and multiplicative interaction (AMMI) analysis using GEA-R software version 4.1 [45].
The basic model was:
Y i j = μ + g i + e j + n = 1 N τ n γ i n δ j n + ε i j
where Yij is the yield of the i-th genotype in the j-th environment; µ is the grand mean; gi and ej are the genotype and environment deviations from the grand mean, respectively; τn is the eigenvalue of the IPC analysis axis n; γin and δjn are the genotype and environment principal components score for axis n; N is the number of interaction principal components retained in the model and εij is the error term.
Tukey’s Studentized Range (HSD) Test was used for testing differences between environmental means at p < 0.05. It was based on the following model:
Y i j k = μ + g i + e j + r k + g e i j + ε i j k
and was conducted using GLM procedure of SAS 9.4. [46]. In the model, Yijk is the yield of the i-th genotype in the j-th environment and k-th replicate; µ is the grand mean; gi, ej and rk are the genotype, environment, and replicate deviations from the grand mean, respectively; geij is the genotype × environment interaction term and εijk is the error term.
Two stability parameters were calculated to assess the stability performance of genotypes; b, the linear regression of the phenotypic values on environmental mean [47] and the coefficient of variation (CV) suggested by Francis and Kannenberg [48] using the STABILITYSOFT [49].

3. Results and Discussion

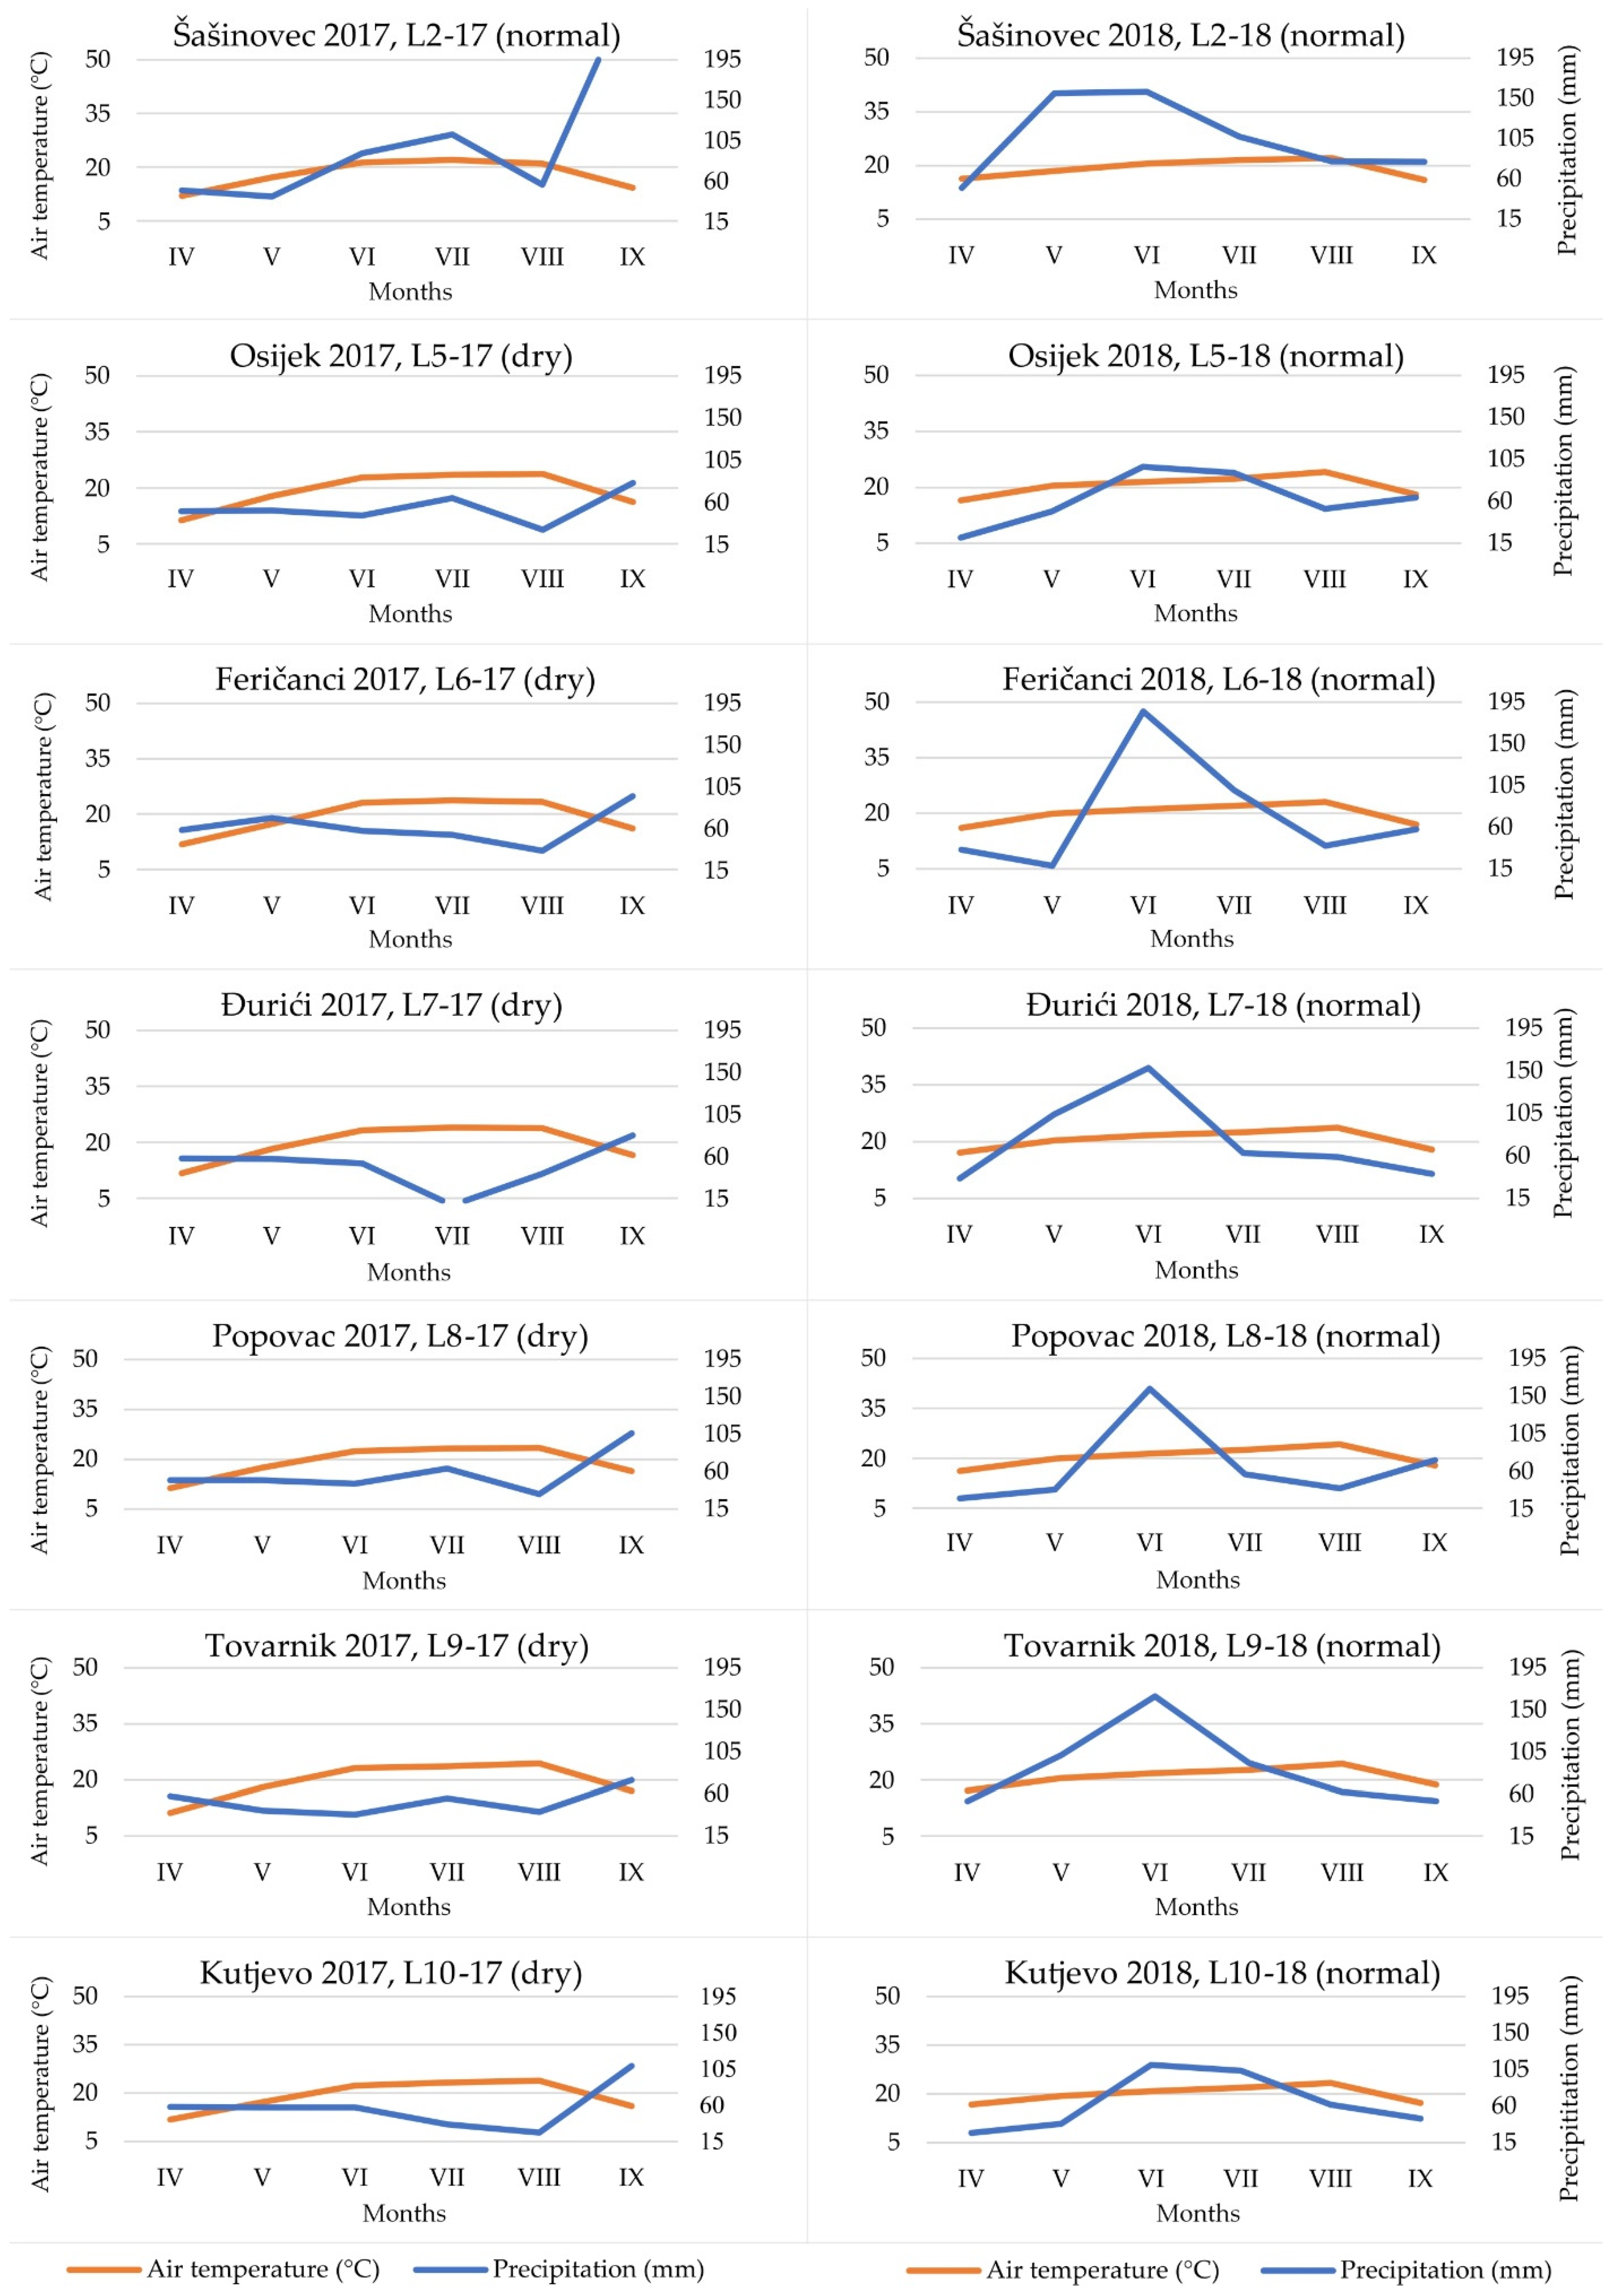
3.1. Weather Conditions

Precipitation amounts between 600 and 700 mm per year, with good distribution during the vegetation period, are necessary for successful soybean production [50]. According to Kranz and Specht [51], about 65% of soybean water needs occur during the reproductive stages: from R1 (beginning flower), through R3 and R4 (pod development) to R5 and R6 phase (seed fill). In opposite, soybean usually accelerates maturation, shortens the pod-filling period, and reduces leaf expansion and leaf area under moderate to severe water shortage [52,53].
In Croatia, weather conditions vary greatly among years with an emphasis on the increasing occurrence of unfavorable years which could be connected with the global climate change process [54,55]. A significant difference in precipitation and mean air temperature was noted among environments (year-location combinations) in our experiment according to Heinrich Walter’s climate diagram (Figure 1). Generally, vegetation season 2017 was less favorable for soybean production in comparison with 2018 because of observed precipitation deficiency at six out of seven locations. As stated by Vratarić and Sudarić [50] for successful soybean production at least 150–170 mm of precipitation should fall during June, July and August. In this context, all locations in 2018 and location Šašinovec in 2017 (L2-17), that received between 239.5 and 344.6 mm of precipitation, were designated as favorable/normal, while the six remaining locations in 2017 experienced moderate drought stress (less than 150 mm of precipitation) and these environments were treated as dry (Table S1). Mean precipitation during the three summer months (June, July, and August) was around 55% lower in dry environments compared with normal environments (130 mm and 286 mm, respectively). During the same period, mean air temperature in dry environments was 1.2 °C higher than in normal environments (Table S1). Among all tested environments, the lowest precipitation and highest air temperatures were recorded for Đurići 2017 (L7-17) while Šašinovec in 2018 (L2-18) showed opposite characteristics although precipitation amounts were extreme.

3.2. Analysis of Variance

The AMMI analysis of variance for protein content revealed highly significant (p < 0.01) effects of genotype (G), environment (E), and G × E interaction (Table 3).The environment had the largest effect, explaining 73.3% of the treatment sum of squares, whereas G and the G × E interaction accounted for 13.1% and 13.6% of the treatment sum of squares, respectively. For oil content, the effects of genotype (G), environment (E) and G × E interaction were also highly significant (p < 0.01), with environment showing the largest effect and explaining 44.4% of the treatment sum of squares, whereas G and the G × E interaction were responsible for 24.3% and 31.2%, respectively.
Vollman et al. [22] and Hampango et al. [43] also reported the predominant effect of the environment on protein and oil content of soybean seeds. In the present study, protein content was more influenced by environmental conditions than oil content, which is consistent with the results of a previous study on soybean seed composition conducted in 15 environments in eastern Croatia [42]. On the contrary, in some previous studies, the relative contribution of environment to the overall variation was more pronounced for oil content than for protein content [19,39,56].
Information on environmental effects on soybean seed composition can be useful for growers, especially when based on data from trials conducted in a wide range of target environments, including dry environments, as was the case in the present study. However, from the breeder’s perspective, the relative contribution of genotype (G) and genotype-environment interaction (G × E) to the overall variation of seed composition is more important because these components affect estimates of heritability, which is the key factor influencing the response to selection. Because the G × E interaction affects the correlations between the performances of genotypes in different environments, the observed performance of a set of genotypes in one environment may not be very informative for the performance of the same set of genotypes in another environment when G × E is large [57]. In the present study, the relative contributions of both components were the same for protein content, whereas, for oil content, the relative contribution of the G × E interaction component was higher than that of the genotype, which is in contrast to the results of Gurmu et al. [56]. In the study of Hampango et al. [43], the relative contribution of genotype and G × E interaction was the same for both protein and oil content. On the other hand, Vollman et al. [22] and Sudarić et al. [42] reported that the contribution of genotype was several times greater than the contribution of G × E interaction, in contrast to Carrera et al. [19] who found the greater effect of G × E interaction for both traits.
In the present study, the treatment sum of squares due to the G × E interaction for protein content was partitioned into six significant interaction principal component axes. The first two IPCAs explained 45.19% of the total variation, with the contribution of IPCA1 being 28.25% and that of IPCA2 being 16.94% (Table 3). The multiplicative variance of the treatment sum of squares due to the G × E interaction for oil content was partitioned into five significant interaction principal component axes. The first two IPCAs explained 43.61% of the total variation, with the contribution of IPCA1 being 23.81% and that of IPCA2 being 19.80%. Considering the relatively low percentage of the G × E interaction sum of squares explained by IPCA1 alone for both protein and oil content, the AMMI2 biplots combining IPCA1 and IPCA2 scores were created to visualize the G × E interaction, whereas the main effects of environments and genotypes were presented in a tabular view.

3.3. Main Effects of Environments and Genotypes

Protein and oil contents (mean across 32 soybean genotypes) for seven locations in the 2017 and 2018 growing seasons (14 environments in total) are shown in Table 4. Based on the Heinrich Walter climate diagram (Figure 1), six locations in the 2017 growing season, were designated as dry (D) whereas the location Šašinovec in 2017 and all seven locations in 2018 were designated as normal (N).
Protein content across 14 environments varied from 35.09% (Popovac 2017; D environment) to 40.52% (Šašinovec 2017; N environment). Mean protein content was lower at seven locations in 2017 (38.22%) than in 2018 (39.47%), but significant differences in protein content were also observed among locations within the two years. At each of the six dry locations in 2017 protein content was significantly lower than the corresponding protein content in normal 2018, with relative differences ranging from −1.7% at Osijek to −6.6% at Kutjevo. Our results are consistent with those of Maestri et al. [24], Specht et al. [27], Carrera et al. [19], and Song et al. [29], who reported a decrease in protein content with increasing water deficit during soybean reproductive stages. In contrast, Vollmann et al. [22] and Kumar et al. [23] observed an increase in protein content in soybean seed with decreasing rainfall.
Oil content in 14 environments (Table 4) varied from 19.28% (Kutjevo 2018; N environment) to 20.84% (Popovac 2018; N environment). In contrast to protein content, which was 3.3% lower in 2017 than in 2018, average oil content across locations was 1.4% higher in dry 2017 (20.39%) than in normal 2018 (20.11%). However, when looking at individual locations, only three locations were observed to have higher oil content in dry 2017 compared to normal 2018, ranging from 3.5 to 4.9%, while drought significantly reduced oil content at the location Đurići (−2.0%). No significant differences in seed oil content between the two years were observed at the remaining three locations. Several previous studies also reported conflicting results regarding the effects of water availability on oil content in soybean seed. Dornbos and Mullen [21], Maestri et al. [24], Vollmann et al. [22], and Kumar et al. [23] observed a decrease in oil content in soybean seed with decreased precipitation, while Specht et al. [27] and Carrera et al. [19] reported an increase in oil content under water stress during reproductive stages. Regarding the effect of temperature on oil content, Naeve and Huerd [26], Ren et al. [25] and Mourtzinis et al. [20] found that higher temperatures favoured oil content in soybean seed, in contrast to Dornbos and Mullen [21], Maestri et al. [24], Vollmann et al. [22], Kumar et al. [23] and Song at al. [29] who found a negative relationship between temperature and oil content.
One explanation for the seemingly contradictory results regarding changes in protein and oil content of seeds in the different studies could be the number and diversity of cultivar panels included in the different studies, but also the complexity of environmental variables that determine protein and oil content, where high temperatures can interact with drought. Dry conditions usually coincide with high temperatures, as was the case in the present study, where dry conditions in 2017 were associated with higher mean air temperatures at six experimental locations, compared to the wetter year of 2018. Carrera et al. [19] showed that the relationship between average daily mean temperature during seed filling and oil and protein concentration changes as a function of water stress level. Their results showed that oil concentration under water stress increased linearly with both
Increasing temperatures and increasing water deficit, while protein concentration increased linearly with temperature but decreased linearly with water deficit, which is consistent with our results.
Mean values of seed protein and oil contents for 32 genotypes across all 14 environments as well as across eight normal and six dry environments, with the corresponding ranks within each group of environments, are shown in Table 5 and Table 6. Protein content in normal environments varied from 37.99% (OS-8) to 40.68% (Merkur) and in dry environments from 36.53% (OS-8) to 39.13% (Ema) with a mean across all genotypes of 39.6% and 37.83, respectively (Table 5). The decrease in protein content in dry environments compared to normal environments was observed in all genotypes and ranged from −2.3% for Gabriela to −7.1% for Lucija with a mean of −4.5% across all 32 genotypes. Spearman’s rank correlation coefficient between normal and dry environments was relatively high (r = 0.72 **), suggesting similar performance of genotypes in favorable and dry environments. Among the top five performing genotypes in normal and dry environments, four genotypes were the same for both groups of environments. The five best performing genotypes across all environments (Merkur, Toma, Ema, OS-4, and OS-5) belong to the early maturity group and among the genotypes of the first quartile (the eight best genotypes,) seven genotypes are from the early maturity group.
Oil content varied from 19.50% (Korana) to 20.83% (Bahia) in normal environments and from 19.33% (Korana) to 21.29% (Sara) in dry environments with a mean across all genotypes of 20.14% and 20.39%, respectively (Table 6). Unlike protein content, changes in oil content in dry environments compared to normal environments were inconsistent among genotypes, ranging from −1.3% for Ika and Tena to +4.5% for Zagrebčanka with a mean of 1.2% across all 32 genotypes. The Spearman’s rank correlation coefficient between normal and dry environments was moderate (r = 0.54 **), suggesting that for oil content, the observed performances of a set of genotypes in normal environments are less informative for predicting the performances of the same genotypes in dry environments than was the case for protein content. Nevertheless, among the top five genotypes for oil content in normal and dry environments, three genotypes were common to the two groups of environments. However, unlike for protein content, the best genotypes for oil content (Sara, Bahia, OS-5, Gabriela, and Zagrebčanka) were not associated with any particular maturity group. For example, of the five best genotypes across all environments, two genotypes belonged to the early maturity group (OS-5 and Gabriela) and the remaining three (Sara, Bahia and Zagrebčanka) to the late maturity group. Also, among the genotypes from the first quartile (the eight best genotypes), half of the genotypes belonged to the early maturity group and the other half to the late maturity group. Dardanelli et al. [41], Rod et al. [58] and Schmitz and Kandel [59] also reported an association between maturity group and soybean seed composition, whereas in the study of Sobko et al. [35] maturity group affected neither protein nor oil content.
In agreement with our results, Rod et al. [58] reported that the maturity group significantly affected protein content but not oil content. On the other hand, Dardanelli et al. [41] found that the maturity group had a greater effect on oil content than on protein content, which was more influenced by the maturity group × environment interaction in their study. Schmitz and Kandel [59] reported a significant effect of the maturity group on both traits, with protein content being higher in early cultivars and oil content in late cultivars. Rod et al. [58] suggested that the differences between maturity groups might be largely due to cultivar differences, but slight differences in temperature and/or water availability during the critical stages of seed fill between different maturity groups could account for the differences in protein concentration between maturity groups.

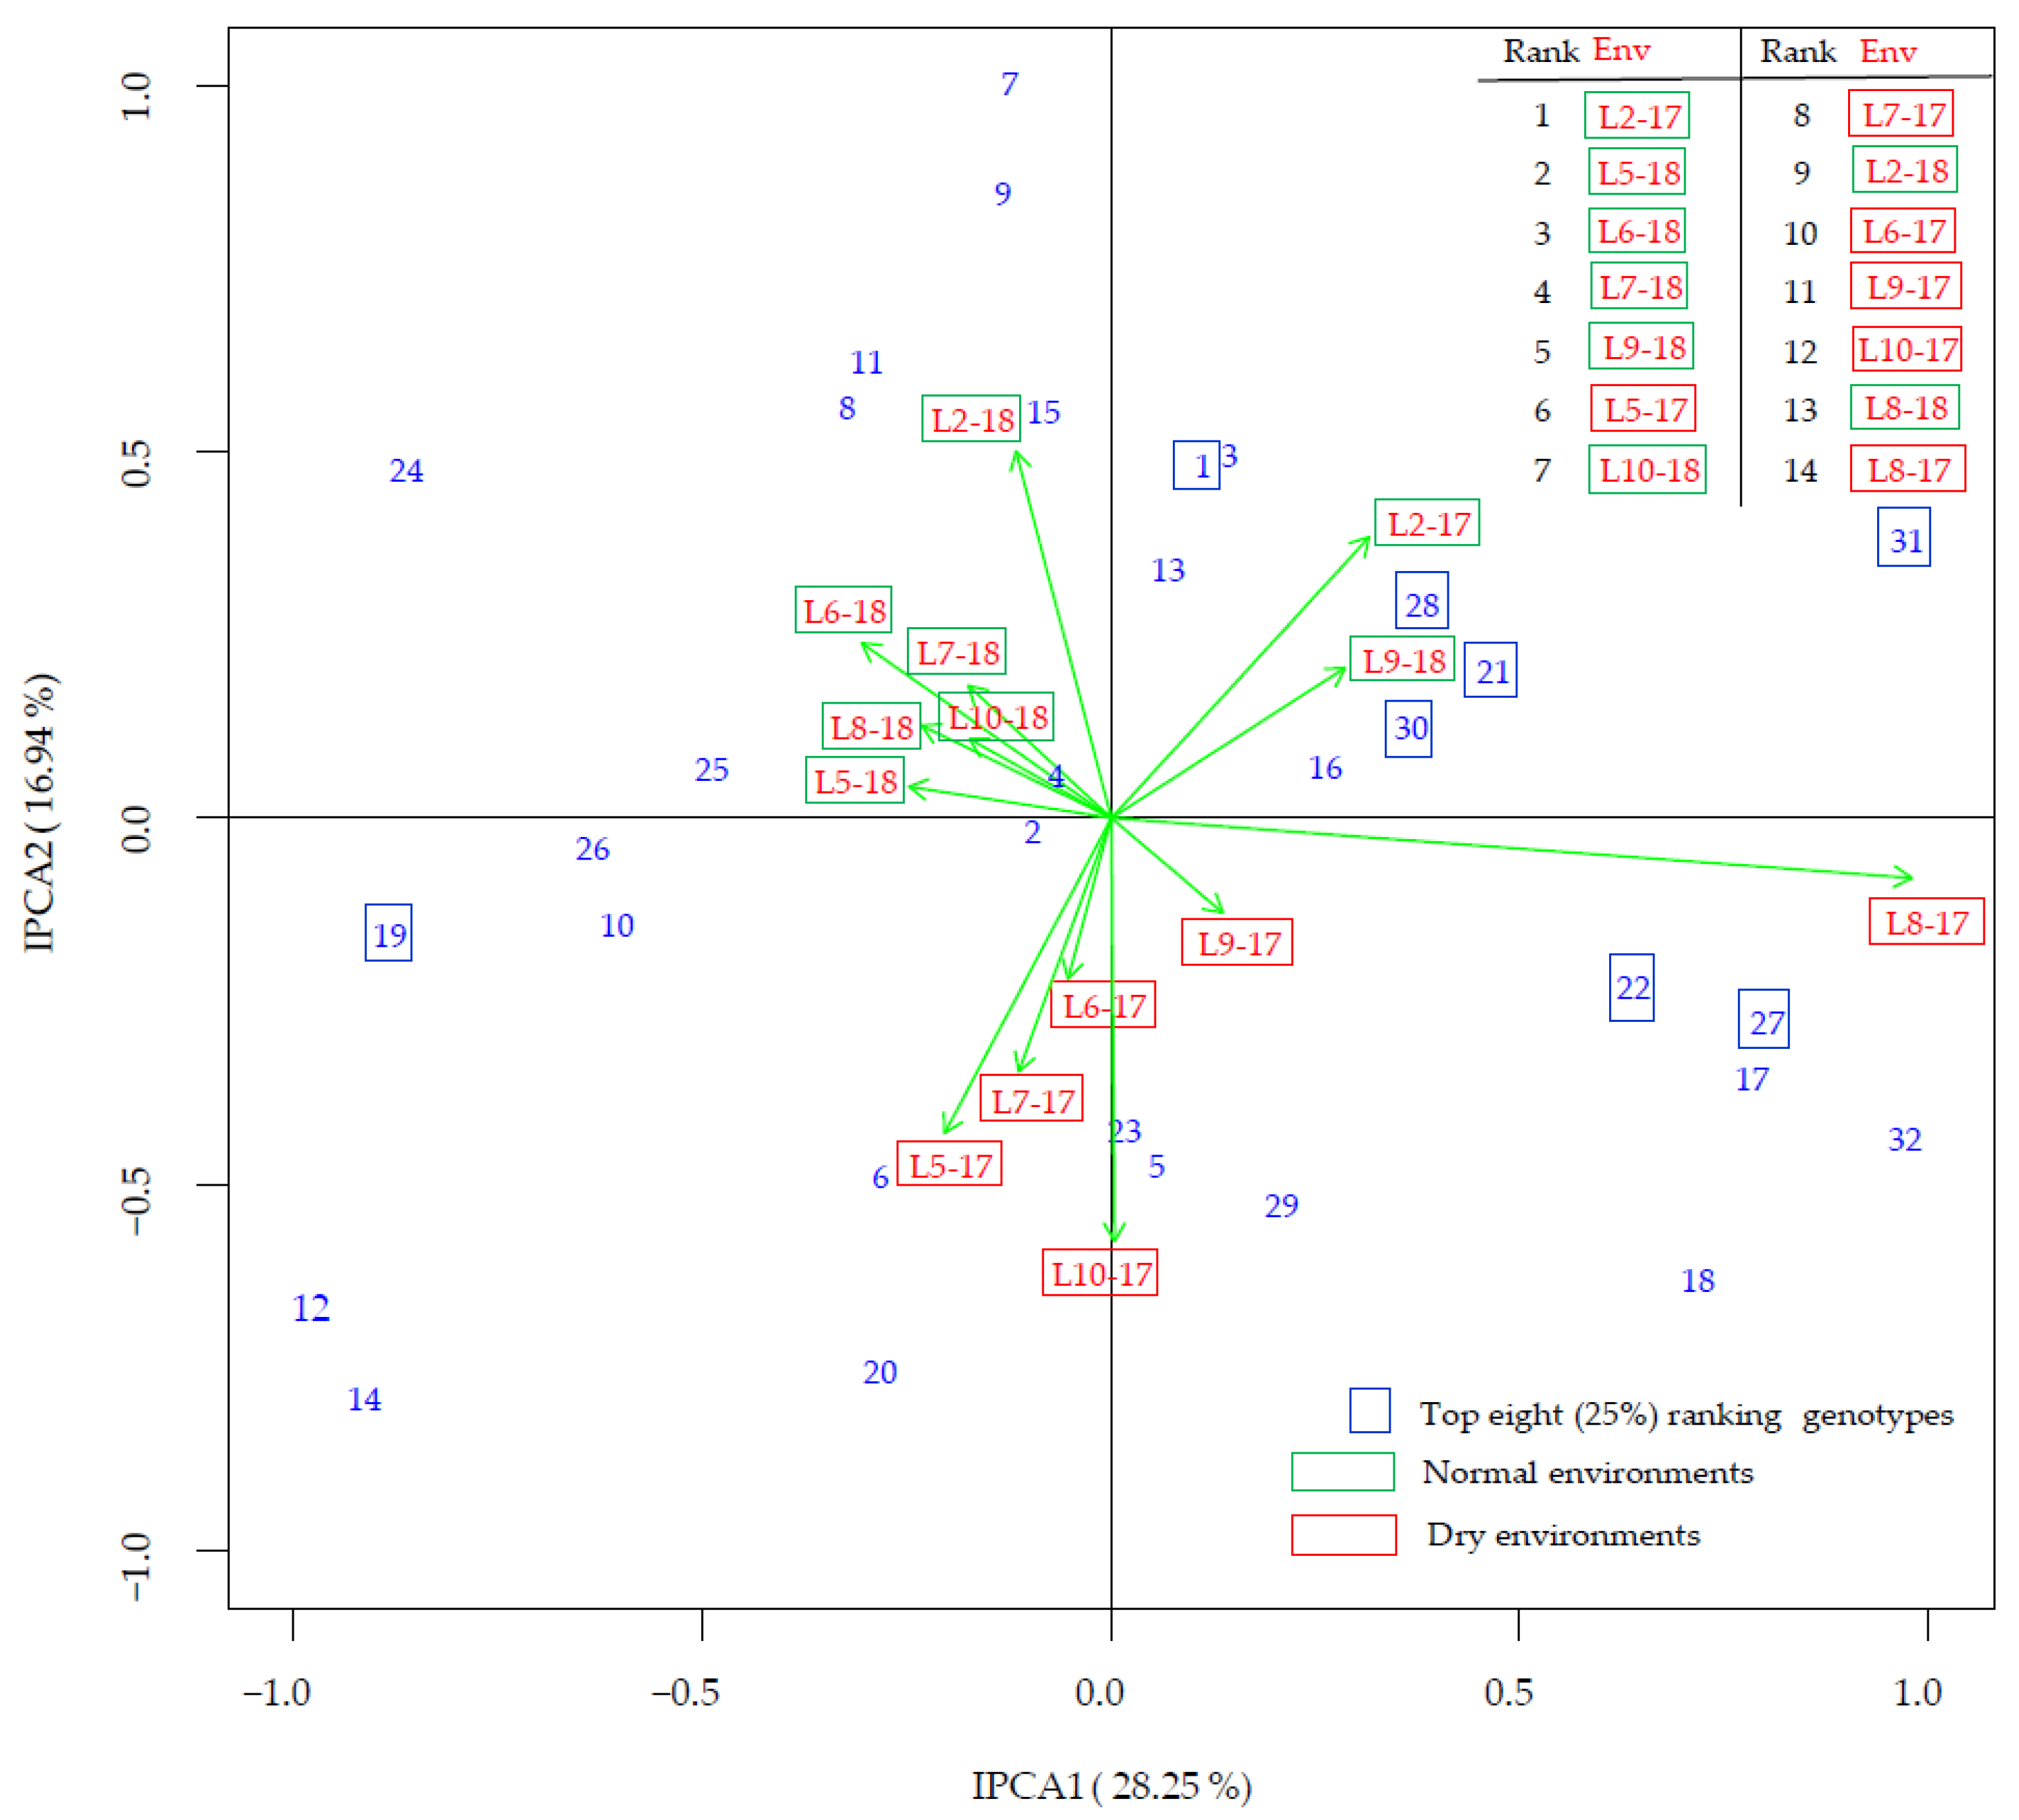
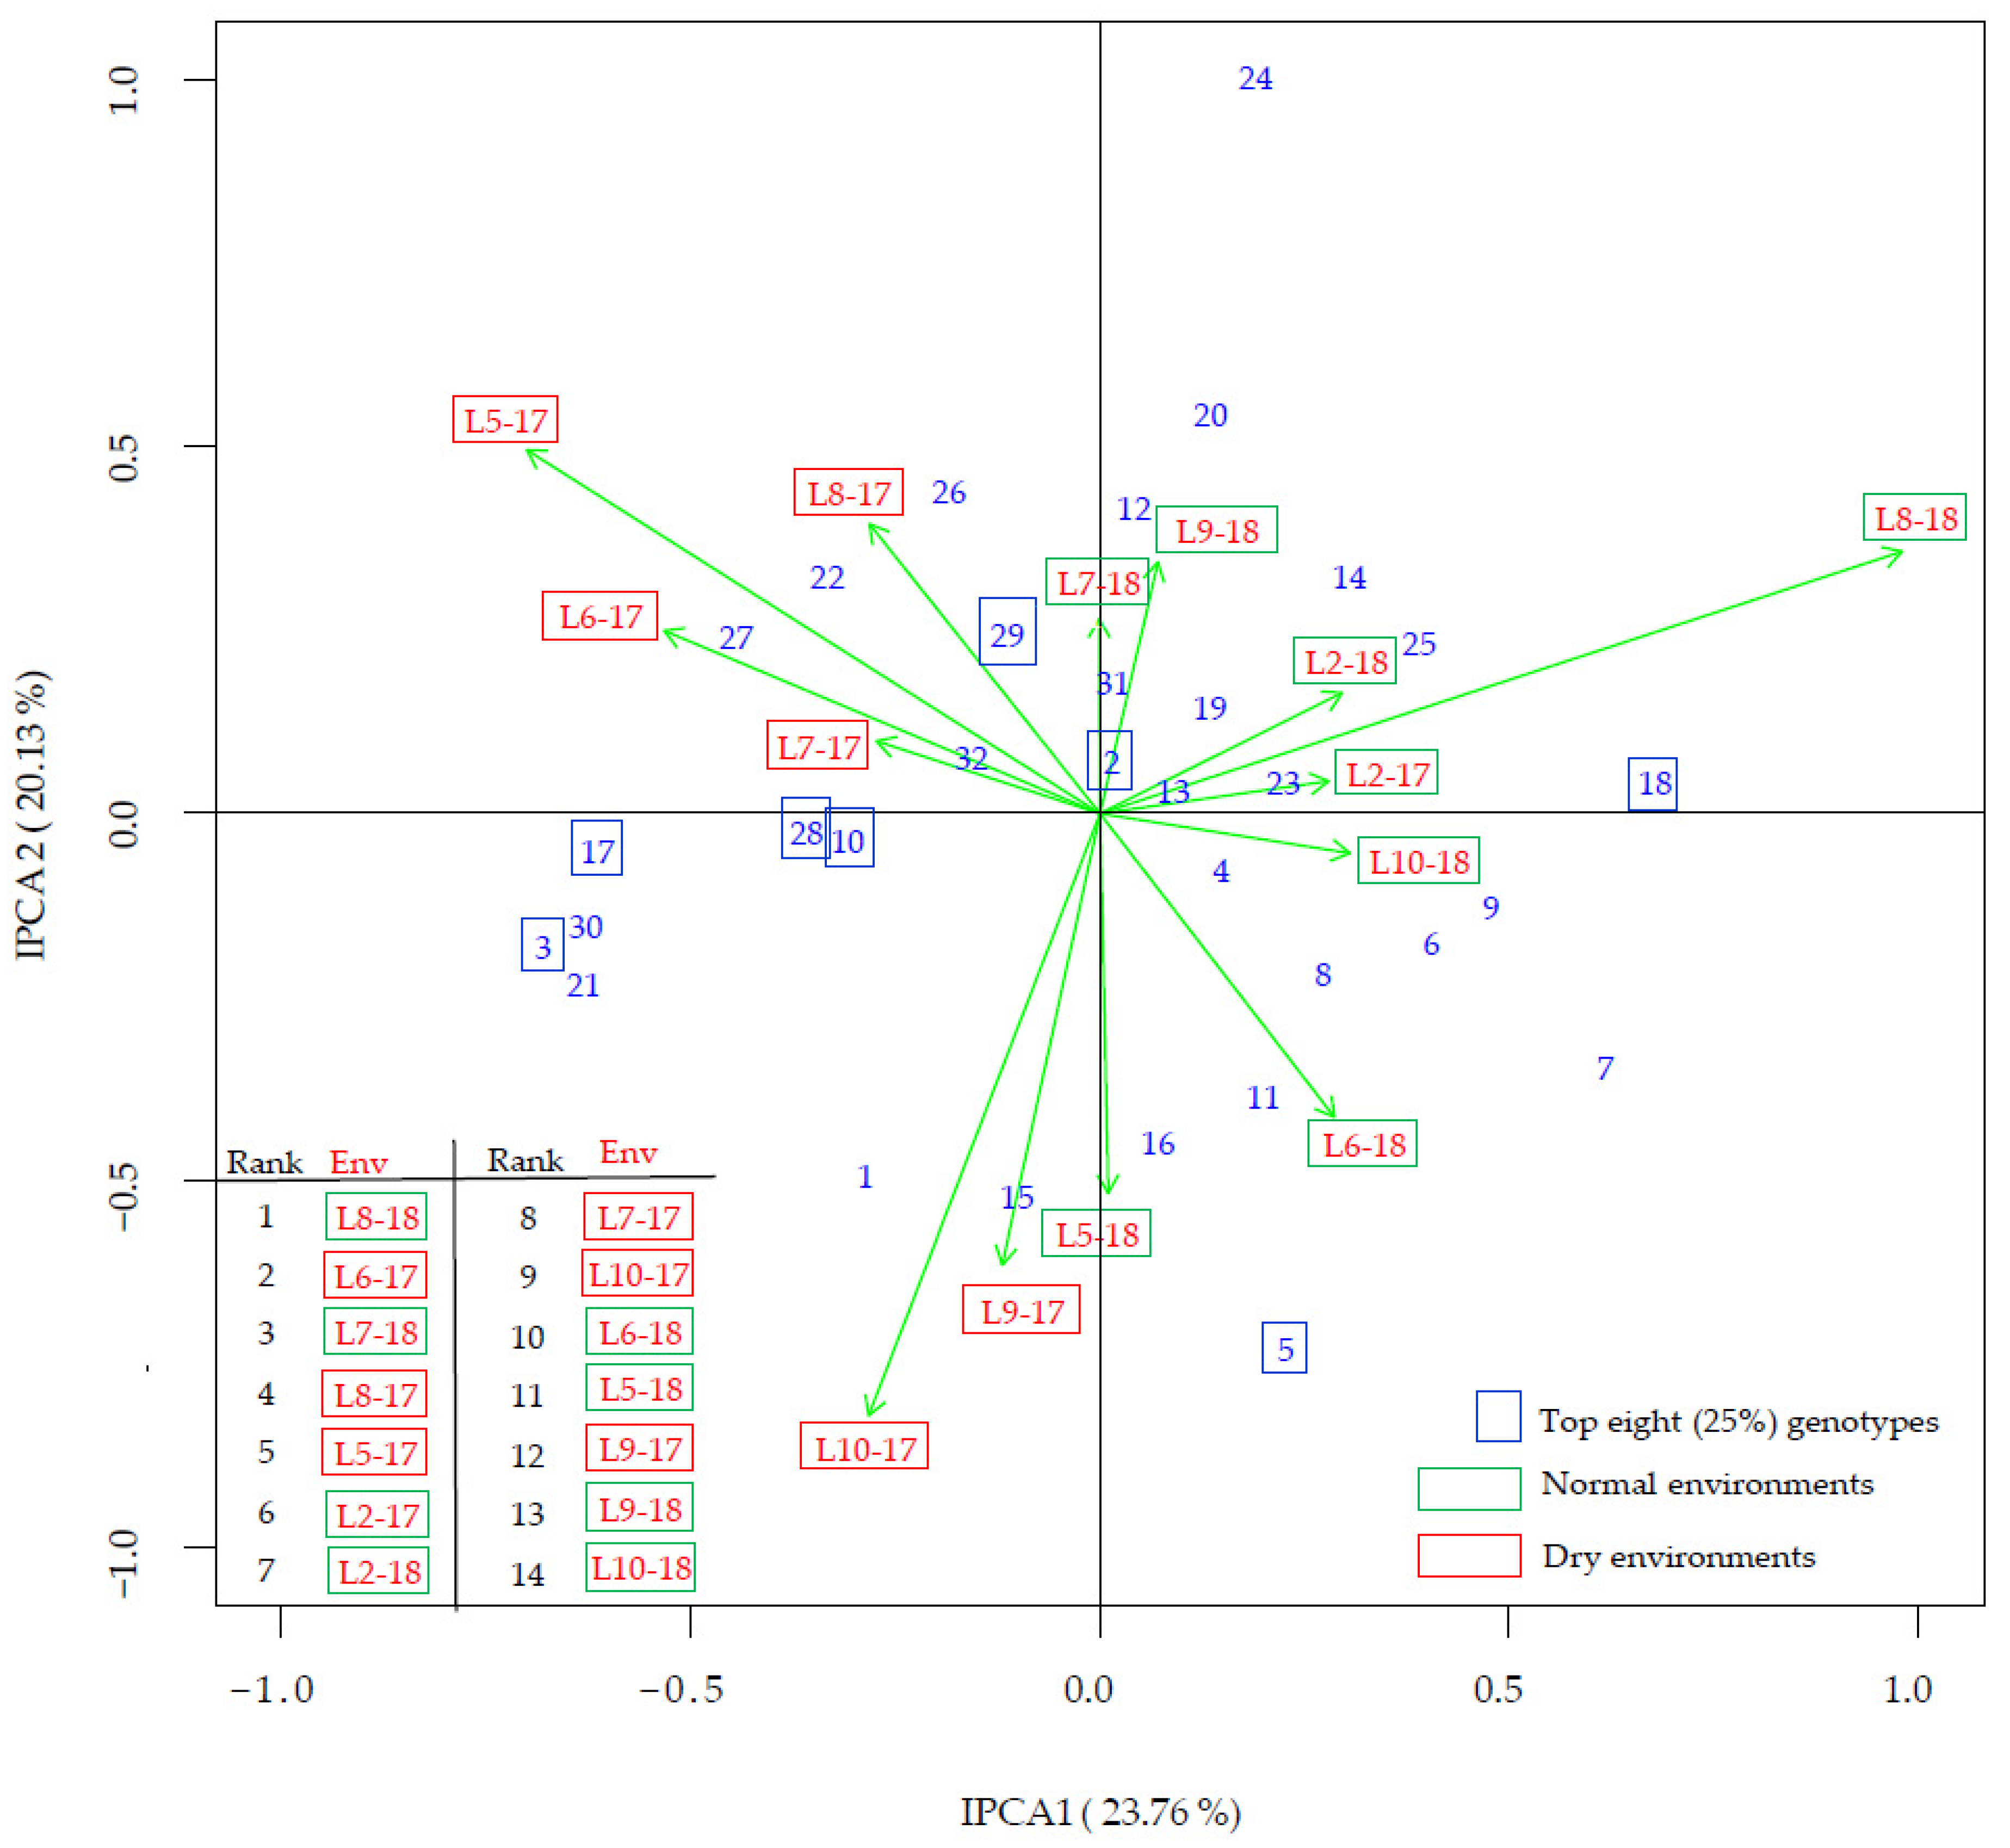
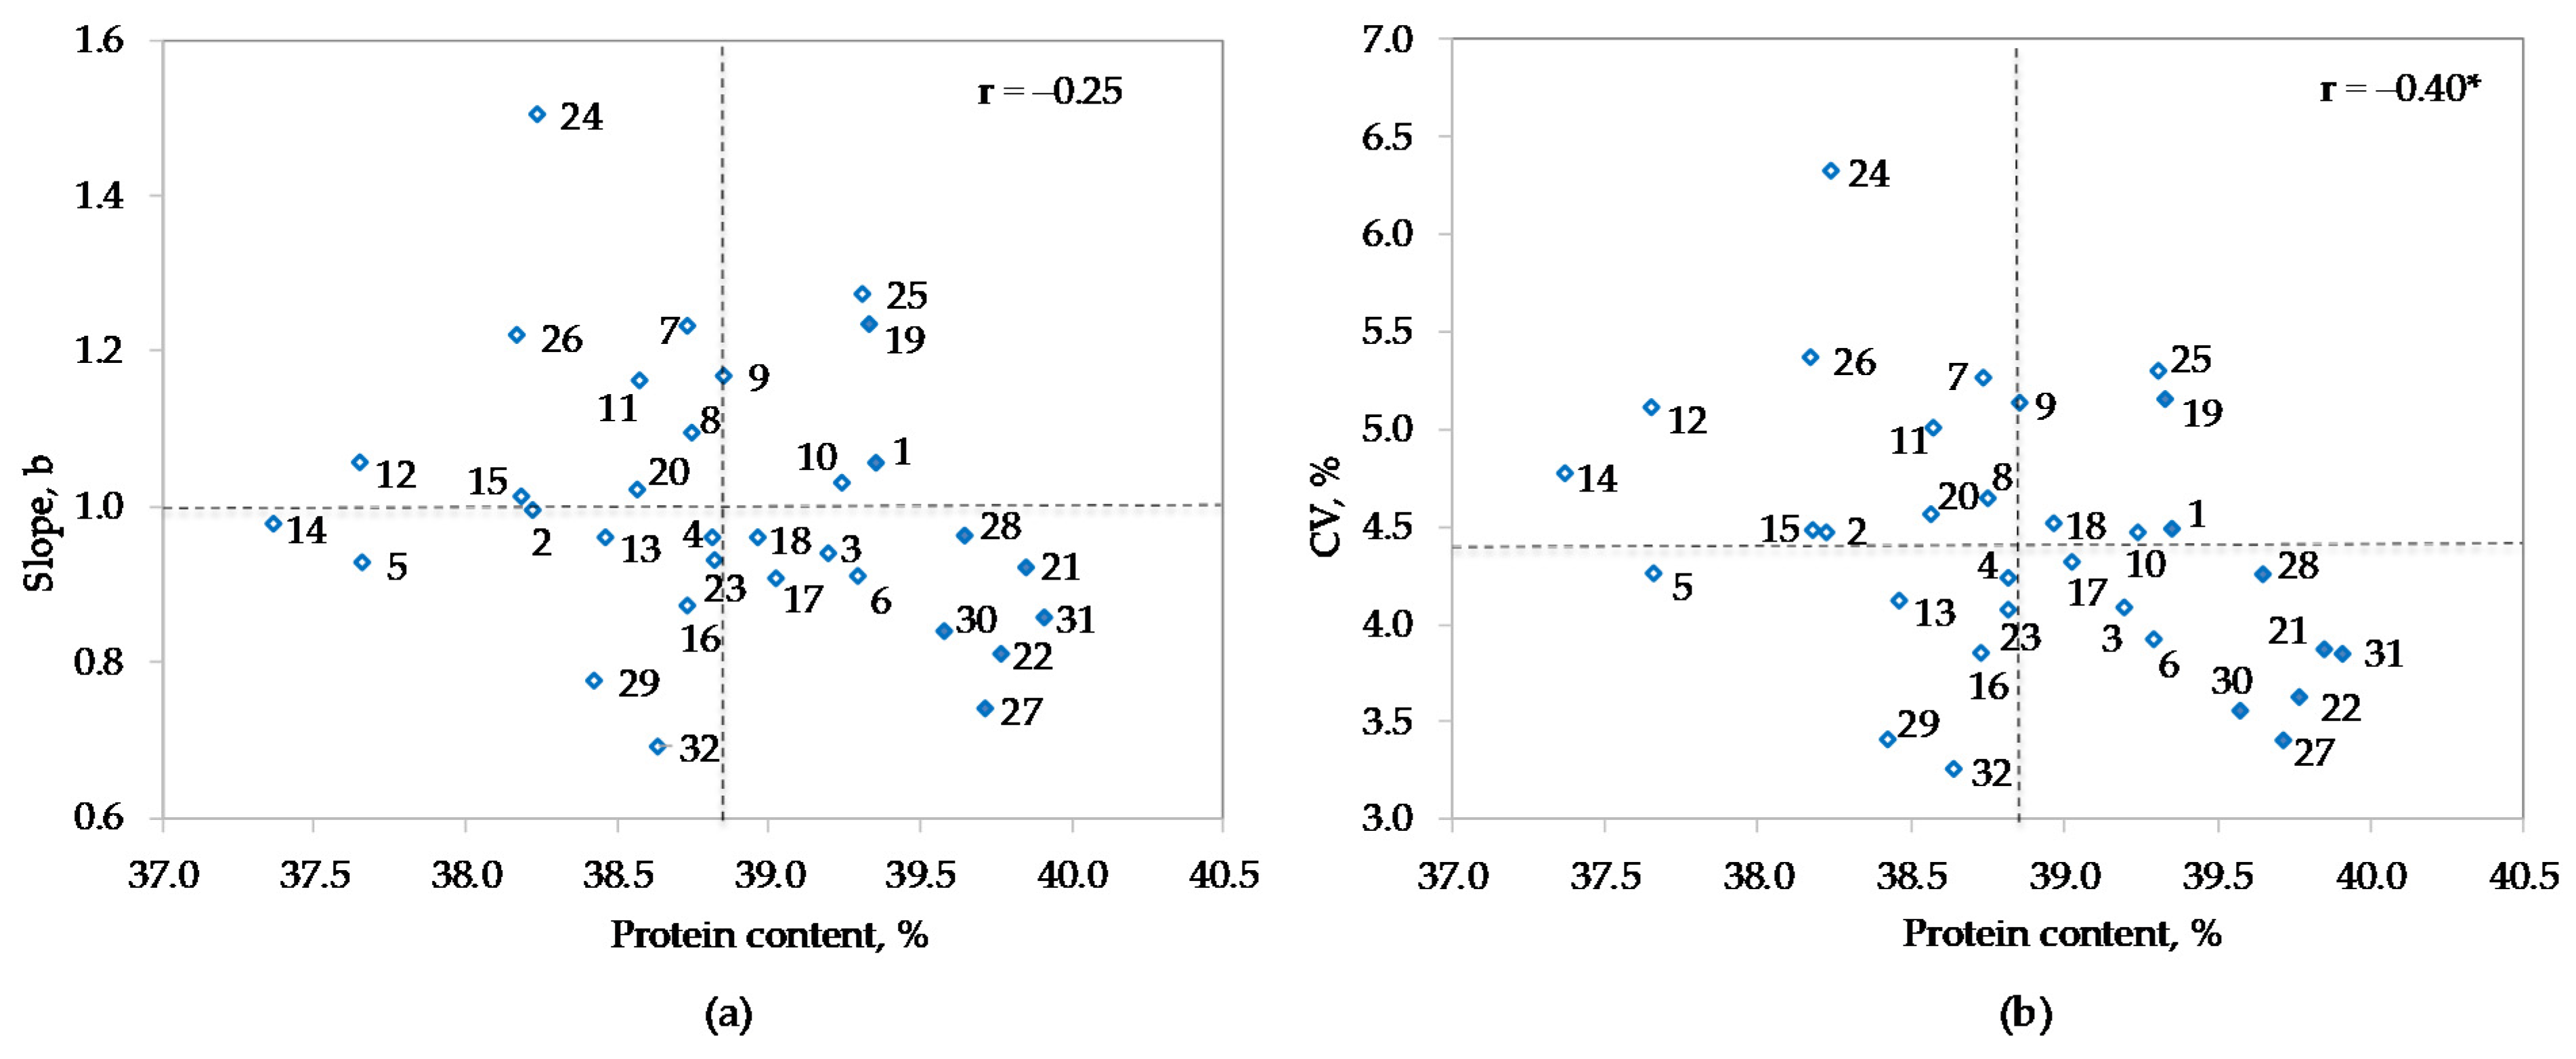
3.4. G × E Interaction

AMMI2 biplot for protein showing IPCA1 and IPCA2 scores for genotypes and environments is presented in Figure 2. A table showing the rank of the environments for protein content was added to the biplot. Within the biplot, genotypes and environments that are close to the origin are considered stable with a wide adaptation, whereas those farther from the origin can be considered unstable. The long environmental vector for L8-17 suggests that this environment is unstable and accounts for a large portion of the G × E interaction. On the other hand, the contribution of environments such as L5-18, L8-18, L10-18, and L9-17 to the total G × E interaction was the smallest and these environments can be considered stable. The majority of dry environments as well as the majority of normal environments were close to each other and showed a positive correlation as the angle between them was <90°. On the other hand, the two groups were negatively correlated as shown by the vectors with opposite signs (angle > 90°). Analysis of genotype response in the AMMI2 biplot (Figure 2) indicated that the top eight genotypes (with protein content in the first quartile) could be considered moderately stable (1, 21, 28, and 30) or very unstable (19, 22, 27 and 31). Three of them (21, 28, and 30) showed specific adaptation to environments with high protein content (L2-17 and L9-18), while three other genotypes (22, 27, 31) were located near L8-17, the environment with the lowest average protein content. Among the latter three genotypes adapted to the environment with the lowest protein content, genotype 31 (Merkur) ranked first across all 14 test environments, while genotypes 22 (Ema) and 27 (OS-4) ranked third and fourth, respectively.
Another interpretation of genotype stability for protein content can be considered by plotting together the mean protein content and two stability measures, the slope from linear regression analysis (b) and the coefficient of variation (CV) (Figure 3). The first biplot (Figure 3a) shows that most genotypes with the highest protein content had a slope below average (b < 1.0), indicating their good adaptation to low-protein (dry) environments. Similarly, most cultivars with the highest overall protein content had a below-average CV (Figure 3b), indicating low variation of the trait across environments and suggesting that these cultivars can also be considered stable according to the static concept of stability [60]. The relationship between mean protein content and stability parameters tended to be negative with Pearson correlation coefficients of −0.25 and −0.45 * for b and CV, respectively. In agreement with our results, Sudarić et al. [42] reported a significant negative correlation between the slope of the regression and the mean protein content of soybean genotypes across environments, also suggesting that the desirable characteristic of high protein genotypes is their good adaptation to low performing environments.
In the AMMI2 biplot for oil content (Figure 4), the environments were more scattered than it was in the case for protein content. Although some environments showed a positive correlation (the angle between them was <90°), they were less tightly grouped than for protein content. Nevertheless, the directions of vectors of normal environments were generally opposite to the directions of vectors of dry environments, indicating that they were negatively correlated. Long environmental vectors for L5-17, L10-17, and L8-18 classified these environments as unstable in contrast to L2-17, L7-17, and L7-18, which can be considered stable. Regarding genotype response, it is evident from the biplot that among the top eight genotypes (with the oil content in the first quartile), only one genotype (2) appears to be very stable showing wide adaptation, while the others are scattered in all directions. Among them, genotypes 10, 28, and 29 can be considered moderately stable and the remaining four (3, 5, 17, and 18) very unstable.
From the joint representation of mean oil content and slope from linear regression analysis (b), it can be seen that among the eight best performing genotypes, four genotypes (2, 3, 17, and 18) are better adapted to oil-rich environments (b > 1.0), three genotypes (5, 10 and 29) are better adapted to low-oil environments (b < 1.0), whereas genotype 28 (b = 1.0) can be considered highly responsive to changing environment and the most stable (Figure 5a). Similarly, the joint representation of the mean oil content and the coefficient of variation (CV), showed that of the eight best-performing genotypes, four genotypes (2, 3, 17, and 18) had above average static stability (above average CV), genotypes 5 and 28 had average static stability (CVs close to the overall average) and the remaining two genotypes (10 and 29) had above average static stability (below average CV) (Figure 5b). In general, no relationship was observed between mean oil content and stability parameters, with Pearson correlation coefficients close to zero (−0.06 and 0.12 for b and CV, respectively). On the contrary, Sudarić et al. [42] reported a significant negative correlation between the slope of the regression and the mean oil content of soybean genotypes across environments, indicating that the genotypes with high oil content were adapted to environments with low oil content.
Breeding line OS-5 (genotype 28) was the only genotype represented among the top 25% ranked genotypes for both protein and oil content (Table 5 and Table 6, Figure 2 and Figure 4), indicating that simultaneous improvement of both traits will be difficult to achieve through breeding. However, the correlation between protein and oil content across genotypes and environments was not significant within six dry environments (Figure 6a) and was weak negative within eight normal environments (Figure 6b). This suggests that the selection of breeding lines with improved one trait and an acceptable level of another trait is still feasible.
Although the negative correlation between oil content and protein content in soybean is well-documented [23,32,33,34,35,36], exceptions have also been reported. For example, in agreement with the present study, Piper and Boot [18] and Balešević-Tubić et al. [37] reported that the correlation between protein and oil concentration in soybean seed could vary depending on the environment, with lower values of correlation coefficients in environments with warmer temperatures. Similarly, Rotundo et al. [38] examined the relationship between seed protein and oil concentration over eight years in different U.S. states and regions and observed differences in the magnitude of the correlation. In their study, the correlation coefficients ranged from −0.39 to −0.58 across years and from −0.41 to −0.61 across regions. However, when looking at specific combinations of region and year, the authors reported a much wider range of correlation coefficients, with some region-year combinations showing no correlation between protein and oil content.

4. Conclusions

The present study, aimed at assessing the seed protein and oil content in soybean, included 32 elite genotypes and was conducted in 14 environments, including both dry and normal environments. Seed protein and oil contents varied over a wide range due to significant effects of genotype (G), environment (E), and G × E interaction. The proportion of total variation explained by the environment was 73.3% for protein content and 44.4% for oil content, indicating that protein content was more sensitive to environmental changes than oil content. The observed 4.5% decrease in protein content and 1.2% increase in oil content under dry compared to normal conditions suggests that special attention should be paid to seed protein content when breeding for a range of target environments with an expected higher frequency of drought. In addition, a decrease in protein content was observed in all genotypes under drought conditions, while the response of genotypes to drought in terms of oil content was inconsistent. The correlation between normal and dry environments was much higher for protein content than for oil content, suggesting that selection under normal conditions with the aim of creating new cultivars for normal and dry target environments would be more efficient for protein content than for oil content.
The observed relationship between maturity and seed protein content cannot be generalized, but rather considered to be associated with the specific set of genotypes and weather conditions during the two-year experiment, which is also consistent with some previous studies reporting conflicting results on this topic [41,58,59]. Based on the AMMI analysis, demonstrating the dynamic concept of stability, the majority of the best performing genotypes were found to be moderately stable or unstable for both protein and oil content. However, the stability of the genotypes for protein content, expressed as regression coefficient (b) and coefficient of variation (CV), was moderately to weakly negatively correlated with the mean performance of the genotypes, indicating their broad adaptability, including adaptation to low-protein environments and thus revealing their good drought tolerance. On the other hand, no correlation was observed between the two stability measures and the mean performance of the genotype for oil content, suggesting that simultaneous selection for mean performance and stability is also possible for oil content.
Although among the top five performing genotypes for protein and oil content in normal and dry environments, four genotypes were common for both groups of environments, only one genotype (breeding line OS-5) appeared among the top 25% ranking genotypes for both traits at the same time. Thus, simultaneous improvement of both traits to a top level through breeding would be extremely difficult to achieve. However, selection of breeding lines with improved one trait and an acceptable level of another trait would be feasible, considering that the correlation between protein and oil content in the present study was weak negative in normal environments and not significant in dry environments. Based on these results and some previous reports, it seems that simultaneous selection for protein and oil content should preferably be performed in favorable environments to avoid the undesirable effects of stress (drought and high temperatures) that mask the expression of the negative correlation between the two traits.

Supplementary Materials

The following supporting information can be downloaded at: https://www.mdpi.com/article/10.3390/agronomy12040915/s1, Table S1: Precipitation and air-temperature during three summer months across 14 tested environments (location-year combinations).

Author Contributions

Conceptualization, I.P. and H.Š.; methodology, H.Š., I.P., D.I. and J.G.; software, H.Š. and J.G.; validation, I.P., J.G. and M.R.; formal analysis, H.Š., D.I. and I.P.; investigation, Z.A., A.S., D.I., M.R., I.V., S.G., M.M. and D.S.; writing—original draft preparation, H.Š. and D.I.; writing—review and editing, Z.A., A.S. and J.G.; visualization, H.Š., Z.A. and D.I.; supervision, I.P.; funding acquisition, I.P. and A.S. All authors have read and agreed to the published version of the manuscript.

Funding

This research was funded by the Environmental Protection and Energy Efficiency Fund with the support of the Croatian Science Foundation of the Republic of Croatia (project AGRO-DROUGHT-ADAPT, PKP-2016-06-8290) and by the project KK.01.1.1.01.0005, Centre of Excellence for Biodiversity and Molecular Plant Breeding (CoE CroP-BioDiv), Zagreb, Croatia.

Institutional Review Board Statement

Not applicable.

Informed Consent Statement

Not applicable.

Data Availability Statement

The data presented in this study are available upon request from the corresponding author.

Conflicts of Interest

The authors declare no conflict of interest.

References

  1. FAO. FAOSTAT Stratistical Database Food and Agriculture Organization of the United Nations; FAO: Rome, Italy, 1997. [Google Scholar]
  2. Wang, S.; Liu, S.; Wang, J.; Yokosho, K.; Zhou, B.; Yu, Y.-C.; Liu, Z.; Frommer, W.B.; Ma, J.F.; Chen, L.-Q.; et al. Simultaneous changes in seed size, oil content and protein content driven by selection of SWEET homologues during soybean domestication. Natl. Sci. Rev. 2020, 7, 1776–1786. [Google Scholar] [CrossRef] [PubMed]
  3. USDA National Nutrient Database for Standard Reference, Release 28. Available online: https://www.ars.usda.gov/Services/docs.htm?docid=8964 (accessed on 13 May 2021).
  4. Prasad, P.; Anjali, P.; Sreedhar, R.V. Plant-based stearidonic acid as sustainable source of omega-3 fatty acid with functional outcomes on human health. Crit. Rev. Food Sci. Nutr. 2020, 61, 1725–1737. [Google Scholar] [CrossRef] [PubMed]
  5. Igiehon, N.O.; Babalola, O.O.; Cheseto, X.; Torto, B. Effects of rhizobia and arbuscular mycorrhizal fungi on yield, size distribution and fatty acid of soybean seeds grown under drought stress. Microbiol. Res. 2020, 242, 126640. [Google Scholar] [CrossRef]
  6. Lesk, C.; Rowhani, P.; Ramankutty, N. Influence of extreme weather disasters on global crop production. Nature 2016, 529, 84–87. [Google Scholar] [CrossRef]
  7. Fahad, S.; Bajwa, A.; Nazir, U.; Anjum, S.A.; Farooq, A.; Zohaib, A.; Sadia, S.; Nasim, W.; Adkins, S.; Saud, S.; et al. Crop Production under Drought and Heat Stress: Plant Responses and Management Options. Front. Plant Sci. 2017, 8, 1147. [Google Scholar] [CrossRef] [Green Version]
  8. Lamaoui, M.; Jemo, M.; Datla, R.; Bekkaoui, F. Heat and Drought Stresses in Crops and Approaches for Their Mitigation. Front. Chem. 2018, 6, 26. [Google Scholar] [CrossRef]
  9. UN Sustainable Developments Goals. 17 Goals to Transform Our World. Goal 13: Take Urgent Action to Combat Climate Change and Its Impacts. Available online: http://www.un.org/sustainabledevelopment/climate-change-2/ (accessed on 11 February 2021).
  10. Pandey, P.; Irulappan, V.; Bagavathiannan, M.V.; Senthil-Kumar, M. Impact of Combined Abiotic and Biotic Stresses on Plant Growth and Avenues for Crop Improvement by Exploiting Physio-morphological Traits. Front. Plant Sci. 2017, 8, 537. [Google Scholar] [CrossRef] [Green Version]
  11. Specht, J.E.; Hume, D.J.; Kumudini, S.V. Soybean Yield Potential-A Genetic and Physiological Perspective. Crop Sci. 1999, 39, 1560–1570. [Google Scholar] [CrossRef]
  12. Oya, T.; Nepomuceno, A.L.; Neumaier, N.; Farias, J.R.B.; Tobita, S.; Ito, O. Drought Tolerance Characteristics of Brazilian Soybean Cultivars—Evaluation and characterization of drought tolerance of various Brazilian soybean cultivars in the field—. Plant Prod. Sci. 2004, 7, 129–137. [Google Scholar] [CrossRef] [Green Version]
  13. Djanaguiraman, M.; Prasad, P.V.V.; Schapaugh, W.T. High Day- or Nighttime Temperature Alters Leaf Assimilation, Reproductive Success, and Phosphatidic Acid of Pollen Grain in Soybean [Glycine max (L.) Merr.]. Crop Sci. 2013, 53, 1594–1604. [Google Scholar] [CrossRef]
  14. Bhatia, V.S.; Jumrani, K. A maximin-minimax approach for classifying soybean genotypes for drought tolerance based on yield potential and loss. Plant Breed. 2016, 135, 691–700. [Google Scholar] [CrossRef]
  15. Cui, Y.; Jiang, S.; Jin, J.; Ning, S.; Feng, P. Quantitative assessment of soybean drought loss sensitivity at different growth stages based on S-shaped damage curve. Agric. Water Manag. 2019, 213, 821–832. [Google Scholar] [CrossRef]
  16. Yan, C.; Song, S.; Wang, W.; Wang, C.; Li, H.; Wang, F.; Li, S.; Sun, X. Screening diverse soybean genotypes for drought tolerance by membership function value based on multiple traits and drought-tolerant coefficient of yield. BMC Plant Biol. 2020, 20, 321. [Google Scholar] [CrossRef] [PubMed]
  17. Lindsey, L.; Thomison, P. High Temperature Effects on Corn and Soybean; The Ohio State University: Columbus, OH, USA, 2012. [Google Scholar]
  18. Piper, E.L.; Boote, K.J. Temperature and cultivar effects on soybean seed oil and protein concentrations. J. Am. Oil Chem. Soc. 1999, 76, 1233–1241. [Google Scholar] [CrossRef]
  19. Carrera, C.; Martínez, M.J.; Dardanelli, J.; Balzarini, M. Water Deficit Effect on the Relationship between Temperature during the Seed Fill Period and Soybean Seed Oil and Protein Concentrations. Crop Sci. 2009, 49, 990–998. [Google Scholar] [CrossRef]
  20. Mourtzinis, S.; Gaspar, A.P.; Naeve, S.L.; Conley, S.P. Planting Date, Maturity, and Temperature Effects on Soybean Seed Yield and Composition. Agron. J. 2017, 109, 2040–2049. [Google Scholar] [CrossRef] [Green Version]
  21. Dornbos, D.L.; Mullen, R.E. Soybean seed protein and oil contents and fatty acid composition adjustments by drought and temperature. J. Am. Oil Chem. Soc. 1992, 69, 228–231. [Google Scholar] [CrossRef]
  22. Vollmann, J.; Fritz, C.N.; Wagentristl, H.; Ruckenbauer, P. Environmental and Genetic Variation of Soybean Seed Protein Content under Central European Growing Conditions. J. Sci. Food Agric. 2000, 80, 1300–1306. [Google Scholar] [CrossRef]
  23. Kumar, V.; Rani, A.; Solanki, S.; Hussain, S.M. Influence of growing environment on the biochemical composition and physical characteristics of soybean seed. J. Food Compos. Anal. 2006, 19, 188–195. [Google Scholar] [CrossRef]
  24. Maestri, D.M.; Labuckas, D.O.; Meriles, J.M.; Lamarque, A.L.; Zygadlo, J.A.; Guzmán, C.A. Seed composition of soybean cultivars evaluated in different environmental regions. J. Sci. Food Agric. 1998, 77, 494–498. [Google Scholar] [CrossRef]
  25. Ren, C.; Bilyeu, K.D.; Beuselinck, P.R. Composition, Vigor, and Proteome of Mature Soybean Seeds Developed under High Temperature. Crop Sci. 2009, 49, 1010–1022. [Google Scholar] [CrossRef]
  26. Naeve, S.L.; Huerd, S.C. Year, Region, and Temperature Effects on the Quality of Minnesota’s Soybean Crop. Agron. J. 2008, 100, 690–695. [Google Scholar] [CrossRef]
  27. Specht, J.; Chase, K.; Macrander, M.; Graef, G.; Chung, J.; Markwell, J.; Germann, M.; Orf, J.; Lark, K. Soybean Response to Water: A QTL Analysis of Drought Tolerance. Crop Sci. 2001, 41, 493–509. [Google Scholar] [CrossRef]
  28. Yaklich, R.W.; Vinyard, B.T. A method to estimate soybean seed protein and oil concentration before harvest. J. Am. Oil Chem. Soc. 2004, 81, 1021–1027. [Google Scholar] [CrossRef]
  29. Song, W.; Yang, R.; Wu, T.; Wu, C.; Sun, S.; Zhang, S.; Jiang, B.; Tian, S.; Liu, X.; Han, T. Analyzing the Effects of Climate Factors on Soybean Protein, Oil Contents, and Composition by Extensive and High-Density Sampling in China. J. Agric. Food Chem. 2016, 64, 4121–4130. [Google Scholar] [CrossRef] [PubMed]
  30. Assefa, Y.; Purcell, L.C.; Salmeron, M.; Naeve, S.; Casteel, S.N.; Kovács, P.; Archontoulis, S.; Licht, M.; Below, F.; Kandel, H.; et al. Assessing Variation in US Soybean Seed Composition (Protein and Oil). Front. Plant Sci. 2019, 10, 298. [Google Scholar] [CrossRef] [PubMed]
  31. Ebellaloui, N.; Ebruns, H.A.; Abbas, H.K.; Emengistu, A.; Fisher, D.K.; Reddy, K.N. Agricultural practices altered soybean seed protein, oil, fatty acids, sugars, and minerals in the Midsouth USA. Front. Plant Sci. 2015, 6, 31. [Google Scholar] [CrossRef]
  32. Watanabe, I.; Nagasawa, T. Appearance and chemical composition of soybean seeds in germplasm collection of Japan. II. Correlation among protein, lipid and carbohydrate percentage. Jpn. J. Crop Sci. 1990, 59, 661–666. [Google Scholar] [CrossRef] [Green Version]
  33. Yan, W.; Rajcan, I. Biplot Analysis of Test Sites and Trait Relations of Soybean in Ontario. Crop Sci. 2002, 42, 11–20. [Google Scholar] [CrossRef]
  34. Wu, T.; Yang, X.; Sun, S.; Wang, C.; Wang, Y.; Jia, H.; Man, W.; Fu, L.; Song, W.; Wu, C.; et al. Temporal-Spatial Characterization of Seed Proteins and Oil in Widely Grown Soybean Cultivars across a Century of Breeding in China. Crop Sci. 2017, 57, 748–759. [Google Scholar] [CrossRef]
  35. Sobko, O.; Zikeli, S.; Claupein, W.; Gruber, S. Seed Yield, Seed Protein, Oil Content, and Agronomic Characteristics of Soybean (Glycine max L. Merrill) Depending on Different Seeding Systems and Cultivars in Germany. Agronomy 2020, 10, 1020. [Google Scholar] [CrossRef]
  36. Qin, P.; Song, W.; Yang, X.; Sun, S.; Zhou, X.; Yang, R.; Li, N.; Hou, W.; Wu, C.; Han, T.; et al. Regional Distribution of Protein and Oil Compositions of Soybean Cultivars in China. Crop Sci. 2014, 54, 1139–1146. [Google Scholar] [CrossRef]
  37. Balesevic-Tubic, S.; Djordjevic, V.; Miladinovic, J.; Djukic, V.; Tatic, M. Stability of soybean seed composition. Genetika 2011, 43, 217–227. [Google Scholar] [CrossRef]
  38. Rotundo, J.L.; Miller-Garvin, J.E.; Naeve, S.L. Regional and Temporal Variation in Soybean Seed Protein and Oil across the United States. Crop Sci. 2016, 56, 797–808. [Google Scholar] [CrossRef]
  39. Flajsman, M.; Santavec, I.; Kolmanic, A.; Kosmelj, K.; Kocjan-Acko, D. Agronomic performance and stability of seed, protein and oil yields of seven soybean cultivars determined in field experiments in Slovenia. Genetika 2019, 51, 31–46. [Google Scholar] [CrossRef] [Green Version]
  40. Yaklich, R.W.; Vinyard, B.; Camp, M.; Douglass, S. Analysis of Seed Protein and Oil from Soybean Northern and Southern Region Uniform Tests. Crop Sci. 2002, 42, 1504–1515. [Google Scholar] [CrossRef]
  41. Dardanelli, J.L.; Balzarini, M.; Martínez, M.J.; Cuniberti, M.; Resnik, S.; Ramunda, S.F.; Herrero, R.; Baigorri, H. Soybean Maturity Groups, Environments, and Their Interaction Define Mega-environments for Seed Composition in Argentina. Crop Sci. 2006, 46, 1939–1947. [Google Scholar] [CrossRef]
  42. Sudarić, A.; Šimić, D.; Vratarić, M. Characterization of genotype by environment interactions in soybean breeding programmes of southeast Europe. Plant Breed. 2006, 125, 191–194. [Google Scholar] [CrossRef]
  43. Hampango, M.; Cheelo, P.; Lungu, M.D.; Mwala, M.; Agrama, H. AMMI Determination of Stability for Oil and Protein Content in Soybean (Glycine max L. Merrill) Seed in Zambia. J. Exp. Agric. Int. 2017, 17, 1–16. [Google Scholar] [CrossRef]
  44. Obua, T.; Sserumaga, J.; Awio, B.; Nganga, F.; Odong, T.; Tukamuhabwa, P.; Tusiime, G.; Mukasa, S.; Nabasirye, M. Multi-Environmental Evaluation of Protein Content and Yield Stability among Tropical Soybean Genotypes Using GGE Biplot Analysis. Agronomy 2021, 11, 1265. [Google Scholar] [CrossRef]
  45. Pacheco, A.; Vargas, M.; Alvarado, G.; Rodriguez, F.; Lopez, M.; Crossa, J.; Burgueno, J. GEA-R (Genotype x Environment Analysis with R for Windows) Version 4.0; International Maize and Wheat Improvement Center (CIMMYT): Texcoco, Mexico, 2016. [Google Scholar]
  46. SAS Institute Inc. The SAS System for Windows, Release 9.4; Statistical Analysis Systems Institute: Cary, NC, USA, 2013; 556p. [Google Scholar]
  47. Finlay, K.W.; Wilkinson, G.N. The analysis of adaptation in a plant-breeding programme. Aust. J. Agric. Res. 1963, 14, 742–754. [Google Scholar] [CrossRef] [Green Version]
  48. Francis, T.R.; Kannenberg, L.W. Yield Stability Studies in Short-Season Maize. I. A Descriptive Method for Grouping Genotypes. Can. J. Plant Sci. 1978, 58, 1029–1034. [Google Scholar] [CrossRef]
  49. Pour-Aboughadareh, A.; Yousefian, M.; Moradkhani, H.; Poczai, P.; Siddique, K. STABILITYSOFT: A new online program to calculate parametric and non-parametric stability statistics for crop traits. Appl. Plant Sci. 2019, 7, e01211. [Google Scholar] [CrossRef] [PubMed]
  50. Vratarić, M.; Sudarić, A. Soja Glycine Max. (L.) Merr.; Poljoprivredni institut Osijek: Osijek, Croatia, 2008. [Google Scholar]
  51. Kranz, W.L.; Specht, J. NebGuide G1367; University of Nebraska-Lincoln Extension: Lincoln, NE, USA, 2012. [Google Scholar]
  52. Ruíz-Nogueira, B.; Boote, K.; Sau, F. Calibration and use of CROPGRO-soybean model for improving soybean management under rainfed conditions. Agric. Syst. 2001, 68, 151–173. [Google Scholar] [CrossRef]
  53. Sentelhas, P.C.; Battisti, R.; Câmara, G.M.S.; Farias, J.R.B.; Hampf, A.C.; Nendel, C. The soybean yield gap in Brazil—magnitude, causes and possible solutions for sustainable production. J. Agric. Sci. 2015, 153, 1394–1411. [Google Scholar] [CrossRef] [Green Version]
  54. Jug, D.; Jug, I.; Brozović, B.; Vukadinović, V.; Stipešević, B.; Đurđević, B. The role of conservation agriculture in mitigation and adaptation to climate change. Poljoprivreda 2018, 24, 35–44. [Google Scholar] [CrossRef]
  55. Vučetić, V. Impact of Climate Change on Agricultural Production. In Proceedings of the Agrometeorologija u službi korisnika: “Zaštita okoliša i poljoprivreda”, Zagreb, Croatia, 14 November 2013; pp. 1–2. [Google Scholar]
  56. Gurmu, F.; Mohammed, H.; Alemaw, G. Genotype X environment interactions and stability of soybean for grain yield and nutrition quality. Afr. Crop Sci. J. 2010, 17. [Google Scholar] [CrossRef]
  57. Malosetti, M.; Ribaut, J.-M.; van Eeuwijk, F.A. The statistical analysis of multi-environment data: Modeling genotype-by-environment interaction and its genetic basis. Front. Physiol. 2013, 4, 44. [Google Scholar] [CrossRef] [Green Version]
  58. Rod, K.S.; Shockley, J.; Knott, C.A. Seed yield, seed quality, profitability, and risk analysis among double crop soybean maturity groups and seeding rates. Agron. J. 2021, 113, 1792–1802. [Google Scholar] [CrossRef]
  59. Schmitz, P.; Kandel, H. Individual and Combined Effects of Planting Date, Seeding Rate, Relative Maturity, and Row Spacing on Soybean Yield. Agronomy 2021, 11, 605. [Google Scholar] [CrossRef]
  60. Becker, H.C.; Leon, J. Stability Analysis in Plant Breeding. Plant Breed. 1988, 101, 1–23. [Google Scholar] [CrossRef]
Figure 1. Heinrich Walter climate diagram for monthly precipitation and mean air temperature across environments during the vegetation period (April–September).
Agronomy 12 00915 g001
Figure 2. AMMI 2 biplot of 32 soybean genotypes evaluated in 14 environments (combination of seven locations with two cultivation years) for protein content.
Agronomy 12 00915 g002
Figure 3. Biplot of the mean protein content of 32 soybean genotypes and their respective slope, b from the regression analysis (a) and biplot of the mean protein content of 32 soybean genotypes and their respective coefficient of variation (CV) (b). Vertical and horizontal dashed lines represent means across genotypes for protein content and corresponding stability coefficient (b or CV), respectively. The top eight genotypes (with protein content in the first quartile) were shown as filled rectangles. * p < 0.05.
Agronomy 12 00915 g003
Figure 4. AMMI 2 biplot of 32 soybean genotypes tested in 14 environments (combination of seven locations with two cultivation years) for oil content.
Agronomy 12 00915 g004
Figure 5. Biplot of mean oil content of 32 soybean genotypes and their respective slope, b from the regression analysis (a) and mean protein content of 32 soybean genotypes and their respective coefficient of variation (CV) (b). Vertical and horizontal dashed lines represent means across genotypes for oil content and corresponding stability coefficient (b or CV), respectively. The top eight genotypes (with oil content in the first quartile) were shown as filled rectangles.
Agronomy 12 00915 g005
Figure 6. Correlation between protein and oil content (a) over 32 genotypes and six dry environments; (b) over 32 genotypes and eight normal environments. ** for significance.
Agronomy 12 00915 g006
Table 1. List of soybean genotypes used in field experiments and lab analyses.
CodeGenotypeMaturity GroupGenotype StatusCodeGenotypeMaturity GroupGenotype Status
1Zlata0–Icultivar17Buga0cultivar
2Ružica0–Icultivar18Gabriela00–0cultivar
3ZagrebčankaIcultivar19Sanda0cultivar
4Pedro0–Icultivar20Sonja0cultivar
5Bahia0–Icultivar21Toma0cultivar
6AscasubiIcultivar22Ema00–0cultivar
7Ika0–Icultivar23Korana00–0cultivar
8OS Zora0–Icultivar24Lucija0cultivar
9Tena0–Icultivar25OS-10breeding line
10Sara0–Icultivar26OS-200–0breeding line
11SekaIcultivar27OS-400–0breeding line
12TisaIcultivar28OS-50breeding line
13OS-30–Ibreeding line29OS-60breeding line
14OS-80–Ibreeding line30OS-700–0breeding line
15DH 5170Icultivar31Merkur0cultivar
16Galina0cultivar32Xonia0cultivar
Table 2. List of locations for field experiments and sowing and harvest time for both years.
Location CodeLocation NameGeo-DMS NorthGeo-DMS East20172018
SowingHarvestSowingHarvest
L2Šašinovec45°51′09.7″ N16°10′49.4″ E2 May 2 October30 April4 October
L5Osijek45°32′11.7″ N18°44′28.1″ E27 April30 September20 April20 September
L6Feričanci45°31′50.7″ N17°59′22.0″ E11 May3 October27 April4 October
L7Đurići44°52′29.5″ N18°54′51.3″ E3 May15 September21 April19 September
L8Popovac45°48′09.4″ N18°39′08.9″ E27 April11 September23 April19 September
L9Tovarnik45°10′17.0″ N19°08′25.6″ E11 April15 September17 April20 September
L10Kutjevo45°24′28.0″ N17°53′18.1″ E26 April13 September19 April21 September
Table 3. AMMI analysis of variance for protein and oil content of 32 soybean genotypes over 14 environments including the first two interaction principal component axes (IPCAs).
Source of VariationSS%Cum%DFMSFPROBF
Protein content (%)
ENV (E)4197.7273.3173.3113322.90310.550.00
GEN (G)751.0313.1286.433124.2323.300.00
G × E777.1613.57100.004031.931.850.00
IPCA1219.5228.2528.25435.114.910.00
IPCA2131.6816.9445.19413.213.090.00
Oil content (%)
ENV (E)360.5044.4444.441327.7376.910.00
GEN (G)197.4524.3468.78316.3717.660.00
G × E253.3031.22100.004030.631.740.00
IPCA160.3023.8123.81431.403.920.00
IPCA250.1519.8043.61411.223.420.00
SS—sum of squares; %—percentage contribution of ENV, GEN, and G × E to the treatment sum of squares and percentage contribution of IPCA1 and IPCA2 refer to the G × E sum of squares; Cum%—cumulative percentage contribution of ENV, GEN and G × E to the treatment sum of squares and cumulative percentage contribution of IPCA1 and IPCA2 to the G × E sum of squares; MS—mean square; DF—degrees of freedom; F—F value; PROBF—significance of F.
Table 4. Mean protein and oil contents of 32 soybean genotypes at seven locations in 2017 and 2018 growing seasons.
LocationYearDiff 1Diff (%) 2
Protein content (%)
2017 2018
ŠašinovecN40.52a 3N39.16c1.36*3.5
OsijekD39.58cN40.22ab−0.64*−1.7
FeričanciD38.38dN40.16ab−1.78*−4.7
ĐurićiD39.18cN40.11ab−0.93*−2.5
PopovacD35.09gN37.05f−1.96*−5.6
TovarnikD37.74eN40.07b−2.33*−6.1
KutjevoD37.05fN39.53c−2.48*−6.6
Mean 38.22 39.47 −1.25*−3.3
Oil content (%)
2017 2018
ŠašinovecN20.37cdN20.36cd0.01ns0.1
OsijekD20.53bcN19.84fg0.69*3.5
FeričanciD20.81aN20.01ef0.80*4.0
ĐurićiD20.32cdN20.74ab−0.41*−2.0
PopovacD20.63abN20.84a−0.21ns−1.0
TovarnikD19.82fgN19.70g0.13ns0.6
KutjevoD20.22deN19.28h0.95*4.9
Mean 20.39 20.11 0.28*1.4
N—normal environment, D—dry environment; 1 Diff—difference between years within locations in actual units, 2 Diff (%)—difference between years within locations in percentage of 2018, 3 differences among environments (location × year combinations) followed by the same letter are not significantly different at p < 0.05 according to Tukey HSD test; * and ns—the difference between years significant at p < 0.05 and non-significant, respectively.
Table 5. Mean protein content (%) of 32 soybean genotypes across all, normal and dry environments with the corresponding ranks within each group of environments. Genotypes are presented in descending order based on their mean values across all environments.
Genotype (Code)Maturity GroupAll
Env
RankNormal EnvRankDry EnvRankDiff 1Diff (%) 2
Merkur (31)039.91140.68238.893−1.79−4.4
Toma (21)039.85240.70138.734−1.97−4.8
Ema (22)00−039.77340.24539.131−1.11−2.8
OS-4 (27)00−039.72440.22739.052−1.16−2.9
OS-5 (28)039.65540.59338.408−2.19−5.4
OS-7 (30)00−039.58640.38438.525−1.86−4.6
Zlata (1)0−I39.36740.24638.1812−2.06−5.1
Sanda (19)039.33840.17938.2110−1.96−4.9
OS-1 (25)039.31940.19838.1413−2.05−5.1
Ascasubi (6)I39.291039.871438.516−1.36−3.4
Sara (10)0−I39.241140.011138.2011−1.81−4.5
Zagrepčanka (3)I39.201240.081038.016−2.07−5.2
Buga (17)039.031339.591738.289−1.31−3.3
Gabriela (18)00−038.961439.352238.457−0.89−2.3
Tena (9)0−I38.851540.011237.3024−2.71−6.8
Korana (23)00−038.821639.372038.0815−1.29−3.3
Pedro (4)0−I38.821739.581837.8118−1.77−4.5
OS Zora (8)0−I38.751839.801537.3423−2.46−6.2
Ika (7)0−I38.731939.931337.1425−2.79−7.0
Galina (16)038.732039.352137.9017−1.46−3.7
Xonia (32)038.642139.042638.1014−0.95−2.4
Seka (11)I38.572239.661637.1326−2.53−6.4
Sonja (20)038.572339.172537.7620−1.41−3.6
OS-3 (13)0−I38.462439.252337.4022−1.85−4.7
OS-6 (29)038.432538.922837.7719−1.14−2.9
Lucija (24)038.242639.431936.6431−2.79−7.1
Ružica (2)0−I38.222738.812937.4521−1.36−3.5
DH 5170 (15)I38.182839.252436.7630−2.49−6.3
OS-2 (26)00−038.172938.982737.0827−1.90−4.9
Bahia (5)0−I37.663038.153137.0028−1.15−3.0
Tisa (12)I37.653138.293036.8029−1.49−3.9
OS-8 (14)0−I37.373237.993236.5332−1.46−3.8
Mean 38.84 39.60 37.83 −1.77 *−4.5
All env—all 14 environments; Normal env—8 normal environments, Dry env—6 dry environments; 1 Diff.—difference between dry and normal environments in actual units, 2 Diff (%)—difference between dry and normal environments in percentage of the normal environment; *—the difference between means of dry and normal environments is significant at p < 0.05 according to Tukey HSD test.
Table 6. Mean oil content (%) of 32 soybean genotypes across all, normal and dry environments with the corresponding ranks within each group of environments. Genotypes are presented in descending order based on their mean values across all environments.
Genotype (Code)Maturity GroupAll
Env
RankNormal EnvRankDry EnvRankDiff 1Diff (%) 2
Sara (10)0−I21.01120.81221.2910.492.3
Bahia (5)0−I20.92220.83121.0540.221.0
OS-5 (28)020.72320.41521.1330.723.5
Gabriela (18)00−020.66420.75320.5410−0.20−1.0
Zagrepčanka (3)I20.65520.261321.1820.914.5
Buga (17)020.62620.33921.0050.673.3
Ružica (2)0−I20.52720.33820.7760.432.1
OS-6 (29)020.51820.42420.6480.221.1
Xonia (32)020.36920.231420.53110.301.5
DH 5170 (15)I20.321020.071920.6570.582.9
Sonja (20)020.311120.311020.33170.020.1
OS Zora (8)0−I20.311220.291120.33180.030.2
OS-8 (14)0−I20.301320.36620.2220−0.14−0.7
Ika (7)0−I20.231420.34720.0826−0.27−1.3
Toma (21)020.221520.052020.44140.391.9
OS-1 (25)020.161620.181520.1424−0.04−0.2
Merkur (31)020.161720.081820.26190.180.9
Tena (9)0−I20.161820.271220.0029−0.27−1.3
Seka (11)I20.161920.141620.18210.050.2
Ema (22)00-020.142019.882620.50120.623.1
Zlata (1)0−I20.132119.962320.36160.402.0
OS-2 (26)00−020.132219.912520.41150.502.5
OS-7 (30)00−020.122319.733020.6390.894.5
OS-4 (27)00−020.122419.872720.44130.572.9
Galina (16)020.112520.081720.15230.060.3
Lucija (24)020.072620.042120.11250.080.4
Tisa (12)I20.072719.992220.17220.190.9
Sanda (19)020.002819.952420.08270.130.6
OS-3 (13)0−I19.862919.742920.03280.291.5
Ascasubi (6)I19.763019.772819.7530−0.02−0.1
Pedro (4)0−I19.693119.673119.72310.050.3
Korana (23)00−019.433219.503219.3332−0.17−0.9
Mean 20.25 20.14 20.39 0.25 *1.2
All env—all 14 environments; Normal env—8 normal environments, Dry env—6 dry environments; 1 Diff.—difference between dry and normal environments in actual units, 2 Diff (%)-difference between dry and normal environments in the percentage of the normal environment; *—the difference between means of dry and normal environments is significant at p < 0.05 according to Tukey HSD test.
Publisher’s Note: MDPI stays neutral with regard to jurisdictional claims in published maps and institutional affiliations.

