Article

The Assessment of the Bioeconomy and Biomass Sectors in Central and Eastern European Countries

Faculty of Management and Rural Development, University of Agronomic Sciences and Veterinary Medicine of Bucharest, 59 Mărăști Boulevard, 011464 Bucharest, Romania
*
Author to whom correspondence should be addressed.
Agronomy 2022, 12(4), 880; https://doi.org/10.3390/agronomy12040880
Submission received: 26 February 2022 / Revised: 1 April 2022 / Accepted: 3 April 2022 / Published: 5 April 2022
(This article belongs to the Special Issue Circular Economy and Sustainable Development in Agriculture)

Abstract

:
Since the enlargement of the European Union, the CEE (Central and Eastern European) countries have brought a larger share of agricultural and forest land with high potential for biomass and bioenergy. The progress of bioeconomy is intercorrelated with the dimension of agriculture, which is the major provider of biomass for food and feed and for other bio-based industries. This research aims to assess the dimension of agriculture-based and food-based bioeconomy, with focus on the production and use of biomass. Conducted over the 2008–2019 period with data from the EU and OECD, the study pointed out the role of CEE countries in the European bioeconomy. Thus, we estimated that the bioeconomy market reached, in 2019, a turnover of almost EUR 324 billion (around 14% of the EU level), respectively, EUR 79 billion from agriculture-based sectors and EUR 116.8 billion from food-based sectors. The number of employees has decreased; in 2019, in bioeconomy sectors were employed 6.9 million people (almost 40% of the EU bioeconomy employment). Regarding the production of biomass, the study has revealed an increase of the share in EU production from 25.7% in 2008 to 27.8% in 2019, due to a growth of biomass by 7.1%. With this study, we emphasize the need to support more sustainable demand of biomass and to make the bioeconomy market more competitive. In addition, we point out several problems of the bioeconomy sector, such as insufficient data, low productivity, and the unused or underused sources of biomass.

1. Introduction

In a world with a continuously growing demand for food and feed and a real competition between food, feed, and fuel for biomass, the development of bioeconomy depends on the biophysical boundaries [1]. In the last decade it was estimated that 40% of crop land is used to produce feeds, including cereals for humans [2], 30% to produce cereals for livestock feed, and 13% to produce biofuels and textiles [3]. The bioeconomy development is intercorrelated with the changes in agriculture supply and the quantity of biomass which can be produced by this sector. From this perspective, the future of bioeconomy depends on the opportunities and challenges rising from biomass usage and food supply.
When referring to bioeconomy, we mainly think of agriculture and food production, but it relates also to the material, pharmaceutical, industrial, and other sectors. Basically, “the bioeconomy encompasses the production of renewable biological resources and the conversion of these resources and waste streams into value-added products, such as food, feed, bio-based products and bioenergy” [4], but this concept covers the sectors of agriculture, forestry, fisheries, food, and pulp and paper production, as well as parts of chemical, biotechnological, and energy industries, and has powerful innovation potential.
The bioeconomy is a quite recent and emergent field of research and the related glob-al literature shows mixed approaches. Hence, there were authors [5] that tackled the USA (United States of America) policies related to the bioenergy crop adoption of such conservation compliance or subsidies and tax systems. Another study [6] examined competitiveness of different regions of the world and analyzed the output growth of the sector, including during the period of financial crisis, and another [7] focused on renewable energy and explored the connection between biomass and genetically modified crops. Meanwhile, there were papers [8] that explored the bundle between fossil-based industry taxation and measures of sustainable bioeconomy. There were also articles considering the replacement of fossil-based fuels and plastics by bio-based products, especially in the heavily polluted industrial areas [9,10,11]. We also found several papers regarding China biotechnology (BT) and bio-industry sectors [12,13,14], which mainly considered that half of the world’s innovations in the field are patented there (1.54 million patent applications, [15]). In Latin America, the approaches evolved around the link between biological diversity and bioeconomy [16], the link between biomass and circular economy [17], or the necessity to introduce policies to support new markets’ development and biosafety regulations [18].
The bioeconomy, via its component sectors, produces and manages biological resources from different sources such as agriculture, food, forest, fisheries, and other bio-based industries. From all these sectors, the agriculture remains the base for the future sustainable development [19], while the agriculture-based bioeconomy is continuing to evolve. In the context of this complex mixture between the need to assure the human consumption and the need to reduce food losses and food waste by recycling, there is an obvious necessity to assess the dimension of this sector and the trends in its evolution. First of all, it is well known that agriculture contributes to the development of bioeconomy with feedstocks formed by “(1) waste streams; (2) industrial uses of existing crops; (3) crop residues; and (4) dedicated bioeconomy crops. These feedstocks compete with biomass from other resource sectors, including woody and aquatic biomass, municipal and industrial organic wastes and more recently, CO2” [20]. The above information underlines the idea that agriculture contributes to bioeconomy formation especially with energy crops and residues. Agriculture residues include crop-based (straw, maize stover, grass cuttings, seed husks, residues from oilseeds, etc.) and animal-based products (animal excrements, manure, and slurry). Overall, it is estimated that the agricultural residues are composed of around 45% straw residues, 43% manure residues, 4% cutting grass, and 8% other agricultural residues. Moreover, crop residues are estimated to be formed in proportion of 41% of wheat straw, 21% of sugar beet residues, 14% barley straw, 10% of maize stover, 4% rye residues, and 10% other agricultural residues [21]. However, scientific literature indicates that the main sources of residues remain straw and stover from grain crops (wheat, barley, and maize), but also that around 70% of crops residues are not used in economy as biomass and that unused residues are composed of 71% of cereal residues and 16% of oilseeds residues [22].
The approach of the bioeconomy is one with complex implications. Concerning this, for instance, to switch between non-renewable resources, “which made the extraction rate of natural resources increased by 113% since 1990, leading to overexploitation and generation of vast amounts of waste, involving that certain management policies and approaches, such as the strategy of a circular economy or bioeconomy, to be oriented towards sustainable production and consumption”. The results of this paper state that with the regulatory framework, promoting and prioritizing the circularity of agricultural waste, there are opportunities for improving the current waste management model [23]. The new trend of the digitization is also present in the specific literature. In that sense, there were papers that introduced a collection of information and communications technologies (ICT), Internet of Things (IoT), and Industry 4.0 technologies utilized in biomass supply chains. These kinds of technologies have been conducted by “means of direct interactions with bioeconomy stakeholders and technology providers, analysis of the reports from bioeconomy-related projects, literature” [24]. The appropriate literature also indicated that there was a special focus on “the sustainable valorization of food industry by-products, plant biomass, animal manure and the Organic Fraction of Municipal Solid Waste (OFMSW)”, where the aim of the study was to assess the usefulness of biowaste deriving from circular bioeconomy (CBE) processes, for which it obtained interesting results using potted plants in nursery activity [25]. There are some other references. One very real approach has been focused on smart technologies, stating that farming faces challenges that increase the adverse effects on farms’ economics, labor, and on the environment, and in this sense, smart farming technologies (SFTs) are expected to assist in reverting this situation [26].
The agricultural research refers also to medicinal plants. In order to respond adequately to the increased demands of the global market and to guarantee environmental sustainability of the productions, one of the applications used is the temporary immersion system (TIS), which produces biomass and bioactive compounds from medicinal plants [27]. The non-food sector is also related to the biomass field, in some cases by a substitute for petroleum-based materials, such as expanded polystyrene (EPS). In this sense, the researchers have interchanged the EPS with the cup plant (Silphium perfoliatum L.) biomass. Cup plant is a high-yielding biomass plant with several ecological benefits and is currently mainly used for biogas production [28]. On the other hand, starting from a number of articles and using meta-analysis, several researchers were interested in biodegradable alternatives to petroleum-based polyethylene mulch film (PEM) and considered that growers that indicate limited knowledge about biodegradable mulch films (BDMs) are a significant barrier to accepting it and that the inconsistence performance of the results relative to PEM may be contributing to the perceived knowledge gap [29]. Counting the usages in food and non-food sector and the need to reach sustainable bioeconomy and global food security, the emerging bioeconomy will enhance the need for plant biomass, by using a third generation of bioenergy crops or biomass crops, which must be able to produce both food and raw materials and will be capable to increase the sustainability of agriculture [30]. The statements presented above underline the idea that the development of bioeconomy will place a real pressure on the biomass resources and especially on the producers of biomass. An investigation of the bioeconomy’s structure by main producer countries and by type of usage can offer a better understanding of the bioeconomic sectors and on the dynamics of change in the market.
The focus of our paper was on ten selected CEE (Central and Eastern European) countries: Bulgaria, Czech Republic, Estonia, Hungary, Latvia, Lithuania, Poland, Romania, Slovakia, and Slovenia, due to the importance of these European regions in the EU bioeconomy field. In the majority of these countries, the cereals represent around 40–50% of agricultural utilized land. They are also important producers of green plants (grasses, leguminous plants, etc.), potatoes, sugar beet, etc. In 2019, according to the Eurostat database, the cultivated area with cereals in the selected CEE countries reached 20.6 million ha (about 38.4% from EU-27 level of 53.7 million ha). These countries obtain 36.1% of the EU-27 production, respectively, around 108 million tons. Compared to EU-27, the analyzed CEE countries cultivated 49% from the area with rape, turnip rape, sunflower seeds, and soya (2.5 million ha), around 34% from the surface with potatoes and leguminous (0.6 million ha), plants harvested green (1.4 million ha), and around 28% from the surface cultivated with sugar beet. Still, these yields are under the European averages, reaching, for example, a level between 60–80% for cereals in countries such as Poland, Slovenia, Estonia, and Latvia (in EU-27, the average yield for cereals is 5.58 tons/ha). Thus, even if the yields are lower than in other European countries, the biomass has higher levels, due to their natural conditions and the traditional role of agriculture in the development of the local economies. Yet, the biomass potential is unused or underutilized, the links on the bioeconomy chains are interrupted, and the biomass is used in a traditional manner (burned or used as soil amendment), and this is because the bio-based industries are not well developed [31]. However, the analyzed CEE countries, due to their specific agricultural profile described above, provide over 28% of the quantity of biomass from EU-27, almost 27% being biomass for food and feed. These figures reveal the importance of the European central and eastern regions to the EU-27 economy and especially to the bioeconomy sectors.
Therefore, identifying these strong and weak points in the sector, the main objective of this paper was to assess the dimension of agriculture-based and food-based bioeconomy through an extensive analysis of the bioeconomy market in the selected CEE countries (as important producers and exporters of biomass) and their further evolution after EU enlargement, during the 2008–2019 period.
In this context, our main research questions were focused on the following: (a) How big is the share of selected CEE countries in EU bioeconomy? (b) How evolved is the role and importance in the sector of the analyzed CEE countries a decade after joining the EU? What is the size of biomass market starting from the main indicators (production, consume, imports, and exports), and how have they evolved during the 2008–2019 period?

2. Materials and Methods

The methodology which supports this paper was framed within the dynamics, structural, and trend analysis, and it was based on the review of recent literature and on the indicators published in the dedicated databases: Data-Modeling platform (DataM) of resource economics and OECD (Organisation for Economic Co-operation and Development) statistics.
For the first part of the study we used the indicators from the DataM. These are the following: number of persons employed (defined as the total number of persons who work in the observation unit), location quotient (LQ), which is the employment share in the bioeconomy of a Member State total, divided by the employment share in the EU bioeconomy of the EU total. LQ is a way of quantifying how “concentrated” the bioeconomy is in a Member State compared to the European Union. The turnover (in EUR million) is another indicator used in the paper, which comprises the totals invoiced by the observation unit during the reference period. The value added (in EUR million) refers to the value added at factor costs; it is the gross income from operating activities after adjusting for operating subsidies and indirect taxes.
From the second database (OECD.Stat), we used the following indicators: domestic extraction used (DEU), which refers to the flows of raw materials extracted or harvested from the environment and that physically enter the economic system for further processing or direct consumption. The imports (IMP) and exports (EXP), which are major components of the direct material flow indicators DMI and DMC. The domestic material consumption (DMC) refers to the amount of materials directly used in an economy and it is computed as DEU minus exports plus imports. The domestic material input (DMI) is computed as DEU plus imports.
Regarding the availability of data in EU member states, we noticed a relative limitation, since the last available data are delayed compared with other statistical resources. At present, both databases used (DataM tool and OECD.Stat) offer data up to the year 2019 and for some countries (such as Hungary) several data are not available, whereas for some countries they are estimated only. Given this situation, we chose to explore the data from 2008 and 2019 to cover the entire series of available data and to emphasize the real development of the sector.
Thus, first presented are the results regarding the CEE (Central and Eastern European) bioeconomy market dimension and the evolution of main market indicators, respectively, the number of employees, turnover, value added, and work productivity. The evolution is structured on agriculture-based bioeconomy sectors and food-based sectors. Our study presents the structure and the dynamics of the market and, in this way, allows to assess the importance of selected CEE countries in the EU bioeconomy and to notice the progress of these CEE countries during the last decade.
The availability of biomass resources in the explored area is presented in the second part, where, based on OECD data, we observe the evolution for biomass and biomass for food and feed, of the following indicators: domestic extraction used, direct material input for use in economy, domestic material consumption, imports, and exports. All the derived structural indicators were available to complete the investigation so we can assess the real size of the biomass market through the balance over the 2008–2019 period. We also emphasized the development of biomass for food and feed in selected CEE countries because it is the main usage destination.

3. Results and Discussions

The evolution of agriculture is becoming more and more interrelated with the dynamics of bioeconomy due to the fact that the main agriculture-based resource, biomass, is specially intended for feed and food usage. The development of bioeconomy, particularly from the last decade, has led to the creation of new roles of agriculture and food production inside the food systems. Due to this development, the demand for biomass has increased and the sources of biomass from agriculture have become diversified. Thus, in the present, the main sources of biomass are trees, grasses, energy crops, agricultural residues, animal wastes, etc., and through different biotechnological processing (fermentation, combustion, chemical conversion, etc.) are created various bio-based products such as fiber boards, paper, adhesives, plastics, solvents, etc. [32]. In this context, at CEE countries level, there is a real concern towards the development of new activities based on innovations in agriculture and new forms of biomass usage. That is possible due to the fact that the CEE countries taken into consideration in our paper are rich in biomass and have a real potential to develop specific activities which can lead to a sustainable growth of their bioeconomies. In actuality, we may say that they have an agriculture-based profile which depends on the quantity of biomass generated by agriculture, in their process to expand bio-based activities. The valorization of the unexploited resources of biomass could ease this transition process, starting with actions aimed at decreasing the yield gap in these countries while preserving their natural capital [33].

3.1. Bioeconomy Evolution in Selected CEE Countries (2008–2019 Period)

In EU-27, the bioeconomy sector employed, in 2019, around 17.42 million people, 50.68% in the agriculture sector and 24.0% in the food sector. This part of the economy produced a turnover of EUR 2345.7 billion (around EUR 134.6 thousand/person employed) and a value added of EUR 656.7 billion. While the food sector produces 41.24% of turnover and around 29.0% of value added, the agriculture sector has a smaller dimension (18.6% of total turnover and 29.36% of total bioeconomy value added). Thus, the growth of this sector was lower than in the food sector. Compared with 2008 (the reference year in the DataM database), in 2019, the turnover in agriculture was higher by 9.5%, the value added increased by 14.4%, and the number of employed people decreased by almost 30%. Starting from this dynamic, we may conclude that these two sectors (agriculture and the manufacture of food) concentrated in the last decade around 60% of the value added and turnover of the bioeconomy and almost 75% of bioeconomy employment. The remaining percentage is represented by beverage, tobacco, and bio-based industries (chemicals, pharmaceuticals, forest-based industries, biofuels, bioenergy, etc.).
According to the Nova Institute [34], “the Eastern European countries Poland, Romania and Bulgaria apparently are stronger in less value-added sectors of the bio-based economy that generate a lot of employment. Western and Northern European countries generate a much higher turnover compared to the employment generated”. What does this really mean? Let us look at the data in Table 1 below. Thus, in 2019, the selected CEE (Central and Eastern European countries) total bioeconomy employed 6.86 million people and generated a turnover of EUR 323.6 billion and a value added of EUR 90.46 billion [35]. As we can see, these countries concentrate 39.35% from the EU-27 labor force, but only around 13.8% of turnover and value added are registered at the European level.
With a location quotient of 3.05 and 2.75, Romania and Bulgaria present a higher degree of specialization in the bioeconomy sector than other CEE countries. This means that in 2019, the two countries had a share of persons employed in the bioeconomy sector, three times higher than the proportion of bioeconomy workers on the EU labor market. Still, when examining the efficiency of bioeconomy sectors, the ranking is different (Table 2).
Poland has around 40–45% of the turnover and value added of 10 CEE countries and is followed by Romania (with only 13.23% of the considered CEE countries turnover and 16.19% of value added) and the Czech Republic (with 11.83% of CEE countries turnover and 11.96% of value added).
However, in terms of productivity, Romania and Bulgaria remain in the last places, with around EUR 19 thousand/person. Accordingly, with the explored indicators (employment, turnover, and value added), the differences between countries are due to the degree of labor intensiveness and to the generated value of the component sectors.
As can be noticed in Table 2, agriculture remained a sector with low labor productivity which employs 49.9% of bioeconomy workers and obtains only 18.9% of the bioeconomy turnover (Table 3).
At the CEE level, the number of people working in the agriculture-based bioeconomy decreases by over 1.9 million, due to continuous changes of the agricultural sector.
Moreover, the turnover of the agriculture sector increased by over EUR 6.8 billion and the value added by over EUR 4.0 billion. The main growth of turnover was registered in Latvia and Estonia, and the biggest growth of added value was registered by Slovakia, Hungary, and Romania. The gap is evident compared to the food sector, employing only 24.1% of the bioeconomy workers and generating almost 12% of the bioeconomy turnover (Table 4).
In terms of labor productivity (calculated as turnover divided by the number of persons employed in the sector), the gap between countries is very high, from EUR 8.78 thousand/person in Romania, to EUR 71.17 thousand/person in Estonia. In the 2008–2019 period, the biggest growth was registered by Latvia (by 119.0%) and Estonia (by 89.5%) (Table 5).

3.2. Biomass Production and Usage in Ten CEE Countries

According to the OECD estimations, the production of biomass (“raw materials extracted or harvested from the environment and that physically enter the economic system”) reached, in CEE countries, a level at around 422.15 million tons in 2019, 7.1% higher than in 2008. Based on these data, these regions have around 28% of the biomass supply produced in EU-27 (the structure of EU in 2007). By examining the domestic extraction of biomass and biomass for food and feed used in economy, we included, in the table, the data from 2019 compared with 2008 (the reference year in the DataM database). Thus, the results show an increased trend for both total biomass (by 7.1%) and the biomass for food and feed (by 2.0%). Looking at the total biomass share of each country in the total CEE (Table 6 below), among the 10 countries in the year 2019, we have bring out the first three countries: Poland (33.64%), Romania (20.23%), and Hungary (11.15%).
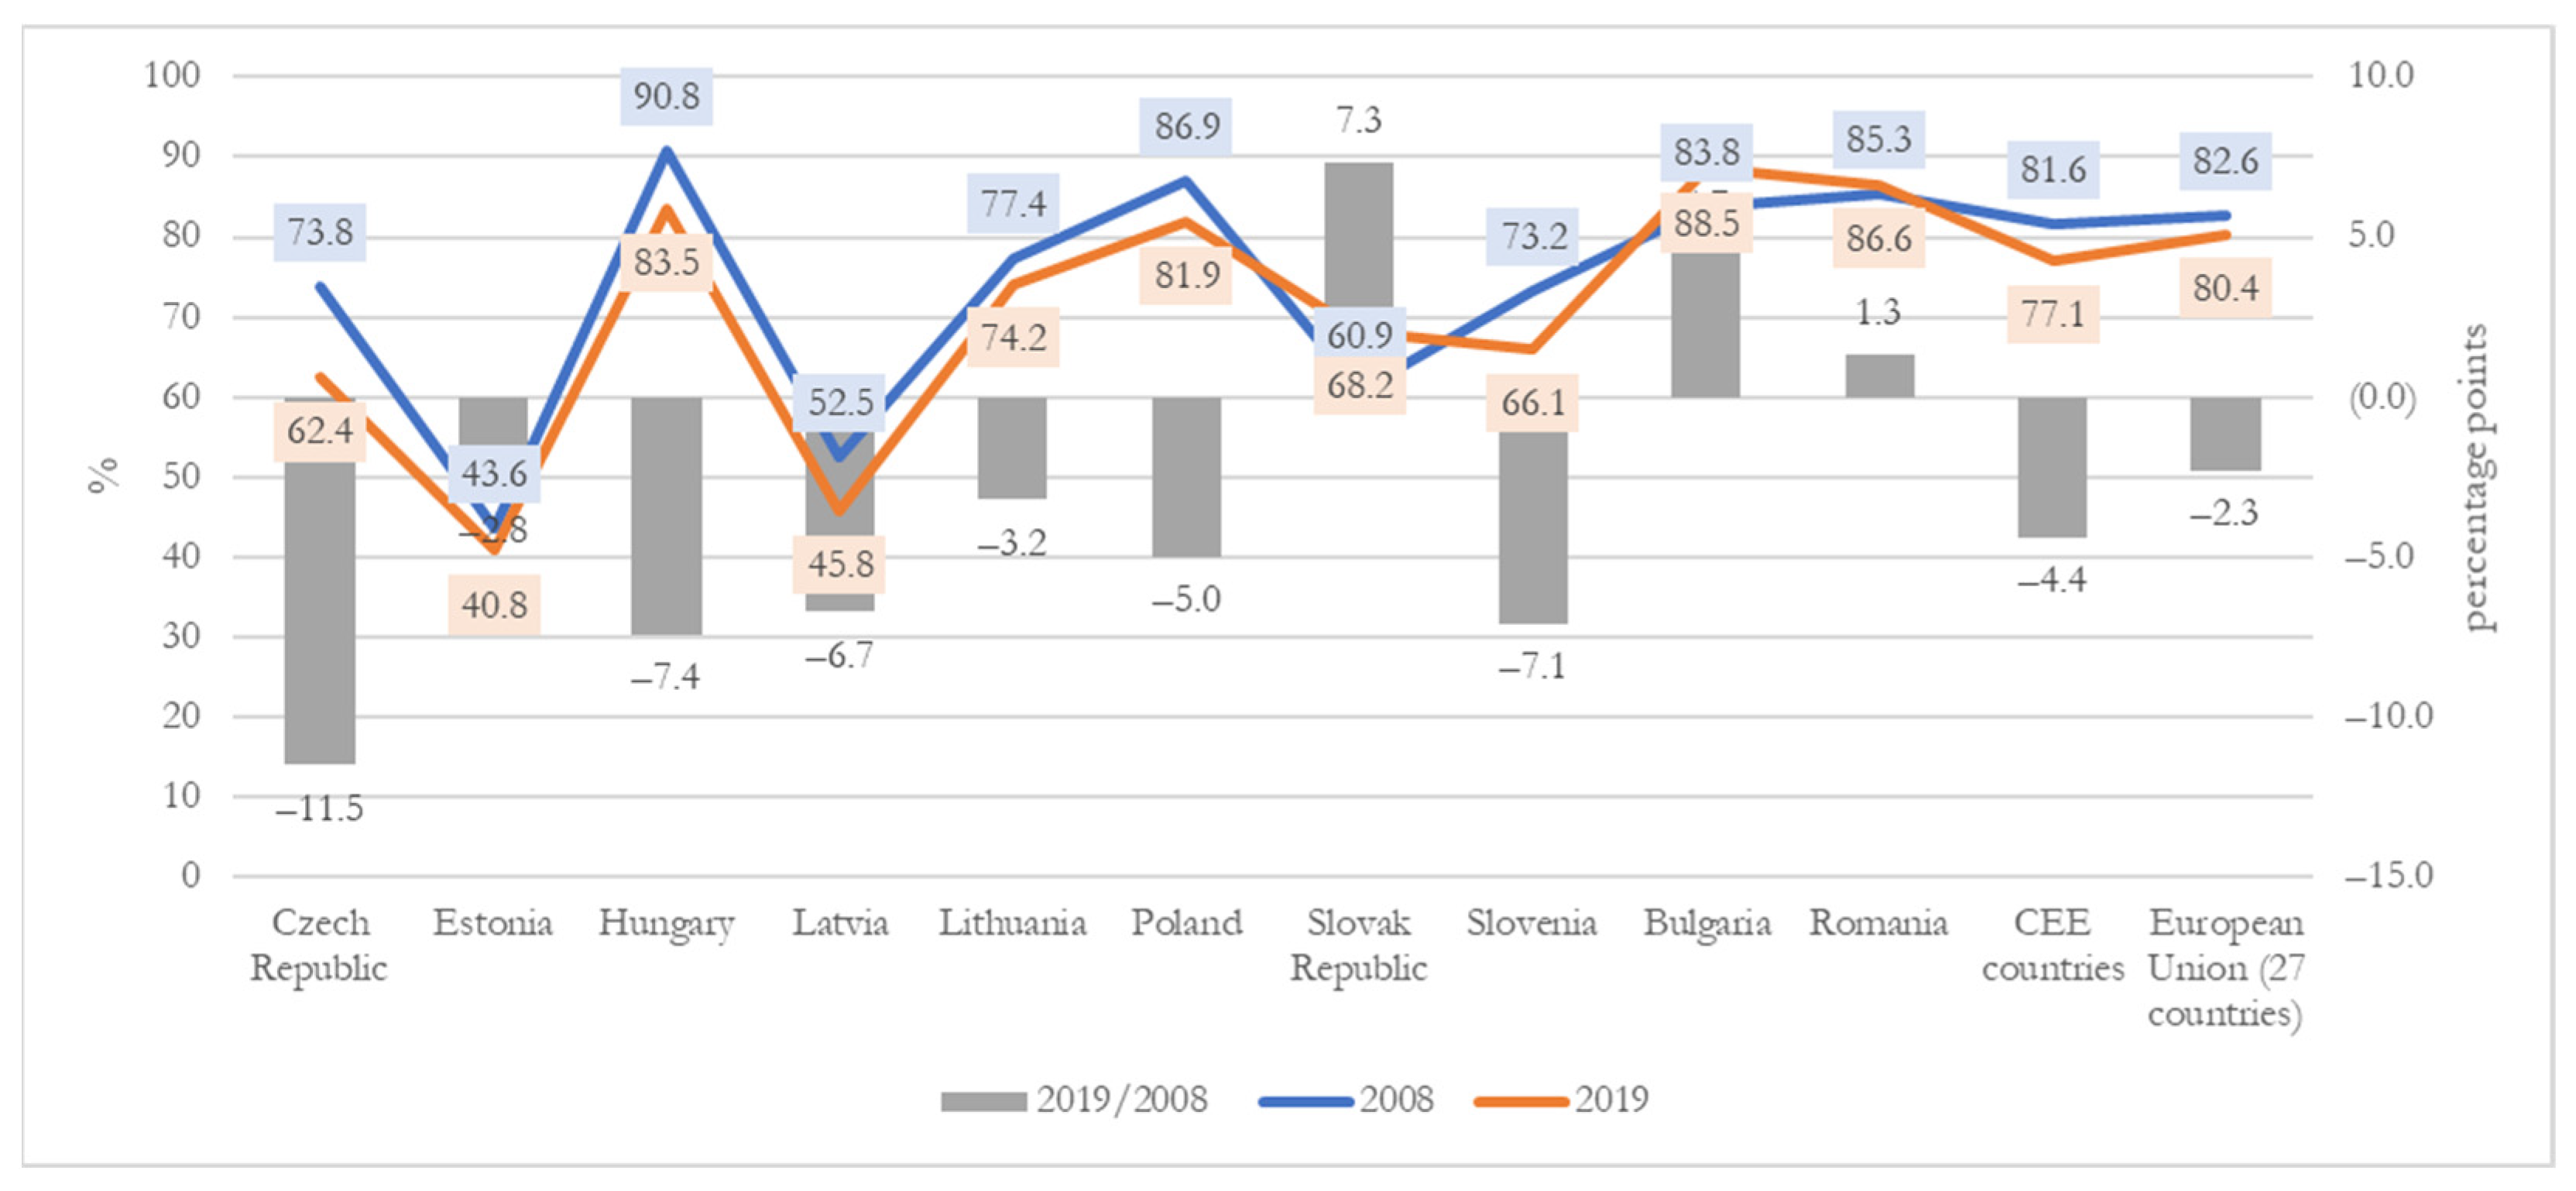
The situation is similar for the biomass for food and feed. By comparing 2019 with the year 2008, the highest rate of growth per each country was observed for Estonia (by 68.3%). Even if Poland has a very developed sector, it was registered as decreasing biomass quantities by almost 20%. The biomass for food and feed (BFF) represents, in almost all ten CEE countries, the main source of biomass, with the exception of Estonia and Latvia, where the wood sector became the main source (see Figure 1, below). In 2019, the share of biomass from food and feed was around 80–90% in Bulgaria, Hungary, and Romania, but the biggest change was in Romania, by 16.8 pp in the 2008–2019 period.
Focusing on the ranking of the direct material input (total amount of materials, means domestic extraction plus imports) of biomass and biomass for food and feed among the analyzed countries, we noticed that in 2019, Poland, Romania, and Hungary concentrated over 62% of the materials used in the economy at the CEE level. Compared to the base year 2008, a major increase of direct material input of biomass for food and feed was found in Estonia (by 60.2%), Bulgaria (by 40.3%), Latvia (by 61.9%), and Romania (by 38.8%). However, during the explored decade, Poland remained the major actor on the CEE biomass market, but it had a decrease of direct material input for food and feed of almost 14% (Table 7).
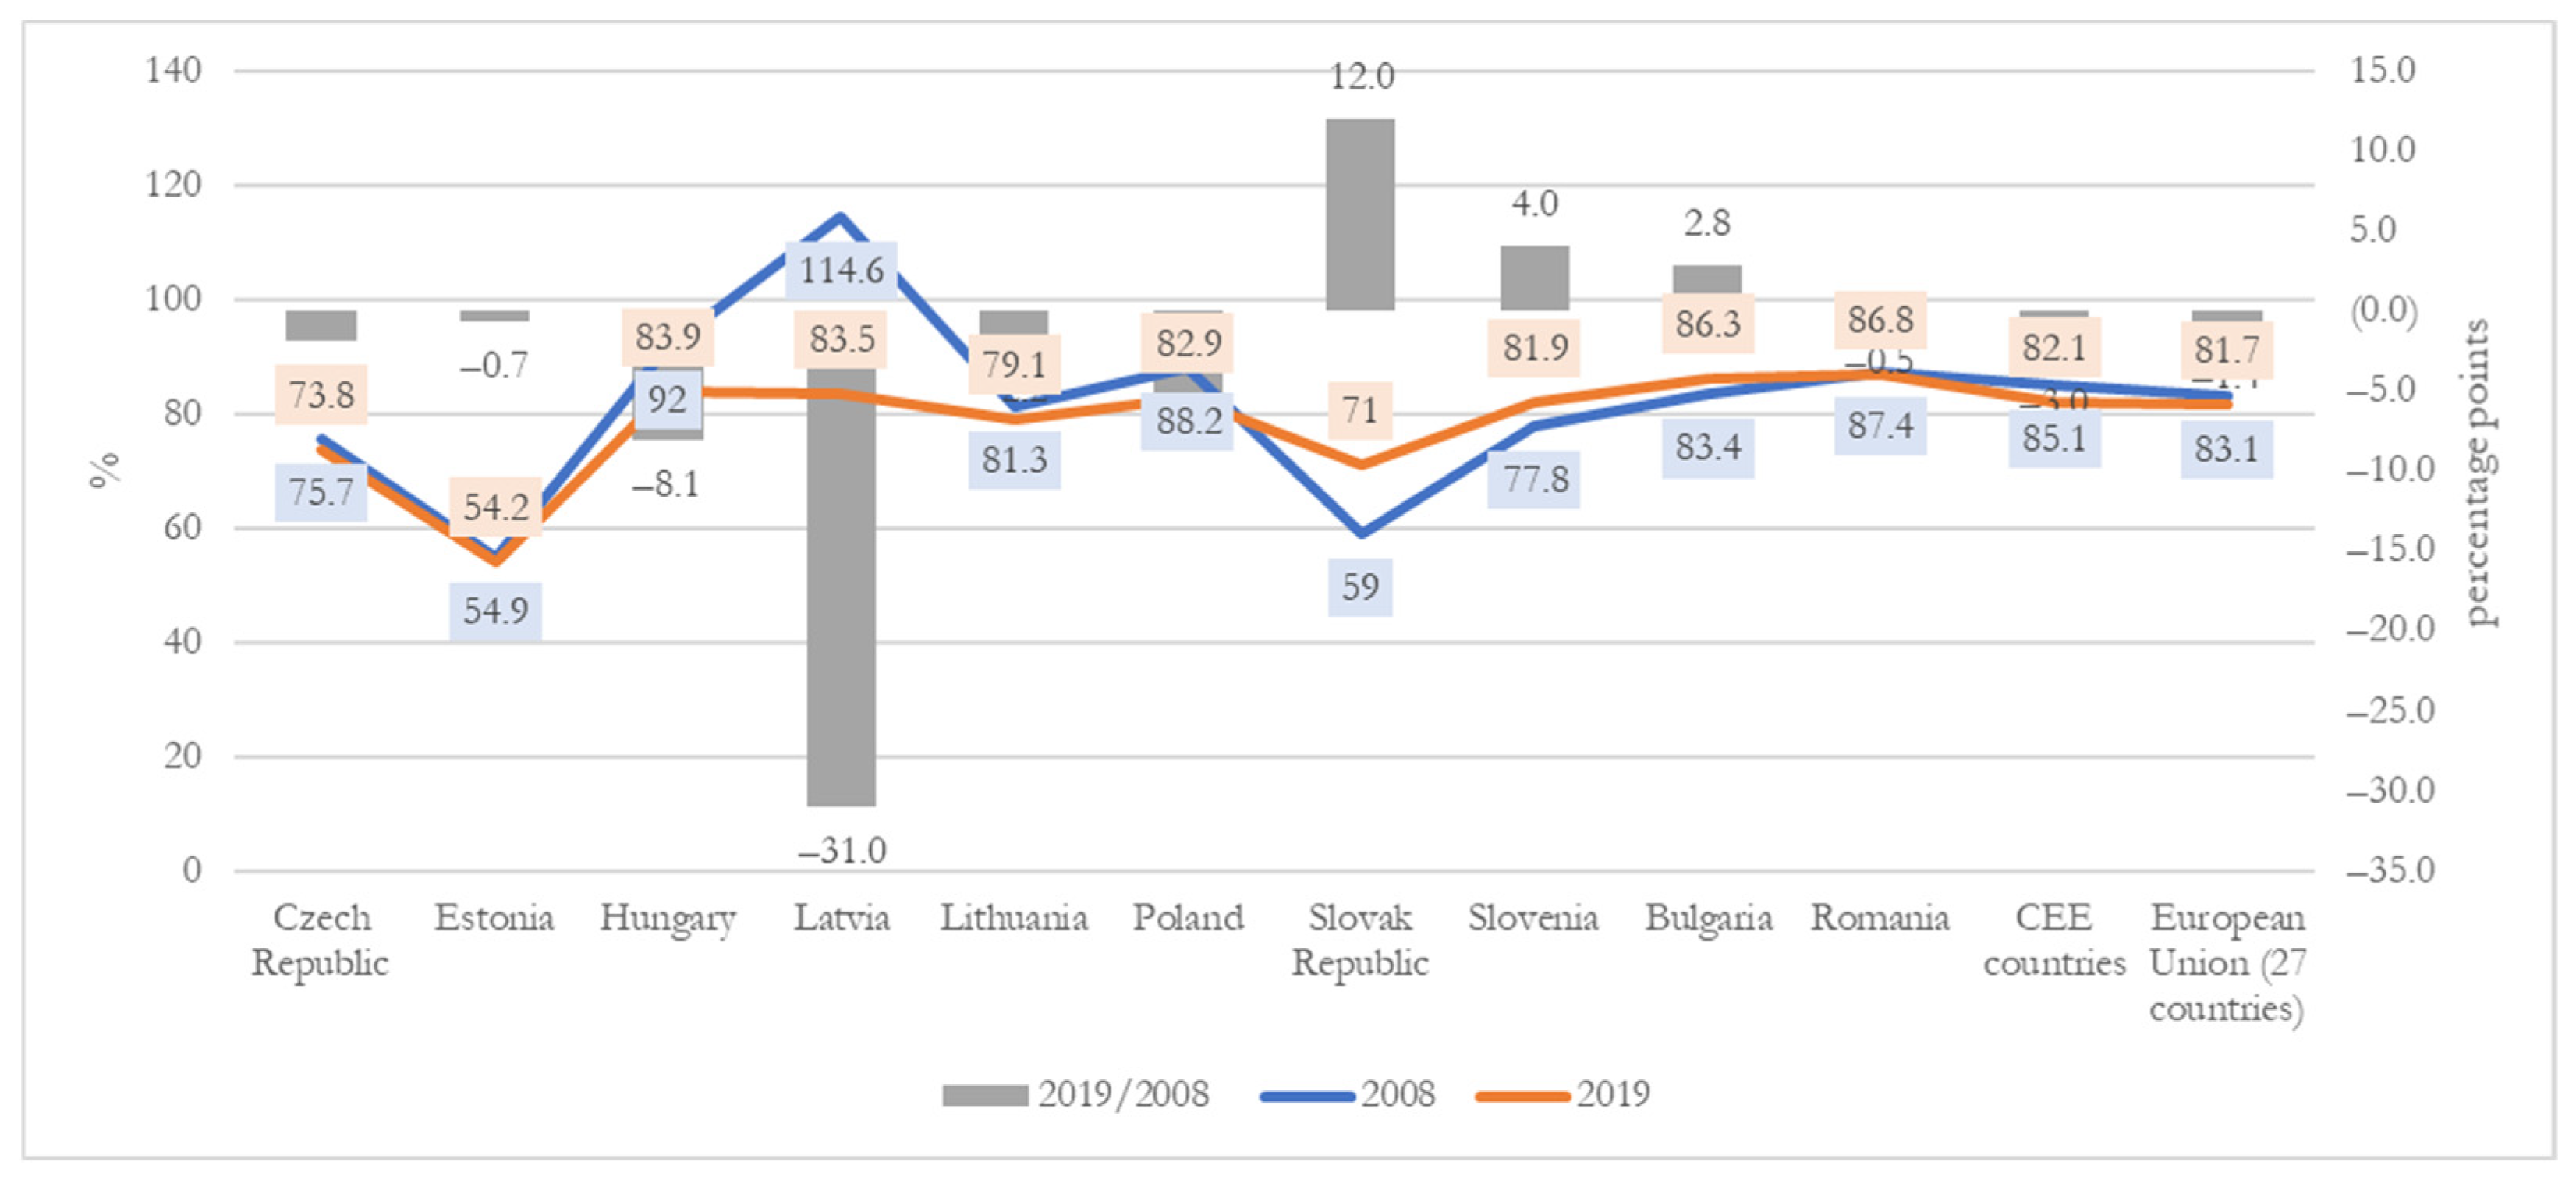
Figure 2 below, shows that the importance of biomass for food and feed has decreased during the last decade, meaning that the materials used in the economy (from internal sources or imports) tend to come from other sectors as well (such as wood). Outstanding examples are the Czech Republic or Slovenia. However, there are three CEE countries (Slovakia, Bulgaria, and Romania) where the direct material input of biomass for food and feed importance has increased.
The apparent consumption of biomass in national economies, measured by domestic material consumption, is examined in the table below (Table 8). The consumption, which takes into consideration the production extracted plus imports and minus exports, reveals almost the same pattern as in the investigation above. Poland and Romania were, in 2019, in the first places in the total of biomass consumed in CEE countries; while exploring the dynamics during the 2008–2019 period, we noticed a much slower growth and even a tendency of consumption reduction in some of the countries.
From the table above, a particular situation is noticeable in Latvia, where the material consumption of biomass increased by 33.2% and the material consumption of biomass for food and feed decreased by 3%, which reveals a shift towards the wood-based biomass products consumption.
By exploring the importance of biomass for food and feed in the domestic material consumption (see Figure 3 below), a decrease trend recorded by Latvia is noticeable (the domestic material consumption of wood-based products was negative due to the higher exports in 2008, which translated to a higher indicator for the share of biomass for food and feed) while in the Slovak Republic, the importance of this sector is shown by an increase of 12 percentage points during 2008–2019 period.
On the trade side, the table below displays the imports of the biomass and biomass for food and feed, and the results obtained from the data investigation showed that in 2019, Poland kept first place among the 10 countries (32.24%), then, for the following two places, the situation changed, with the Czech Republic (12.93%) in the second place followed by Romania (11.61%) (see Table 9 below). In addition, the data show that the imports of biomass increased in the last decade in Latvia, Lithuania, and Romania, by over 70%, and the imports of biomass for food and feed by over 60% in Latvia, Romania, Bulgaria, and Hungary.
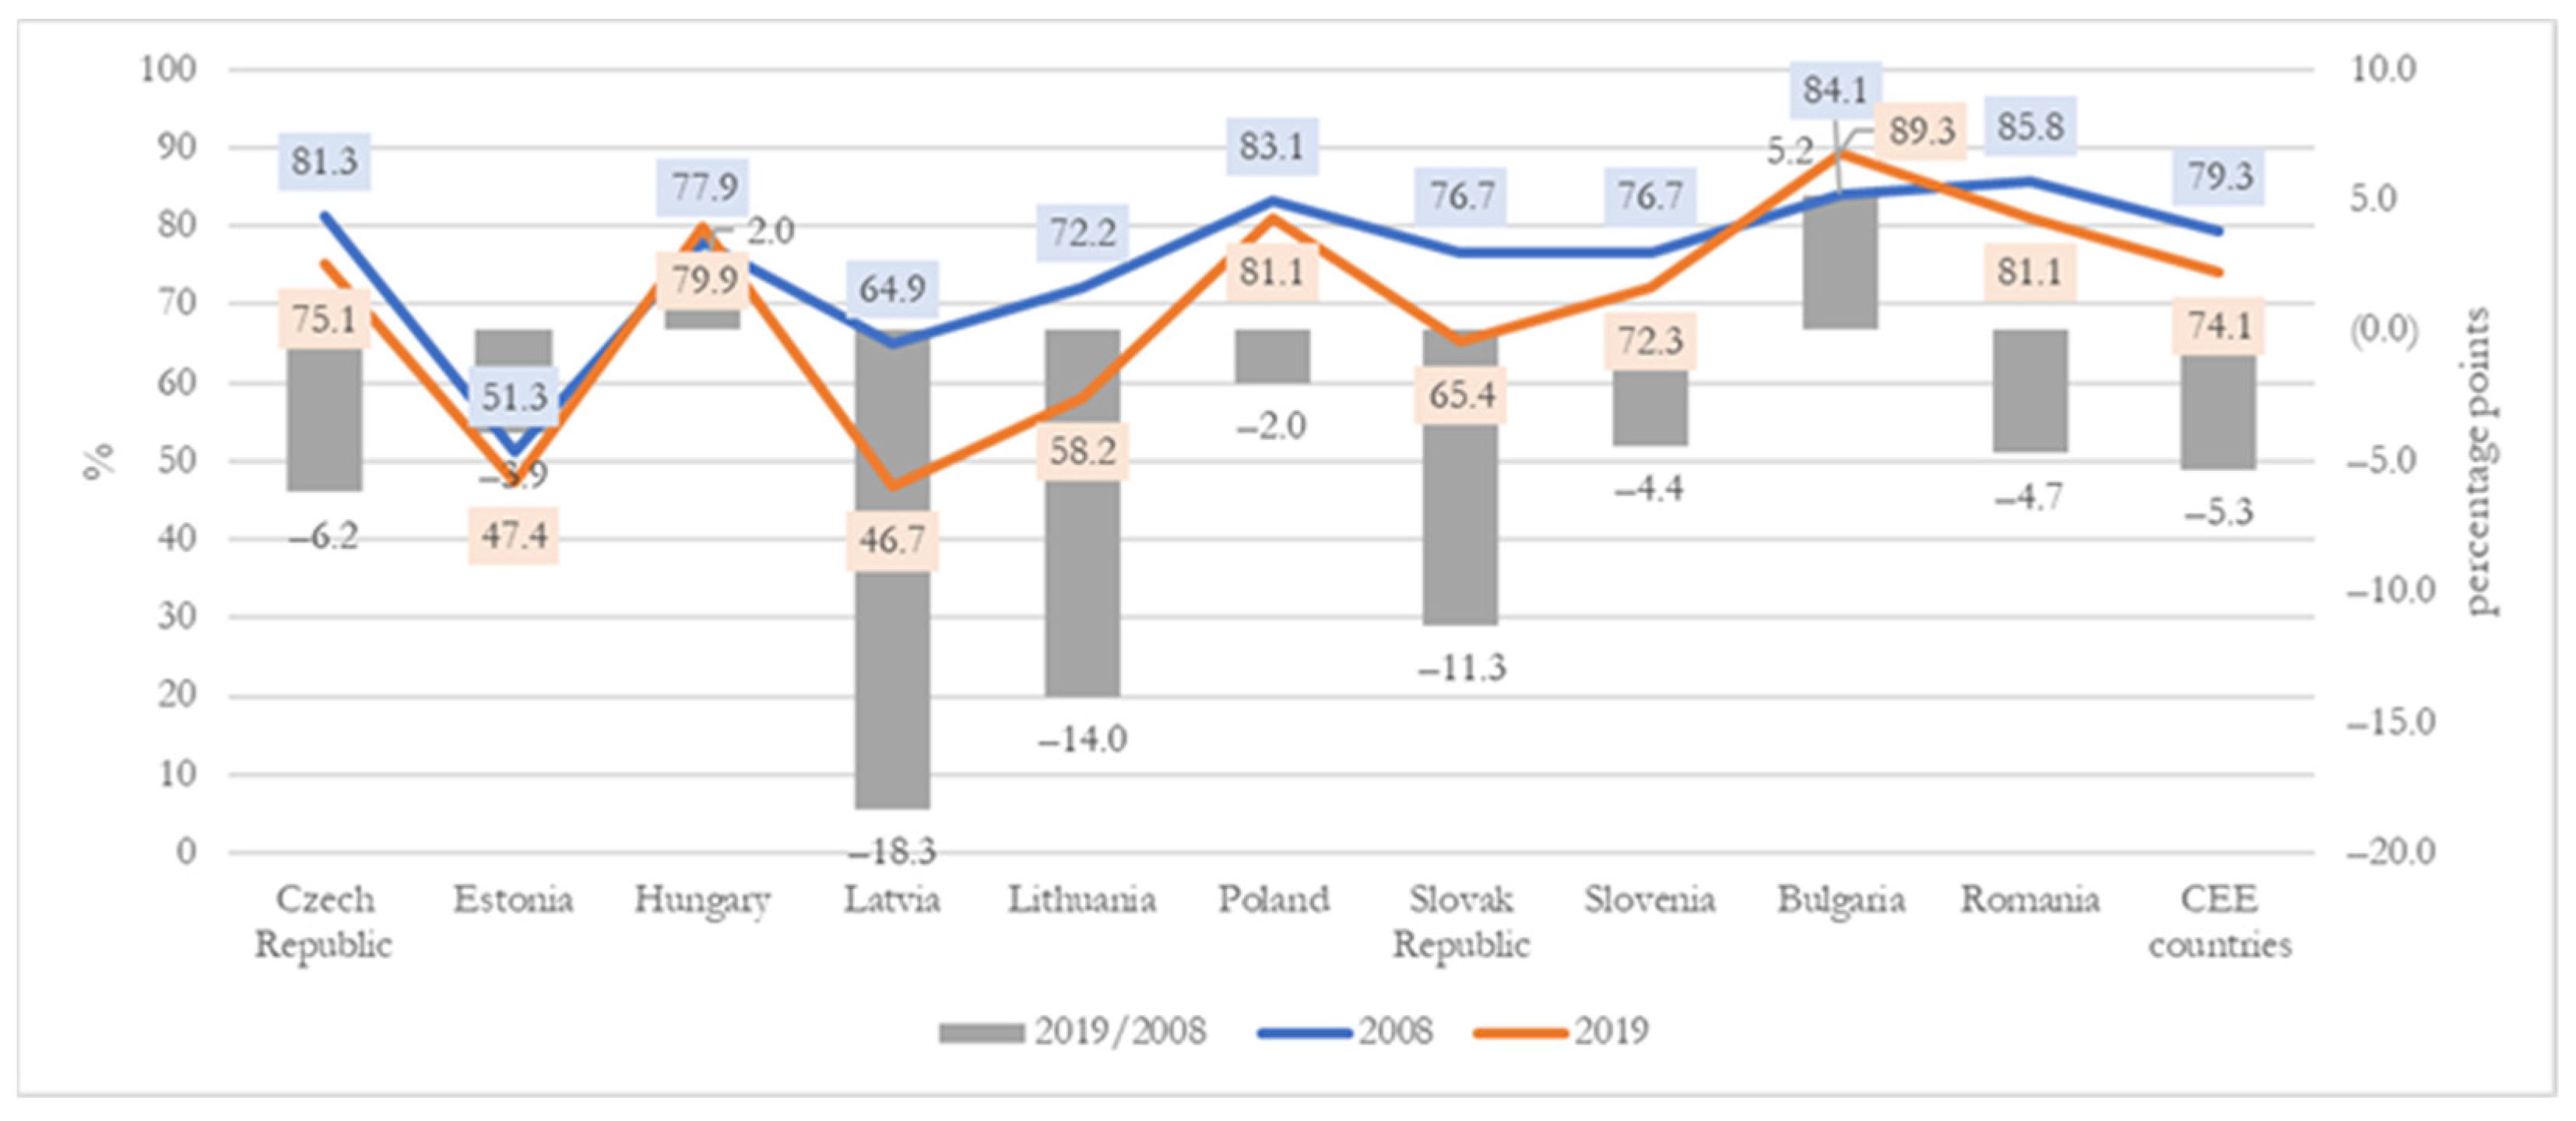
The imports of biomass for food and feed decreased in the last decade reported for the total imports of biomass, especially in Latvia (by 18.3 percentage points), such that in 2019 in this country these imports represented only 46.7% of total imports of biomass (Figure 4). However, the shares remain very high in countries such as Bulgaria, Poland, Romania, and Hungary (80–90%), and the shares of imports increased during 2008–2019 in Bulgaria and Hungary.
The analysis of exports of biomass in selected CEE countries reveals a concentration in four countries, which together represent over 62%, respectively; Poland (20.52%), Czech Republic (18.05%), Romania (13.39%), and Hungary (10.45%). In the exports of biomass for food and feed, Poland holds 23.52%, Romania almost 17%, and Czech Republic and Hungary around 14% each (Table 10 below). The dynamics from the last decade reveal a high growth of exports of biomass in Romania (by 198.4%), Bulgaria (by 161.6%), and Poland (by 116.4%). In addition, a high increase of exports of biomass for food and feed was found in Romania (by 271.2%), Bulgaria (by 183.3%), Latvia (by 133.3%), and Poland (by 129.8%).
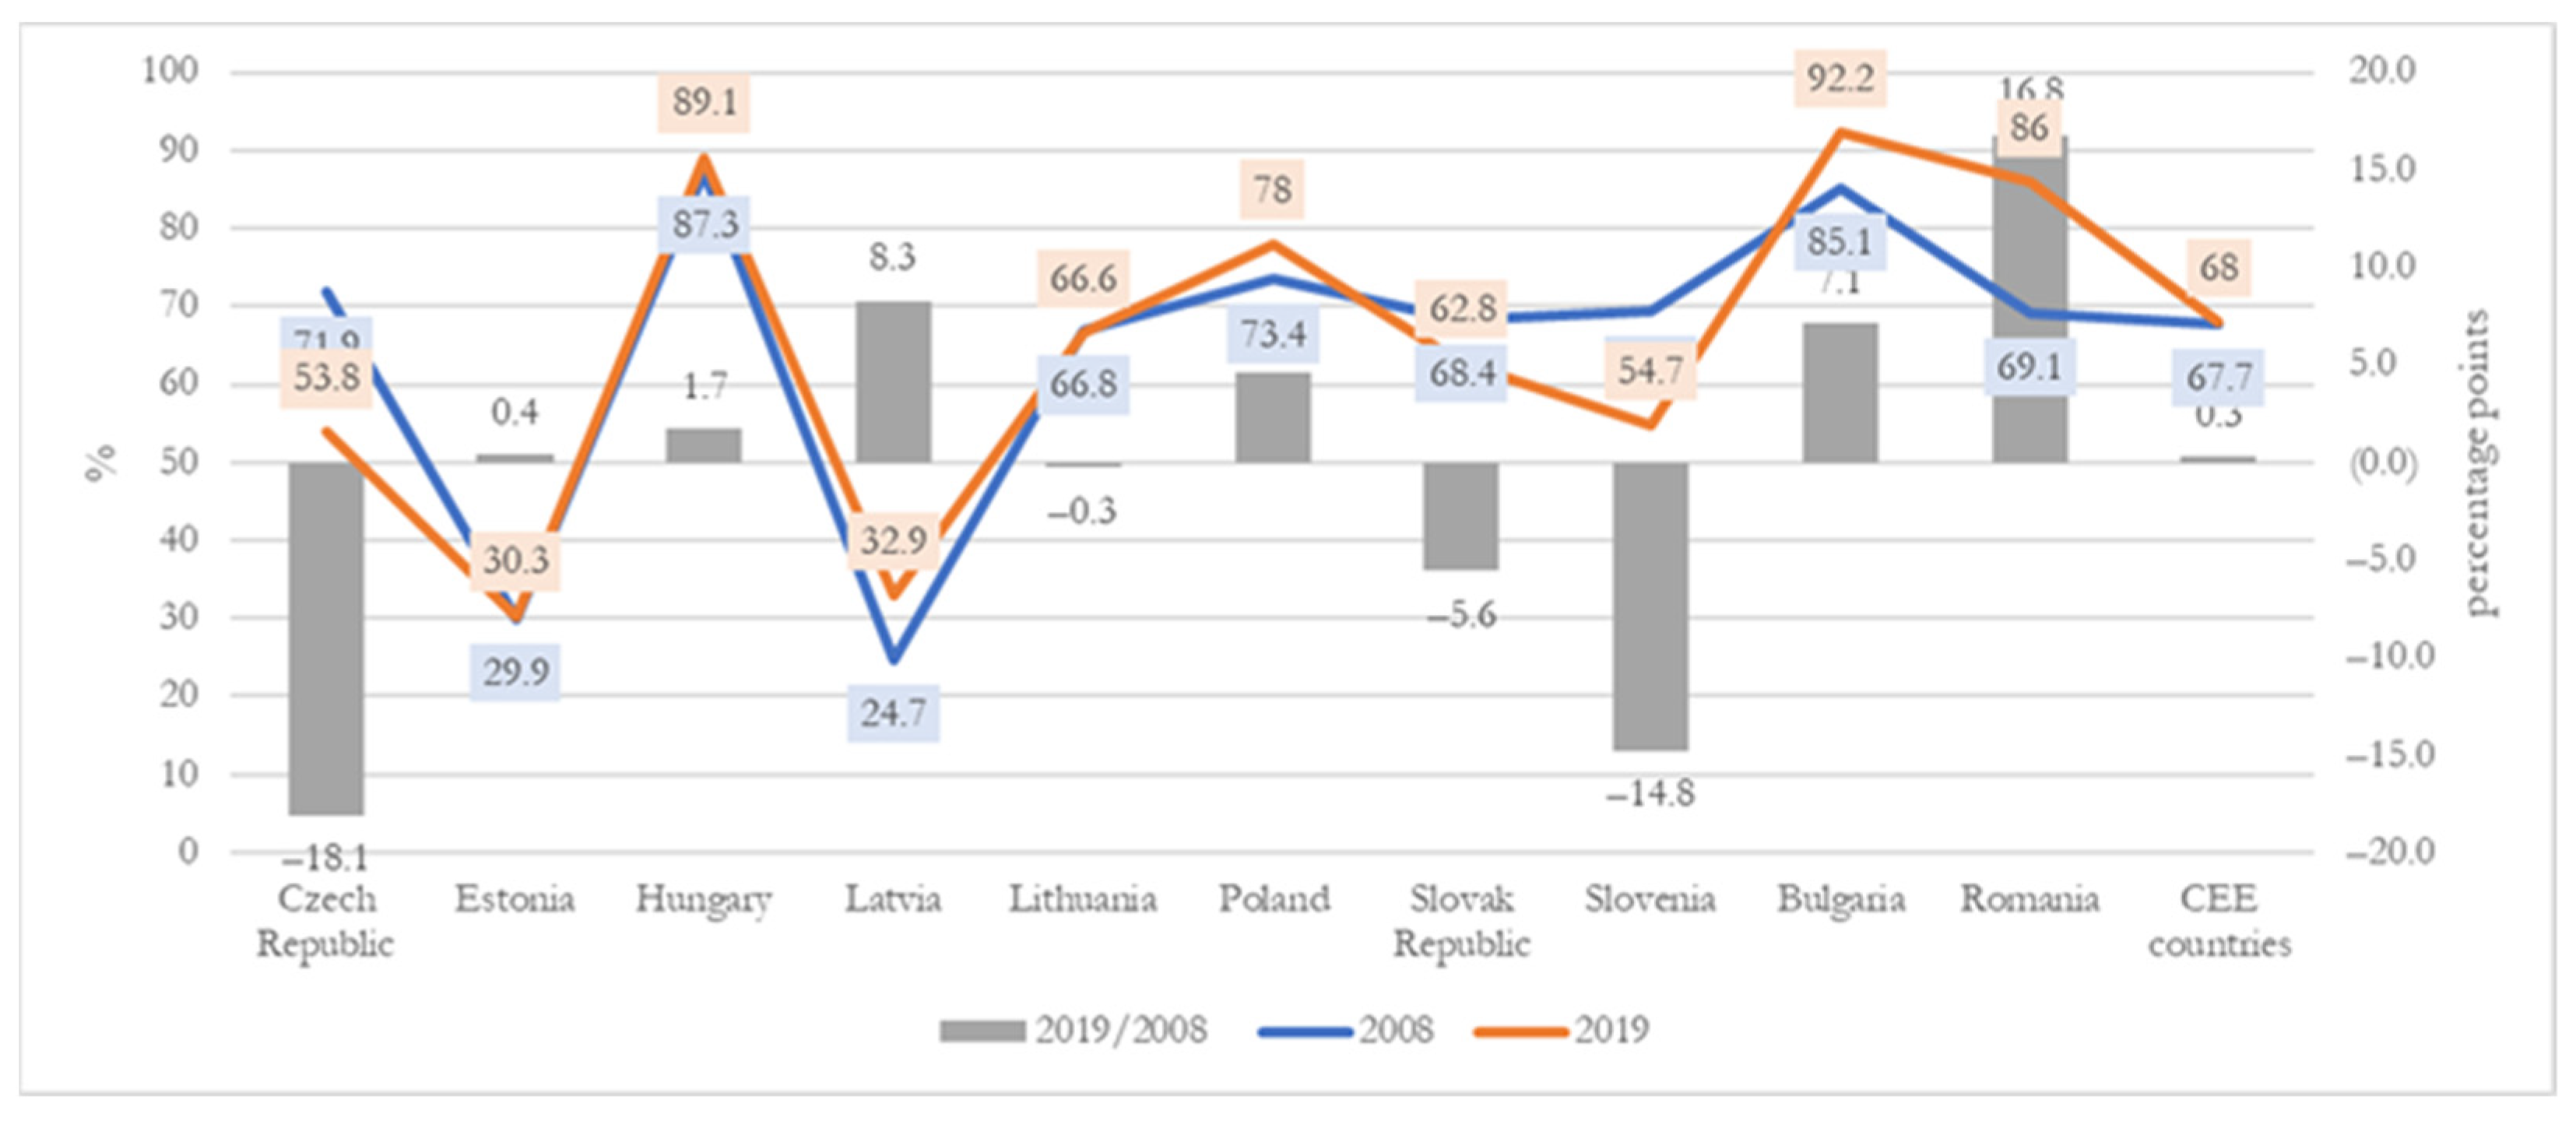
The share of exports of biomass for food and feed in total exports of biomass decreased during the 2008–2019 period, especially in Czech Republic (by 18.1 pp) and Slovenia (by 14.8 pp) and increased in the rest of CEE countries, but especially in Romania (by 16.8 pp) (Figure 5). In addition, in 2019, the share remains very high in Bulgaria (92.2%), Hungary (89.1%), and Romania (86.0%).
Thus, having the results of all investigations drawn here, we conclude that the big four players in the biomass area are Poland, Romania, Hungary, and, for the trade, the Czech Republic.
Summarizing the results of the previous analyses in the table below (Table 11), we can conclude that in the ten CEE countries, biomass production reaches 422.15 million tons, out of which 329.4 are biomass for food and feed.
The degree of coverage of the internal consumption gap is about 114–119%, most of the CEE countries being exporters of biomass. Thus, in 2019, the examined countries had a surplus of exports over imports of about 70 million tons of biomass and about 41 million tons of biomass for food and feed, except Estonia, which needed imports to cover the consumption. The main producers and consumers of biomass, including biomass for food and feed, are Poland and Romania. The main biomass traders are Poland, the Czech Republic, Romania, and Hungary. When consumption was related to the production of each country it was noticed that in Latvia, Estonia, and the Czech Republic about 40–60% of domestic production was the surplus of exports over the imports. Most countries, such as Romania, Lithuania, Hungary, etc., managed to have an export surplus at a level of 10–30% of the domestic production. A similar situation was found in biomass for food and feed, for which, in the cases of Latvia and Bulgaria, the domestic consumption represented only 70% of the domestic production, whereas in countries such as Poland, Romania, Lithuania, and Hungary, the export surplus reached a level of about 15–20% from the domestic production.
Obviously, the approaches in the area studied in our paper are very diverse; being a thematic area of great interest, it has already been explored from many points of view. Because the results and conclusions obtained in this study have been confirmed and supported by some authors from the field of interest and have addressed similar issues, we can note that in the coming years, to reach further progress in sustainable growth of agriculture in the CEE countries, there is a need to face specific challenges through the lens of bioeconomy by switching the emphasis to research, innovation, and transnational cooperation [37]. Then, as the findings of the research carried out since now also require their transposition into measures and policies at European level, there have been studies showing that the results underlined involved several actions for policymakers, pointing out that the creation of sustainable bioeconomy needs the stakeholders to develop efficient collaboration mechanisms and build synergies [38]. Specifically, for Romania, there were noted aspects related to the opportunities and challenges for the future of bioeconomy, for which some researchers presented a wide outlook on the bioeconomy at the level of the EU and CEE countries, as well as of Romania, with their own characteristics, opportunities, and challenges for the near future [39].
Remaining in the area of strategies to be adopted in the bioeconomy of the CEE countries, and focusing on another relatively unimpressive side, namely, the behavior and perception of citizens regarding the development of the bioeconomy, some researchers have identified that at European level there are “differences and similarities between national systems, from the perspective of the socio-economic context and also in terms of behaviors that support the bioeconomy” [40]. Another study on a similar topic but approached from a different point of view (that of the agricultural tradition), caught our interest by the fact that the authors appreciated that for countries within the CEE group, bioeconomy should be expressed as a chance to become more developed [41]. Approaching the bioeconomy from the point of view of the funding of research and development, which makes a difference among countries, some authors confirm the high potential of the CEE countries in the bioeconomy area, stating that in the medium economically advanced countries there are real opportunities for the development of the bioeconomy by the means of a high share of agriculture in the national revenues [42].
The other part of our study, biomass, was also approached by the research of other authors from different points of view, and the results showed that the agricultural biomass sector helps the economic development and does not have negative implications for environmental indicators [43]. Referring to the pathway towards the biomass, some authors mention that this “involves more efficient and new uses of biomass, including both conventional and new bioindustries, supply side mobilization and innovation downstream and increases in value added through bioindustry” [44]. Exploring further, from the European perspective, we noticed that “the total biomass supply in the EU accounts for 9% of global biomass production and that the EU is almost self-sufficient in the biomass supply and use, even if the market for bio-based chemicals is still small, but growing fast” [45]. Meanwhile, a largely accepted idea is that the use of biomass as renewable energy in industrialized countries is a key element in achieving sustainable development and that it goes together with policies that track decreasing the greenhouse gases (GHG) and, consequently, global warming (GW) [46]. Another paper focusing on a country from the CEE area underlines the concerns about climate change and environmental issues. These were mentioned among the major global challenges and key drivers for the development of the biomass production and are appreciated as the core of the bioeconomy, which is now considered as a main alternative for energy production. The paper confirms that the sector remains a major source of employment in rural areas and suggests that the country is facing the attitude of the society about the benefits of using biomass, claiming that the entrepreneurial activity should be stimulated [47]. Another paper presents a general view on the opportunities and challenges surrounding green growth through the use of biomass as renewable raw material, by reiterating that bioeconomy is based on sustainable use of bioresources for producing food, materials, and energy [48]. Focusing on another country from the CEE zone, researchers pointed out that the pedoclimatic conditions, together with a diverse agricultural production, lead to high biomass potential, a potential which depends to a large extent on the number of resources available and their characteristics [49]. This is why it is largely accepted that in CEE countries, many sources of biomass are underutilized, the productivity in agriculture is very low, mainly due to inadequate equipment and insufficient infrastructure, and the most important, large part of the waste ends up in landfills where there are no efficient biodegradable waste sorting collection systems [31].

4. Conclusions

The main results of this paper underlined the real dimension of the bioeconomy development in selected CEE countries by starting from data on biomass estimations generated at the Member States and the EU level [35]. Our analysis revealed that CEE countries have an important role in the EU bioeconomy sector and that they have a very big potential for biomass and real opportunities to develop value-added chains in this field. The results show that in 2019, in the selected CEE countries, bioeconomy employed 6.8 million people and generated a turnover of EUR 323.6 billion and a value added of EUR 90.5 billion. These areas represented 39.4% from the EU-27 labor force, but only around 13.8% of turnover and value added registered at the European level, which means that we found these countries to be in the last places in the EU, in terms of labor productivity. The analysis over the 2008–2019 period reveals that the number of people working in the agriculture-based bioeconomy decreased by more than 1.9 million, the turnover increased by over EUR 6.8 billion, and the value added grew upwards of EUR 4.0 billion. The highest progress of turnover was registered in Latvia and Estonia, while the biggest growth of added value was recorded by Slovakia, Hungary and Romania.
In terms of labor productivity, the gap between countries was very high, from EUR 8.78 thousand/person in Romania, up to EUR 71.17 thousand/person in Estonia.
The production of total biomass and the biomass for food and feed increased in the analyzed period, reaching a level of 422.15 million tons in production of biomass, out of which 329.4 was biomass for food and feed. Among the selected CEE countries, the share in total biomass of Poland, Romania, and Hungary exceeded 65%, and, in biomass for food and feed sector, was around 62%.
At the same time, we noticed that the biomass trade has been developed during the period 2008–2019. The analysis of exports of biomass in the CEE countries revealed a con-centration in four countries, which together represented over 62%, namely Poland (20.52%), Czech Republic (18.05%), Romania (13.39%), and Hungary (10.45%). In the total exports of biomass for food and feed, Poland covered 23.52%, Romania almost 17%, and Czech Republic and Hungary around 14% each. The dynamics from the last decade recorded a higher growth of exports of biomass in Romania (by 198.4%), Bulgaria (by 161.6%), and Poland (by 116.4%). Meanwhile, an increased level of export for biomass for food and feed was noticed in Romania (by 271.2%), Bulgaria (by 183.3%), Latvia (by 133.3%), and Poland (by 129.8%). Regarding the imports of biomass in the last decade, an increased level was registered in Latvia, Lithuania, and Romania, by over 70%, while for the imports of biomass for food and feed, the growth reached more than 60% in Latvia, Romania, Bulgaria, and Hungary.
Therefore, we can conclude that most of the selected CEE countries are exporters of biomass. In 2019, these countries have had a positive balance of exports over the imports of about 70 million tons of biomass and around 41 million tons of biomass for food and feed, except Estonia, which needed imports to cover the consumption. The major producers and consumers of biomass, including biomass for food and feed, are Poland and Romania. The main biomass traders are Poland, the Czech Republic, Romania, and Hungary. Most countries, such as Romania, Lithuania, Hungary, and others, successfully managed to have an export at a level of 10–30% of the domestic production.
Our investigations also highlighted some strong and weak points in the examined sectors at the selected CEE countries’ level. Thus, in the last decade, there is definitely a strong point in the analyzed area, the increase of biomass production over the EU average, the increase of exports, and the higher share of the exports of biomass in total usage. Among the weaknesses, we can mention the unused or underutilized potential of biomass, the lack of functional chains, and the poor development of bio-based industries.
In the meantime, it was acknowledged limitations in our research design, especially related to the availability of the databases. For instance, one of the study limitations was that we referred only to ten CEE countries, while OECD covers 12 CEE countries [50]. This was because there was a lack of data for Albania and Croatia. Still, once the databases are completed, the research may be extended, referencing all 12 countries. However, while our analysis is confined to ten out of twelve CEE countries, we consider our results to be relevant for the selected European region, but future research could examine in more detail the bioeconomy and biomass sectors, as new data are collected and the current framework of indicators is expanded.
Another limitation of the study is that the databases are changing, the indicators are permanently adapted to the new methodologies, and sometimes they are outdated; for the current research, the available data were for the year 2019. We also acknowledged that there are many bio-based products and it is very difficult to collect full quantitative data for many countries, with most of them being based on surveys in the field. We recommend expanding the collected indicators (by type of products, by chains, etc.); thus, there can be a more extensive overview of the bioeconomy sectors. There is an obvious need to integrate different databases and create a more extensive assessment framework of the bioeconomy. Future research needs to support the data collection setting, especially taking into consideration the links between bioeconomy and biomass, as we know that in the next decades their roles will increase. We therefore consider that it is necessary to develop further research in the bioeconomy and biomass field in order to confirm the growing potential of the CEE countries.

Author Contributions

Conceptualization, I.M.V. and E.T.; data curation, E.T.; formal analysis, I.M.V. and E.T.; investigation, I.M.V. and E.T.; methodology, I.M.V. and E.T.; resources, E.T.; supervision, I.M.V. and E.T.; validation, I.M.V. and E.T.; visualization, I.M.V. and E.T.; writing original draft, E.T.; writing review and editing, I.M.V. and E.T. All authors have read and agreed to the published version of the manuscript.

Funding

This research received no external funding.

Institutional Review Board Statement

Not applicable.

Informed Consent Statement

Not applicable.

Data Availability Statement

The main databases used for this paper are public open databases: https://stats.oecd.org/, https://datam.jrc.ec.europa.eu/datam/public/pages/index.xhtml. More specific details are indicated in the references section.

Conflicts of Interest

The authors declare no conflict of interest.

References

  1. Erb, K.H.; Haberl, H.; Defries, R.; Ellis, E.C.; Krausmann, F.; Verburg, P.H. Pushing the planetary boundaries. Science 2012, 338, 1419–1420. [Google Scholar] [CrossRef] [Green Version]
  2. Mottet, A.; De Haan, C.; Falcucci, A.; Tempio, G.; Opio, C.; Gerber, P. Livestock: On our plates or eating at our table? A new analysis of the feed/food debate. Glob. Food Secur. 2017, 14, 1–8. [Google Scholar] [CrossRef]
  3. Muscat, A.; De Olde, E.; Boer, I.J.M.; Ripoll-Bosch, R. The battle for biomass: A systematic review of food-feed-fuel competition. Glob. Food Secur. 2019, 25, 100330. [Google Scholar] [CrossRef]
  4. European Commission. A Blueprint to Safeguard Europe’s Water Resources. Communication from the Commission to the European Parliament, The Council, The European Economic and Social Committee and The Committee of the Regions. 2012. Available online: https://eur-lex.europa.eu/legal-content/EN/ALL/?uri=CELEX:52012DC0673 (accessed on 20 October 2020).
  5. Moore, K.J.; Kling, C.L.; Raman, D.R. A Midwest USA Perspective on Von Cossel et al.’s Prospects of Bioenergy Cropping Systems for a More Social-Ecologically Sound Bioeconomy. Agronomy 2020, 10, 1658. [Google Scholar] [CrossRef]
  6. Asada, R.; Stern, T. Competitive bioeconomy? Comparing bio-based and non-bio-based primary sectors of the world. Ecol. Econ. 2018, 149, 120–128. [Google Scholar] [CrossRef]
  7. Antar, M.; Lyu, D.; Nazari, M.; Shah, A.; Zhou, X.; Smith, D.L. Biomass for a sustainable bioeconomy: An overview of world biomass production and utilization. Renew. Sustain. Energy Rev. 2021, 139, 110691. [Google Scholar] [CrossRef]
  8. Issa, I.; Delbrück, S.; Hamm, U. Bioeconomy from experts’ perspectives–Results of a global expert survey. PLoS ONE 2019, 14, e0215917. [Google Scholar] [CrossRef] [PubMed]
  9. Lima, M.G.B. Just transition towards a bioeconomy: Four dimensions in Brazil, India and Indonesia. For. Policy Econ. 2022, 136, 102684. [Google Scholar] [CrossRef]
  10. Venkatramanan, V.; Shah, S.; Rai, A.K.; Prasad, R. Nexus between crop residue burning, bioeconomy and sustainable development goals over north-western India. Front. Energy Res. 2021, 8, 392. [Google Scholar] [CrossRef]
  11. Govindarajan, V. Can India establish a circular bioeconomy by 2050? Sci. Report. 2021, 58, 31–33. [Google Scholar]
  12. Li, Q.; Zhao, Q.; Hu, Y.; Wang, H. Biotechnology and bioeconomy in China. Biotechnol. J. Healthc. Nutr. Technol. 2006, 1, 1205–1214. [Google Scholar] [CrossRef] [PubMed]
  13. Duan, Y.; Chen, H.; Liu, T.; Awasthi, S.K.; Pandey, A.; Zhang, Z.; Awasthi, M.K. Chapter 15-Food waste biorefinery: Case study in China for enhancing the emerging bioeconomy. In Waste Biorefinery; Bhaskar, T., Varjani, S., Pandey, A., Rene, E.R., Eds.; Elsevier: Amsterdam, The Netherlands, 2021; Volume Value Addition through Resources Utilization; pp. 421–438. ISBN 978-0-12-821879-2. [Google Scholar] [CrossRef]
  14. Ren, X.; Liu, T.; Awasthi, M.K.; Varjani, S.; Pandey, A.; Zhang, Z. Chapter 16-Municipal solid waste biorefineries: A case study in China. In Waste Biorefinery; Bhaskar, T., Varjani, S., Pandey, A., Rene, E.R., Eds.; Elsevier: Amsterdam, The Netherlands, 2021; Volume Value Addition through Resources Utilization; pp. 439–457. ISBN 978-0-12-821879-2. [Google Scholar] [CrossRef]
  15. Brandão, A.S.; Gonçalves, A.; Santos, J.M. Circular bioeconomy strategies: From scientific research to commercially viable products. J. Clean. Prod. 2021, 295, 126407. [Google Scholar] [CrossRef]
  16. Valli, M.; Russo, H.M.; Bolzani, V.S. The potential contribution of the natural products from Brazilian biodiversity to bioeconomy. An. Acad. Bras. Cienc. 2018, 90, 763–778. [Google Scholar] [CrossRef] [Green Version]
  17. Valverde, J.C.; Arias, D.; Campos, R.; Jiménez, M.F.; Brenes, L. Forest and agro-industrial residues and bioeconomy: Perception of use in the energy market in Costa Rica. Energy Ecol. Environ. 2021, 6, 232–243. [Google Scholar] [CrossRef]
  18. Trigo, E.J.; Henry, G.; Sanders, J.P.M.; Schurr, U.; Ingelbrecht, I.; Revell, C.; Santana, C.; Rocha, P. Towards Bioeconomy Development in Latin America and the Caribbean; Bioeconomy Working Paper No. 2013-01; Pontificia Universidad Javeriana: Bogotá, Colombia, 2015; pp. 15–41. Available online: https://edepot.wur.nl/356641 (accessed on 14 January 2022).
  19. Arisoy, H.; Avci, Y. The Evaluation of Turkey’s Bioeconomic Policies from the Agricultural Point of View. J. Inst. Sci. Technol. 2020, 10, 4. [Google Scholar] [CrossRef]
  20. Lalonde, C.; Wellisch, M. Sustainability Governance of Canada’s Agriculture-Based Bioeconomy. IEA Bioenergy Task 43 (Biomass Supply). 2020. Available online: https://www.ieabioenergy.com/wp-content/uploads/2020/10/Sustainability-Governance-of-Canada-Agriculture-based-Bioeconomy-full-copy-Final-Oct-26-2020.pdf (accessed on 22 January 2021).
  21. Kretschmer, B.; Watkins, E.; Allen, B.; Smith, C.; Buckwell, A. Technology Options for Feeding 10 Billion People: Recycling Agricultural, Forestry & Food Wastes and Residues for Sustainable Bioenergy and Biomaterials: Summary. European Parliament, Directorate-General for Internal Policies of the Union. 2014. Available online: https://ieep.eu/uploads/articles/attachments/0b10d003-ed1b-449c-b862-75ae94ebda26/Recycling_agricultural_forestry_food_wastes_and_residues_for_sustainable_bioenergy_and_biomaterials_-_summary.pdf?v=63664509830 (accessed on 12 October 2020).
  22. Ronzon, T.; Piotrowski, S.; Carus, M. DataM, Biomass Estimates (v3): A New Database to Quantify Biomass Availability in the European Union. Joint Research Centre, Institute for Prospective Technological Studies. 2015. Available online: https://op.europa.eu/en/publication-detail/-/publication/ce366cbc-737e-4b7a-ac9b-a10490510c0a/language-en (accessed on 22 January 2021).
  23. Duque-Acevedo, M.; Belmonte-Ureña, L.J.; Plaza-Úbeda, J.A.; Camacho-Ferre, F. The Management of Agricultural Waste Biomass in the Framework of Circular Economy and Bioeconomy: An Opportunity for Greenhouse Agriculture in Southeast Spain. Agronomy 2020, 10, 489. [Google Scholar] [CrossRef] [Green Version]
  24. Flak, J. Technologies for Sustainable Biomass Supply—Overview of Market Offering. Agronomy 2020, 10, 798. [Google Scholar] [CrossRef]
  25. Greco, C.; Comparetti, A.; Febo, P.; La Placa, G.; Mammano, M.M.; Orlando, S. Sustainable Valorisation of Biowaste for Soilless Cultivation of Salvia Officinalis in a Circular Bioeconomy. Agronomy 2020, 10, 1158. [Google Scholar] [CrossRef]
  26. Balafoutis, A.T.; Evert, F.K.V.; Fountas, S. Smart Farming Technology Trends: Economic and Environmental Effects, Labor Impact, and Adoption Readiness. Agronomy 2020, 10, 743. [Google Scholar] [CrossRef]
  27. De Carlo, A.; Tarraf, W.; Lambardi, M.; Benelli, C. Temporary Immersion System for Production of Biomass and Bioactive Compounds from Medicinal Plants. Agronomy 2021, 11, 2414. [Google Scholar] [CrossRef]
  28. Moll, L.; Höller, M.; Hubert, C.; Korte, C.A.C.; Völkering, G.; Wever, C.; Pude, R. Cup Plant (Silphium perfoliatum L.) Biomass as Substitute for Expanded Polystyrene in Bonded Leveling Compounds. Agronomy 2022, 12, 178. [Google Scholar] [CrossRef]
  29. Tofanelli, M.B.D.; Wortman, S.E. Benchmarking the Agronomic Performance of Biodegradable Mulches against Polyethylene Mulch Film: A Meta-Analysis. Agronomy 2020, 10, 1618. [Google Scholar] [CrossRef]
  30. Wever, C.; Tassel, D.L.V.; Pude, R. Third-Generation Biomass Crops in the New Era of De Novo Domestication. Agronomy 2020, 10, 1322. [Google Scholar] [CrossRef]
  31. Piotrowski, S.; Dammer, L. State of Play of Central and Eastern Europe’s Bioeconomies; Nova Institute for Ecology and Innovation: Huerth, Germany, 2018; Available online: https://scar-europe.org/images/SCAR-Documents/Reports_outcomes_studies/BSW2_18-11-22_State-of-play-of-central-and-eastern-Europes-bioeconomies.pdf (accessed on 10 January 2021).
  32. Toma, E.; Stelica, C.; Dobre, C.; Dona, I. From bio-based products to bio-based industries development in an emerging Bioeconomy. Rom. Biotechnol. Lett. 2018, 23, 13350–13356. Available online: https://www.e-repository.org/rbl/vol.23/iss.1/18.pdf (accessed on 14 January 2022).
  33. Ronzon, T.; M’barek, R. Socioeconomic indicators to monitor the EU’s bioeconomy in transition. Sustainability 2018, 10, 1745. [Google Scholar] [CrossRef] [Green Version]
  34. Porc, O.; Hark, N.; Carus, M.; Dammer, L.; Bic, D.C.; Knapsack, C. European Bioeconomy in Figures 2008–2017. Nova Institute Paper. 2020. Available online: https://biconsortium.eu/file/2208/download?token=g3O_m0Th#:~:text=The%20total%20turnover%20of%20the,in%202008%20(Figure%205 (accessed on 4 December 2020).
  35. Ronzon, R.; Piotrowski, S.; M’barek, R.; Carus, M.; Tamošiūnas, S. Jobs and Wealth in the EU Bioeconomy/JRC—Bioeconomics. European Commission. Joint Research Centre (JRC). 2022. Available online: https://datam.jrc.ec.europa.eu/datam/embedded/contentDetails.xhtml?contentUniqueID=7d7d5481-2d02-4b36-8e79-697b04fa4278 (accessed on 5 February 2022).
  36. OECD. Stat—Material Resources. Available online: https://stats.oecd.org/Index.aspx?DataSetCode=MATERIAL_RESOURCES# (accessed on 15 February 2022).
  37. Vásáry, V.; Szabo, D. Characteristics of sustainable bioeconomy in the CEE macro-region. Cent. Eur. Rev. Econ. Financ. 2018, 27, 5–26. [Google Scholar] [CrossRef]
  38. Vásáry, V. Knowledge-based agriculture in Central and Eastern European Countries’ bioeconomy. Econ. Environ. Stud. 2019, 19, 137–154. [Google Scholar] [CrossRef]
  39. Voicilaș, D.M. Opportunities for bioeconomy in Central and Eastern European countries. In Agrarian Economy and Rural Development-Realities and Perspectives for Romania. In International Symposium, 11th ed.; ICEADR: Bucharest, Romania, 2020; pp. 244–253. Available online: http://hdl.handle.net/10419/234398 (accessed on 20 December 2021).
  40. Paşnicu, D.; Ghenţa, M.; Matei, A. Transition to bioeconomy: Perceptions and behaviors in Central and Eastern Europe. Amfiteatru Econ. 2019, 21, 9–23. [Google Scholar] [CrossRef]
  41. Iureş, M.V.C. Bioeconomy’s sectors and strategies in Central and Eastern European countries. A literature review. In Proceedings of the International Conference on Business Excellence, Bucharest, Romania, 11–12 June 2020; Volume 14, pp. 83–90. [Google Scholar] [CrossRef]
  42. Czyżewski, A.; Grzyb, A.; Matuszczak, A.; Michałowska, M. Factors for Bioeconomy Development in EU Countries with Different Overall Levels of Economic Development. Energies 2021, 14, 3182. [Google Scholar] [CrossRef]
  43. Bălan, E.M.; Cismaș, L.M.; Zeldea, C.G. Agricultural Biomass Production: Implications for Economic Growth and Environment in Central and Eastern European Countries. In Contemporary Issues in Social Science; Emerald Publishing Limited: Bingley, UK, 2021; Volume 106, pp. 263–279. [Google Scholar] [CrossRef]
  44. Lovec, M.; Juvančič, L. The Role of Industrial Revival in Untapping the Bioeconomy’s Potential in Central and Eastern Europe. Energies 2021, 14, 8405. [Google Scholar] [CrossRef]
  45. Popp, J.; Kovács, S.; Oláh, J.; Divéki, Z.; Balázs, E. Bioeconomy: Biomass and biomass-based energy supply and demand. New Biotechnol. 2021, 60, 76–84. [Google Scholar] [CrossRef] [PubMed]
  46. Perea-Moreno, M.A.; Samerón-Manzano, E.; Perea-Moreno, A.J. Biomass as renewable energy: Worldwide research trends. Sustainability 2019, 11, 863. [Google Scholar] [CrossRef] [Green Version]
  47. Ivanova, B.; Shishkova, M.; Beluhova-Uzunova, R. Agricultural Biomass Potential in Bulgaria. In Scientific Papers. Series “Management, Economic Engineering in Agriculture and Rural Development”; 2020; Volume 20, pp. 273–280. ISSN 2284-7995. Available online: http://managementjournal.usamv.ro/pdf/vol.20_2/Art36.pdf (accessed on 12 February 2022).
  48. Rodino, S.; Butu, A.; Dragomir, V.; Butu, M. An Analysis Regarding the Biomass Production Sector in Romania—A Bioeconomy Point of View. In Scientific Papers. Series “Management, Economic Engineering in Agriculture and Rural Development”; 2019; Volume 19, pp. 497–502. ISSN 2284-7995. Available online: http://managementjournal.usamv.ro/pdf/vol.19_1/Art62.pdf (accessed on 21 November 2021).
  49. Dicu, G.; Ion, V.; Horhocea, D.; State, D.; Ion, N. Results regarding biomass yield at maize under different plant density and row spacing conditions. AgroLife Sci. J. 2016, 5, 59–64. Available online: http://agrolifejournal.usamv.ro/pdf/vol.V_2/Art9.pdf (accessed on 22 November 2021).
  50. OECD.Stat—Agricultural Policies in OECD Countries: Monitoring and Evaluation 2000: Glossary of Agricultural Policy Terms. Available online: https://stats.oecd.org/glossary/detail.asp?ID=303 (accessed on 20 October 2021).
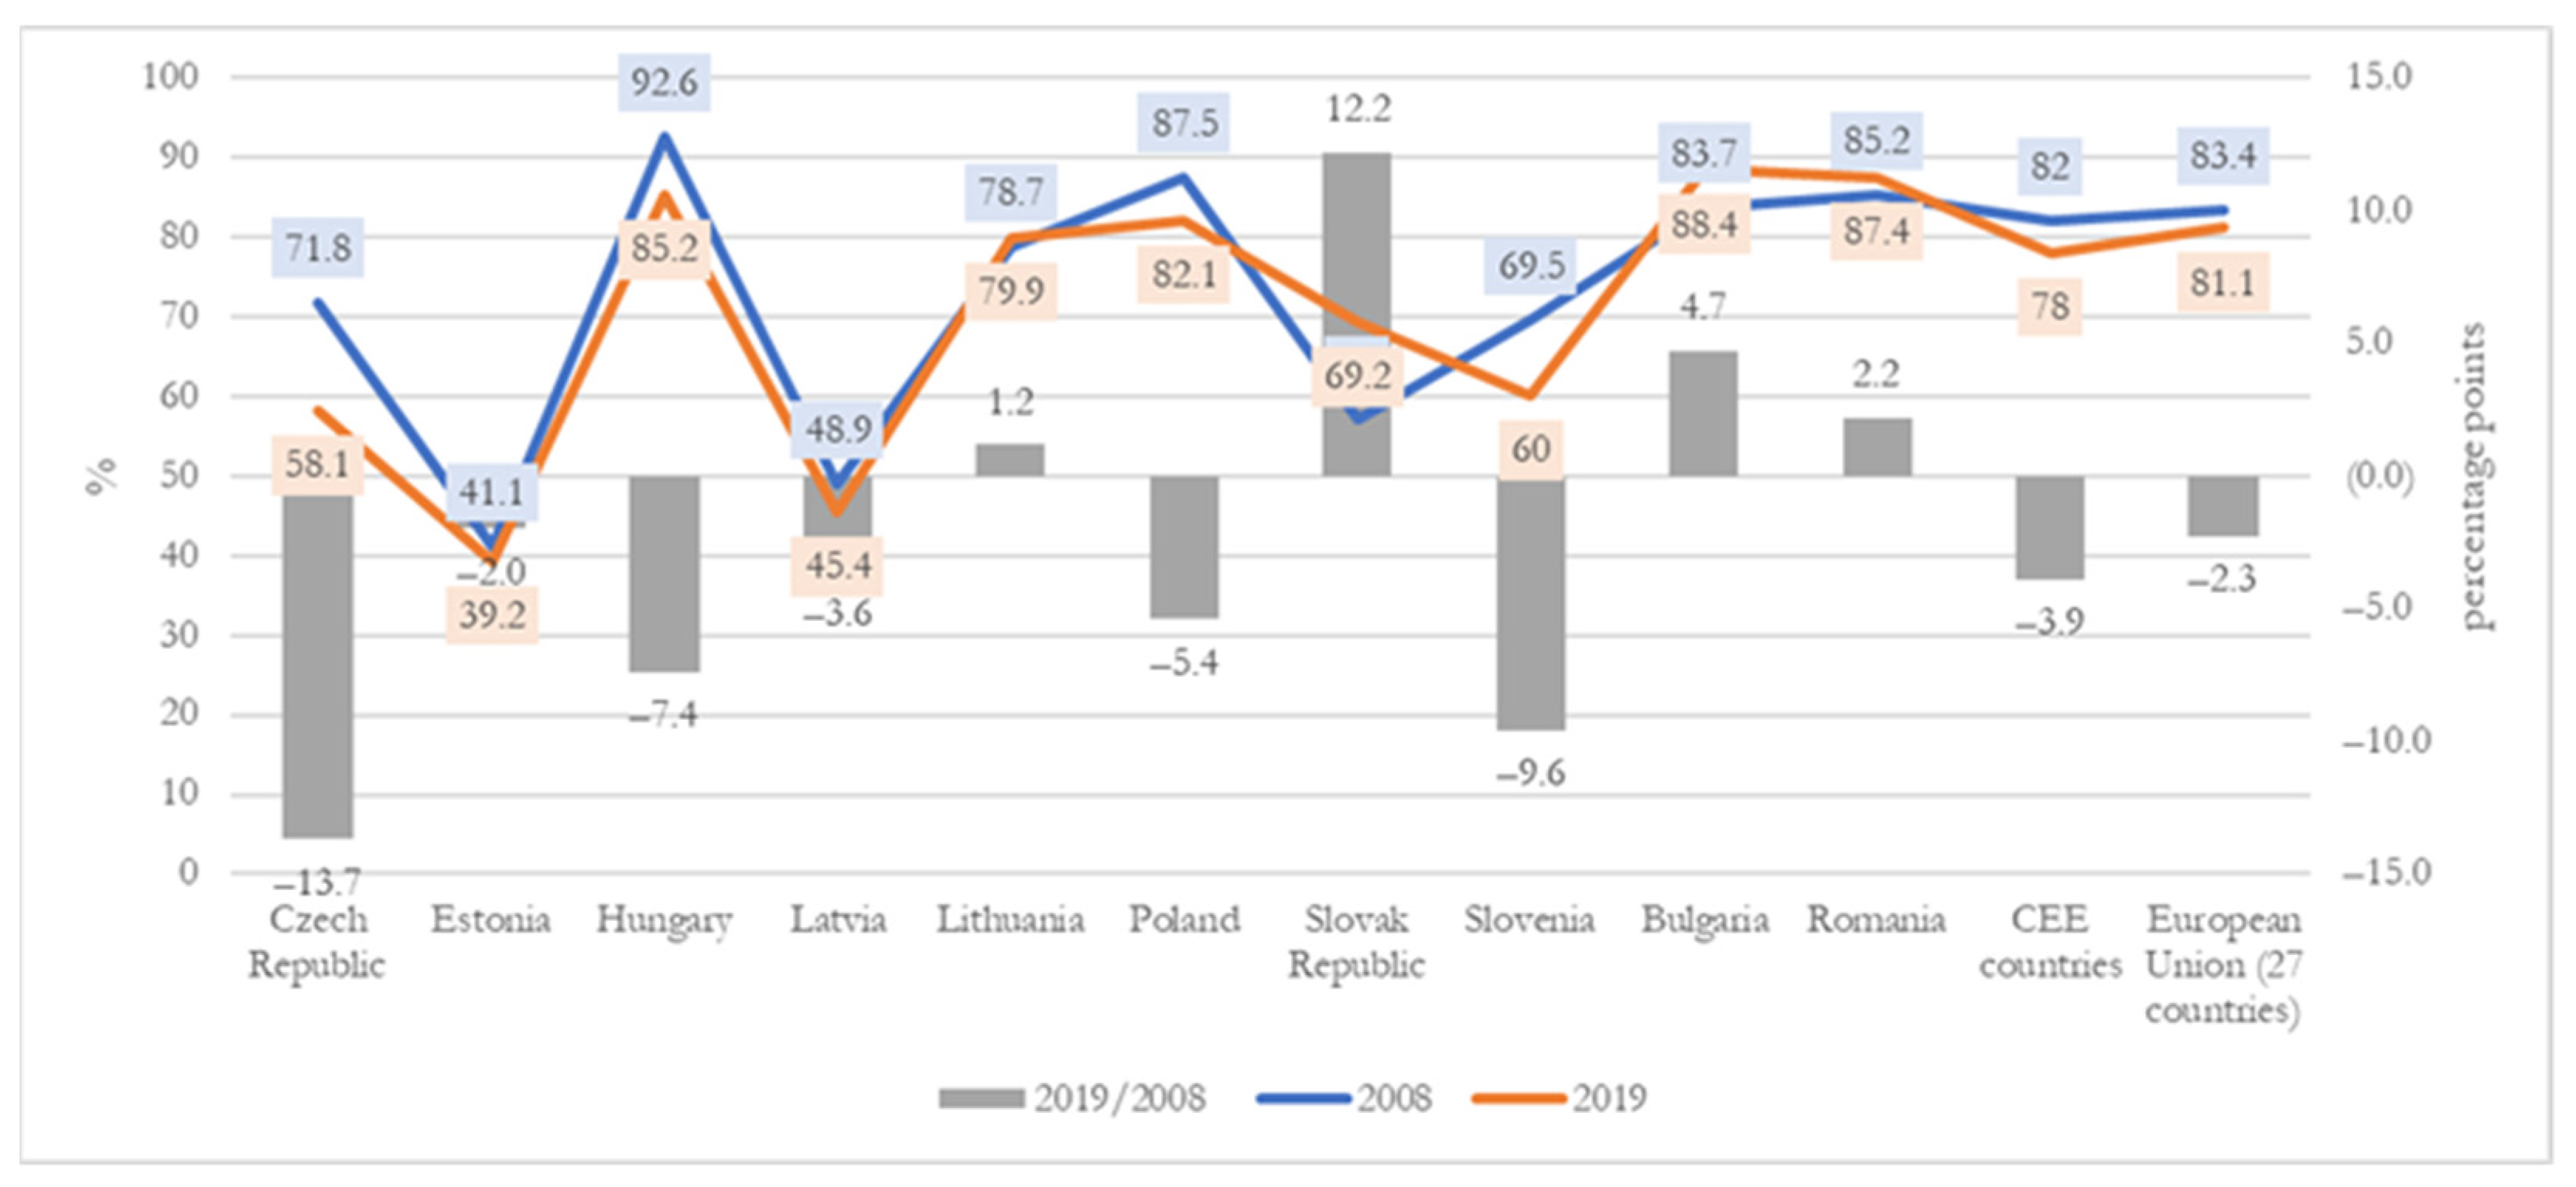
Figure 1. Domestic extraction used-share of biomass for food and feed in total biomass (%) (based on OECD.Stat data [36], retrieved on 15 February 2022).
Agronomy 12 00880 g001
Figure 2. The share of direct material input of biomass for food and feed in direct material input of biomass (%) (based on OECD.Stat data [36], retrieved on 15 February 2022).
Agronomy 12 00880 g002
Figure 3. Share of domestic material consumption of biomass for food and feed in domestic material consumption of biomass (%) (based on OECD.Stat data [36], retrieved on 15 February 2022).
Agronomy 12 00880 g003
Figure 4. Share of imports of biomass for food and feed in total imports of biomass (%) (based on OECD.Stat data [36], retrieved on 15 February 2022).
Agronomy 12 00880 g004
Figure 5. Share of exports biomass for food and feed in exports of biomass (%) (based on OECD.Stat data [36], retrieved on 15 February 2022).
Agronomy 12 00880 g005
Table 1. Number of persons employed in 10 CEE countries—bioeconomy sector.
CountriesLocation Quotient *Number of Persons Employed (Number)
201920192019/2008 (%)2019 (%)
Bulgaria2.75773,528.379.811.28
Czech Rep.0.84387,509.688.45.65
Estonia1.0661,756.485.70.90
Hungary0.95372,592.8100.65.43
Latvia1.52120,455.179.31.76
Lithuania1.55186,023.582.22.71
Poland1.652,369,058.978.134.55
Romania3.052,308,292.467.733.66
Slovakia0.72161,568.094.22.36
Slovenia1.36116,555.383.61.70
CEE countries6,857,340.3
(39.35% of EU-27)
76.4100.0
* Notes (legend): Location quotient (LQ) is a way of quantifying how “concentrated” the bioeconomy is in a Member State compared to the European Union (https://datam.jrc.ec.europa.eu/, accessed on 5 February 2022); EU-27 (formed by 27 countries, from 1 February 2020 without UK); Source: Data portal of agro-economics. Modeling—DataM. Jobs and wealth in the EU bioeconomy/JRC—Bioeconomics [35]. Retrieved on 5 February 2022.
Table 2. Turnover, value added at factor cost, and productivity—bioeconomy sector.
CountriesTurnover
(EUR Million)
Value Added at Factor
Cost (EUR Million)
Productivity (Turnover/Persons Employed, EUR Thousand/Person)
20192019/2008
(%)
2019%20192019/2008
(%)
2019%20192019/2008
(%)
Bulgaria14,737.5116.04.554270.4118.34.724270.4118.3
Czech Rep.38,275.8114.811.8310,817.4127.111.9610,817.4127.1
Estonia7585.4167.32.341934.7150.62.141934.7150.6
Hungary31,940.9120.79.879831.7135.510.879831.7135.5
Latvia8036.8142.02.482505.3153.42.772505.3153.4
Lithuania12,460.6152.43.853640.1168.64.023640.1168.6
Poland146,878.0143.645.3836,649.4139.340.5136,649.4139.3
Romania42,804.9108.913.2314,650.0105.616.1914,650.0105.6
Slovakia12,832.2115.43.973469.4114.43.843469.4114.4
Slovenia8077.5108.62.502696.3119.42.982696.3119.4
CEE countries323,629.4
(13.8% of EU 27)
128.9100.090,464.8
(13.76% of EU 27)
129.4100.090,464.8
(13.76% of EU 27)
129.4
Source: Data portal of agro-economics. Modeling—DataM. Jobs and wealth in the EU bioeconomy/JRC—Bioeconomics [35]. Retrieved on 5 February 2022.
Table 3. Numbers of persons employed, turnover, and value added at factor cost—agriculture based bioeconomy sector.
CountriesNumber of Persons Employed (Thousand Persons)Turnover (EUR Billion)Value Added at Factor Cost
(EUR Billion)
20192019/2008
(%)
2019%20192019/2008
(%)
2019%20192019/2008 (%)2019%
Bulgaria571.879.812.984.387.55.4410.6120.532.73
Czech Rep.137.9983.139140.811.428.297.625.46
Estonia14.178.90.321149.51.274.613014.22
Hungary164.5100.23.7310.2113.712.873.5150.110.86
Latvia45.470.51.031.7154.32.211.785.85.37
Lithuania75.877.91.723.21304.071.21013.81
Poland1418.7066.732.228.9118.336.521105.42.96
Romania1866.7065.642.3616.485.720.750.6141.61.91
Slovakia46.383.21.052.9102.53.670.6156.51.79
Slovenia6584.61.481.4112.51.780.3128.20.89
CEE countries4406.2
(49.90% of EU-27)
69.910079
(18.08%
of EU-27)
109.510032.3
(16.74% of EU-27)
114.4100
Source: Data portal of agro-economics. Modeling—DataM. Jobs and wealth in the EU bioeconomy/JRC—Bioeconomics [35]. Retrieved on 5 February 2022.
Table 4. Numbers of persons employed, turnover, and value added at factor cost—food-based bioeconomy sector.
CountriesNumber of Persons Employed (Thousand Persons)Turnover (EUR Billion)Value Added at Factor Cost (EUR Billion)
20192019/2008
(%)
2019%20192019/2008
(%)
2019%20192019/2008
(%)
2019%
Bulgaria81,172.090.88.075484.0156.74.691034.2181.44.75
Czech Rep.99,587.092.59.9012,442.8100.410.652435.9121.411.19
Estonia13,262.093.71.321855.9149.01.59369.9154.21.70
Hungary95,262.099.79.4711,080.6119.79.482187.6143.310.05
Latvia20,592.074.92.051701.9112.51.46390.2114.01.79
Lithuania38,174.087.13.804029.2142.93.45805.8181.33.70
Poland439,082.0108.543.6763,090.0155.954.0011,445.2150.552.56
Romania162,190.092.616.1310,827.9129.49.271795.3104.98.24
Slovakia38,847.0115.23.864077.9123.23.49766.9156.13.52
Slovenia17,315.0108.41.722244.5116.41.92545.3146.02.50
CEE countries1,005,483
(24.07% of EU 27)
99.8100.0116,834.7
(12.08% of EU 27)
137.8100.021,776.3
(11.45% of EU 27)
142.2100.0
Source: Data portal of agro-economics. Modeling—DataM. Jobs and wealth in the EU bioeconomy/JRC—Bioeconomics [35]. Retrieved on 5 February 2022.
Table 5. Productivity—agriculture- and food-based bioeconomy sector.
CountriesAgriculture-Based Bioeconomy Sector
(EUR Thousand/Person)
Food-Based Bioeconomy Sector
(EUR Thousand/Person)
20192019/2008 (%)20192019/2008 (%)
Bulgaria7.52109.867.56172.5
Czech Rep.65.42143.7124.94108.5
Estonia71.17189.5139.94159.1
Hungary61.82113.5116.32120.0
Latvia38.4621982.65150.1
Lithuania42.47166.9105.55164.1
Poland20.34177.5143.69143.7
Romania8.78130.666.76139.7
Slovakia62.79123.2104.97106.9
Slovenia21.6132.9129.63107.4
CEE countries17.94156.8116.20138.0
Source: Data portal of agro-economics. Modeling—DataM. Jobs and wealth in the EU bioeconomy/JRC—Bioeconomics [35]. Retrieved on 5 February 2022.
Table 6. Domestic extraction of biomass used and domestic extraction of biomass for food and feed used.
CountriesTotal Biomass
(Tons, Millions)
Biomass for Food and Feed
(Tons, Millions)
200820192019 (%)2019/2008 (%)200820192019 (%)2019/2008 (%)
Bulgaria22.2030.847.31138.918.627.38.28146.7
Czech Rep.33.6742.049.96124.924.224.47.42101.0
Estonia6.9911.772.79168.32.94.61.40160.3
Hungary *47.1447.0611.1599.843.640.112.1791.9
Latvia10.5614.773.50139.85.26.72.03129.7
Lithuania17.3921.695.14124.713.717.35.26126.6
Poland165.17142.0033.6486.0144.5116.535.3880.7
Romania63.2785.4220.23135.053.974.722.67138.5
Slovakia22.2619.854.7089.212.713.74.17108.2
Slovenia5.566.721.59120.93.94.01.22104.2
CEE countries394.21422.15100.0107.1323.11329.42100.0102.0
EU (27 countries) *1532.081521.06 99.31277.11233.6 96.6
CEE (%)25.7327.75-25.3026.70-
* Notes (legend): data from 2018 for EU-27 and Hungary; EU-27 (2007 structure). Source: OECD.Stat [36], retrieved on 15 February 2022.
Table 7. Direct material input of biomass for use in economy and direct material input of biomass for food and feed.
CountriesTotal Biomass
(Tons, Millions)
Biomass for Food and Feed
(Tons, Millions)
200820192019 (%)2019/2008 (%)200820192019 (%)2019/2008 (%)
Bulgaria25.2035.366.67140.321.1131.307.65148.3
Czech Rep.42.7956.0210.56130.931.6034.938.54110.5
Estonia9.2114.752.78160.24.016.021.47150.0
Hungary *53.5557.1410.78106.748.6447.6911.6698.1
Latvia13.5621.954.14161.97.1110.052.46141.4
Lithuania21.6929.475.56135.916.7921.865.34130.2
Poland189.77176.8533.3593.2164.94144.8035.4087.8
Romania70.5897.9718.48138.860.2084.8620.75141.0
Slovakia27.6727.425.1799.116.8518.694.57110.9
Slovenia11.3113.312.51117.78.278.802.15106.3
CEE countries465.33530.23100.0113.9379.52408.99100.0107.8
EU (27 countries) *2110.382204.39 104.51743.581771.53 101.6
CEE (%)22.0524.05-21.7723.09-
* Notes (legend): data from 2018 for Eu-27 and Hungary; EU-27 (2007 structure). Source: OECD.Stat [36], retrieved on 15 February 2022.
Table 8. Domestic material consumption of biomass and biomass for food and feed.
CountriesTotal Biomass
(Tons, Millions)
Biomass for Food and Feed
(Tons, Millions)
200820192019 (%)2019/2008 (%)200820192019 (%)2019/2008 (%)
Bulgaria20.0421.886.21109.216.7218.876.52112.9
Czech Rep.22.1423.936.79108.116.7517.656.10105.4
Estonia5.036.481.84128.92.763.511.21127.2
Hungary *40.0738.5710.9496.336.8732.3811.1987.8
Latvia4.195.591.58133.24.804.671.6197.2
Lithuania15.8217.855.06112.812.8714.124.88109.8
Poland172.92140.3839.8381.2152.57116.3740.2276.3
Romania62.6174.1721.04118.554.6964.4022.26117.8
Slovak Rep.22.0818.045.1281.713.0212.804.4298.3
Slovenia5.025.591.59111.43.914.581.58117.1
CEE countries369.92352.47100.0095.3314.96289.35100.0091.9
EU (27 countries) *1565.611510.28 96.513011233.80 94.8
CEE (%)23.6323.34-24.2123.45-
* Notes (legend): data from 2018 for Eu-27 and Hungary; EU-27 (2007 structure). Source: OECD.Stat [36], retrieved on 15 February 2022.
Table 9. Import of biomass and biomass for food and feed.
CountriesTotal Biomass
(Tons, Millions)
Biomass for Food and Feed
(Tons, Millions)
200820192019 (%)2019/2008 (%)200820192019 (%)2019/2008 (%)
Bulgaria3.004.524.18150.72.524.035.04160.0
Czech Republic9.1313.9812.93153.27.4210.5013.12141.4
Estonia2.222.982.76134.51.141.411.76124.1
Hungary *6.4110.089.33157.34.998.0610.07161.4
Latvia2.997.186.64239.91.943.354.19172.5
Lithuania4.297.787.20181.33.104.535.66146.0
Poland24.6134.8532.24141.620.4528.2735.31138.2
Romania7.3112.5511.61171.66.2810.1812.72162.2
Slovakia5.427.587.01139.94.154.956.19119.3
Slovenia5.756.596.09114.64.414.765.95108.1
CEE countries71.11108.08100.00152.056.4180.04100.00141.9
* Notes (legend): data from 2018 for Hungary;. Source: OECD.Stat [36], retrieved on 15 February 2022.
Table 10. Exports of biomass and biomass for food and feed.
CountriesTotal Biomass
(Tons, Millions)
Biomass for Food and Feed
(Tons, Millions)
200820192019 (%)2019/2008 (%)200820192019 (%)2019/2008 (%)
Bulgaria5.1513.487.58261.64.3912.4310.28283.3
Czech Republic20.6632.0918.05155.314.8517.2814.29116.3
Estonia4.188.274.65197.81.252.512.08200.5
Hungary *13.4818.5710.45137.811.7716.5413.68140.5
Latvia9.3616.369.20174.72.315.394.46233.3
Lithuania5.8611.626.54198.23.927.746.40197.4
Poland16.8636.4720.52216.412.3728.4323.52229.8
Romania7.9823.8013.39298.45.5120.4616.93371.2
Slovakia5.599.385.28167.83.825.894.87154.0
Slovenia6.297.724.34122.74.374.223.4996.6
CEE countries95.41177.77100.00186.364.56120.87100.00187.2
* Notes (legend): data from 2018 for Hungary. Source: OECD.Stat [36], retrieved on 15 February 2022.
Table 11. The main biomass indicators in 2019 in ten CEE countries.
Countries Domestic Extraction
Used
Import Domestic Material
Consumption
ExportShare of (Export–Import) in Domestic
Extraction Used (%)
Share of Domestic Material
Consumption in Domestic Extraction Used (%)
Total Biomass (tons, millions)
Bulgaria30.844.5221.8813.4829.170.9
Czech Rep.42.0413.9823.9332.0943.156.9
Estonia11.772.986.488.2744.955.1
Hungary *47.0610.0838.5718.5718.082.0
Latvia14.777.185.5916.3662.237.8
Lithuania21.697.7817.8511.6217.782.3
Poland14234.85140.3836.471.198.9
Romania85.4212.5574.1723.813.286.8
Slovakia19.857.5818.049.389.190.9
Slovenia6.726.595.597.7216.883.2
CEE countries422.15108.08352.47177.7716.583.5
Biomass for food and feed (tons, millions)
Bulgaria27.34.018.912.430.869.1
Czech Rep.24.410.517.717.327.872.3
Estonia4.61.43.52.523.976.3
Hungary40.18.132.416.521.180.7
Latvia6.73.44.75.430.469.7
Lithuania17.34.514.17.718.681.6
Poland116.528.3116.428.40.199.9
Romania74.710.264.420.513.886.2
Slovakia13.75.012.85.96.993.4
Slovenia4.04.84.64.2−13.5114.5
CEE countries329.480.0289.4120.912.487.8
* Notes (legend): data from 2018 for Hungary. Source: OECD.Stat [36], retrieved on 15 February 2022.
Publisher’s Note: MDPI stays neutral with regard to jurisdictional claims in published maps and institutional affiliations.