Article

Phenology, Morphology and Physiology Responses of Deficit Irrigated ‘Koroneiki’ Olive Trees as Affected by Environmental Conditions and Alternate Bearing

1
Energy, Environment and Water Research Center (EEWRC), The Cyprus Institute, Nicosia 2121, Cyprus
2
Postharvest Technology Laboratory, Agricultural Research Institute of Cyprus, Nicosia 1516, Cyprus
3
Departamento Agronomia, Escuela Técnica Superior de Ingeniería Agronómica, University of Seville, 41013 Seville, Spain
*
Author to whom correspondence should be addressed.
Agronomy 2022, 12(4), 879; https://doi.org/10.3390/agronomy12040879
Submission received: 1 March 2022 / Revised: 24 March 2022 / Accepted: 1 April 2022 / Published: 4 April 2022

Abstract

:
Climate change is affecting water resources in the Mediterranean region. In olive orchards, irrigation water use efficiency could be increased by accounting for trees’ alternate bearing behaviour and growth-stage sensitivity to drought. The main objective of this study is to examine olive tree phenology, morphology and physiology in “on” and “off” productive years for the improvement of irrigation scheduling. A regulated (RDI) and a sustained (SDI) deficit irrigation treatment were applied in a ‘Koroneiki’ olive orchard in Cyprus. Flowering occurred on 11 May 2019 and on 27 April 2021, which was caused by the lower temperatures in 2019. The Kc for the irrigation season, computed from daily water balance observations, was 0.37 in 2019 (38% canopy cover) and 0.41 in 2021 (62% canopy cover). Irrigation treatments did not significantly affect plant morphology and stem water potentials. In “on” years, shoot elongation ceased early in the season and stem water potential towards the end of September (−4.0 MPa) was lower than in the “off” year. Stem water potential recovery in the September of the “off” year indicated that irrigation could be less than 35% ETc in early fall. Water savings in RDI were 24–32% in “on” and 48% in “off” years relative to SDI, with no statistically significant effects on olive yields.

1. Introduction

Climate change projections show that annual precipitation totals will decrease in Mediterranean countries [1]. In some Mediterranean areas, limitations on available water amounts are already seen in cultivated plantations, such as olives [2]. Olive trees have been recognized for their capability to withstand water stress by balancing water loss and uptake through morphological and physiological adaptations [3]. The development of smaller diameter xylem vessels has been reported in rainfed olive trees [4]. Anatomic changes reduce embolisms in the xylem vessels caused by increases in water potential gradients between leaves and soil during periods with high evaporative demand and limited soil water [5]. Low leaf water potentials and stomatal conductance [2,6] reduce transpiration [3] and therefore yield [6]. To enhance irrigation water use efficiency and alleviate the impacts of limited water resources on plant growth and production, deficit irrigation practices can be applied [6]. These practices could be evaluated with observations of several plant indicators [7]. Olive trees’ responses to water stress differ according to environments [8], irrigation practices [2] and genetic materials [9]. Therefore, the characterization of environments and agronomic conditions through phenological observations and crop coefficients is important for generalizing the findings of experimental field research.
Apart from the impacts that water deficits may have on olive fruit yield, olive trees are known for their alternate bearing habit, with years of high yield generally referred to as “on” years and years with low or no yield as “off” years. The yield variations result in morphological and physiological differences between years [2,10]. During “on” years, water deficits may considerably affect flowering indices, shoot elongation and bud formation, limiting yields in the following year too. The trees may show less sensitivity to water deficits during the maximum rate of pit hardening and early oil accumulation stages [11,12,13]. Therefore, olive tree water requirements may differ between phenological stages and “on” and “off” years.
The results of water stress can be directly seen in plant morphology, such as flowering indices [14], shoot elongation and fruit growth [8,15]. In the study of Hueso et al. [14], the numbers of flower buds of rainfed and 40% ETc eight-year-old ‘Arbequina’ trees were significantly lower than those of fully irrigated trees. Fully irrigated trees are characterized by the tendency to augment vegetative growth, as was noted in seven-year-old ‘Morisca’ trees grown in Spain. In that study, fully irrigated olive trees had 10 cm longer shoots at the end of the year compared to trees that were only irrigated when stem water potential was below −2 MPa [8]. Gucci et al. [15] found a reduction in fruit volume by 0.1–0.2 cm3 in trees receiving 53% ETc compared to fully irrigated trees. Predawn leaf water potential in this study remained above −1 MPa for fully irrigated trees, while it decreased to −4.5 MPa in deficit irrigated trees around two months after flowering [15]. Thus, plant morphology observations can be used to indicate plant water stress effects.
The effects of water stress on tree physiology can be described by stem water potential observations (Ψs, MPa). Stem water potentials are widely used to understand plant transpiration, which is determined by the vapour difference between leaf and air and regulated by stomata and boundary layer resistances [16]. Under non-limiting soil water conditions and high midday vapour pressure deficits (VPD, kPa), water potential gradients between leaves and soil drive water uptake by the roots [17,18,19]. With the progress of soil drying, large forces are required to break the bonds between soil and water particles. As a result, water potential gradients from roots to leaves are enhanced and stomatal closure is required in order to restrict water loss from the leaves [16,17]. To understand and explain Ψs changes over the irrigation season, the relations between Ψs, soil water content and evaporative demand have been investigated by a number of authors (e.g., Corell et al. [20]; Moriana et al. [2]). In Spain, 18-year-old rainfed ‘Picual’ trees maintained a Ψs around −2 MPa when soil available water was at 50%, while at 0% soil available water Ψs was −8 MPa [2]. Corell et al. [20] found a linear relation between Ψs and VPD in mature ‘Manzanillo’ and ‘Cornicabra’ olive trees irrigated with more than 100% ETc. They reported a Ψs of −0.8 MPa at a VPD of 0.3 kPa and a Ψs of −2.2 MPa when VPD was 3.5 kPa. Although soil moisture and VPD may be used to explain plant growth and physiology changes over the irrigation season, their relations remain difficult to describe.
The size of the tree canopy has a major role in plant–yield relations, as it determines the volume of assimilates that can sustain yield [21]. Fruit yield affects tree physiology, as was shown for ‘Arbequina’ trees grown in Argentina [21] and ‘Morisca’ trees grown in Spain [22]. Approximately five months after full flowering, the Ψs of fully irrigated trees with limited production was above −1.7 MPa, while the Ψs of trees with high production was −2.2 MPa [21,22]. These authors reported that the Ψs of highly productive trees during the irrigation season was around 1 MPa lower when average daily VPD exceeded 3 kPa, compared to days when VPD was below 3 kPa [21] or when irrigation was around 60% ETc [22]. These effects were less apparent in fully irrigated or low-yield trees, indicating the importance of irrigation and fruit yield on olive tree physiology during the year [21,22]. In contrast, Naor et al. [10] found no statistically significant differences in Ψs between visually identified low- and high-yielding 6-year-old ‘Koroneiki’ trees grown in Israel under full irrigation. Thus, a better understanding of the relations between tree water stress, canopy size and yield can contribute to more efficient irrigation.
Year-to-year variation in the occurrence of different plant growth stages, driven by climatic conditions, can be determined with phenological observations [23]. The effect of air temperature on main phenological growth stages can be described using growing degree days (GDDs), which quantify the cumulative heat units above a selected temperature threshold to reach a growth stage [24]. Threshold temperatures are generally obtained by minimizing the difference between GDDs for flowering between years. Different thresholds have been found for olive trees, with the use of aerobiological data, such as 16–18 °C in central Italy [24], 11–12 °C in south Italy [25] and 7 °C in northwest Spain [26]. However, different starting dates and chilling requirements have been used in these studies. The GDD results found in the literature are also affected by other environmental conditions and olive varieties in the investigated area [25,26]. The scientific documentation and analysis of phenological observations and GDDs are important for explaining shifts in phenological growth stages as a result of changing climatic conditions.
Climatic conditions [27], leaf area [28] and crop load determine tree water requirements [29]. Allen et al. [27] recommended a mean annual Kc of 0.65–0.70 for trees with 40–60% canopy cover area. More recently, monthly Kc values for different varieties have been established [30,31]. A Kc of 0.40 was computed for 40% canopy cover ‘Picual’ trees [30] and a Kc of 0.57 for 51% canopy cover ‘Arbequina’ trees for summer months in Spain [31]. Olive tree irrigation amounts should therefore account for the selected variety and the environmental and agronomic conditions of the growing location.
The main objective of this study is to advance our knowledge of olive tree–water relations during different phenological stages and “on” and “off” years in order to improve deficit irrigation scheduling. The hypothesis is that substantial irrigation water savings can be obtained without significant effects on morphological processes and yield when accounting for growth-stage sensitivity to water stress and trees’ alternate bearing behaviour. The specific objectives are: (1) to analyse the effect of two irrigation treatments during two “on” years and one “off” year on (a) flowering indices and fruit set, (b) fruit and shoot growth, (c) stem water potentials and (d) olive yields; (2) to determine the GDD for full flowering and for the maximum rate of pit hardening; (3) to analyse the relations between stem water potential, soil water content and vapour pressure deficit; and (4) to analyse the relations between stem water potential, canopy leaf area and yield.

2. Materials and Methods

2.1. Experimental Site and Irrigation Treatments

The research was conducted on a drip-irrigated, commercial organic olive farm, located at an inland location in Nicosia District in Cyprus. The experimental site and methods are explained in detail by Siakou et al. [32], who analysed the effect of irrigation treatments and harvest dates on olive yield and oil quality during the 2019 season. The field consists of a 0.5 ha area planted with olive trees (Olea europaea cv Koroneiki) at 6 m × 6 m planting distance in a loamy soil. Average canopy cover was 32% in 2019. The soil was not tilled and weeds were mowed three or four times each year and left to dry on the field. Fertilization took place around February each year. In 2018, the farmer applied a total of 211 mm irrigation from April to November, at 10–12 day intervals, which, together with 140 mm rain, fulfilled approximately 56% ETc. The experiment started in 2019 when a sustained (SDI) and a regulated (RDI) deficit irrigation treatment were applied to the field in weekly applications. The crop season began on 1 March each year (with initial shoot appearance) and ended on 28 February of the next year.
In “on” years, sustained deficit irrigation supplied 70% ETc during the irrigation season, whereas RDI provided the trees with 70% ETc at drought-sensitive stages (flowering, bud induction by the end of the pit hardening stage) and 35% ETc at drought-tolerant stages (maximum rate of pit hardening and oil accumulation) [33]. In the “off” year (2020), the RDI treatment received 35% ETc during the full season. A description of the three phenological growth periods [34] used for analysing water balance components and plant observations and the percentage of ETc applied in each treatment are presented in Table 1.
As no fruit growth was observed in 2020, approximately the same growth periods as in 2019 were used for comparisons between the “on” and the “off” years. In 2021, all the main phenological stages occurred approximately 2 weeks earlier than in 2019 (Section 3.2). To avoid large soil water content differences, Mondays were used as the starting day for the water balance computations of different growth periods and Sundays as the end of the periods (irrigation every Tuesday).
A complete randomized design was used with five replicate plots for each of the two deficit irrigation treatments. Each plot consisted of three irrigation lines with 6–7 trees. Three trees located in the middle irrigation line in each plot were used for plant measurements (15 trees per treatment). Volumetric soil water content (VSWC, %) was recorded hourly in the rootzone of three neighbouring trees in two replicate plots per treatment (6 trees per treatment). Volumetric soil water content sensors (5TM, Decagon, USA and SMT100, Truebner, Germany) were placed approximately 1 m from the tree trunk at 10, 20, 40 and 60 cm depths.
Temperature, relative humidity and wind speed were recorded at 10 min intervals with a meteorological station (Lufft WS500) located in the orchard, while precipitation was recorded with a tipping bucket rain gauge (Lambrecht 15189) at 5 min intervals. Irrigation needs were calculated using a Kc of 0.40 [32] and the reference evapotranspiration (ETo), which was computed from the meteorological data of the previous week with the Penman–Monteith equation [27]. Vapour pressure deficit (VPD, kPa) was calculated based on Allen et al. [27], using meteorological data from 10:00 to 13:00 on physiology measurement days (see Section 2.3).

2.2. Growing Degree Days, Flowering and Pit Hardening

The accumulated growing degree days (GDDs, °C days) to reach full flowering and the maximum rate of pit hardening were calculated based on McMaster and Wilhelm [35] as:
GDDs = Σ[(Tmax + Tmin)/2 − Tthr] = Σ(Tmean − Tthr) for Tmean > Tthr
where Tmax is the daily maximum air temperature (°C), Tmin is the daily minimum air temperature (°C) and Tthr is the threshold temperature (°C). Calculation of the accumulated heat units began in January and tested threshold temperatures between 5–15 °C, following Pérez-López et al. [36] and Orlandi et al. [25]. Estimation of GDDs to flowering and maximum rate of pit hardening were made for two “on” years, 2019 and 2021.
Olive tree flowering observations were based on Oteros et al. [37] and were made twice weekly on the four azimuthal directions of 15 trees for each treatment. Flowering date was assumed when the average number of open flowers exceeded the number of swollen buds in the trees in each treatment. The maximum rate of pit hardening was assumed to be the time that average fruit longitudinal diameters remained constant for approximately two weeks after the initial, fast fruit development [38]. Following Rapoport et al. [38], the pit-hardening stage may last approximately 50–60 days, with the maximum rate of pit hardening starting around 30 days after the initial appearance of this stage and taking around 20–30 days to complete.

2.3. Fruit Set, Plant Morphology and Physiological Observations

After the first flower buds had opened, their number was counted on four 15 cm long branches located at the four azimuthal directions in 15 trees per treatment (five replicate plots). By the end of flowering, fruit set was defined as the percentage of fruits developed relative to the number of flowers counted at flowering. Fruit numbers in each of the labelled branches were counted monthly until harvesting. In 2019 and 2021 (“on” years), longitudinal (L, cm) and equatorial (W, cm) diameters of 10 randomly selected olive fruits per tree, located 1.5 to 2.0 m above the ground, were measured with a digital calliper. Fruit volume (V, cm3) was calculated, following Rapoport et al. [38], as:
V = 4/3π × L/2 × (W/2)2
Shoot elongation was measured in four labelled shoots of 0.1–0.2 cm located at the four azimuthal directions of the trees every two to three weeks starting in April, each year. All labelled shoots were positioned at the mid-canopy, around 1.5–2.0 m from the ground. All morphology measurements were taken in 15 trees per treatment (five replicate plots).
Midday stem water potential was measured weekly or biweekly using a pressure chamber (1505D, PMS Instruments, Albany, OR, USA). Stem water potential was measured in all trees with soil water content sensors, one day before irrigation and two days after irrigation. On the day before irrigation, Ψs was also measured on two additional trees in each of the remaining three replicate plots per treatment, resulting in a total of 12 trees per treatment. Two days after irrigation, one tree from each of the remaining three replicate plots per treatment was measured (a total of nine trees per treatment). A single leaf, in each of the selected trees, located near the main trunk was covered with aluminium foil for two hours before the measurement in order to equilibrate [6]. The measurements were completed in around 30–50 min between 12:00 and 14:00 h.

2.4. Yield, Irrigation Water Productivity and Canopy Leaf Area

Total yield for each of the monitored trees was obtained during the final harvest (mechanical with brushes) on 15–22 January 2020 and 17 January 2022. Irrigation water productivity (WPi, kg m−3) was computed as the average fruit yield of five replicate plots divided by the average irrigation volume of the plots, for each treatment, following Fernández et al. [39]. Leaf area index (LAI, m2 m−2) was measured with a plant canopy analyser (LAI–2200C, LI–COR Biosciences, Lincoln, NE, USA). Observations were obtained on 10 January 2020, from 7:00–7:30 am, and on 23 September 2021, from 11:00 to 12:00 [40]. Two optical LAI–2250 sensors were used, one for above and one for below plant canopy measurements. The measurements were made at approximately 20 cm below the plant canopy, close to the tree trunk. A view cap of 90° was used to block the tree trunk from the sensor’s field of view. Measurements were made at the four azimuthal directions of the tree. Canopy cover areas (CA, m2) were extracted from 2D aerial images, obtained with an Unmanned Aerial Vehicle’s (Inspire 2 with Zenmuse X4S camera, DJI, Shenzhen, China) flight over the field on 17 December, 2019. The methods used for the aerial image acquisition and processing are described by Siakou et al. [32]. Canopy area measurements were also made on 17 January 2022 by measuring the distance from the tree trunk to the edge of the canopy in the four azimuthal directions. The canopy area was used in the water balance computations for the 2019–2021 irrigation seasons and together with the leaf area index (CA x LAI) to explore relations between canopy leaf area and Ψs or yield (see Section 2.5).

2.5. Statistical Analysis

Stem water potential, fruit growth, shoot elongation, flower and fruit numbers of each treatment and measurement date were tested for normality using the Shapiro–Wilk test with a 95% confidence interval. Irrigation treatment effects were analysed for statistically significant differences (α = 0.05) for each measurement date, using the independent-samples t-test. For the few cases where data were not normally distributed, the two-sample Kolmogorov–Smirnov test was used. Plant measurements are presented as means and standard errors of five replicate plots for each irrigation treatment.
Multiple linear regression analysis was used to identify the statistical significance (α < 0.05) of the relation between Ψs and soil water content and VPD, for each year, growth period and irrigation treatment (six models per year). For each observation date of the analysis, the mean Ψs of five replicate plots in each treatment and the mean soil water content of six trees, located in two replicate plots per treatment, were used.
Yields of all monitored trees in each treatment (15 trees) were plotted against the canopy leaf areas of the 2019 and 2021 crop seasons. The median Ψs observed during Periods 2 and 3 of the six trees with soil water content sensors in each treatment were plotted against canopy leaf areas and yields of 2019 and 2021. A principal component analysis (PCA) was carried out for the Ψs and VSWC (medians) of Periods 1–3 and the canopy leaf area and yield for the 12 trees with soil water content sensors for 2019 and 2021. Statistical analysis was performed with SPSS statistical software (IBM Corp., Armonk, NY, USA).

3. Results and Discussion

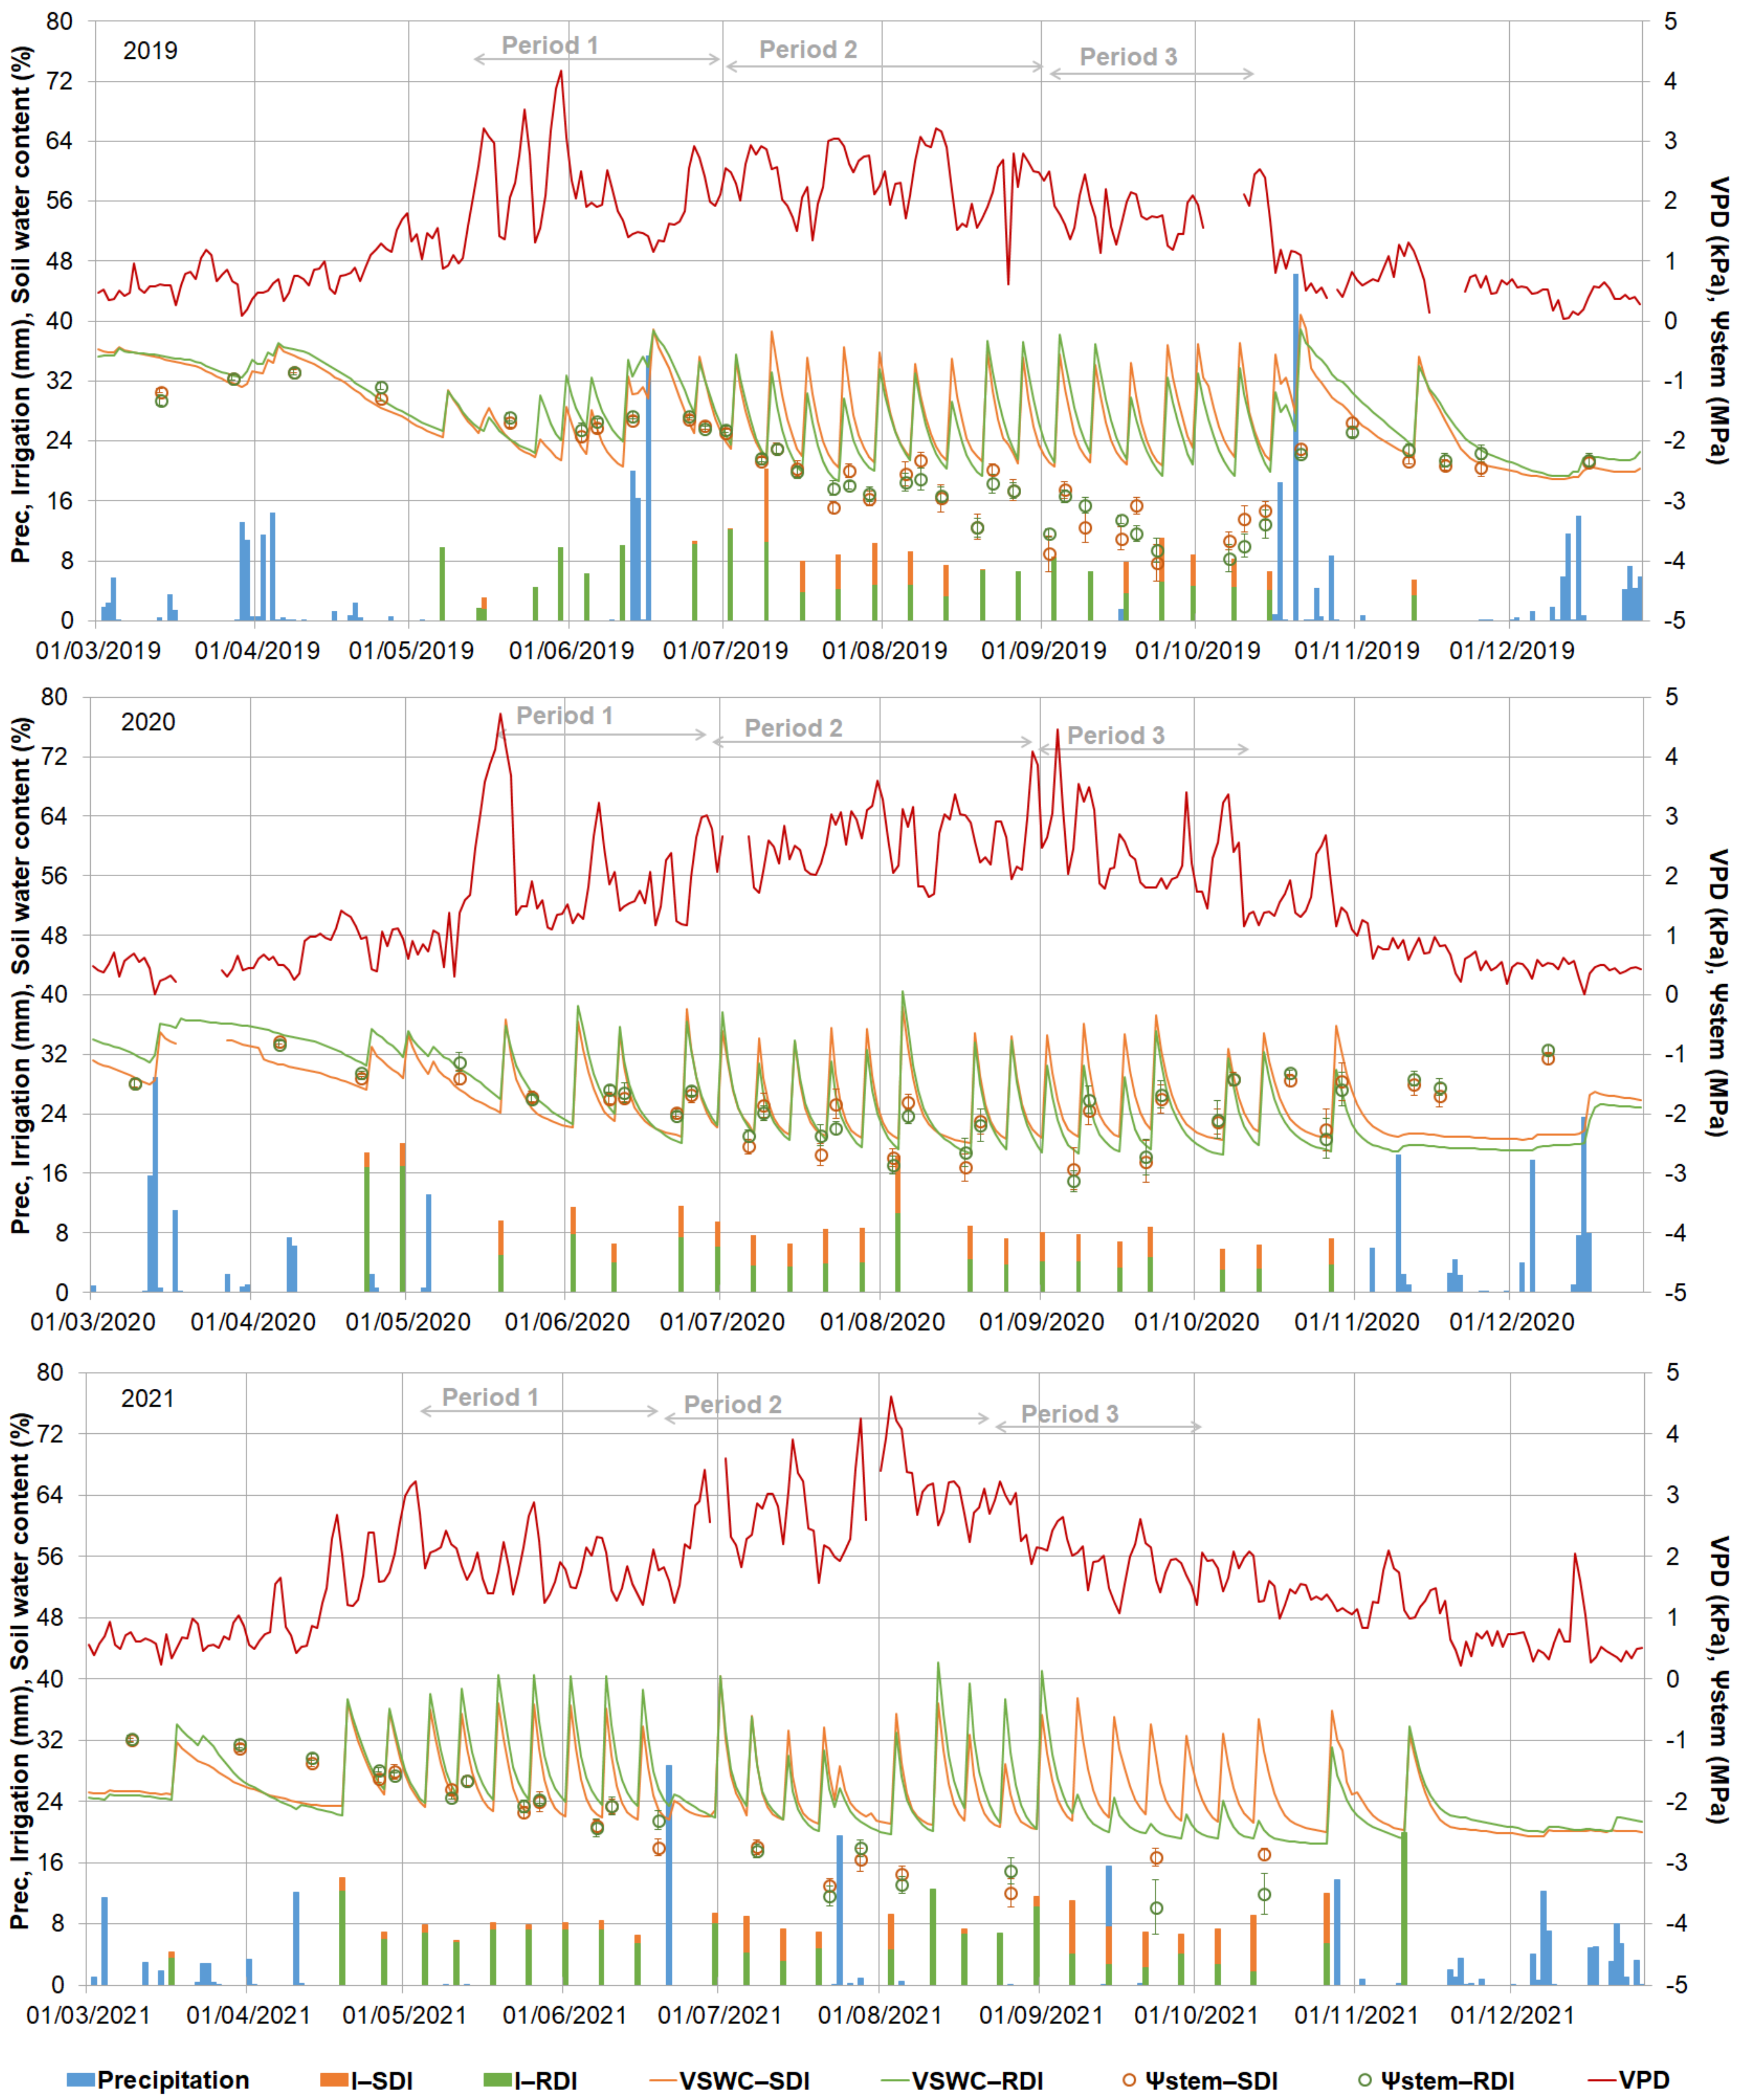
3.1. Environmental Conditions and Irrigation Monitoring

An overview of precipitation, irrigation, VPD, VSWC and Ψs during 2019, 2020 and 2021 is presented in Figure 1. Precipitation was 565 mm in 2019, 318 mm in 2020 and 202 mm in 2021 (see monthly meteorological data in Appendix A, Table A1). The long-term average annual rainfall (1980–2010) for the site is 340 mm [41]. For Periods 1–3, total precipitation was similar in “on” years (74 and 67 mm) and was absent in the “off” year. Total water savings in RDI, relative to SDI, were 32% during the 2019 irrigation season, 48% during the 2020 season and 24% during the 2021 season. The water balance components for the three phenologically based periods during the irrigation seasons of the three monitoring years are summarized in Table 2.
Average VSWC of the 70 cm rootzone of the SDI trees was lower than that of the RDI trees (VSWCSDI = 26–27%, VSWCRDI = 28–30%) before irrigation treatments started in Period 1 in all monitored years (Figure 1). This was mainly due to low soil moisture contents at 40 and 60 cm depths for three of the six SDI trees, most likely caused by soil heterogeneity. When 35% ETc was applied to the RDI trees in Periods 2 and 3, VSWC was slightly lower in the RDI treatment (VSWCRDI = 23–26%) than in the SDI treatment (VSWCSDI = 24–29%) for the three years. The difference in VSWC between SDI and RDI trees in Period 3 was larger in 2021 than in 2019, which may have been due to problems with low water pressure in the irrigation system. This may have been caused by the higher variability in Ψs of the RDI trees in September compared to the SDI trees.
In all three years, Ψs measurements (Figure 1) were not significantly different (p > 0.05) between irrigation treatments. Irrigation amounts in Period 1 of the three years were less than 70% ETc in both treatments due to the high average VSWC ( > 26%). These effects can be more clearly seen in the minimum Ψs of the treatments, which was higher or equal to −2.8 MPa during that period (Table 2). After the start of the maximum rate of pit hardening (25 June, 2019), Ψs of the SDI treatment slowly decreased to a minimum Ψs of −3.4 MPa (2019) and −3.5 MPa (2021) in the “on” years and −2.9 MPa in the “off” year (2020). The difference in minimum Ψs is unlikely to be due to evaporative demand because VPD at the time of these measurements was 2.4 kPa in 2019, 1.6 kPa in 2021 and 4.9 kPa in 2020.
Minimum Ψs in Period 3 was −4.0 MPa on 23 September 2019 (Figure 1, Table 2) in SDI, although irrigation amounts were near the 70% ETc requirement (VPD = 2.3 kPa). By 31 October 2019, the Ψs of the trees recovered to −1.7 MPa after 81 mm rain. During the same period in the “off” year, the Ψs of the SDI treatment recovered (−2.8 MPa) on 21 September before the start of the rainfall (4 November), while the VPD at the time of measurement was 2.8 kPa. Stem water potential reached −1.5 MPa in November 2020 after 28 mm of rainfall (VPD = 1 kPa). In Period 3 of 2021, minimum Ψs was −2.9 MPa in the SDI and −3.7 MPa in the RDI treatment on 23 of September. This difference between treatments was not significant (p = 0.109) due to the high variability observed in the Ψs of the RDI trees (−5.1 MPa < Ψs < −2.5 MPa). Overall, the less negative Ψs observed by September in the “off” year compared to the “on” years may indicate low water demand and therefore irrigation needs (<35% ETc) of the trees. These findings are similar to those reported by Bustan et al. [29], who reported a 30% higher ETa in over-irrigated trees that did not receive fruit thinning compared to thinned trees, in a lysimeter experiment. Similarly low Ψs values during the fruit growth period were recorded by Martín-Vertedor et al. [22]. These authors found a minimum Ψs of −4 MPa in September in fully productive rainfed trees, while the minimum Ψs remained above −2 MPa in fully productive and non–productive trees under 75% ETc irrigation.
The Kc for the irrigation season (including irrigation days) of the SDI treatment was 0.39 in 2020 and 0.41 in 2021 (canopy cover of 62%). This is close to the Kc of 0.37 obtained for the 2019 irrigation season (canopy cover 38%) [32]. The Kc was derived by minimizing the sum of the daily water balance errors (bias) for days without rainfall and without soil moisture stress for each irrigation season. The Kc in Period 1 ranged between 0.29 and 0.32 for the three years (Table 2). The Kc during Period 3 in the SDI treatment was similar in 2019 and 2020 (0.38–0.41) but higher in 2021 (0.52), which could have been due to the increase in canopy cover and a 16 mm rainfall observed on an irrigation day (8 mm). These Kc values are lower than the Kc values of 0.48 in August and 0.65 for the irrigation season in “Nocellara del Belice” trees with 35% canopy cover grown in Italy reported by Cammalleri et al. [42]. However, these authors included evaporation losses from wet soils after irrigation or rainfall in the Kc computation by applying the dual crop coefficient approach. The transpiration of the trees was estimated from sap flow measurements [42].

3.2. Growing Degree Days, Flowering and Fruit Set

Full flowering occurred on 11 May 2019, while it was observed 14 days earlier in 2021, on 27 April 2021. The calculated GGDs until flowering and the start of the maximum rate of pit hardening are summarised in Table 3. The smallest differences between the calculated GDDs of the two years were found using a threshold temperature of 8 or 14 °C for flowering and 14 °C for maximum rate of pit hardening. Long-term monitoring is needed to reduce the uncertainty of these temperature thresholds. The months from January to April were wetter in 2019 (334 mm) than in 2021 (78 mm), and monthly average daily mean temperatures during those months ranged between 9 and 15 °C in 2019 and between 11 and 17 °C in 2021. Therefore, the observed shift in flowering and maximum rate of pit hardening between 2019 and 2021 may have resulted from the wetter spring in 2019 and the approximately 2 °C difference in monthly mean temperatures from January to April. This shift in flowering may have affected olive ripening too, considering that average monthly temperature was similar in both years from May to November (24 °C), although rainfall for this period in 2019 (141 mm) was two times the rainfall in 2021 (69 mm). The maturity index was 1.4 (optimum quality) on 3 December 2019, while the maturity index on 2 December 2021 was 2.4.
The threshold temperatures fall within the range of 7 °C in northwestern Spain [26] and 16 °C in central Italy [24] reported in the literature. The GDDs computed using a threshold temperature of 5 °C are close to the 890 °C days reported by Pérez-López et al. [36], but the difference in GDDs between the two years with a 5 °C threshold is higher than with a threshold of 8 °C.
Flower and fruit numbers as well as fruit set percentage are presented in Table 4. Although the low rainfall before flowering and the higher mean monthly temperatures delayed flowering in 2021 compared to 2019, flower numbers were not affected (Table 4). All trees received the same irrigation amount in 2018 and, as expected, there were no statistically significant differences in flowers (p = 0.18) and fruit numbers (p = 0.86) between treatments in 2019. However, there were still no statistically significant differences in flowers (p = 0.44) and fruit numbers (p = 0.41) between irrigation treatments in 2021 after a constant 70% ETc (SDI) and 35% ETc (RDI) were applied to the trees during the “off” year. Orlandi et al. [25] found that water stress could severely affect the development of flowers. This was not the case in the current study, most likely because soil moisture remained above the water stress threshold for most of March and April.
Girón et al. [43] also reported that deficit irrigation application during the maximum rate of pit hardening did not affect flower numbers the following year. On the contrary, studies conducted in Chili and Spain [14,44] reported that Ψs values between −1.4 and −2.2 MPa during full flowering and fruit set of young ‘Arbequina’ olive trees could decrease fruit yield. However, in both “on” years in the current study, Ψs at flowering was around −2 MPa (Figure 1), with a similar fruit set observed in “on” years.

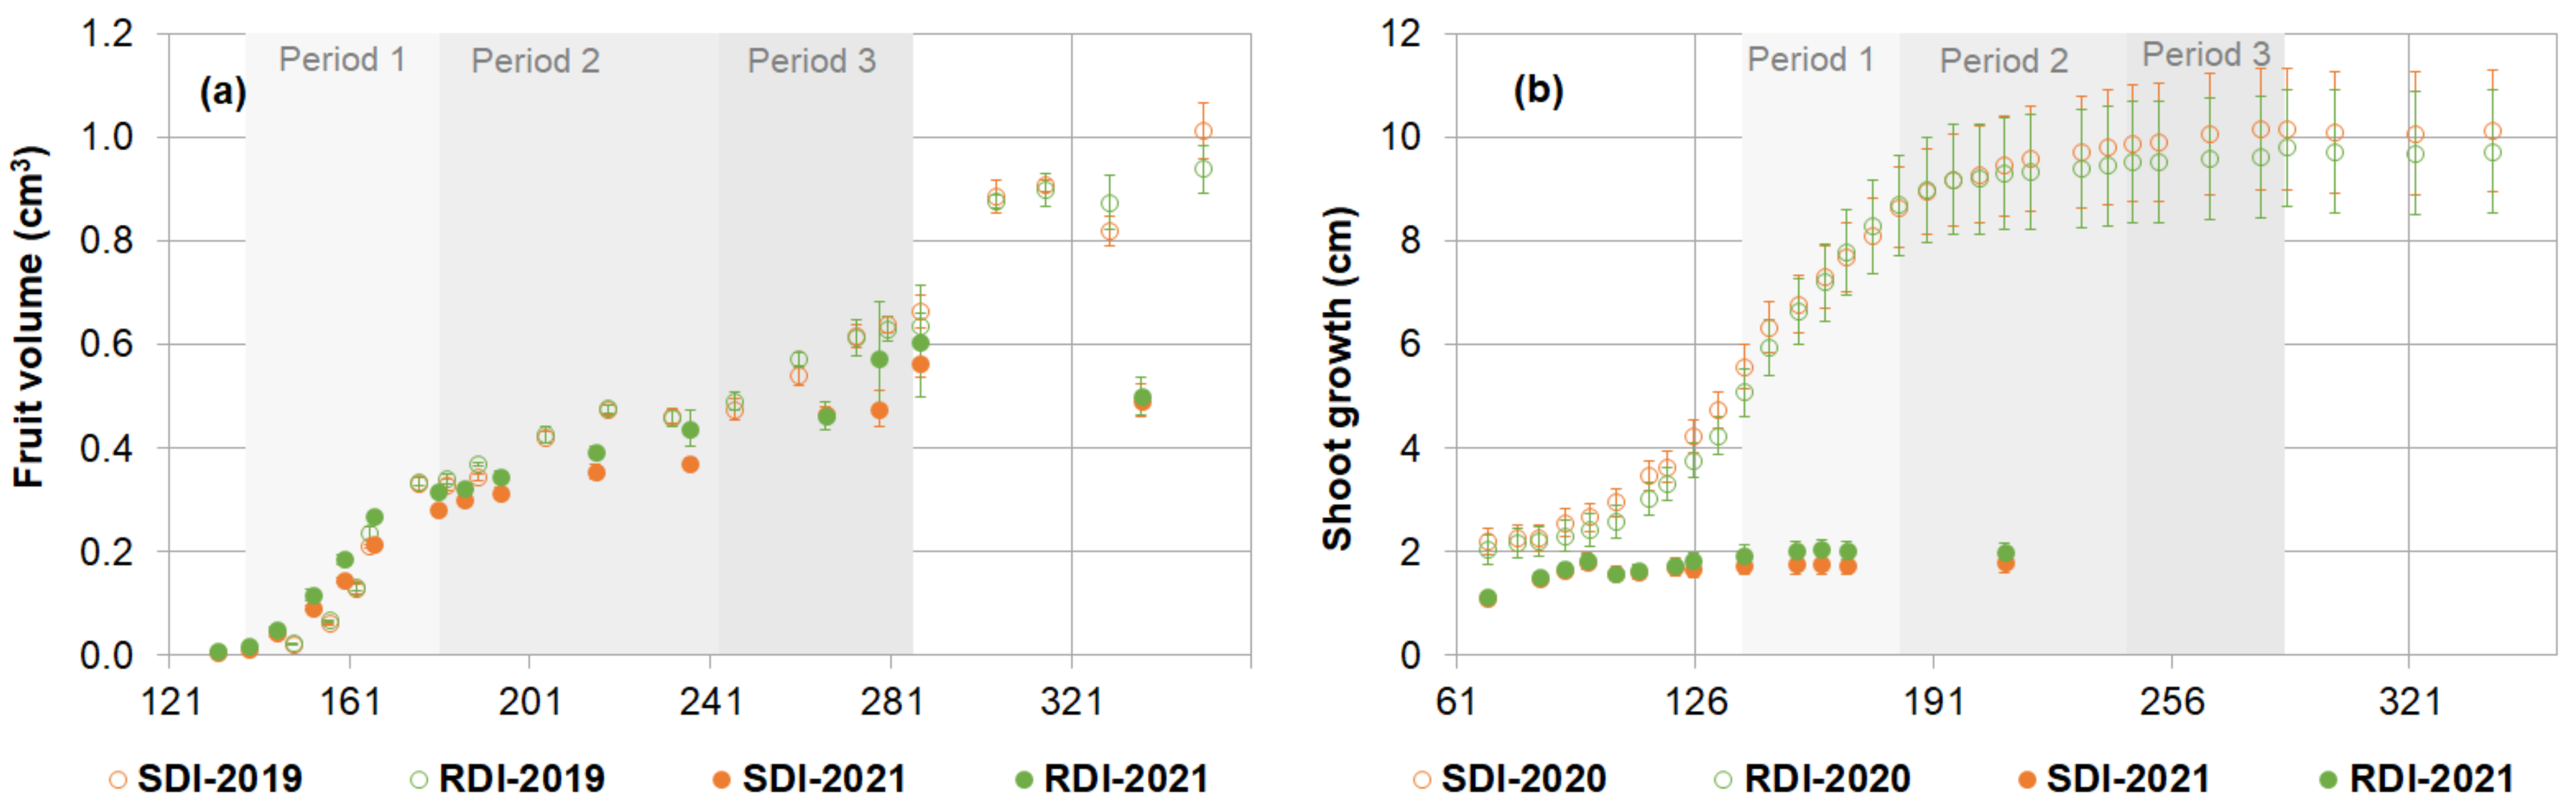
3.3. Plant Morphology

Fruit growth in 2019 and 2021 and shoot elongation in 2020 and 2021 are shown in Figure 2. There were no statistically significant differences (p > 0.05) in fruit volume or in shoot length between the two irrigation treatments. Fruit growth began approximately 10 days after full flowering (see Section 3.2). Shoot elongation in 2019 was limited, with the average shoot length remaining around 1 cm. In 2021, 32–33% of the labelled shoots in both irrigation treatments turned into inflorescences by 05 April 2021. During “on” years, shoot elongation ceased around the flowering or maximum rate of the pit hardening stage. This was most likely due to the assimilate demand for flower formation and fruit growth, as described for well-watered 4-year-old ‘Barnea’ and ‘Coratina’ trees grown in Israel [29,45] and 9-year-old ‘Arauco’ trees grown in Argentina [46], where fruits were manually thinned.
Fruit growth was fast early in the irrigation season and until the estimated start of the maximum rate of pit hardening (25 June 2019, 20 June 2021). Fast fruit growth was again observed in mid-October only in 2019 as a result of rainfall and a decrease in VPD from 2 to 0.5 kPa from early to mid-October. Fruit final volume by the end of November was smaller in 2021 than in 2019, most probably because of the little rainfall observed in October and November of 2021 (22 mm) compared to 82 mm in 2019. Girón et al. [43] found that the pattern of fruit growth was similar in fully irrigated 44-year-old ‘Manzanillo’ trees and trees where irrigation was withdrawn at the maximum rate of pit hardening in Spain, even though their Ψs values after the treatments began were significantly different.
Fast elongation of the shoots was observed from March until June 2020, while the rate of elongation slowed down by early July (Ψs = −2.0 MPa). Final shoot length was observed by the end of August (Ψs > −3 MPa). Morphology measurements in “off” years indicate that irrigation may be less important by September due to the absence of fruits and the already elongated shoots. These results are in line with the Ψs observations presented in Section 3.1. A similar result was found by Moriana et al. [2], who examined the trunk growth rate of productive and non-productive trees. These authors reported a constant trunk growth rate in non-productive trees until the end of the irrigation season. In fully and deficit-irrigated productive trees trunk growth stopped in early May, although the Ψs was still around −2 MPa [2].

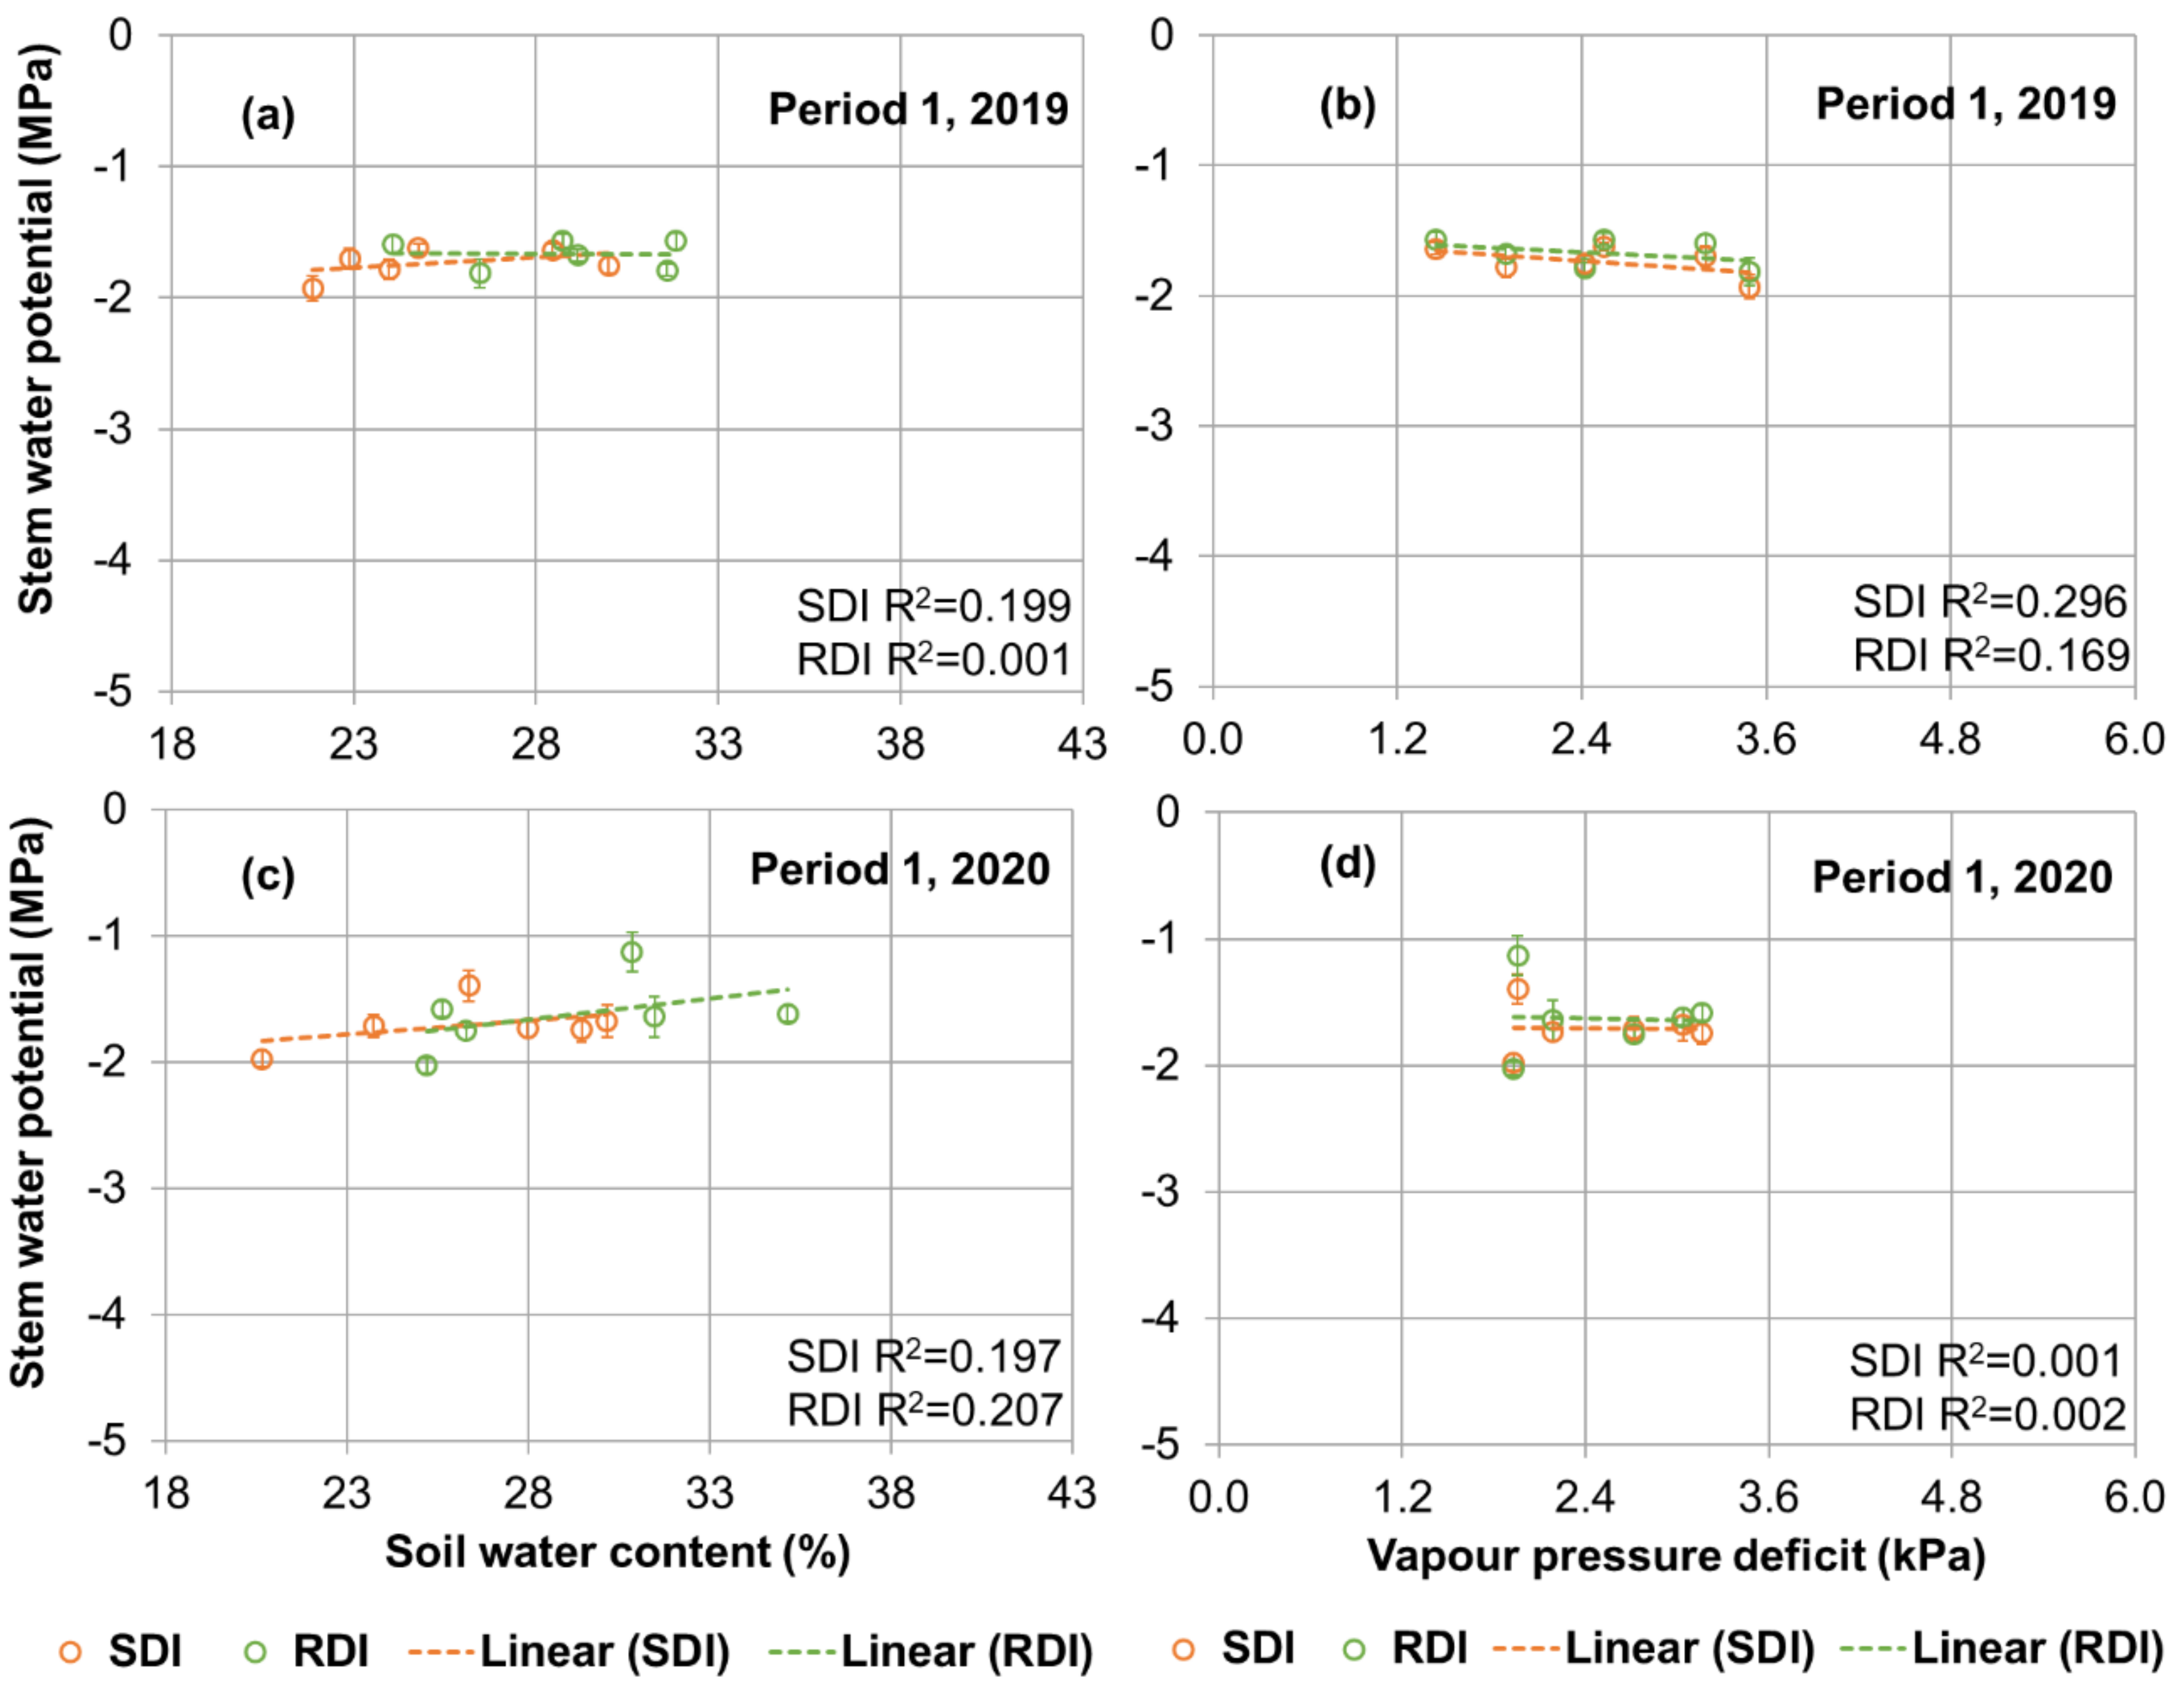
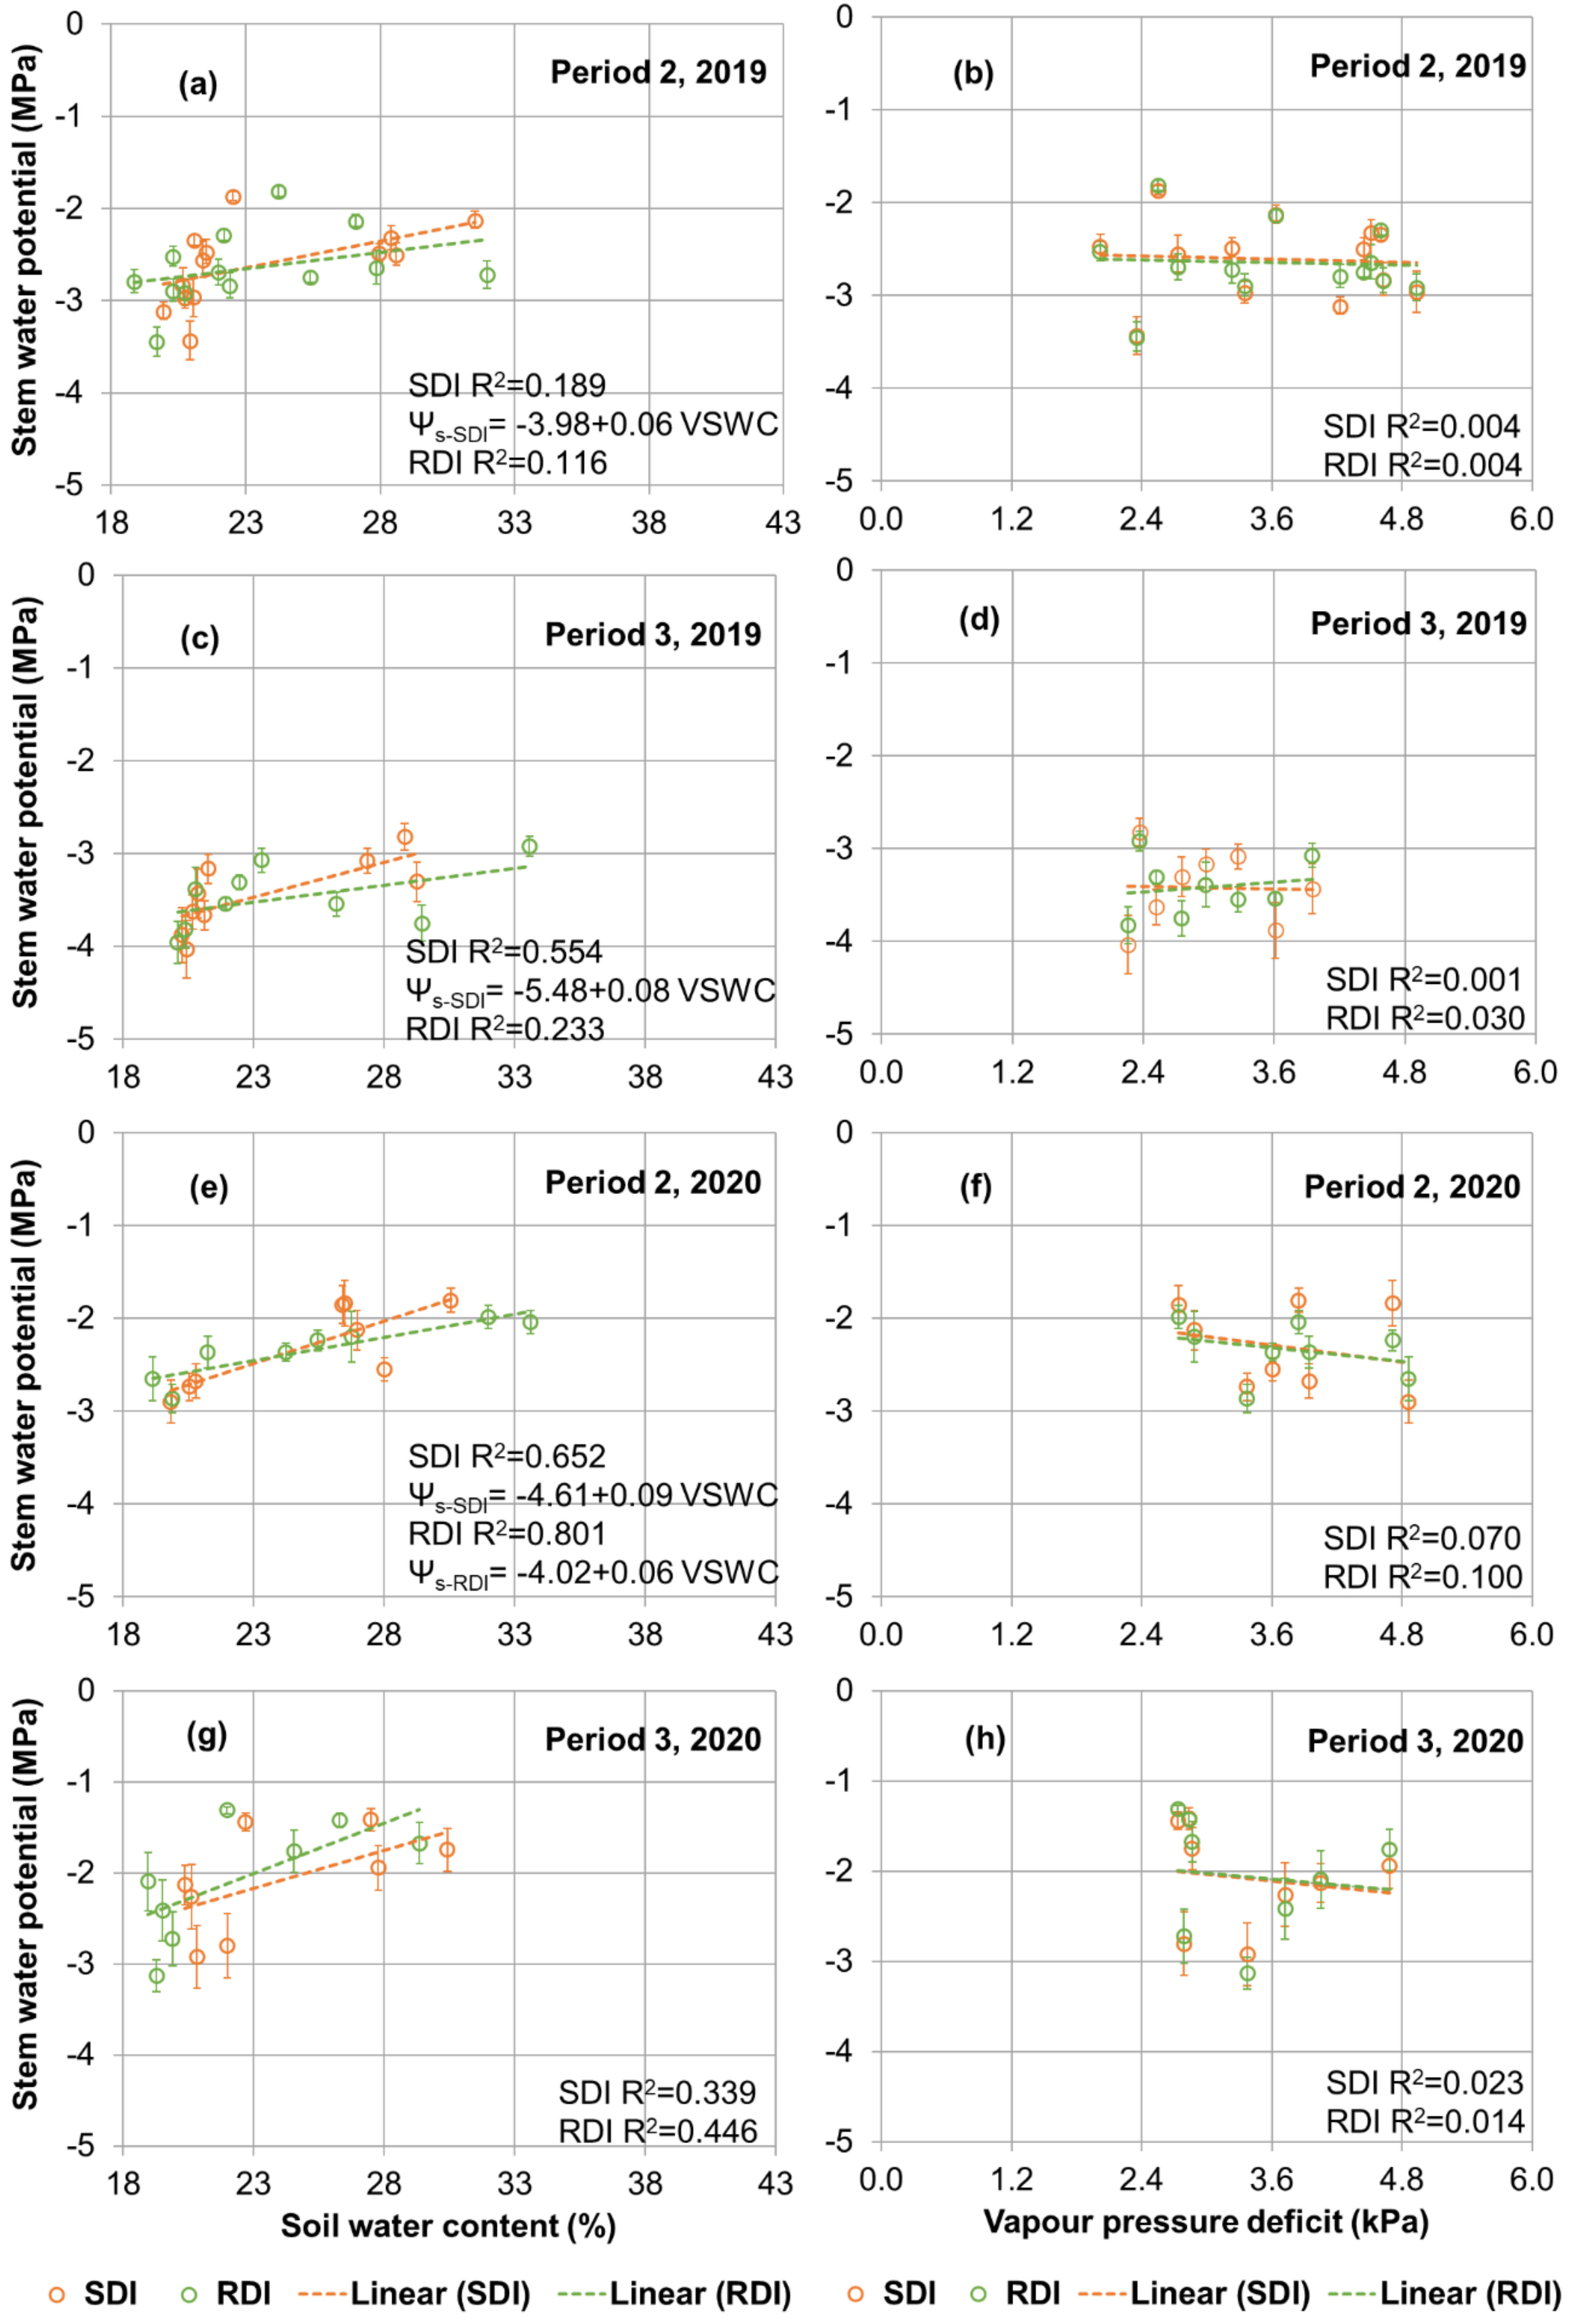
3.4. Plant Physiology

The relations between Ψs, VSWC and VPD analysed with multiple linear regression models are shown in Table 5 and Figure 3 and Figure 4. Soil water content did not affect Ψs during Period 1 of the monitored years, with minimum Ψs of −2.1 MPa, although there was high variation in VSWC (Figure 3a,c) and VPD (Figure 3b,d). The less negative Ψs observed in the trees early in the irrigation season may indicate that hydraulic conductivity and stomatal conductance were high, probably due to the low VPD, as reported by Diaz Espejo et al. [5].
The VSWC was found to have a statistically significant effect on Ψs during Periods 2 and 3 in 2019 for the SDI treatment only. This can also be seen by the higher coefficients of determination (R2) for SDI than for RDI in Figure 4a,c (missing VPD values on 07 October 2019). This is most likely due to the higher variations in the VSWC of the RDI treatments. A significant relation between Ψs, VSWC and VPD in the RDI treatment was found during Period 2 in 2020 (eq. Ψs = −4.02 + 0.06 VSWC + 0.05 VPD). At the same time, the Ψs values for both treatments were significantly affected by the VSWC (Table 5, Figure 4e), while VPD had a relatively limited effect on Ψs (Figure 4f). The lower minimum Ψs observed in Period 3 (−3.9 MPa) of 2019, when the average VSWC was 27% and VPD was 1.8 kPa compared to 2020 (Ψs = −3.0 MPa, VSWC = 24%, VPD = 2.4 kPa) shows the impact of fruit development on water uptake (Figure 4a,c). In Period 3 of 2020, the minimum Ψs of both treatments did not decrease below −3.0 MPa even when VSWC was near 19%. The opposite was observed in “on” years, when Ψs was less than −3 MPa even when VSWC was close to field capacity. The R2 between VSWC and Ψs was 0.34 for SDI and 0.45 for RDI during Period 3 of 2020 (Figure 4g). However, these relations were not statistically significant. No significant relations were found in 2021.
The VPD did not have an effect on Ψs during most of the analysed periods, which is in contrast to Corell et al. [20], who found a good relation between Ψs and average daily VPD (R2 = 0.68) in three orchard locations in Spain. However, in the current study trees are under deficit irrigation, whereas Corell et al. [20] analysed fully irrigated olive trees. Even though VPD did not show a good relation to Ψs, the increase in VPD and evapotranspiration over the season (across the three periods) together with the reduction in VSWC could be responsible for the progressive decline in Ψs. Diaz-Espejo et al. [5] reported that stomatal conductance and transpiration become high under increasing VPD conditions. As a result, water uptake and loss are not balanced and leaf water potentials become more negative [5]. Contrary to the results of the current study, Ben-Gal et al. [47] found that productive 4-year-old ‘Barnea’ and ‘Souri’ trees grown in Israel had lower Ψs (−4.5 MPa) with 30% ETc than with 75% ETc (−3 MPa) irrigation treatments in September. This could have been related to the differences in the varieties and in the age of the trees.
Stem water potentials presented in the current study are clearly lower than the values reported by Moriana et al. [8] for fully or deficit-irrigated olive trees grown in Spain, where Ψs for deficit irrigation was kept above −1.2 MPa early in the irrigation season and above −1.4 MPa, from pit hardening until the end of the irrigation season. These authors used a different Ψs for pit hardening since it was not possible to maintain it above −1.2 MPa in summer. Martín-Vertedor et al. [22] reported a minimum Ψs of −2 MPa in July and September for deficit–irrigated (60% ETc) productive and non-productive trees in southwest Spain.
Overall, olive trees have the potential to control stomatal conductance and therefore cell turgor and keep a balance between water uptake by the roots and plant transpiration under drought conditions. This way, the trees maintain sap movement in the xylem system and limit cavitation in the vessels [3,5]. Olive trees were characterized by high resistance to xylem cavitation compared to other plants [5]. Ennajeh et al. [3] found that two-year-old potted ‘Chemlali’ trees were able to sustain photosynthesis at leaf water potentials of −6 MPa, although stomatal conductance and transpiration became progressively lower. Morphological adaptations, such as small leaf sizes [48] and small diameter xylem vessels, limit water loss from leaves to the atmosphere [4]. In the study of Rossi et al. [4], rainfed olive trees under conditions of limited water availability formed approximately twice the number of small diameter xylem vessels (< 20 μm) compared to irrigated trees in order to avoid xylem cavitation and hydraulic failure.

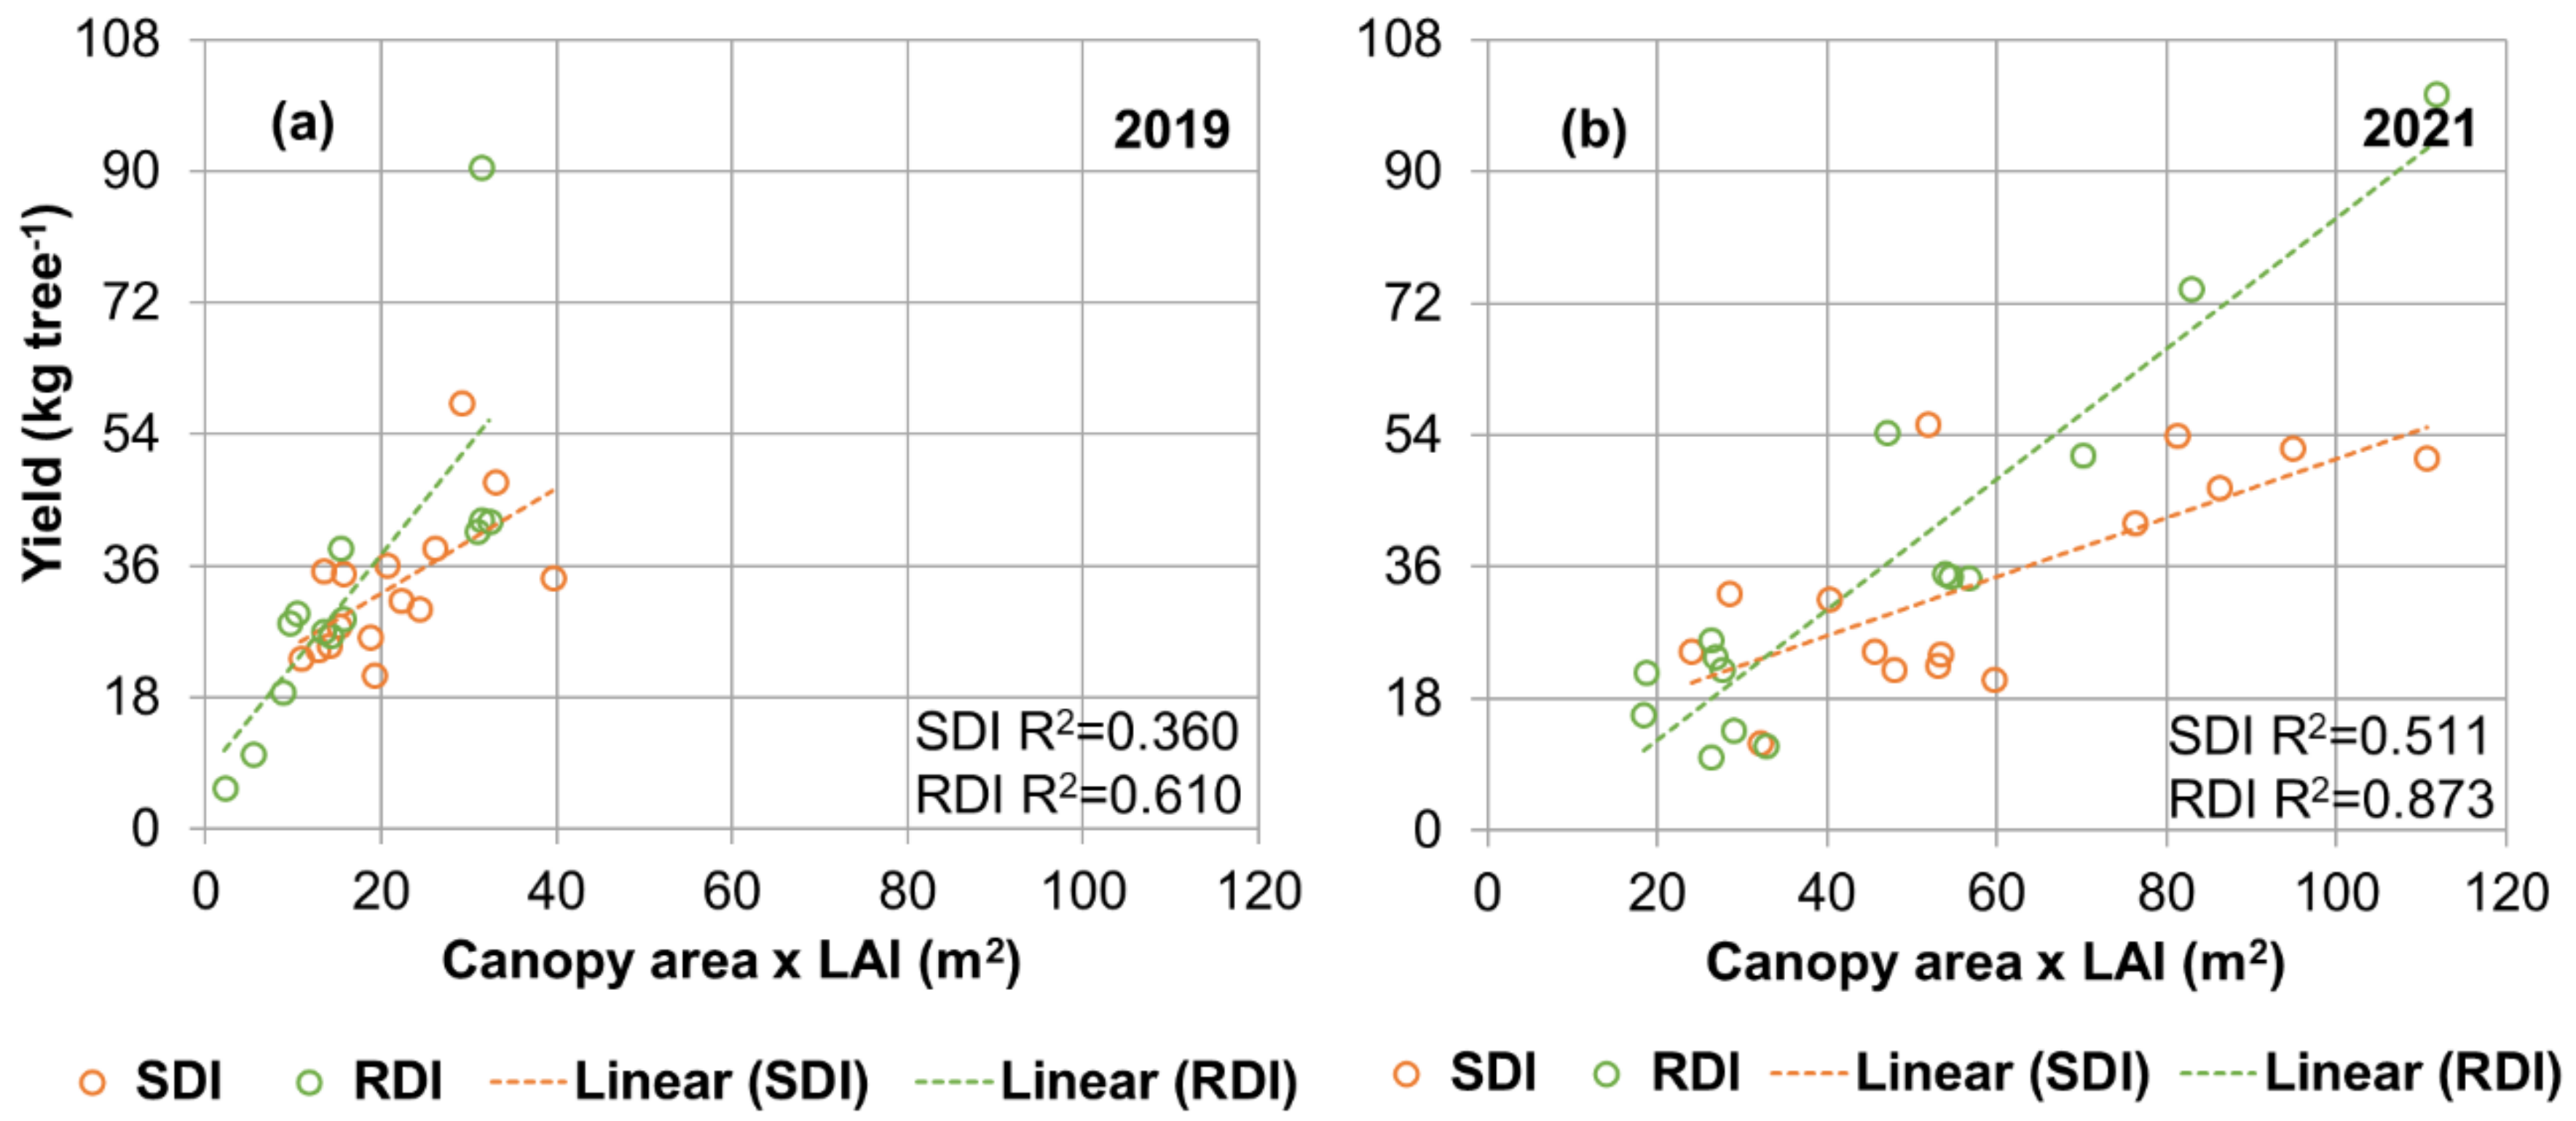
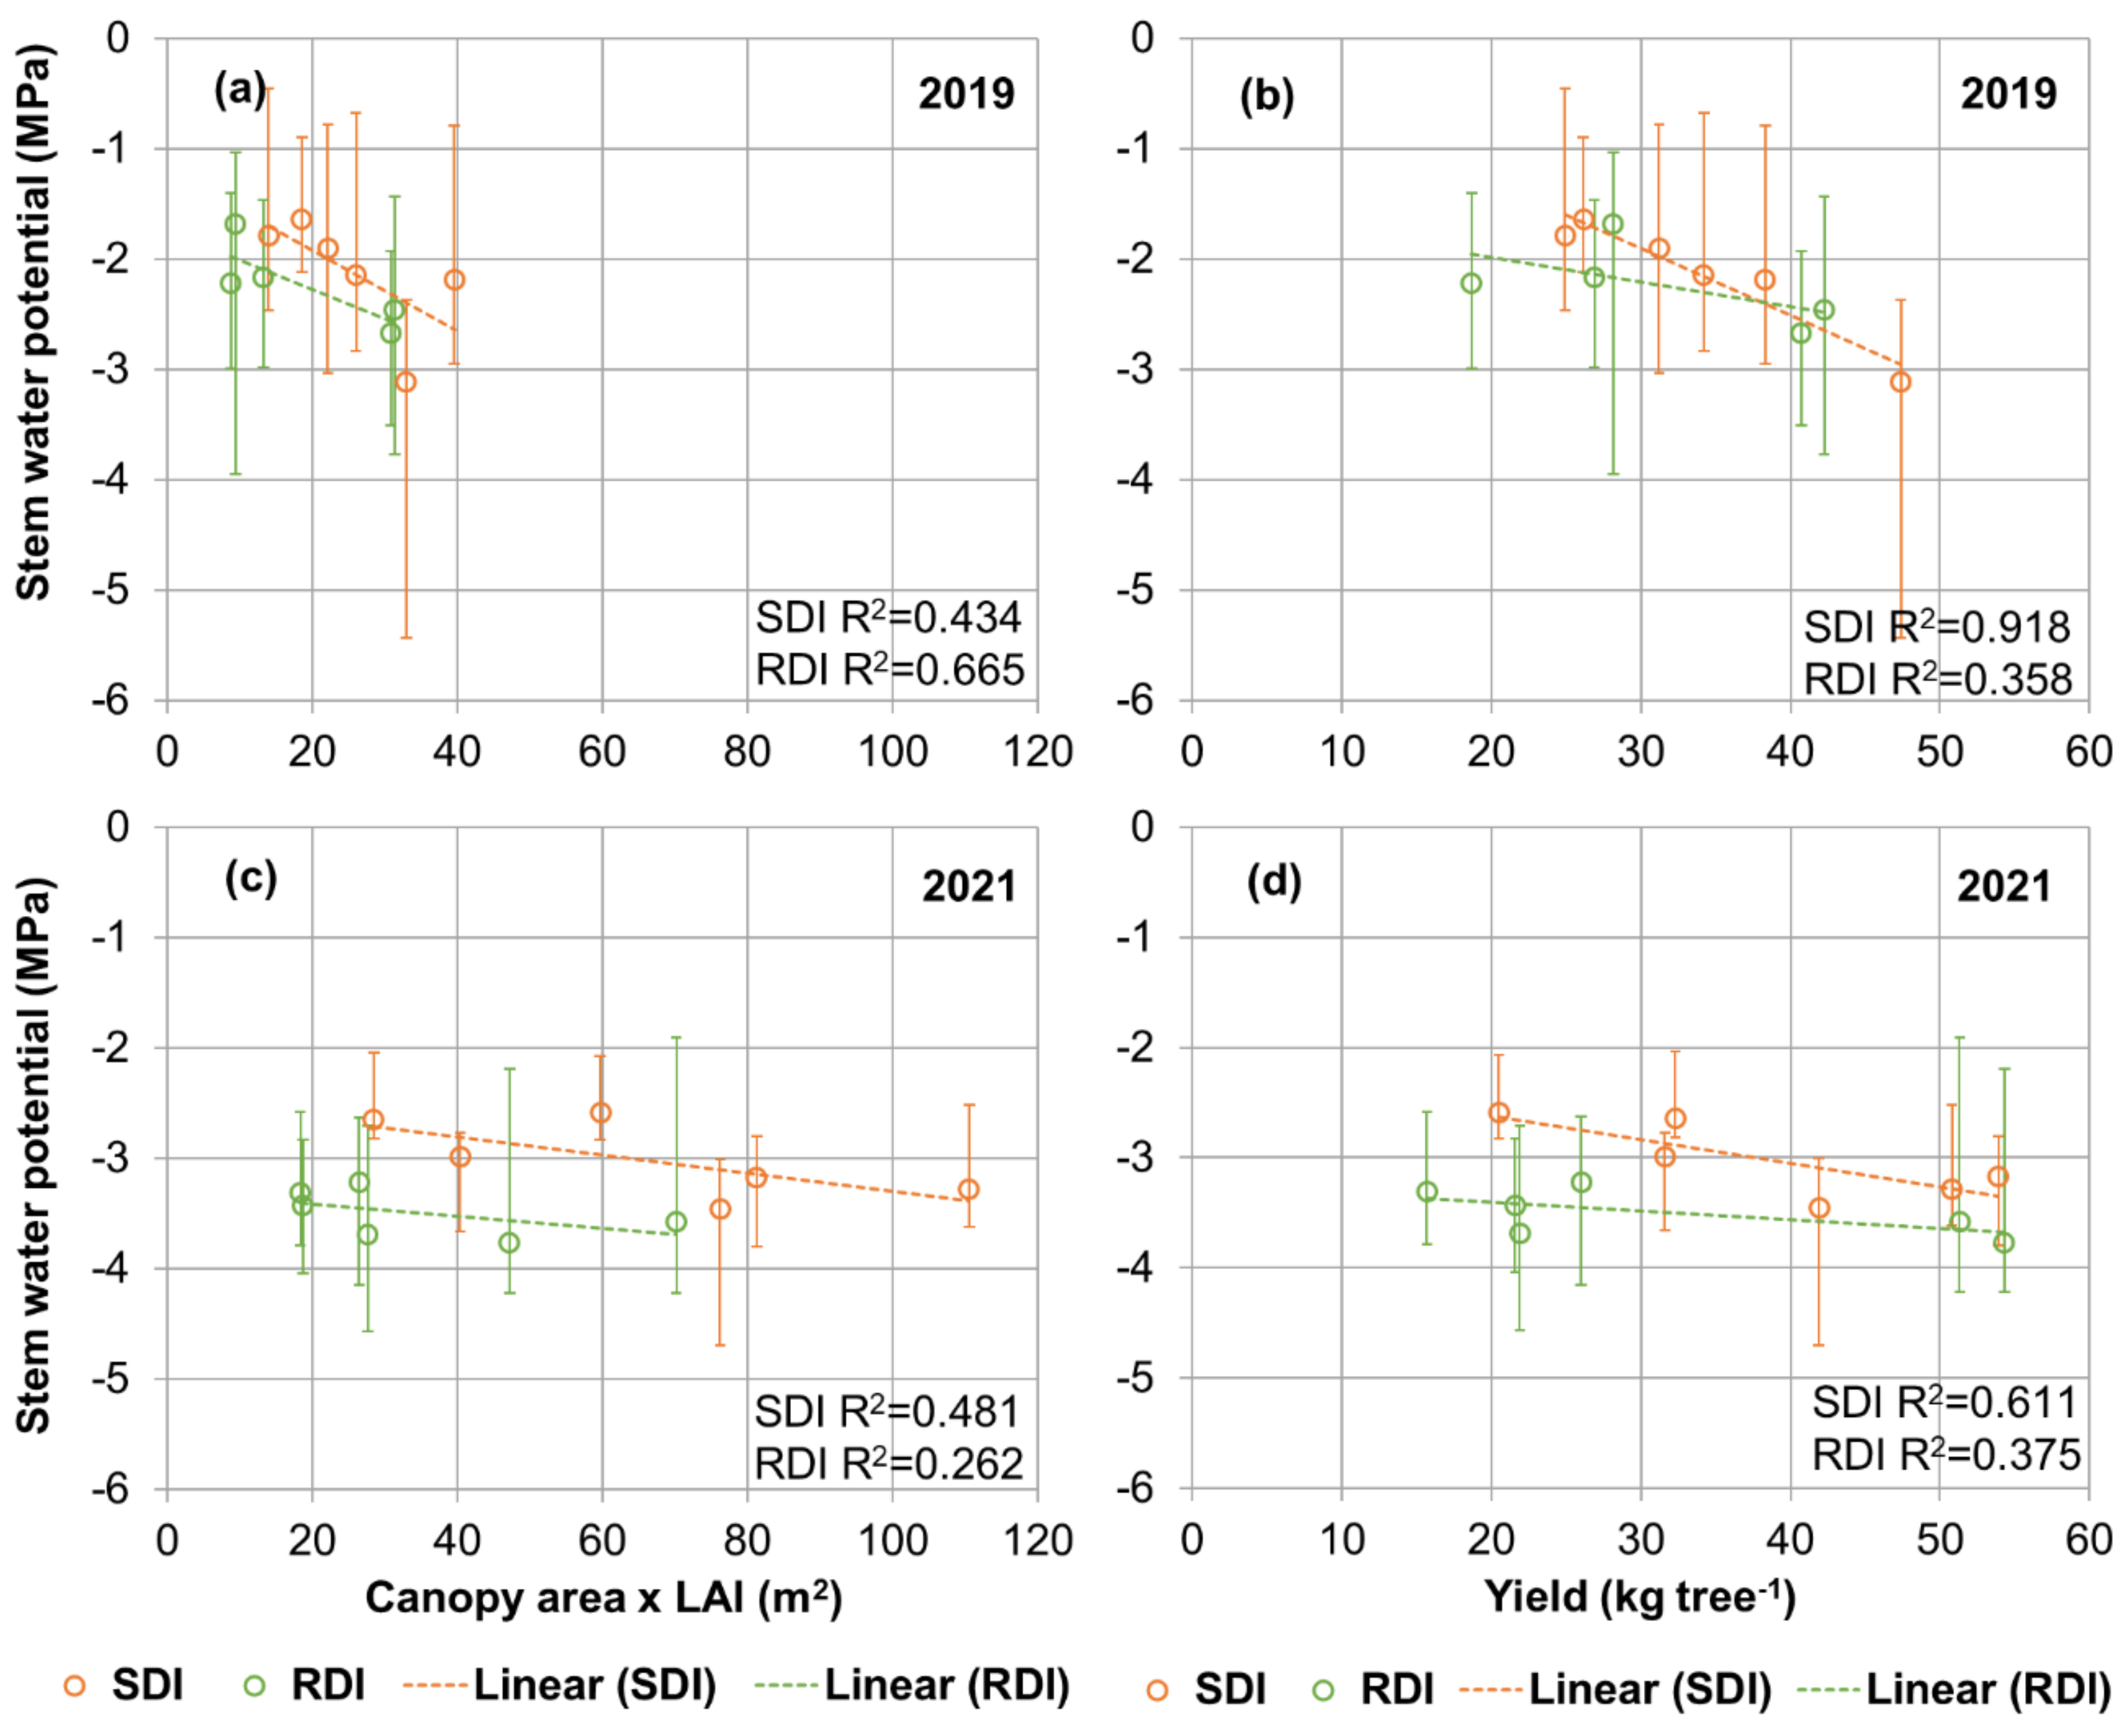
3.5. Relations between Ψs, Canopy Leaf Area and Yield

Olive fruit yields averaged 34 kg tree−1 (RDI) and 33 kg tree−1 (SDI) in 2019 and 35 kg tree−1 (RDI) and 34 kg tree−1 (SDI) in 2021 and were not significantly different between treatments (p > 0.8). Overall, the average yield was 9.5 ton ha−1 per year. Furthermore, no significant difference between treatments was found for oil yield and oil quality in 2019 [32]. The average water productivity was 6.2 (RDI) and 4.5 (SDI) kg fruits m−3 irrigation water in 2019 (p = 0.1) and 6.6 (RDI) and 4.7 (SDI) kg fruits m−3 irrigation water in 2021 (p = 0.2). The olive yields are different from those in the study of Ben-Gal et al. [47] which was referred to above, in which they reported that 75% ETc irrigated trees had a three times higher yield than trees that received 30% ETc.
The relation between yield and canopy leaf area (Figure 5) was stronger in the RDI than in the SDI treatment because of the larger range in the observed yields. Yield and canopy leaf area were governed by a positive relation, as also reported by Pierantozzi et al. [49] for mature ‘Genovesa’ trees. Similar to the current study, these authors found no difference between the obtained yields of fully irrigated trees with two-month water deficit of 25 and 75% ETc applied during the spring season (flowering).
The relations between the median Ψs of Periods 2 and 3 and the canopy leaf area (CA × LAI) and yield are shown in Figure 6. Median Ψs was obtained from eight observations in 2019 and 2021 for the six trees with soil water content sensors in each treatment (five trees in RDI during 2019, since one tree was accidently harvested early). In 2020, no relations (R2SDI = 0.171, R2RDI = 0.098) between Ψs and canopy leaf area were found (data not shown). Negative linear relations were found between the Ψs and leaf area or yield of both treatments in 2019 and 2021. A good relation between Ψs and canopy leaf area or yield was found in the SDI treatment during both 2019 and 2021. Water stress effects are apparent in RDI trees, with the relations having more negative Ψs than in SDI. Average LAI of both treatments was 1.5 m2 m−2 in 2019 and 2.8 m2 m−2 in 2021. Trees with large leaf areas, and therefore high yields (Figure 5), also had lower Ψs (Figure 6b,d).
The PCA showed strong correlations between the eight variables. The first two principle components explained 66% of the variance in 2019 and 69% in 2021. In 2019, the first principle component covered almost all variables: yield, canopy leaf area, the Ψs of all three periods and the VSWC of Period 3. The second component described the VSWC of Periods 2 and 3 and the Ψs of Period 2. In 2021, the first component described the Ψs of Periods 1–3, the VSWC of Periods 2 and 3 and the yield. The second component described the yield, canopy leaf area and VSWC of Period 1 (see Appendix B, Table A2 and Table A3). The principle component analysis scores for trees with soil water content sensors are shown in Appendix B (Figure A1).

4. Conclusions

This study presents the effects of alternate bearing on ‘Koroneiki’ olive tree–water relations under two irrigation treatments at an inland location in Cyprus. The results showed that the climatic conditions affected the dates of the main phenological growth stages (flowering and maximum rate of pit hardening). A Kc of 0.37 in 2019 (“on”), 0.39 in 2020 (“off”) and 0.41 in 2021 (“on”) was computed from daily water balance observations for the three years, from March to November. Water balance computations showed similar water demands in “on” and “off” years.
Fruit growth caused a substantial reduction in shoot elongation during “on” years and a more negative Ψs by September (oil accumulation stage) compared to “off” years, probably due to higher assimilation needs in the “on” year. The observed recovery in Ψs on 21 September in the “off” year indicated that irrigation volume could potentially be reduced by more than 35% ETc in early fall. Regulated deficit irrigation saved 24–32% water in “on” years and 48% in “off” years relative to the SDI treatment. Long-term monitoring is required to understand how water stress in “off” years may affect plant parameters in “on” years under variable environmental conditions. Weekly or biweekly measurements of Ψs after the start of the maximum rate of pit hardening are important to understand plant water stress for different crop loads and VSWCs. These relations can assist irrigation scheduling decisions by defining Ψs thresholds for irrigation in “on” and “off” years that may have limited effects on fruit yield or enhance oil quality. Observations of phenological stages, shoot growth and fruit volumes will provide additional knowledge on tree growth water sensitivity.

Author Contributions

Conceptualization, M.S, A.B., M.C.K. and A.M.; methodology, M.S., A.B. and M.E.; formal analysis, M.S. and A.B.; investigation, M.S., M.E. and H.D.; data curation, M.S.; writing—original draft preparation, M.S.; writing—review and editing, A.B., M.E., H.D., M.C.K. and A.M.; visualization, M.S.; supervision, A.B.; project administration, M.S. All authors have read and agreed to the published version of the manuscript.

Funding

This research was funded by the Republic of Cyprus through the Research and Innovation Foundation, grant number KOINA/ΠΚΠ-WATER/0216in the framework of the INNOMED project “Innovative Options for Integrated Water Resources Management in the Mediterranean” (ERA-NET COFUND WaterWorks2015, FACCE JPI and Water JPI).

Data Availability Statement

Not applicable.

Acknowledgments

We would like to thank the olive farm manager for offering us the opportunity to conduct our experimental research at STRAKKA LTD and for his continuous support and cooperation.

Conflicts of Interest

The authors declare no conflict of interest. The funders had no role in the design of the study; in the collection, analyses, or interpretation of data; in the writing of the manuscript, or in the decision to publish the results.

Appendix A. Monthly Meteorological Data

Table A1. Monthly total precipitation (P), average daily minimum and maximum temperature (Tmin, Tmax) and relative humidity (RHmin, RHmax), average vapour pressure deficit (VPD) and wind speed (WS) and total reference evapotranspiration (ETo) for the tree years, 2019–2021.
YearMonthP
mm
Tmin
°C
Tmax
°C
RHmin
%
RHmax
%
VPD
kPa
WS
m s−1
ETo
mm
2019Jan128.63.515.257.598.60.40.328.4
2019Feb132.24.615.958.798.60.40.338.6
2019Mar40.35.419.148.996.90.60.368.9
2019Apr33.28.022.442.595.40.90.397.5
2019May0.113.031.723.784.02.10.5150.9
2019Jun72.017.533.630.693.51.90.4154.8
2019Jul0.019.035.924.986.12.40.5167.8
2019Aug0.019.736.727.493.52.30.5149.3
2019Sep1.617.533.732.993.41.80.4110.5
2019Oct67.015.929.739.089.01.20.350.0
2019Nov0.310.324.253.796.70.80.332.9
2019Dec89.55.918.064.899.60.40.225.7
2020Jan101.33.714.570.699.50.30.327.4
2020Feb22.83.915.865.699.40.30.440.8
2020Mar62.17.719.863.4100.00.40.448.6
2020Apr17.68.224.148.899.00.80.4104.0
2020May13.913.330.229.183.11.80.5145.1
2020Jun0.015.432.229.989.81.90.5156.3
2020Jul0.019.637.924.895.52.60.5176.0
2020Aug0.019.637.924.091.72.60.5156.4
2020Sep0.019.236.925.991.22.50.4118.3
2020Oct0.115.631.830.188.71.80.375.7
2020Nov37.911.022.350.997.50.70.236.8
2020Dec62.16.919.159.7100.00.50.226.1
2021Jan25.74.917.658.299.80.40.230.1
2021Feb10.74.418.652.097.60.50.342.8
2021Mar26.04.819.545.396.20.60.472.4
2021Apr15.78.325.930.591.51.40.4110.2
2021May0.213.733.124.188.12.10.4155.9
2021Jun28.716.032.629.386.31.90.5147.8
2021Jul0.019.834.824.985.82.50.4161.6
2021Aug1.220.839.120.386.23.00.5 1161.5
2021Sep15.916.833.429.191.81.90.5 1114.1
2021Oct13.613.029.230.789.11.50.5 178.6
2021Nov7.510.124.941.491.31.00.5 146.3
2021Dec204.76.017.054.897.00.60.5 129.5
1 Missing WS data, due to sensor failure, replaced with standard WS, following Allen et al. [27].

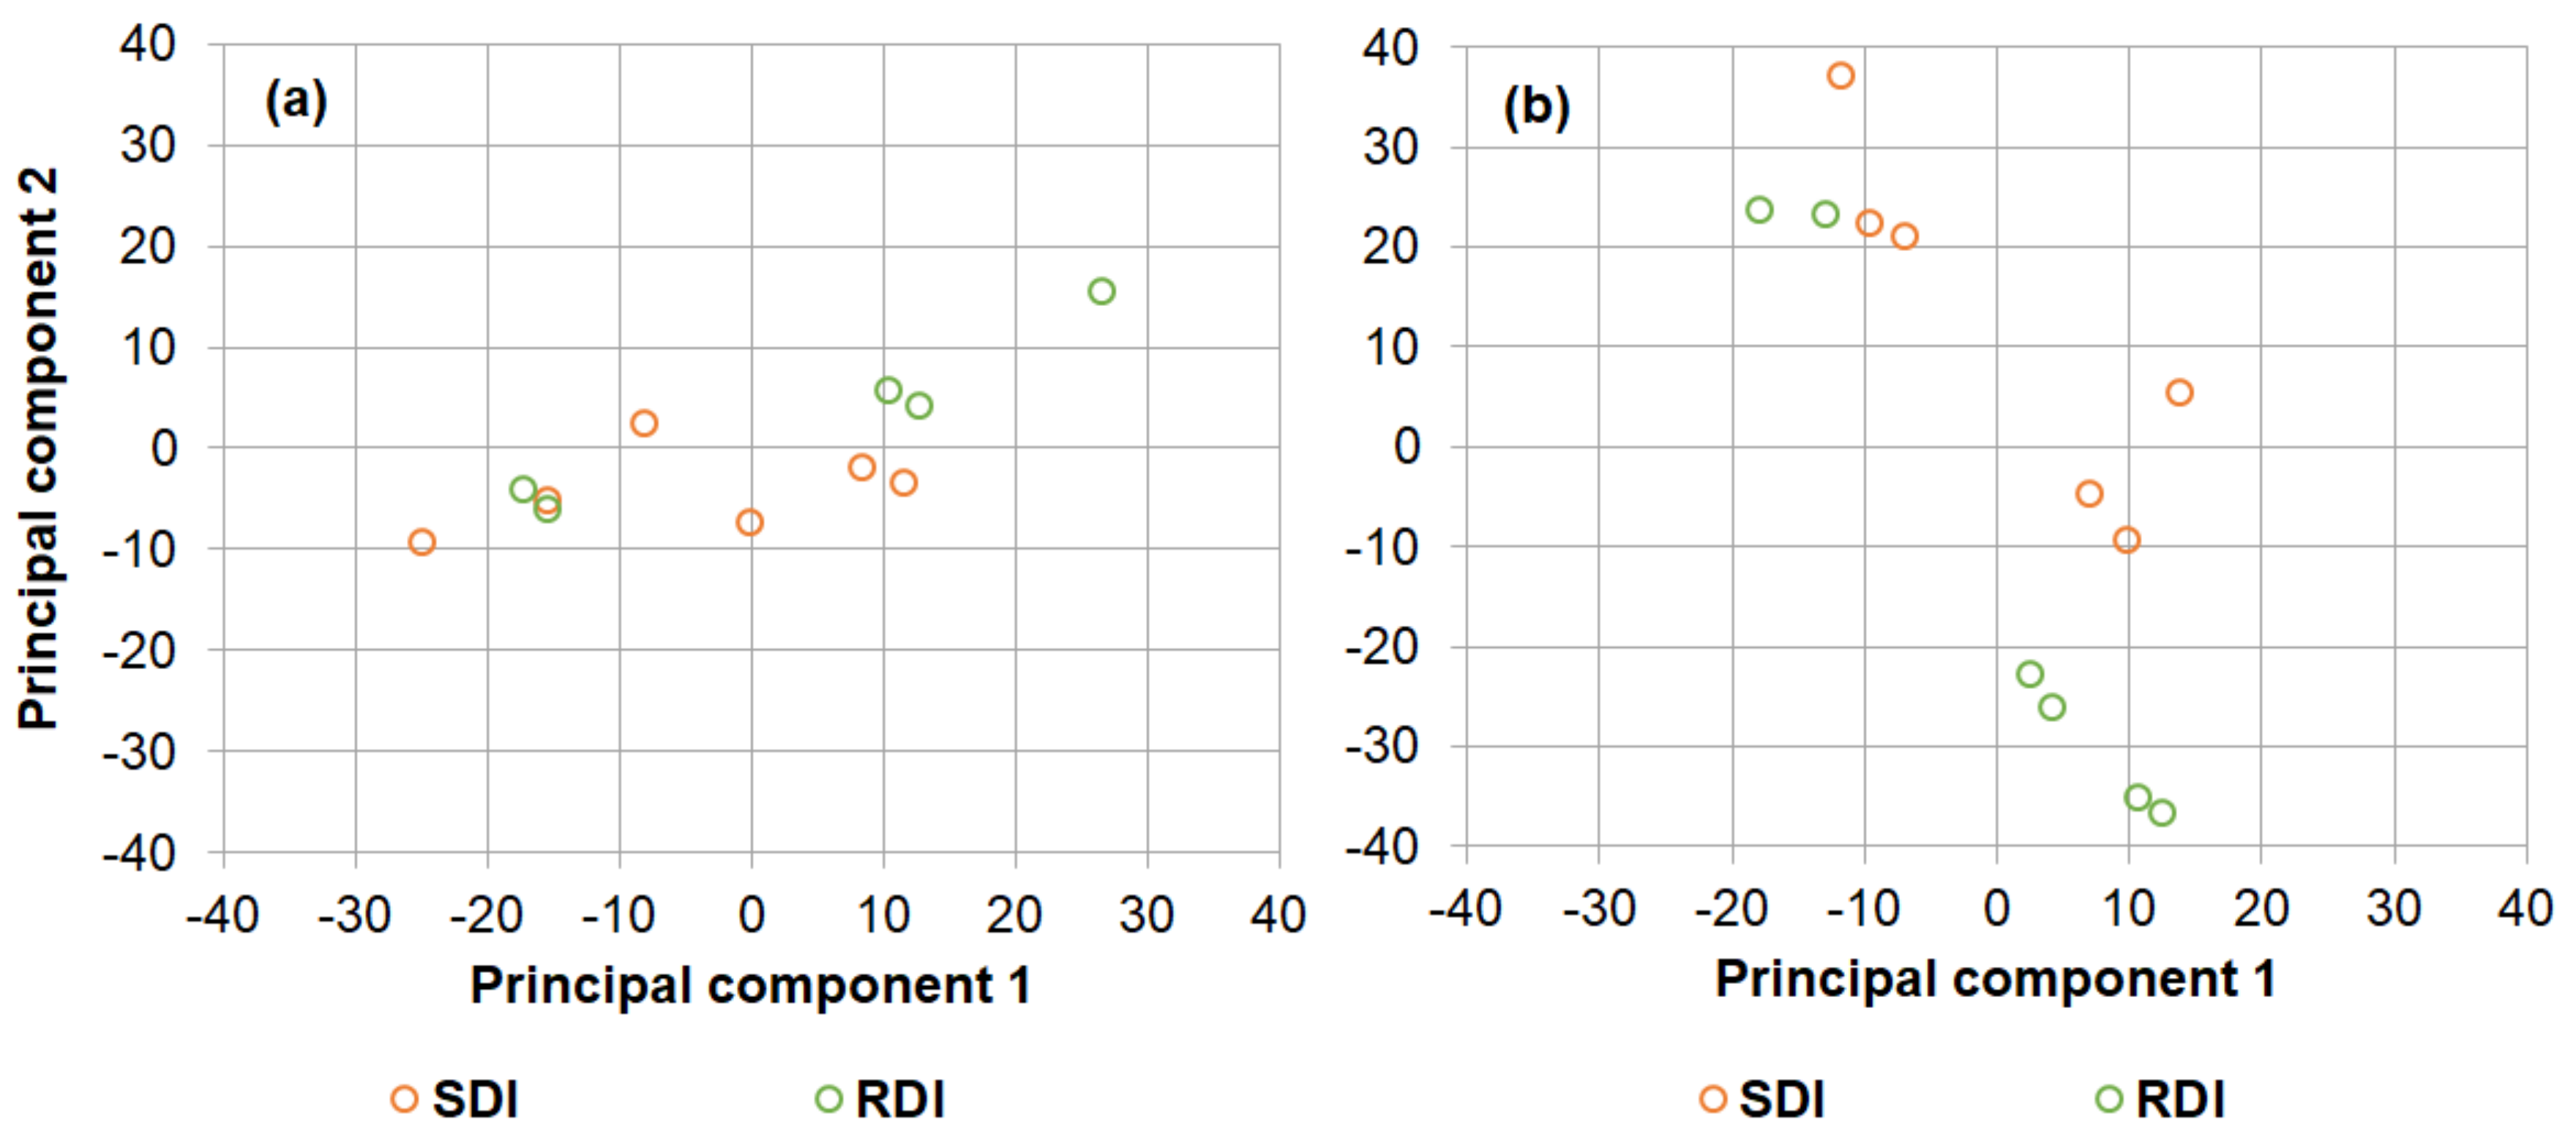
Appendix B. Principal Component Analysis

Table A2. Principal component matrix for different variables (sorted by size) and variance explained by each principal component for 2019.
Component Matrix 2019
Component
123
Variance explained (%)422415
Yield−0.961−0.103−0.053
Canopy area × LAI−0.786−0.3060.390
Ψs_Period 30.705−0.4930.447
Ψs_Period 20.696−0.5700.307
Ψs_Period 10.6780.211−0.412
VSWC_Period 1−0.0210.8730.278
VSWC_Period 30.5260.6370.395
VSWC_Period 2−0.3270.1680.600
Table A3. Principal component matrix for different variables (sorted by size) and variance explained by each principal component for 2021.
Component Matrix 2021
Component
123
Variance explained (%)462316
Ψs_Period 30.9160.161−0.048
Ψs_Period 20.9120.059−0.205
Ψs_Period 10.827−0.089−0.321
VSWC_Period 30.7830.2740.356
Canopy area × LAI−0.1660.8990.113
Yield−0.5010.7780.128
VSWC_Period 1−0.192−0.5650.717
VSWC_Period 20.6370.1400.689
Figure A1. Principal component analysis scores for 11 trees in 2019 (a) and 12 trees in 2021 (b) with soil water content sensors.
Agronomy 12 00879 g0a1

References

  1. Zittis, G.; Bruggeman, A.; Lelieveld, J. Revisiting future extreme precipitation trends in the Mediterranean. Weather Clim. Extrem. 2021, 34, 100380. [Google Scholar] [CrossRef] [PubMed]
  2. Moriana, A.; Orgaz, F.; Pastor, M.; Fereres, E. Yield responses of a mature olive orchard to water deficits. J. Am. Soc. Hortic. Sci. 2003, 128, 425–431. [Google Scholar] [CrossRef]
  3. Ennajeh, M.; Tounekti, T.; Vadel, A.M.; Khemira, H.; Cochard, H. Water relations and drought-induced embolism in olive (Olea europaea) varieties ‘Meski’ and ‘Chemlali’ during severe drought. Tree Physiol. 2008, 28, 971–976. [Google Scholar] [CrossRef] [PubMed]
  4. Rossi, L.; Sebastiani, L.; Tognetti, R.; d’Andria, R.; Morelli, G.; Cherubini, P. Tree-ring wood anatomy and stable isotopes show structural and functional adjustments in olive trees under different water availability. Plant Soil 2013, 372, 567–579. [Google Scholar] [CrossRef]
  5. Diaz-Espejo, A.; Fernández, J.E.; Torres-Ruiz, J.M.; Rodriguez-Dominguez, C.M.; Perez-Martin, A.; Hernandez-Santana, V. The olive tree under water stress: Fitting the pieces of response mechanisms in the crop performance puzzle. In Water Scarcity and Sustainable Agriculture in Semiarid Environment, 1st ed.; García Tejero, I.F., Durán Zuazo, V.H., Eds.; Elsevier: London, UK, 2018; pp. 439–479. [Google Scholar] [CrossRef]
  6. Tognetti, R.; d’Andria, R.; Lavini, A.; Morelli, G. The effect of deficit irrigation on crop yield and vegetative development of Olea europaea L. (cvs. Frantoio and Leccino). Eur. J. Agron. 2006, 25, 356–364. [Google Scholar] [CrossRef]
  7. Fernández, J.E. Understanding olive adaptation to abiotic stresses as a tool to increase crop performance. Environ. Exp. Bot. 2014, 103, 158–179. [Google Scholar] [CrossRef] [Green Version]
  8. Moriana, A.; Pérez-López, D.; Prieto, M.H.; Ramírez-Santa-Pau, M.; Pérez-Rodrigues, J.M. Midday stem water potential as a useful tool for estimating irrigation requirements in olive trees. Agric. Water Manag. 2012, 112, 43–54. [Google Scholar] [CrossRef]
  9. Bianco, R.L.; Scalisi, A. Water relations and carbohydrate partitioning of four greenhouse-grown olive genotypes under long-term drought. Trees 2017, 31, 717–727. [Google Scholar] [CrossRef]
  10. Naor, A.; Schneider, D.; Ben-Gal, A.; Zipori, I.; Dag, A.; Kerem, Z.; Birger, R.; Peres, M.; Gal, Y. The effects of crop load and irrigation rate in the oil accumulation stage on oil yield and water relations of ‘Koroneiki’ olives. Irrig. Sci. 2013, 31, 781–791. [Google Scholar] [CrossRef]
  11. Bacelar, E.A.; Moutinho-Pereira, J.M.; Goncalves, B.C.; Ferreira, H.F.; Correia, C.M. Changes in growth, gas exchange, xylem hydraulic properties and water use efficiency of three olive cultivars under contrasting water availability regimes. Environ. Exp. Bot. 2006, 60, 183–192. [Google Scholar] [CrossRef]
  12. Grattan, S.R.; Berenguer, M.J.; Connell, J.H.; Polito, V.S.; Vossen, P.M. Olive oil production as influenced by different quantities of applied water. Agric. Water Manag. 2006, 85, 133–140. [Google Scholar] [CrossRef]
  13. Rapoport, H.F.; Costagli, G.; Gucci, R. The effect of water deficit during early fruit development on olive fruit morphogenesis. J. Amer. Soc. Hort. Sci. 2004, 129, 121–127. [Google Scholar] [CrossRef]
  14. Hueso, A.; Camacho, G.; Gómez-del-Campo, M. Spring deficit irrigation promotes significant reduction on vegetative growth, flowering, fruit growth and production in hedgerow olive orchards (cv. Arbequina). Agric. Water Manag. 2021, 248, 106695. [Google Scholar] [CrossRef]
  15. Gucci, R.; Caruso, G.; Gennai, C.; Esposto, S.; Urbani, S.; Servili, M. Fruit growth, yield and oil quality changes induced by deficit irrigation at different stages of olive fruit development. Agric. Water Manag. 2019, 212, 88–98. [Google Scholar] [CrossRef]
  16. Monson, R.; Baldocchi, D. Boundary layer and stomatal control over leaf fluxes. In Terrestrial Biosphere-Atmosphere Fluxes, 1st ed.; Cambridge University Press: Cambridge, UK, 2014; pp. 136–172. [Google Scholar] [CrossRef]
  17. Bonan, G. Plant hydraulics. In Climate Change and Terrestrial Ecosystem Modelling, 1st ed.; Cambridge University Press: Cambridge, UK, 2019; pp. 213–227. [Google Scholar] [CrossRef]
  18. Jarvis, P.G. The interpretation of the variations in leaf water potential and stomatal conductance found in canopies in the field. Philos. Trans. R. Soc. Lond. 1976, 273, 593–610. [Google Scholar] [CrossRef]
  19. Ortuño, M.F.; García-Orellana, Y.; Conejero, W.; Ruiz-Sánchez, M.C.; Mounzer, O.; Alarcón, J.J.; Torrecillas, A. Relationships between climatic variables and sap flow, stem water potential and maximum daily trunk shrinkage in lemon trees. Plant Soil 2006, 279, 229–242. [Google Scholar] [CrossRef]
  20. Corell, M.; Pérez-López, D.; Martín-Palomo, M.J.; Centeno, A.; Girón, I.; Galindo, A.; Moreno, M.M.; Moreno, C.; Memmi, H.; Torrecillas, A.; et al. Comparison of the water potential baseline in different locations. Usefulness for irrigation scheduling of olive orchards. Agric. Water Manag. 2016, 177, 308–316. [Google Scholar] [CrossRef] [Green Version]
  21. Trentacoste, E.R.; Sadras, V.O.; Puertas, C.M. Effects of the source:sink ratio of the phenotypic plasticity of stem water potential in olive (Olea europaea L.). J. Exp. Bot. 2011, 62, 3535–3543. [Google Scholar] [CrossRef] [Green Version]
  22. Martín-Vertedor, A.I.; Rodríguez, J.M.P.; Losada, H.P.; Castiel, E.F. Interactive responses to water deficits and crop load in olive (olea europaea L., cv. Morisca) I.—Growth and water relations. Agric. Water Manag. 2011, 98, 941–949. [Google Scholar] [CrossRef] [Green Version]
  23. Dahl, A.; Galán, C.; Hajkova, L.; Pauling, A.; Sikoparija, B.; Smith, M.; Vokou, D. The onset, course and intensity of the pollen season. In Allergenic Pollen: A Review of the Production, Release, Distribution and Health Impacts, 1st ed.; Sofiev, M., Bergmann, K.C., Eds.; Springer: Dordrecht, The Nehterlands; Heidelberg/Berlin, Germany; New York, NY, USA; London, UK, 2013; pp. 29–70. [Google Scholar] [CrossRef]
  24. Aguilera, F.; Ruiz, L.; Fornaciari, M.; Romano, B.; Galán, C.; Oteros, J.; Dhiab, A.B.; Msallem, M.; Orlandi, F. Heat accumulation period in the Mediterranean region: Phenological response of the olive in different climate areas (Spain, Italy and Tunisia). Int. J. Biometeorol. 2014, 58, 867–876. [Google Scholar] [CrossRef]
  25. Orlandi, F.; Sgromo, C.; Bonofiglio, T.; Ruga, L.; Romano, B.; Fornaciari, M. Spring influences on olive flowering and threshold temperatures related to reproductive structure formation. HortScience 2010, 45, 1052–1057. [Google Scholar] [CrossRef]
  26. Garrido, A.; Fernández-González, M.; Álvarez-López, S.; González-Fernández, E.; Rodríguez-Rajo, F.J. First phenological and aerobiological assessment of olive orchards at the Northern limit of the Mediterranean bioclimatic area. Aerobiologia 2020, 36, 641–656. [Google Scholar] [CrossRef]
  27. Allen, R.G.; Pereira, L.S.; Raes, D.; Smith, M. Crop evapotranspiration. Guideline for computing crop water requirements. In FAO Irrigation and Drainage Paper No. 56; FAO: Rome, Italy, 1998; pp. 1–326. [Google Scholar]
  28. Connor, D.J.; Fereres, E. The physiology of adaptation and yield expression in olive. In Horticultural Reviews, 1st ed.; Janick, J., Ed.; John Wiley & Sons: Hoboken, NJ, USA, 2005; Volume 31, pp. 155–229. [Google Scholar] [CrossRef]
  29. Bustan, A.; Dag, A.; Yermiyahu, U.; Erel, R.; Presnov, E.; Agam, N.; Kool, D.; Iwema, J.; Zipori, I.; Ben-Gal, A. Fruit load governs transpiration of olive trees. Tree Physiol. 2016, 36, 380–391. [Google Scholar] [CrossRef] [PubMed]
  30. Villalobos, F.J.; Orgaz, F.; Testi, L.; Fereres, E. Measurement and modelling of evapotranspiration of olive (Olea europaea L.) orchards. Eur. J. Agron. 2000, 13, 155–163. [Google Scholar] [CrossRef]
  31. Testi, L.; Villalobos, F.J.; Orgaz, F.; Fereres, E. Water requirements of olive orchards: I simulation of daily evapotranspiration for scenario analysis. Irrig. Sci. 2006, 24, 69–76. [Google Scholar] [CrossRef]
  32. Siakou, M.; Bruggeman, A.; Eliades, M.; Zoumides, C.; Djuma, H.; Kyriacou, M.C.; Emmanouilidou, M.; Spyros, A.; Manolopoulou, E.; Moriana, A. Effects of deficit irrigation on ‘Koroneiki’ olive tree growth, physiology and olive oil quality at different harvest dates. Agric. Water Manag. 2021, 258, 107200. [Google Scholar] [CrossRef]
  33. Fernández, J. Plant-based methods for irrigation scheduling of woody crops. Horticulturae 2017, 3, 35. [Google Scholar] [CrossRef] [Green Version]
  34. Sanz-Cortés, F.; Martinez-Calvo, J.; Badenes, M.L.; Bleiholder, H.; Hack, H.; Llacer, G.; Meier, U. Phenological growth stages of olive trees (Olea europaea). Ann. Appl. Biol. 2002, 140, 151–157. [Google Scholar] [CrossRef]
  35. Mcmaster, G.; Wilhelm, W.W. Growing degree-days: One equation, two interpretations. Agric. For. Meteorol. 1997, 87, 291–300. [Google Scholar] [CrossRef] [Green Version]
  36. Pérez-López, D.; Ribas, F.; Moriana, A.; Rapoport, H.F.; De Juan, A. Influence of temperature on the growth and development of olive (Olea europaea L.) trees. J. Hortic. Sci. Biotech. 2008, 83, 171–176. [Google Scholar] [CrossRef]
  37. Oteros, J.; García-Mozo, H.; Vázquez, L.; Mestre, A.; Domínguez-Vilches, E.; Galán, C. Modelling olive phenological response to weather and topography. Agric. Ecosyst. Environ. 2013, 179, 62–68. [Google Scholar] [CrossRef]
  38. Rapoport, H.F.; Pérez-López, D.; Hammami, S.B.M.; Agüera, J.; Moriana, A. Fruit pit hardening: Physical measurement during olive fruit growth. Ann. Appl. Biol. 2013, 163, 200–208. [Google Scholar] [CrossRef] [Green Version]
  39. Fernández, J.E.; Alcon, F.; Diaz-Espejo, A.; Hernandez-Santana, V.; Cuevas, M.V. Water use indicators and economic analysis for on-farm irrigation decision: A case study of a super high density olive tree orchard. Agric. Water Manag. 2020, 237, 106074. [Google Scholar] [CrossRef]
  40. LI-COR. LAI-2200C Plant Canopy Analyser: Instruction Manual. Available online: https://www.licor.com/env/support/LAI-2200C/manuals.html (accessed on 4 November 2019).
  41. Camera, C.; Bruggeman, A.; Hadjinicolaou, P.; Pashiardis, S.; Lange, M.A. Evaluation of interpolation techniques for the creation of gridded daily precipitation (1 × 1 km2); Cyprus, 1980–2010. J. Geophys. Res. 2013, 119, 693–712. [Google Scholar] [CrossRef]
  42. Cammalleri, C.; Rallo, G.; Agnese, C.; Ciraolo, G.; Minacapilli, M.; Provenzano, G. Combined use of eddy covariance and sap flow techniques for partition of ET fluxes and water stress assessment in an irrigated olive orchard. Agric. Water Manag. 2013, 120, 89–97. [Google Scholar] [CrossRef] [Green Version]
  43. Girón, I.F.; Corell, M.; Galindo, A.; Torrecillas, E.; Morales, D.; Dell’Amico, J.; Torrecillas, A.; Moreno, F.; Moriana, A. Changes in the physiological response between leaves and fruits during a moderate water stress in table olive trees. Agric. Water Manag. 2015, 148, 280–286. [Google Scholar] [CrossRef]
  44. Beyá-Marshall, V.; Herrera, J.; Fichet, T.; Trentacoste, E.R.; Kremer, C. The effect of water status on productive and flowering variables in young ‘Arbequina’ olive trees under limited irrigation water availability in a semiarid region of Chile. Hortic. Environ. Biotech. 2018, 59, 815–826. [Google Scholar] [CrossRef]
  45. Dag, A.; Bustan, A.; Avni, A.; Tzipori, I.; Lavee, S.; Riov, J. Timing of fruit removal affects concurrent vegetative growth and subsequent return bloom and yield in olive (Olea europaea L.). Sci. Hortic. 2010, 123, 469–472. [Google Scholar] [CrossRef]
  46. Fernández, F.J.; Ladux, J.L.; Searles, P.S. Dynamics of shoot and fruit growth following fruit thinning in olive trees: Same season and subsequent season responses. Sci. Hortic. 2015, 192, 320–330. [Google Scholar] [CrossRef]
  47. Ben-Gal, A.; Yermiyahu, U.; Zipori, I.; Presnov, E.; Hanoch, E.; Dag, A. The influence of bearing cycles on olive oil production response to irrigation. Irrig. Sci. 2011, 29, 253–263. [Google Scholar] [CrossRef]
  48. Bacelar, E.A.; Correia, C.M.; Moutinho-Pereira, J.M.; Goncalves, B.C.; Lopes, J.I.; Torres-Pereira, J.M.G. Sclerophylly and leaf anatomical traits of five field-grown olive cultivars growing under drought conditions. Tree Physiol. 2004, 24, 233–239. [Google Scholar] [CrossRef] [PubMed]
  49. Pierantozzi, P.; Torres, M.; Tivani, M.; Contreras, C.; Gentili, L.; Parera, C.; Maestri, D. Spring deficit irrigation in olive (cv. Genovesa) growing under arid continental climate: Effects on vegetative growth and productive parameters. Agric. Water Manag. 2020, 238, 106212. [Google Scholar] [CrossRef]
Figure 1. Precipitation, irrigation, VPD, average soil water content of the 70 cm rootzone of two replicate plots and average stem water potential (Ψs) for five replicate plots for sustained (SDI) and regulated (RDI) deficit irrigation treatments, during two “on” years (2019, 2021) and an “off” year (2020). Growth periods are indicated with grey arrows at the top.
Agronomy 12 00879 g001
Figure 2. Average fruit volume in 2019 and 2021 (a) and shoot length in 2020 and 2021 (b) for five replicate plots for sustained (SDI) and regulated (RDI) deficit irrigation treatments. Periods 1–3 are indicated with grey colouring. Error bars are standard errors.
Agronomy 12 00879 g002
Figure 3. Average stem water potential of five replicate plots in sustained (SDI) and regulated (RDI) deficit irrigation treatments in relation to soil water content (six trees per treatment) and vapour pressure deficit for Period 1 during 2019 (a,b) and 2020 (c,d). Error bars indicate standard errors.
Agronomy 12 00879 g003
Figure 4. Average stem water potential of five replicate plots in sustained (SDI) and regulated (RDI) deficit irrigation treatments in relation to soil water content (six trees per treatment) and vapour pressure deficit for Periods 2 (a,b) and 3 (c,d) in 2019 and Periods 2 (e,f) and 3 (g,h) in 2020. Regression equations are given for statistically significant relations (p < 0.05). Error bars indicate standard errors.
Agronomy 12 00879 g004
Figure 5. Yield of all 30 monitored trees in sustained (SDI) and regulated (RDI) deficit irrigation treatments in relation to canopy leaf area for 2019 (a) and 2021 (b). R2 is the coefficient of determination.
Agronomy 12 00879 g005
Figure 6. Median stem water potential of Periods 2 and 3 for soil moisture-monitored trees in sustained (SDI) and regulated (RDI) deficit irrigation treatments in relation to canopy leaf area (a,c) and yield (b,d) for 2019 and 2021. Error bars show the minimum and maximum stem water potential. R2 is the coefficient of determination.
Agronomy 12 00879 g006
Table 1. Phenological growth periods during 2019–2021 used for the water balance computations and analysis of plant observations and the percentage of crop water requirements (ETc) for the sustained (SDI) and regulated (RDI) deficit irrigation treatments.
YearPeriodDatesPhenological Growth StageETc-SDI (%)ETc-RDI (%)
2019113 May–30 Jun69–71End of flowering–early fruit growth7070
201 Jul–01 Sep71–79Maximum rate of pit hardening7035.70 1
302 Sep–12 Oct80–81Oil accumulation–start of rainfall7035.70 2
2020118 May–28 Jun31–37Fast shoot elongation7035
229 Jun–30 Aug38Small rate of shoot elongation7035
331 Aug–11 Oct39End of shoot elongation-start of rainfall7035
2021104 May–19 Jun69–71End of flowering–early fruit growth7070
220 Jun–22 Aug71–79Maximum rate of pit hardening7035.70 1
323 Aug–02 Oct80–81Oil accumulation–start of rainfall7035.70 2
1 70% ETc applied for two weeks at the end of this stage. 2 70% ETc applied for two weeks at the beginning of this stage.
Table 2. Precipitation (P), reference (ETo) and crop evapotranspiration (ETc, computed with Kc = 0.4) irrigation for sustained (ISDI) and regulated (IRDI) deficit irrigation treatments, drainage (DR), soil water content change (ΔVSWC), computed crop coefficients (Kc) and minimum stem water potential in SDI (Ψs-SDI) and RDI (Ψs-RDI) (average of five replicates) in Periods 1–3 (see Table 1) for 2019–2021.
YearPeriodPEToETcISDIIRDIDRSDIDRRDIΔVSWCSDIΔVSWCRDIKcΨs-SDIΨs-RDI
mmmmmmmmmmmmmmmmmm MPaMPa
2019
“On”
1722561024646−5−6−13−130.32−1.9−1.8
2032513010252−12−1−20−180.39−3.4−3.4
32143575737−10−51620.41−4.0−4.0
2020
“Off”
10213854224−7−3−11−230.29−2.0−2.0
203391368241−10−5−12−290.41−2.9−2.9
30155624120−50650.38−2.9−3.1
2021
“On”
10236945347−4−7−13−10.30−2.8−2.4
2513451386144−6−9−8−140.39−3.5−3.5
316168674930−3−47−210.52−2.9−3.7
Table 3. Growing degree days (GDDs, °C days) at different threshold temperatures for two main olive growth stages during two “on” years.
Growth Stages Threshold Temperatures (°C)
5678911131415
Full flowering (°C days)11 May 201994781769056544525213910374
27 Apr 202190278767456446228014410681
Maximum rate of
pit hardening (°C days)
25 Jun 201918441669149613271162879676595521
20 Jun 202118761708154113771221931687595516
Table 4. Average flower and fruit numbers in 15 cm long branches and fruit set calculated as the percentage of fruit to flower numbers for five replicate plots per treatment.
TreatmentFlowers/BranchFruits/BranchFruit Set (%)
30 Apr 201927 May 201927 May 201911 Jun 201909 Jul 2019
SDI234 ± 1018 ± 27.82.52.2
RDI210 ± 1219 ± 29.03.02.6
15 Apr 202118 May 202118 May 202127 May 202129 Jun 2021
SDI214 ± 521 ± 310.25.73.9
RDI238 ± 2918 ± 27.95.03.9
Table 5. Multiple linear regression analysis of the relation between Ψs (average of five replicate plots per treatment) and volumetric soil water content (VSWC, of six trees in two replicate plots per treatment) and vapour pressure deficit (VPD) for three growth periods (see Table 1) and three years.
YearPeriodNModel (p-Value)
Ψs × VSWC × VPD
Significance (p-Value)
Ψs × VSWCΨs × VPD
SDIRDISDIRDISDIRDI
2019160.6460.2740.9840.1640.5020.140
2130.1310.4120.0500.1990.6810.739
380.0690.1720.0290.2280.5270.188
2020160.3230.3000.4280.3240.6860.294
280.0740.0110.0350.0050.9840.555
370.3260.2400.1670.1150.7620.999
2021170.4780.3560.2630.2390.6390.761
240.9930.9770.9690.8810.9980.971
32
Publisher’s Note: MDPI stays neutral with regard to jurisdictional claims in published maps and institutional affiliations.

