Article

Enhancing Irrigation Salinity Stress Tolerance and Increasing Yield in Tomato Using a Precision Engineered Protein Hydrolysate and Ascophyllum nodosum-Derived Biostimulant

by
Elomofe Ikuyinminu
1,
Oscar Goñi
1,2,* and
Shane O’Connell
1,2
1
Plant Biostimulant Group, Shannon Applied Biotechnology Centre, Munster Technological University-Tralee (South Campus), V92 CX88 Tralee, Kerry, Ireland
2
Brandon Bioscience, V92 P2FE Tralee, Kerry, Ireland
*
Author to whom correspondence should be addressed.
Agronomy 2022, 12(4), 809; https://doi.org/10.3390/agronomy12040809
Submission received: 14 February 2022 / Revised: 19 March 2022 / Accepted: 21 March 2022 / Published: 27 March 2022
(This article belongs to the Special Issue The Role of Plant Biostimulants in Stressful Agriculture)

Abstract

:
Most vegetable crops are salt sensitive, growing inadequately in salinised soils due to the accumulation of toxic ions from prolonged irrigation regimes. Plant biostimulants are a potential tool that can be used to counteract salinity stress and increase crop yield. The aim of this study was to investigate the ability of the proprietary protein hydrolysate and Ascophyllum nodosum-derived biostimulant PSI-475 to activate salinity stress tolerance responses in plants. After characterising PSI-475 composition, initial biostimulant activity screening was performed using Arabidopsis thaliana. PSI-475 stimulated primary root growth (+5.5–20.0%) and photosynthetic pigments content (18.8–63.0%) under unstressed and salinity stressed conditions. Subsequently, PSI-475 was assessed by foliar application on tomato plants (cv. Micro-Tom) that received a saline irrigation water program, which caused a significant decrease in fruit yield (−37.5%). Stressed plants treated with PSI-475 increased this parameter by 31.8% versus the stressed control. Experimental data suggest that PSI-475 can alleviate the negative effects of saline irrigation by improving osmotic adjustment and ion homeostasis markers. PSI-475 was also able to provide significant yield benefits in unstressed plants (+16.9%) that were associated with improved leaf biochemical markers. The data presented support the use of this precision biostimulant to target the negative effects of salinity stress from irrigation.

Graphical Abstract

1. Introduction

Salinity is one of the most prevalent abiotic stresses affecting crop production and is seen as a major threat to agricultural productivity and sustainability worldwide. Overall, the total global area of salinised soils is steadily increasing at a rate of 8–10 million hectares every year, representing 1069 million hectares of total salt-affected land [1,2]. This problem is especially exacerbated in irrigated agriculture in arid and semi-arid regions (e.g., Mediterranean countries, Central Asia, China, India, Australia, USA, Mexico, Brazil, and Argentina), where precipitation is surpassed by evaporation, and soluble salts concentrate in the root zone, leading to undesirable alterations in soil properties [1,3]. This phenomenon could be aggravated due to climate change with a predicted increase in temperature combined with a decrease in rainfall [4]. Aside from naturally occurring soil salinity factors, excessive irrigation using ground-water or salinised water also intensifies this problem. It has been estimated that 20% of irrigated land, producing one-third of the world’s food, is affected by salinity stress [1,2,3].
Salinity stress is mainly associated with the accumulation of high levels of sodium (Na+) in the root zone with respect to other exchangeable cations, inducing osmotic and ion toxicity stresses that are thought to occur according to the canonical two-phase model proposed by Munns and Tester [5]. This model established a temporal and spatial separation between both abiotic stresses, with an initial rapid osmotic stress stage because of the reduced soil water availability, which is then followed by a slow and continuous Na+ accumulation in different plant organs, leading finally to significant ion toxicity stress symptoms. However, studies on root tissues have suggested that there is some temporal overlap between osmotic and ion toxicity stresses [6]. As with other plant abiotic stresses, various phenotypical, physiological, biochemical, and molecular parameters will change depending on salinity severity and duration, resulting in induced endogenous stress tolerance mechanisms (i.e., osmolyte accumulation, ion sequestration/exclusion), developmental changes, growth inhibition processes, and eventually reduced crop yield [7,8,9,10]. However, major agronomical crops are highly salt-sensitive, and their yield is significantly reduced under moderate salinity stress conditions (i.e., above 1.5 dS m−1 in irrigation water), leading to a yield gap between the potential value inherent to the crop and that obtained by the grower [1,11]. This yield gap can range between 10% and 80% and result in negative economic consequences and an inefficient food production system [12,13].
Approaches for increasing salinity stress tolerance for crops includes soil and irrigation management practices, traditional plant breeding, and genetic modification strategies. Field management practices are focused on generating suitable soil salinity levels for crop production and can demand high inputs and labour costs [1,14]. Breeding programs have been focused on acquiring traits from halophytic plant species and crop’s wild relatives, but their development is usually time-consuming [11,15]. Another way to increase yield under salinity stress is based on the generation of salt-tolerant varieties at the lab scale through the modification of the expression of genes encoding Na+ transporters, such as HKT1;2 [16,17,18], SOS1 [19], and NHX1 [20]. However, the success rate of the implementation of genetic modification strategies in real field conditions is reported to be low and more expensive than traditional breeding [13,21].
In pursuit of a more effective solution for growers to solve the salinity stress problem, plant biostimulants are emerging as sustainable solutions and have been gaining attention from the scientific and agroindustry communities [22]. Their current popularity is reflected in the fact that the global biostimulant market is expected to reach $9.22 billion by 2027, growing at a CAGR of 14.2% from 2019 [23]. According to the new EU Fertilising Products Regulation, plant biostimulants are defined as a separate category of inputs that can improve nutrient use efficiency, tolerance to abiotic stress, and/or quality traits regardless of their nutrient content [24]. Plant biostimulants made using protein hydrolysates or extracts from the brown seaweed Ascophyllum nodosum are accepted as effective and robust specialised agronomic inputs in crop production [25,26,27,28,29]. A number of publications have demonstrated the positive role of commercial protein hydrolysate biostimulants (PHBs) and Ascophyllum nodosum extracts (ANEs) in enhancing tolerance to abiotic stresses, such as heat [30], drought [31,32], and salinity [33,34,35,36,37]. Although the effectiveness of PHBs and ANEs in improving salinity stress tolerance has been mainly tested in leaf vegetable, legume, and cereal plant species subjected to short-term salinity stress (i.e., days to less than 1 month), little is known on how these biostimulant products can significantly improve both salinity tolerance mechanisms and crop yield over the production cycle in other high-value vegetable crop families that form fleshy fruits, such as the Solanaceae.
Tomato (Lycopersicon esculentum) is one of the most economically important vegetable crops produced and consumed globally. A total of 180.8 million tonnes of tomato were produced worldwide in 2019, with a global gross production value of $47.7 billion [38]. The cultivated tomato can be classified as ‘moderately sensitive’ to salinity stress, which means that it can tolerate an EC of saturated soil extract up to 2.5 dS m−1 or EC in irrigation water of 1.7 dS m−1 without any significant yield reduction. From that threshold value, tomato yield may decrease by 9–11% for every unitary increase in the EC of irrigation water [1,39,40]. Moreover, the severity of tomato productivity losses by salinity stress is increased if it occurs at flowering and fruiting growth stages [41,42,43].
The main objective of this study was to investigate the potential of the precision-engineered biostimulant PSI-475 to mitigate the adverse influence of saline irrigation water on tomato productivity. After characterising PSI-475, the formulation was initially tested in the model plant Arabidopsis thaliana to provide proof of concept. The same PSI-475 was subsequently assessed in tomato plants (cv. Micro-Tom) subjected to high salinity stress conditions from the early flowering stage onwards. In order to assess the impact on salinity stress tolerance and to provide a defined mode of action, well-established plant parameters at phenotypical, metabolic, enzymatic, and molecular levels were evaluated throughout the growth cycle.

2. Materials and Methods

2.1. Materials

The protein hydrolysate and Ascophyllum nodosum-derived biostimulant PSI-475 was provided by Brandon Bioscience (Tralee, Ireland). All chemical reagents and biochemical standards were purchased from Sigma-Aldrich (Arklow, Ireland) and Bio-Rad. The primers were purchased from Eurofins Genomics (Ebersberg, Germany).

2.2. Chemical and Structural Characterisation of Biostimulant Treatment PSI-475

Ash, uronic acids, fucose, laminarin, free mannitol, and polyphenol content were evaluated according to Goñi et al. (2018) [32]. Total free amino acid content was determined using ninhydrin reagent [44]. The concentration of individual free amino acids was evaluated through a reversed-phase separation by HPLC (RP-HPLC) and UV detection of the aminoenones formed by the reaction of amino acids with the derivatisation reagent diethyl ethoxymethylenemalonate (DEEMM) [45]. Total nitrogen was determined according to the Dumas method. Total phosphorus, potassium, sulphur, magnesium, boron, calcium, zinc, and iron were determined by acid digestion with nitric acid and quantification by inductively coupled plasma atomic emission spectroscopy (ICP-OES).
The molecular weight (Mw) distribution of PSI-475 protein hydrolysate was determined under physiological conditions using size exclusion chromatography (SEC). SEC analysis was performed using a Superdex 200 10/300GL column attached to an ÄKTA Purifier liquid chromatography system pre-equilibrated with the mobile phase (100 mM ammonium bicarbonate buffer, pH 9.0) and eluted using an isocratic program (0.75 mL min−1 for 40 min) at room temperature. Absorbance was measured at 280 nm to monitor the eluted proteins and peptides. Retention times of the observed peaks in the chromatograms were compared to those obtained for BSA (66 kDa), cytochrome C (12.4 kDa), and aprotinin (6.5 kDa) standards. The concentration of soluble peptides was estimated through gravimetric methods using the fractions separated from SEC analysis. The Mw distribution of poly and oligopeptides smaller than 30 kDa under denaturating conditions was also resolved using Tricine-SDS-PAGE according to Schägger (2006) [46].

2.3. Evaluation of Salinity Stress Tolerance in Arabidopsis Thaliana

An initial screening of the bioactive effect of PSI-475 was carried out on Arabidopsis thaliana (Col-0) seedlings. This experiment was based on a high throughput root microphenotyping platform in a 96-well format published previously [29,47] (Figure S1). Once Arabidopsis seeds germinated on the solid medium, the seedlings were subjected to unstressed and salinity stressed conditions by the selective addition of NaCl to the liquid nutrient medium (0 and 300 mM NaCl, respectively). Five concentrations of the PSI-475 (0, 2.5, 5, 10, and 25 mg L−1) were applied as biostimulant treatment. Distilled water was applied as an untreated control. Arabidopsis seedlings grew for 7 days at a temperature of 22/21 °C (day/night; 16/8 h) and 70% relative humidity (RH) under a light intensity of 100 µmol m−2 s−1. After this time period, the root system architecture parameters (primary root length and total root network length) were evaluated using Image J and Gia Roots software and expressed in mm [48]. Photosynthetic pigments were extracted from collected Arabidopsis seedling tissue in acetone:water (80:20), and their content was determined as described by Lichtenthaler and Buschmann (2001) [49], being expressed as chlorophyll (a + b) and carotenoid content on a fresh weight basis (mg g−1 FW).

2.4. Tomato Material and Growth Conditions

Tomato seeds (Lycopersicon esculentum, cv. Micro Tom) were purchased from Moles Seeds (Essex, UK). The tomato seeds were surface sterilised with sodium hypochlorite for 1 min before being thoroughly rinsed with distilled water. The seeds were set in plug trays using a growth medium composed of compost:vermiculite:perlite (6:1:1). After 28 days, the seedlings were transferred to 1-litre pots (same growth medium as previous with the addition of 2 g calcium carbonate lime and 1 g of slow releaser fertiliser containing N/P2O5/K2O (7/7/7, w/w/w). The plants were grown in a growth room at a temperature of 27/22 ± 1 °C with 16 h of daylight, 8 h of night and 80 ± 5% RH under a light intensity of 120 µmol m−2 s−1 in a complete randomised block design. The plants were placed in trays (22 plants/tray) and each tray was irrigated with 1 litre of tap water (EC: 0.7 dS m−1) three times per week. Temperature and relative moisture content were recorded regularly with a portable USB data logger (EBI300 TH, Ebro Electronic).

2.5. Salinity Stress Tolerance Experimental Design in Tomato

Prior to the application of salinity stress on the irrigation water, PSI-475 was applied by foliar spray at a rate of 2.5 mL L−1 on 56-day-old plants (T0; early flowering stage). Water was applied as a control. After 3 days, salinity stress had started in half of the plants by watering them with 50 mM NaCl (EC: 5.8 dS m−1) for 7 days and 100 mM NaCl (EC: 10.7 dS m−1) for 21 additional days (1 litre of saline water per tray, 3 times per week). To minimise the influence of any positional effect, the relative position of the pots was changed every other day. Tomato pollination was facilitated using an electric toothbrush on tomato flowers. After 28 days of adding saline water, the stressed plants were watered again with tap water (EC: 0.7 dS m−1), and PSI-475 treatment was applied again as a foliar spray at 2.5 mL L−1. The control plants were sprayed with water. Tap water irrigation (2 litres per tray, 3 times per week) was maintained for 67 days under the conditions described above to obtain 154-day-old plants. Tomato fruits were harvested in 126 and 154-day-old plants. A plant phenotypical evaluation was also carried out at the end of the plant trials (154-day-old plants). Leaf samples were collected at T1 (end of saline irrigation water period; 87-day-old plants) and T2 (2 weeks after finishing saline irrigation water period; 101-day-old plants) points at 2 h after the end of the light period, snap-frozen in liquid nitrogen, ground, and kept in −80 °C until further analysis. Additional leaf samples were also collected at T1 and T2 for relative water content (RWC) determination. Fruit tissue was also collected during the harvest stage to determine quality parameters. The other half of the plants (control and treated with PSI-475) was grown under unstressed conditions for 154 days (watering them with tap water and using the same volume as stressed plants; EC: 0.7 dS m−1) and analysed in the same way as the stressed plants (Figure S2).

2.6. Determination of Electrical Conductivity in Tomato Growth Medium

The EC from growth medium samples was measured at T0, T1, and T2 points to evaluate the salinity stress level present in the root zone. The EC expected for a saturated paste filtrate was calculated through a calibration curve made with different growth medium and water ratios (1:5, 1:8, 1:10, 1:15) according to VanderGheynst et al. (2004) [50] and expressed as dS·m−1.

2.7. Evaluation of Tomato Plant Phenotypic Markers

Four phenotypic parameters were recorded at the end of the plant trials after dividing tomato plants into roots and aboveground plant organs. Plant height was recorded as the start of the stem (at soil level) and ending with the highest point of the plant in centimetres. Plant aboveground biomass was determined after harvesting all the fruits. Primary root length was measured between the start of the root system (just below soil level) and the largest root tip and recorded in centimetres. Finally, root tissue was washed carefully with tap water to remove any growth medium particles, and root biomass was determined after drying the washed tissue for 12 h at 24 °C.

2.8. Evaluation of Tomato Fruit Yield and Quality Parameters

The total number of harvested fruits and fruit biomass per plant was used as fruit yield parameters. Moreover, a random selection of 20–25 harvested tomato fruits was made for determining fruit quality traits. Fruit samples were ground with an electric food chopper, and then the pulp and juice were separated by centrifuging the obtained fruit paste at 14,500× g at 10 °C for 10 min. After measuring the pH of each tomato juice sample, its sugar content was determined using a digital hand-pocket PAL-1 refractometer (Atago, Japan) at 20 °C and expressed as °Brix. The total titratable acidity (TTA) was determined by titrating the tomato juice sample with 0.1 M NaOH and phenolphthalein. The obtained result was expressed as grams of citric acid per 100 mL of tomato juice after preparing a calibration curve with citric acid (0–1% w v−1) [51].

2.9. Tomato Leaf Ion Content Analysis

The content of Na+ and K+ from leaf tissue collected at T1 and T2 sample points was determined after their acid extraction and further evaluation by atomic emission spectroscopy (AES), according to Munns et al. (2010) [52]. A total of 10 mg of dried leaf material was dissolved with 2.5 mL of 0.5 M HNO3 and incubated at 80 °C for 1 h. After extraction, the samples were centrifuged at 21,000× g for 10 min at 4 °C. The supernatants were collected and diluted with distilled water before measuring the ion content. The contents of Na+ and K+ were determined using AES at 589 and 766.5 nm, respectively (PerkinElmer Instruments AAnalyst 100 Spectrometer, PerkinElmer, Inc., Waltham, MA, USA). Calibration curves were prepared using certified Na+ and K+ primary standards and the ion content was expressed on a dry weight basis (mg g−1 DW).

2.10. Tomato RNA Extraction and RT-qPCR

RNA was extracted and purified from 30 mg of frozen ground leaf tissue collected at T1 and T2, according to Carmody et al. (2019) [39]. RNA concentration, purity, and integrity were measured using Qubit (Thermo Fisher Scientific, Waltham, MA, USA). The expression analysis of SOS1 (Solyc01g0050203.1), NHX1 (Solyc06g008820.3), and HKT1;2 (Solyc07g014680.3) genes was performed by RT-qPCR using a Roche LightCycler® 96 System and the LightCycler® RNA Master SYBR Green I one-step kit (Roche Life Science) according to the manufacturer’s instructions. The expression level of the tomato EF1α gene (Solyc06g005060.2) was used as a reference according to Løvdal and Lillo (2009) [53]. The 2−ΔΔCT method was used to quantify the relative normalised gene expression levels, and the unstressed control worked as the calibrator sample. The primer sequences used were as follows:
SlSOS1-FW→ GACTTGGGGCTTTAGAGTATGG
SlSOS1-REV→ GAGCAGGAAGGAAAACCGCC
SlNHX1-FW→ GGCTAGTTGCAATCATGGGG
SlNHX1-REV→ CAAGAGCGGTGATGGAATCG
SlHKT1_2_FW→ CCTACCGTCTTTTCGTCCTCA
SlHKT1_2_REV→ AGGTAAAAGCTTCCCCACCA

2.11. Tomato Leaf RWC

RWC measurements were performed on leaves collected at T1 and T2 sample points according to Goñi et al. (2018) [32].

2.12. Tomato Leaf Proline and Soluble Sugars Analysis Determination

The levels of proline and soluble sugars (expressed as glucose, fructose, and sucrose) were determined by spectrophotometry and HPAEC-PAD in tomato leaf tissue (T1 and T2 sampling points) according to the protocols described by Goñi et al. (2018) [32]. The values were expressed with respect to the leaf’s dry weight (mg g−1 DW)

2.13. Tomato Leaf Photosynthetic Pigments and Soluble Protein Content Analysis

The evaluation of photosynthetic pigment content in tomato leaf tissue (T1 and T2 sampling points) was evaluated as described in Arabidopsis seedling tissue (Section 2.3) and expressed as chlorophyll (a + b) and carotenoids content on a dry weight basis (mg·g−1 DW). Leaf soluble protein was evaluated in frozen ground tomato leaf material collected at T1 and T2 sample points and expressed with respect to dry weight (mg g−1 DW), as described previously [29].

2.14. Statistical Analysis

Chemical and molecular analysis of PSI-475 was performed using at least three biological replicates. The effect of PSI-475 on the Arabidopsis thaliana root microphenotyping system was developed in 4 independent experiments with at least 32 biological replicates per treatment and condition. Tomato plant and fruit phenotypic assessment was carried out in 3 independent trials with at least 22 plants per treatment and condition. For EC in tomato growth medium, fruit quality, RWC, and biochemical and molecular analysis, at least three biological replicates and three technical replicates per biological replicate were used for each treatment and condition using the plant samples described above. Unless stated otherwise, all data are expressed as mean ± standard error (SE). The statistics were evaluated with Sigma Plot 12 and Statgraphics Centurion XVI software. Two-way ANOVA with Tukey’s HSD test (p ≤ 0.05) was used to compare plant data obtained from Arabidopsis and tomato in order to assess the interaction between the two factors S (salinity stress) and PSI-475 (P). Where the interaction between the two factors (S × P) was significant, data were subjected to one-way ANOVA with Tukey’s HSD test (p ≤ 0.05), comparing all S × P means with each other. The application of all parametric tests was performed after checking the data normality (Shapiro–Wilk test) and equal variance assumptions. Principal component analysis (PCA) was performed to establish if a correlation existed between the different phenotypic, physiological, biochemical, and molecular markers evaluated in tomato trials. The PCA analysis was assessed using XLSTAT software package version 2014.5.03 through the correlation matrix Pearson n-1. The correlation biplot was determined based on the first and second principal components (PCs).

3. Results

3.1. Chemical and Structural Characterisation of PSI-475

The biostimulant used in this study was characterised chemically as having ash, different rates of seaweed carbohydrates (total uronics representing mainly alginate, fucose, laminarin, and free mannitol), polyphenols, total free amino acids, and soluble peptides (Table 1). The aminogram obtained for PSI-475 using RP-HPLC showed that the most abundant free amino acids were glutamic acid (9.1%), asparagine (6.1%), serine (12.1%), alanine (10.6%), methionine (12.2%), tyrosine (8.8%), and proline (6.5%). While several elements and microelements are present in PSI-475, its nutrient content was considered low and only total K and N content was above 1% w v−1 (Table 1). The molecular weight profile of PSI-475 protein hydrolysate determined through SEC analysis showed that most of the components were oligopeptides ranging between 0.2 and 12 kDa, having a peak maximum between 3 and 8 kDa (Figure 1A). Tricine SDS-PAGE analysis developed under denaturating conditions confirmed that most of the PSI-475 oligopeptide bands were present between 1 and 8 KDa (Figure 1B).

3.2. Effect of Salinity Stress and PSI-475 on Arabidopsis Thaliana

The effect of PSI-475 was first evaluated in the model plant Arabidopsis thaliana using a high throughput root microphenotyping platform (Table 2). When a two-way ANOVA test was completed, it was found that all three factors (salinity stress, PSI-475 treatment, and S × P interaction) were statistically significant for primary root length. The application of PSI-475 at 5 mg L−1 significantly increased the primary root length in unstressed seedlings by 13% compared to the unstressed control. Salinity stressed conditions (300 mM NaCl for 7 days) moderately decreased primary root length (−14.9%) compared to the unstressed control. However, seedlings treated with PSI-475 at 10 mg L−1 effectively counterbalanced the negative effects of salinity stress and increased primary root length by 20% compared to the stressed control (Table 2). Statistical analysis showed that the total root network length parameter, which quantifies both primary and lateral root growth, was significantly affected by salinity stress (p ≤ 0.001), decreasing by 16% in stressed seedlings. However, the application of PSI-475 did not induce any statistically significant differences in this root parameter compared to the control. As shown in Table 2, there was a statistically significant interaction S × P (p ≤ 0.001) for both chlorophyll (a + b) and carotenoids content in Arabidopsis seedlings. The application of PSI-475 in unstressed seedlings had statistically significant effects on chlorophyll (a + b) and carotenoids content at high concentrations (from 10 mg L−1), increasing their values to between 18.8% and 40.1% compared to the unstressed control (Table 2). While salinity stressed plants had a decrease of 60% for both photosynthetic pigments in control plants compared to untreated unstressed seedlings, those stressed seedlings treated with PSI-475 at 5 mg L−1 were characterised by a significant increase in chlorophyll (a + b) (+63%) and carotenoids (+51.3%) content compared to the stressed control.

3.3. Effect of Salinity and PSI-475 on Tomato Phenotypic, Fruit Yield and Fruit Quality Parameters

Table 3 shows the data on phenotype, fruit yield, and fruit quality parameters evaluated at the end of the tomato plant trials developed under unstressed and salinity stressed conditions. There was no statistically significant effect of either salinity or PSI-475 on plant aboveground biomass. However, salinity stress negatively affected other phenotypic parameters, such as plant height, primary root length, and root biomass (p ≤ 0.001), decreasing their average values by 13.1%, 8.9%, and 24.6%, respectively. Interestingly, and as observed in Arabidopsis thaliana, PSI-475 also had a statistically significant effect on primary root length, increasing this parameter by 5.5% on average compared to untreated plants grown under unstressed and stressed conditions. Fruit yield was compromised when tomato plants were exposed to salinity stress, decreasing this parameter by 37.5% compared to that obtained in unstressed plants. However, plants treated with PSI-475 showed higher fruit numbers and fruit yields under both unstressed and stressed conditions (36.3% and 22.4% on average, respectively) (Figure S3). Interestingly, the fruit yield increase was higher for stressed treated plants (+31.8% versus stressed control) than those treated and growing under unstressed conditions (+16.9% versus unstressed control). This positive effect can be visualised in the fruit assessment from Figure S3. Salinity stress also had a statistically significant effect on both fruit quality parameters, increasing the average sugar content (measured as °Brix) and TTA by 22.2% and 19.7%, respectively. Remarkably, PSI-475 caused a moderate average increase in the sugar content of the fruit under both unstressed and salinity stressed conditions (+9.9% on average; p ≤ 0.05) (Table 3).

3.4. Effect of Salinity and PSI-475 on Tomato Leaf Sodium and Potassium Content

As can be observed in Figure S4, the EC estimated for a saturated paste filtrate of the growth medium from unstressed plants ranged between 1.61 and 2.47 dS m−1. However, this parameter reached a maximum at the T1 sample point (10.41 dS m−1) for stressed treatments and only decreased by 39% after rewatering the pots with tap water for 14 days (T2 sample point; 6.40 dS m−1). The analysis of leaf Na+ and K+ content at T1 and T2 sample points confirmed the substantial effects of the saline irrigation program and the impact of PSI-475 application on ion homeostasis (Table 4). The two-way ANOVA analysis showed that all three factors (condition, PSI-475 treatment, and S × P) were highly significant (p ≤ 0.001) for leaf Na+ content at the T1 sample point. After exposing untreated plants to 28 days of the saline water irrigation program, leaf Na+ increased by 14.4-fold compared to unstressed control plants (p ≤ 0.001). However, PSI-475 was able to significantly reduce leaf Na+ by 20% in comparison to untreated stressed plants (p ≤ 0.001). A non-statistically significant increase of leaf K+ content was measured in both unstressed and stressed treated plants at the T1 sample point (+9.5% on average for both conditions; p = 0.236). At the T2 sample point, there was a statistically significant effect of salinity stress and PSI-475 application on leaf K+ content. While salinity stress decreased leaf K+ content by 15% (p = 0.003), PSI-475 treatment was able to induce the accumulation of this ion by 12% on average in both unstressed and salinity stressed plants (p = 0.011). Moreover, leaf Na+ content increased by nearly 27-fold in stressed plants compared to unstressed ones at the T2 sample point, confirming the presence of ion toxicity stress after rewatering the pots with tap water. Table 4 also shows how the K+/Na+ ratio was a useful marker to describe the disruption of ion homeostasis because of stress presence and the PSI-475 effect. Interestingly, it was improved by 32.3% (p = 0.128) in stressed plants treated with PSI-475 at the T1 sample point but it was similar in stressed treated and control plants at the T2 sample point (Table 4).

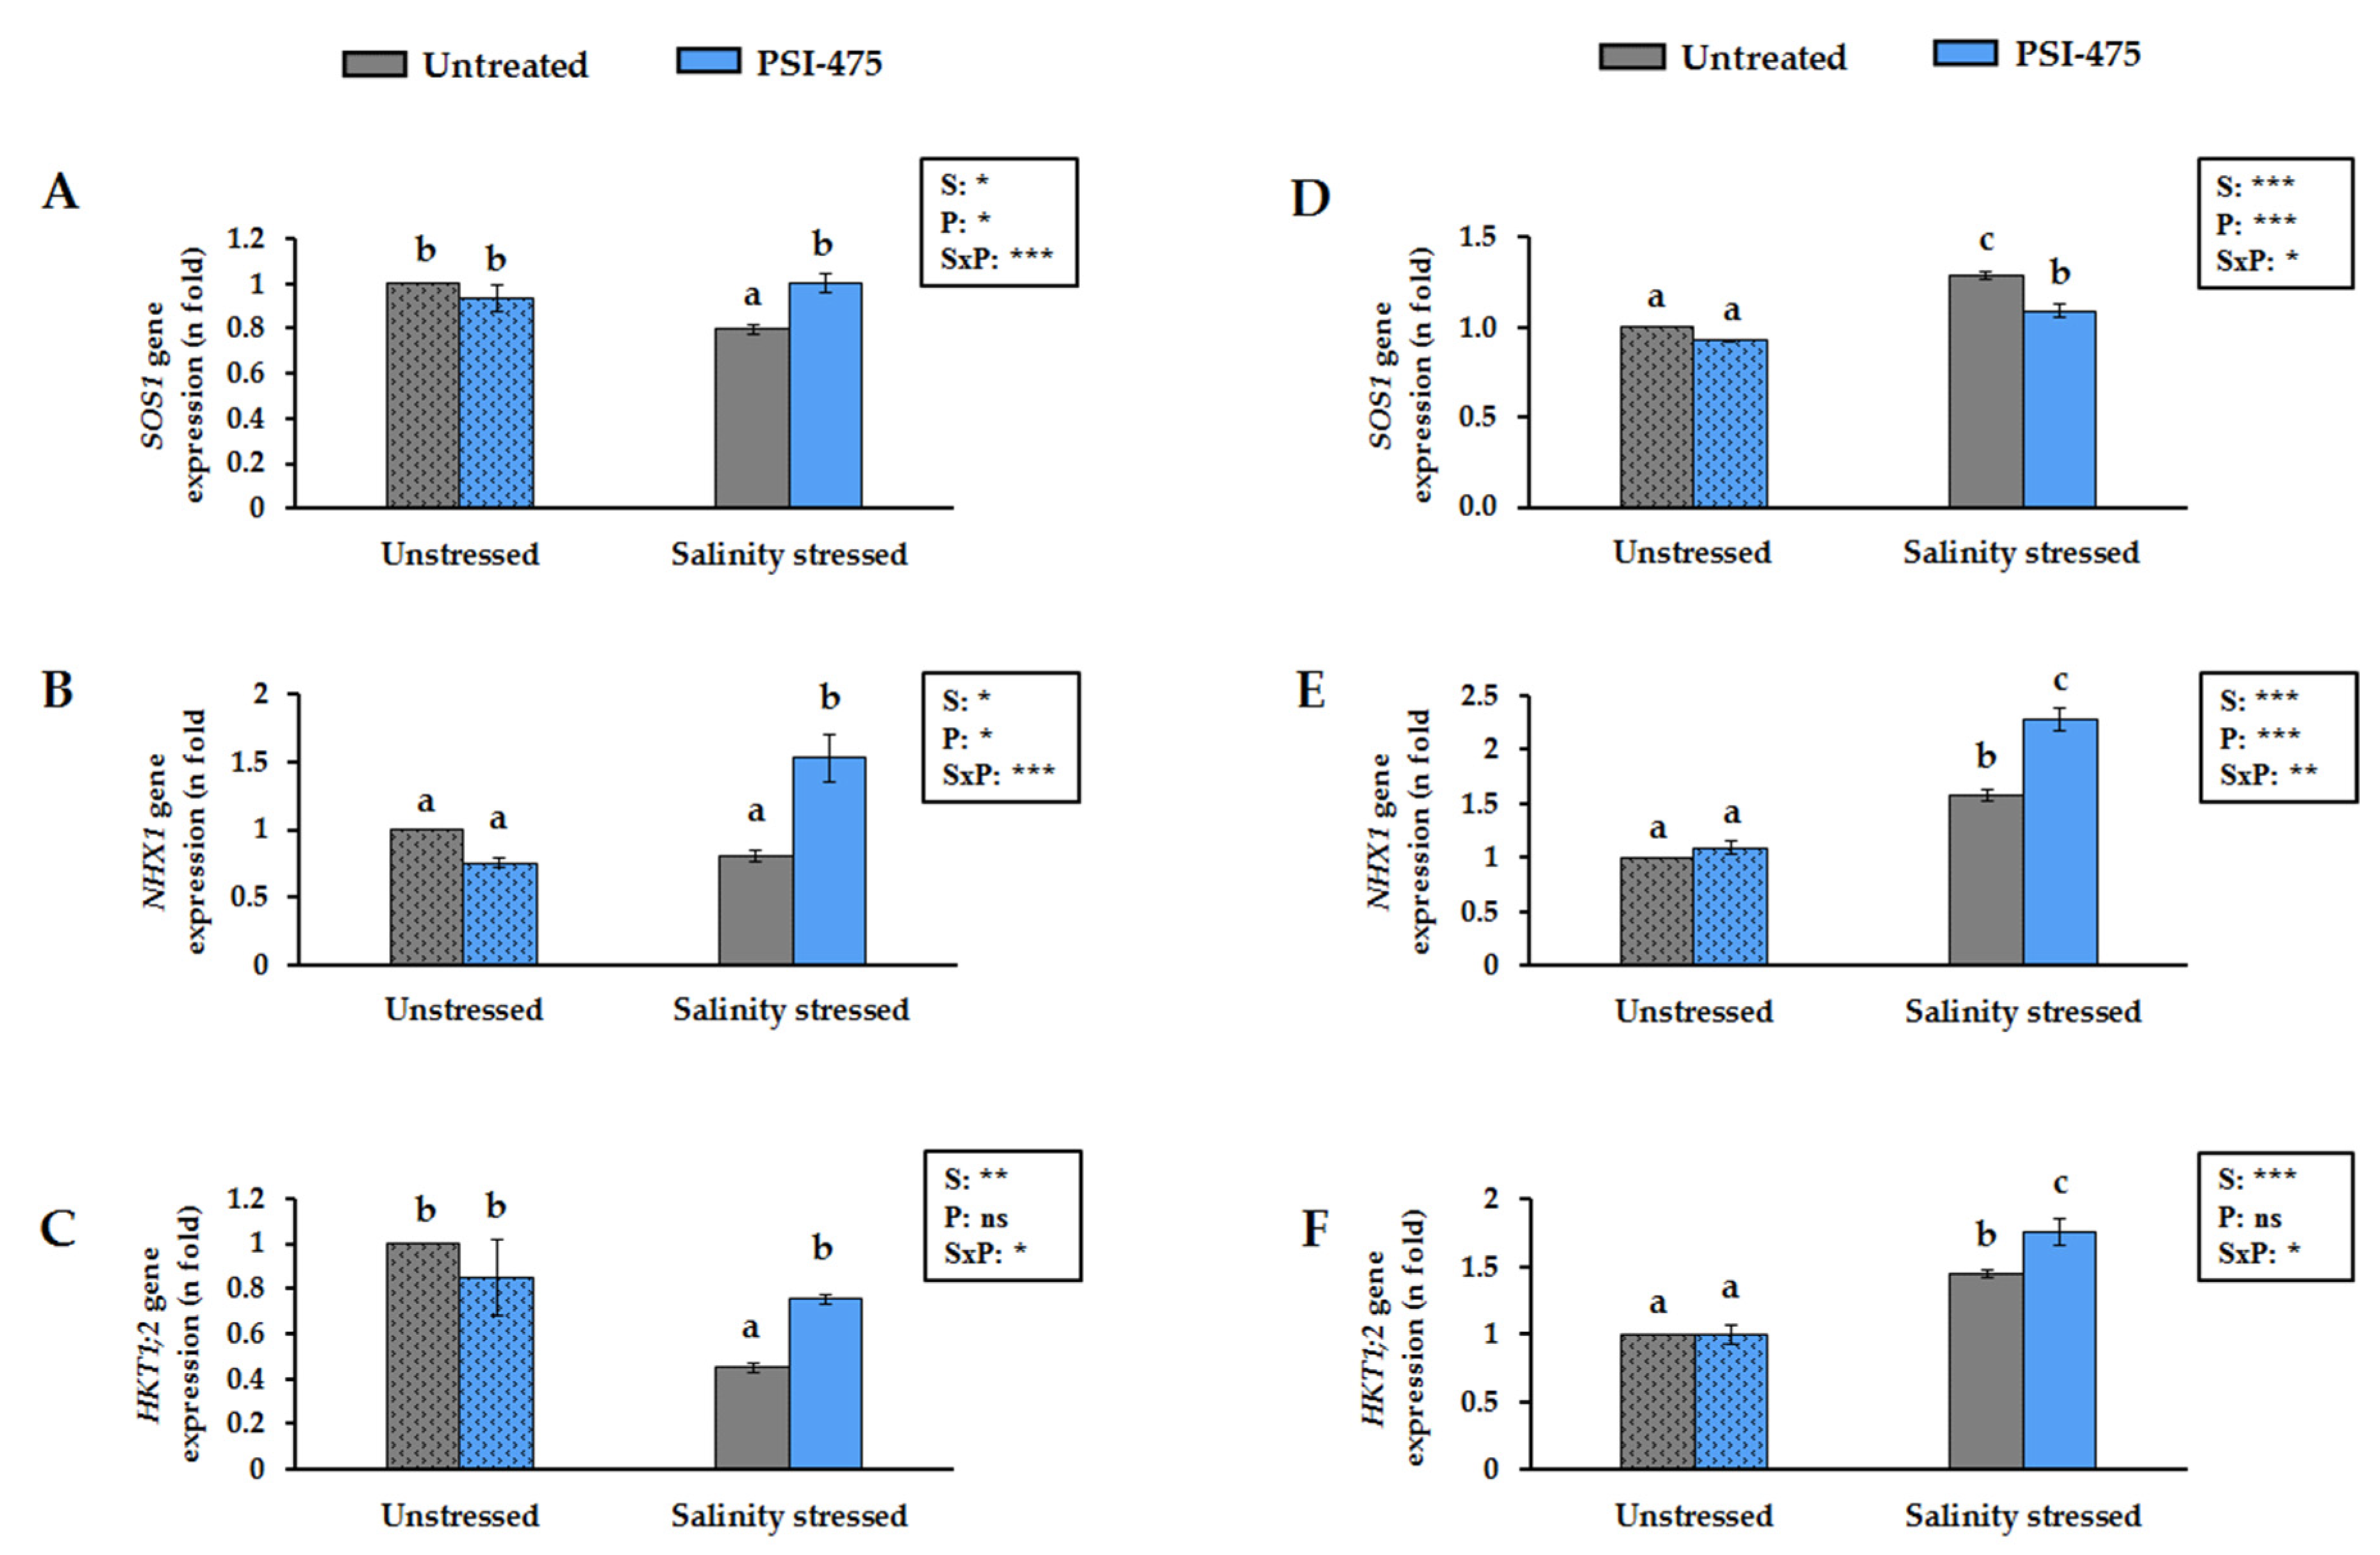
3.5. Effect of Salinity and PSI-475 on Tomato Leaf SOS1, NHX1 and HKT1;2 Gene Expression Levels

Following ion content analysis, a molecular approach was used to strengthen the understanding of the mode of action of PSI-475 on tomato ion homeostasis during salinity stress. The relative expression levels of three genes encoding sodium transporters (SOS1, NHX1, and HKT1;2) was calculated with respect to the respective unstressed control at T1 and T2 sample points (Figure 2). The two-way ANOVA analysis showed that there was a statistically significant interaction S × P for all gene expression data. At the T1 sample point, stressed control plants showed a significant downregulation of SOS1 and HKT1;2 with respect to unstressed control (0.80 and 0.45-fold, respectively). While PSI-475 did not induce any statistically significant differences on the gene expression levels of these ion transporters in unstressed plants, a specific effect was measured in stressed treated tomato plants. The gene expression levels of SOS1, NHX1, and HKT1;2 was significantly upregulated by 1.26, 1.90, and 1.68-fold with respect to stressed control, respectively (Figure 2A–C). At the T2 sample point, stressed control plants showed a significant upregulation of SOS1, NHX1, and HKT1;2 with respect to unstressed control (1.28, 1.45, and 1.58-fold, respectively). A second application of PSI-475 to unstressed plants did not have any statistically significant effect on SOS1, NHX1, and HKT1;2 expression levels compared to unstressed control (Figure 2D–F). While the SOS1 gene expression level decreased by 1.18-fold with respect to the stressed control in treated plants (Figure 2D), relative expression of NHX1 and HKT1;2 was significantly induced in stressed plants treated with PSI-475 at the T2 sample point (1.44 and 1.22-fold, respectively) (Figure 2E,F).

3.6. Effect of Salinity and PSI-475 on Tomato Leaf RWC, Proline, and Soluble Sugars Content

As can be observed in Table 5, RWC in leaf tissue at the T1 and T2 sample points was chosen as a physiological marker to evaluate the plant water status during the tomato trials. The two-way ANOVA showed that there was a statistically significant interaction S × P in the leaf RWC data at T1 (p ≤ 0.05). After exposing untreated plants to 28 days of the saline irrigation water program, leaf RWC decreased by 4.5% compared to unstressed control plants. However, PSI-475 caused RWC to increase significantly by 2.9% and 1.7% in comparison to the unstressed and stressed control plants, respectively. At the T2 sample point, 2 weeks after the second PSI-475 spray and finishing the saline irrigation water program, it was found that leaf RWC was also statistically significant for the interaction S × P (p ≤ 0.05). While this marker decreased significantly by 9.3% between stressed and unstressed control plants, the application of PSI-475 increased leaf RWC at T2 by 5.8% in stressed plants compared to stressed control (Table 5).
The accumulation of osmolytes, such as proline and soluble sugars (glucose, fructose, and sucrose), was determined in tomato leaf at T1 and T2 sample points in order to determine the presence of common osmoprotectant mechanisms (Table 5). Salinity stress factor at T1 had a strong statistically significant effect on proline, glucose, and sucrose (p ≤ 0.001), increasing their content by 3.7, 1.2, and 2.3-fold, respectively. The effect of PSI-475 was statistically significant on leaf glucose content at T1, inducing a strong accumulation compared to untreated control in both unstressed and stressed plants (+42% on average). While the two-way ANOVA analysis showed a significant interaction of S × P for leaf fructose content at the T1 sample point (p ≤ 0.05), we only observed statistically significant differences between unstressed and stressed plants. Proline content was also considerably affected by salinity stress in 101-day-old tomato plants at the T2 sample point (p ≤ 0.001). A statistically significant proline accumulation was also observed in plants treated with PSI-475 versus control regardless of the presence or not of salinity stress (+26.2% on average). Likewise, there was a significant interaction occurring between condition and PSI-475 treatment for glucose, fructose, and sucrose content (p ≤ 0.001). While PSI-475 only stimulated a statistically significant accumulation of fructose in unstressed plants with respect to unstressed control (22%), a different pattern was observed in stressed plants. Compared to stressed control, leaf sucrose content increased by nearly 20% in stressed plants treated with PSI-475 but glucose content decreased by 24% (Table 5).

3.7. Effect of Salinity and PSI-475 on Tomato Leaf Soluble Protein and Photosynthetic Pigments

After irrigating tomato plants with saline water for 28 days (T1 sample point), leaf soluble protein and carotenoids content showed a statistically significant decrease compared to unstressed plants (21% and 11%, respectively) (Table 6). The application of PSI-475 stimulated a common positive significant effect in both unstressed and salinity stressed plants at the T1 sample point. On average, tomato plants treated with this biostimulant increased their leaf soluble protein, chlorophyll (a + b), and carotenoids by 25.1%, 14.9%, and 8.7%, respectively. At the T2 sample point, the harmful effect of salinity stress was more pronounced for leaf soluble protein and photosynthetic pigment markers (21–23% content decrease). A positive effect was observed in these three parameters after applying PSI-475, although only the increase of chlorophyll (a + b) leaf content was significant for both unstressed and salinity stressed plants (+9.7% on average to both conditions; p = 0.034).

3.8. PCA Evaluation

A PCA model with 34 phenotypical, physiological, biochemical, and molecular variables was compiled to obtain an overview of the effects of salinity stress and PSI-475 treatment on tomato plants (Figure 3). The first two PCs were related with Eigenvalues > 5 and explained 86.35% of the total variance. PC1 was strongly positively correlated to fruit yield, fruit number, plant height, root weight, both root phenotypic parameters, RWC at T1 and T2, photosynthetic pigments content at T1 and T2, leaf K+ content at T1 and T2, leaf soluble protein content at T1 and T2, leaf fructose content at T2, and gene expression of HKT1;2 (at T1 and T2) and SOS1 (at T1). PC1 was also strongly negatively correlated to leaf Na+, proline, sucrose, and glucose content at T1 and T2, both fruit quality parameters (°Brix and TTA), and the gene expression of NHX1 and SOS1 at T2. Moreover, PC2 was strongly positively correlated to fruit number, leaf chlorophyll (a + b), K+, sucrose and fructose content at T1, and gene expression of HKT1;2 (at T1), SOS1 (at T1), and NHX1 (at T1 and T2). Furthermore, the PCA scatter plot split the samples into four main groups, with unstressed control (UC) and unstressed treated (UPSI-475) clustered in the positive side of PC1 but separated regarding the side of PC2 (negative for UC and slightly positive for UPSI-475), being associated to higher fruit yield. Stressed treated (SPSI-475) plants were distributed on the positive side of PC2 but slightly negative of PC1, where fruit quality and gene expression levels of Na+ transporters were higher. However, the stressed control (SC) sample was completely separated from the other three samples and distributed in the lower left quadrant, negatively correlated to the fruit yield variable vector.

4. Discussion

The prolonged use of salinised water in irrigation regimes of highly productive vegetable crop systems in arid and semi-arid regions represents a classical example of a vicious circle. In response to increased global food demand and advances in optimised crop yields, growers in these areas have increased the use of human and natural resources to capitalise on their localised agro-climatic benefits for industrial high-value crop production. These benefits allow them to satisfy global food markets with a continuous supply of vegetable crops during the whole season. However, it also requires the use of intensive fertilisation practices and higher amounts of irrigation water per area. This leads to the reduction of the region’s aquifers and increased salinity problems that contribute to adverse agronomic, economic, and environmental consequences [1,2,3,11,12,13]. In the current work, we investigated the potential of a protein hydrolysate and Ascophyllum nodosum-derived biostimulant, PSI-475, to effectively enhance salinity stress tolerance through a defined mode of action in the model plant Arabidopsis thaliana and a strategic vegetable crop (tomato).

4.1. Impact of PSI-475 and Salinity Stress on Phenotypical, Yield, and Quality-Related Markers

Because roots are the frontline organs of early perception and injury for salinity stress [10,54], the first screening of PSI-475 biostimulant activity was carried out on Arabidopsis thaliana using a high throughput root microphenotyping technique [29,47] (Table 2). The application of 300 mM NaCl in the liquid growth medium for 7 days was enough to observe a consistent reduction of primary root length and total root network length between unstressed and stressed controls. However, the extent of primary root growth repression was reduced when PSI-475 was added at 10 mg L−1 to the liquid growth medium of Arabidopsis seedlings. Similar benefits were found in 154-day-old tomato plants treated with two foliar applications of PSI-475 (2.5 mL L−1) and subjected to long-term irrigation salinity stress (Table 3). These results were comparable to other commercial biostimulants based on protein hydrolysates and ANEs [34,35,55] and indicate that both foliar and root applications of PSI-475 can mitigate the adverse effects of salinity stress on primary root growth. The root growth-promoting effect of PSI-475 was also measured in a dose-dependent manner in unstressed Arabidopsis seedlings and tomato plants. Unlike some animal-derived PHBs [56,57], no growth repression was observed at the highest dose tested in Arabidopsis thaliana (25 mg L−1), suggesting that the PSI-475 biostimulant shows a positive broad effect in modulating primary root elongation under unstressed and salinity stressed conditions.
The fundamental objective of salinity stress research in agriculture is to increase crop tolerance to enhance their yield under adverse conditions. Despite applying highly saline irrigation water for only 1 month, this stress regime was characterised as inducing elevated growth medium EC from early flowering until fruit harvest stages. As observed in other similar studies, the applied salinity stress model significantly affected plant height, root length, fruit number, fruit yield, and fruit quality traits in untreated tomato plants [39,40,41,42,43,58,59,60]. The obtained results provided strong evidence about PSI-475 efficacy in closing the 42% fruit yield gap in salinity stressed plants by nearly 50% (Table 3). A significant increase in tomato fruit number and fruit yield in unstressed plants was also observed. While there is a vast literature about the beneficial effects of PHBs and ANEs on fruit yield and fruit number under unstressed conditions [25,26,27,61], there is no relevant information that demonstrates that these component materials can increase yield in any fleshy vegetable crop species under salinity stress conditions. Most research to date has focussed on leafy vegetables, legumes, and cereal plant species [33,34,35,36,37].
As mentioned in previous studies, the applied salinity stress also increased the soluble sugars (°Brix) and acidity (TTA) of control stressed fruits compared to those unstressed, untreated plants [39,41,42,60,62]. Interestingly, the PSI-475 biostimulant further enhanced the accumulation of soluble sugars in tomato fruits with respect to both unstressed and stressed controls (Table 3). This finding is supported by previous studies about the effect of PHBs on chilli pepper and tomato [61,63,64] and could represent an additional benefit of PSI-475 for enhancing organoleptic quality traits of a tomato crop on top of its observed ability to enhance fruit yield [39,65].

4.2. Impact of PSI-475 and Salinity Stress on Physiological, Biochemical, and Molecular Markers

Salinity stress limits the growth and development of plants by affecting various physiological and biochemical mechanisms, such as ion content modulation, biosynthesis of osmoprotectants, photosynthesis inhibition, and activation of the antioxidant system [7,9,10]. Toxic accumulation of Na+ in plants growing under salinity stress conditions can perturb their ability to regulate K+ accumulation, making ion homeostasis challenging [7,8]. Interestingly, salinity stressed plants treated with PSI-475 significantly decreased their leaf Na+ content after irrigating tomato plants with highly saline water for 28 days. This led to a non-statistically significant improvement of leaf K+/Na+ ratio (Table 4). However, 14 days after receiving the second foliar application of PSI-475, stressed plants increased both leaf Na+ and K+ content and displayed a similar K+/Na+ ratio to that measured in control stressed plants at the T2 sample point. These results suggest that PSI-475 could stimulate different ion homeostasis mechanisms depending on several factors, such as crop developmental stage and stress intensity.
The coordinated upregulation of genes encoding the plasma membrane antiporter SOS1, which extrudes Na+ from the cytoplasm to the apoplast [19,66], and the selective HKT1;2 transporter, involved in Na+ removal from the xylem flow preventing its accumulation in photosynthetic tissues [23,67], in stressed plants treated with PSI-475 at T1 could explain the Na+ content reduction in leaf tissue compared to the stressed control (Figure 2). The specific role of SOS1 and HKT1;2 improving ion homoeostasis in leaf tissue has been experimentally corroborated in tomato [16,17,19] and glycophyte species [18,68]. However, at the T2 sample point, treated plants reduced leaf HKT1;2 upregulation and had lower levels of SOS1 expression than stressed controls, giving a possible reason for the similar leaf K+/Na+ ratio. Consistent with the mechanism of Na+ detoxification by vacuolar compartmentalisation, relative expression of NHX1 vacuolar antiporter increased in all sample points in stressed plants treated with PSI-475. Numerous studies have confirmed the positive correlation between the overexpression of NHX genes in leaf and root tissues and improved salinity stress tolerance in Arabidopsis thaliana and tomato crops [20,69,70,71].
Irrigation with salinised water can generate a loss of turgor of the leaves as a result of the osmotic stress. The application of PSI-475 in salinity stressed tomato plants partially recovered leaf RWC reduction of stressed control plants, which could be explained through the activation of osmotic stress tolerance mechanisms (Table 5). As recently calculated by Munns et al. (2020) [72], energy-efficient osmotic adjustment mechanisms in plants growing in saline environments would require accumulation of Na+ and Cl- in vacuoles and of organic osmolytes and K+ in the cytoplasm. Therefore, the upregulation of SOS1 and NHX1 in stressed plants treated with PSI-475 at T1 could not only help avoid ion toxicity but also enable high Na+ concentrations in the extracellular and/or vacuolar spaces that can serve as osmolyte, contributing to the measured higher leaf RWC. A significant increase in the content of proline and sucrose in salinity stressed tomato plants after the second foliar application of PSI-475 (T2 sample point) could have also contributed to the maintenance of a favourable water uptake with positive effects on leaf cell turgor. These metabolic changes on proline and sucrose agreed with the results obtained after applying plant-derived PHBs to salinity stressed lettuce and bean plants [34,36].
Both experimental plant models used to test PSI-475 performance showed the significant negative impact of salinity stress applied for short or long periods on photosynthetic pigments content. Likewise, the positive effect of PSI-475 on these metabolic markers was also observed in both Arabidopsis and tomato plants growing under unstressed and stressed conditions, confirming the trend observed in the stimulation of primary root growth and suggesting the broad scope of benefits provided by PSI-475 in different plant species and growth conditions (Table 1 and Table 6). These positive results obtained after the application of PSI-475 on total chlorophyll and carotenoids content are comparable with the effect provided by other commercial PHBs and ANEs in stressed plants [32,33,36,37], which are linked to improved photosynthetic efficiency and/or a role in detoxifying plant cells from reactive oxygen species (ROS) generated under salinity stress conditions [7,9,58].
Under unstressed conditions, PSI-475 was able to enhance leaf K+ at T1 and T2 sample points, which was strongly positively correlated to fruit yield variables in the PCA model (Figure 3). The accumulation of this essential macronutrient for plant physiology and metabolism at reproductive stages has been previously associated with improved tomato fruit productivity [73]. This effect, along with the higher content of leaf soluble protein and soluble sugars, could be a result of a stimulating action on C and N metabolism pathways, which may enhance plant growth and fruit production. Similar results have been observed in different crops after applying commercial PHBs and ANEs, with the effect being attributed to a coordinated upregulation of the activity of enzymes and expression of genes encoding nutrient transporters and enzymes involved in primary C and N metabolism [29,57,61,74,75].
The ability of specific biomolecules within PSI-475 to induce plant growth and abiotic stress defence responses represents the most probable mechanism of action. As observed recently by Alfosea-Simón et al. (2020) [76], foliar application of amino acids (glutamic acid, proline, arginine, methionine, and tryptophane) displayed positive and negative interactions on salinity stressed tomato plants depending on the type of amino acid or amino acid mixture. Some experimental evidence has also suggested the role of oligopeptides and low molecular weight peptide fractions to function as growth and development signalling molecules, metabolic reprogramming, and plant defence [77]. Additionally, the ability of seaweed carbohydrates to work as elicitors is well-known, stimulating efficient plant growth and abiotic stress tolerance mechanisms in several crop species [78]. The targeted formulation of specific molecular entities derived from these component materials is likely to increase the efficacy and robustness of the induction of crop salinity tolerance. The data presented here for PSI-475 suggests that this is possible.

5. Conclusions

The induction of stress tolerance by the biostimulant PSI-475 was characterised by the activation of general and specific responses in Arabidopsis thaliana and tomato plants under unstressed and salinity stressed conditions. The salinity stress-induced root growth repression and fruit yield gap were significantly reduced by the application of PSI-475. PSI-475 was able to maintain a better ion homeostasis modulated by the upregulation of genes encoding Na+ transporters and enhanced osmotic stress tolerance in tomato plants. These specific tolerance responses to salinity stress were complemented with additional benefits at the biochemical level (e.g., photosynthetic pigments and soluble protein content), which was also observed in unstressed plants treated with PSI-475, leading to higher crop performance. The data generated indicates that the precision-engineered biostimulant PSI-475 can be a tool for farmers to alleviate the damage of irrigation salinity stress, leading to enhanced crop productivity and quality. However, further experimental work is necessary to get a better understanding of the molecular networks through which PSI-475 acts in plants, supporting the development of more efficient products for sustainable agriculture in stressful environments.

Supplementary Materials

The following are available online at https://www.mdpi.com/article/10.3390/agronomy12040809/s1, Figure S1: High-throughput Arabidopsis thaliana root microphenotyping system used to determine the effect of salinity stress and PSI-475, Figure S2: Graphical representation of tomato plant trials using a 1-month saline irrigation water program to evaluate the bioactivity of PSI-475, Figure S3: Effect of salinity stress and PSI-475 on tomato fruit number and yield, Figure S4: Determination of growth medium EC on tomato trials under unstressed and salinity stressed conditions.

Author Contributions

Conceptualisation, E.I., O.G. and S.O.; methodology, E.I. and O.G.; software, E.I. and O.G.; validation, E.I., O.G. and S.O.; formal analysis, E.I. and O.G.; investigation, E.I. and O.G.; resources, O.G. and S.O.; data curation, E.I. and O.G.; writing—original draft preparation, E.I., O.G. and S.O.; writing—review and editing, E.I., O.G. and S.O.; visualisation, E.I., O.G. and S.O.; supervision, O.G. and S.O.; project administration, O.G. and S.O.; funding acquisition, O.G. and S.O. All authors have read and agreed to the published version of the manuscript.

Funding

This research has been conducted with the assistance of funding from the Master by Research Scholarship Programme (PhD Extension) from MTU Kerry. This funder provided support in the form of a scholarship for the author E.I.

Data Availability Statement

The datasets generated for this study are available on request to the corresponding authors.

Acknowledgments

The authors would like to acknowledge the help of Ewan Feeney and Łukasz Łangowski for their technical support with the development of the Arabidopsis thaliana root microphenotyping system under salinity stress and RT-qPCR analysis, respectively. In addition, we thank Brandon Bioscience for the gift of the ANE biostimulant PSI-475 used in this study.

Conflicts of Interest

Authors O.G. and S.O. were employed by the company Brandon Bioscience. The remaining author declares that the research was conducted in the absence of any commercial or financial relationships that could be construed as a potential conflict of interest. The funder (MTU Kerry) or Brandon Bioscience had no role in the design of the study; in the collection, analyses, or interpretation of data; in the writing of the manuscript, or in the decision to publish the results. The authors declare no conflict of interest.

References

  1. Machado, R.; Serralheiro, R. Soil salinity: Effect on vegetable crop growth. Management practices to prevent and mitigate soil salinisation. Horticulturae 2017, 3, 30. [Google Scholar] [CrossRef]
  2. Ivushkin, K.; Bartholomeus, H.; Bregt, A.K.; Pulatov, A.; Kempen, B.; De Sousa, L. Global mapping of soil salinity change. Remote Sens. Environ. 2019, 231, 111260. [Google Scholar] [CrossRef]
  3. Shahid, S.A.; Zaman, M.; Heng, L. Soil salinity: Historical perspectives and a world overview of the problem. In Guideline for Salinity Assessment, Mitigation and Adaptation Using Nuclear and Related Techniques; Springer: Cham, Switzerland, 2018; pp. 43–53. [Google Scholar] [CrossRef] [Green Version]
  4. Corwin, D.L. Climate change impacts on soil salinity in agricultural areas. Eur. J. Soil Sci. 2021, 72, 842–862. [Google Scholar] [CrossRef]
  5. Munns, R.; Tester, M. Mechanisms of salinity tolerance. Annu. Rev. Plant Biol. 2008, 59, 651–681. [Google Scholar] [CrossRef] [Green Version]
  6. Choi, W.G.; Toyota, M.; Kim, S.H.; Hilleary, R.; Gilroy, S. Salt stress-induced Ca2+ waves are associated with rapid, long-distance root-to-shoot signaling in plants. Proc. Natl. Acad. Sci. USA 2014, 111, 6497–6502. [Google Scholar] [CrossRef] [Green Version]
  7. Negrão, S.; Schmöckel, S.M.; Tester, M. Evaluating physiological responses of plants to salinity stress. Ann. Bot. 2017, 119, 1–11. [Google Scholar] [CrossRef] [Green Version]
  8. Isayenkov, S.; Maathuis, F.J.M. Plant Salinity Stress; Many Unanswered Questions Remain. Front. Plant Sci. 2019, 10, 80. [Google Scholar] [CrossRef] [Green Version]
  9. Shahid, M.A.; Sarkhosh, A.; Khan, N.; Balal, R.M.; Ali, S.; Rossi, L.; Gómez, C.; Mattson, N.; Nasim, W.; Garcia-Sanchez, F. Insights into the physiological and biochemical impacts of salt stress on plant growth and development. Agronomy 2020, 10, 938. [Google Scholar] [CrossRef]
  10. Van Zelm, E.; Zhang, Y.; Testerink, C. Salt tolerance mechanisms of plants. Annu. Rev. Plant Biol. 2020, 71, 403–433. [Google Scholar] [CrossRef] [Green Version]
  11. Panta, S.; Flowers, T.; Lane, P.; Doyle, R.; Haros, G.; Shabala, S. Halophyte agriculture: Success stories. Environ. Exp. Bot. 2014, 107, 71–83. [Google Scholar] [CrossRef]
  12. Qadir, M.; Quillérou, E.; Nangia, V.; Murtaza, G.; Singh, M.; Thomas, R.J.; Drechsel, P.; Noble, A.D. Economics of salt-induced land degradation and restoration. Nat. Resour. Forum 2014, 38, 282–295. [Google Scholar] [CrossRef]
  13. Zörb, C.; Geilfus, C.M.; Dietz, K.J. Salinity and crop yield. Plant Biol. 2019, 21, 31–38. [Google Scholar] [CrossRef] [PubMed]
  14. Ondrasek, G.; Rengel, Z.; Veres, S. Soil salinisation and salt stress in crop production. In Abiotic Stress in Plants. Mechanisms and Adaptation; IntechOpen: London, UK, 2011; pp. 171–190. [Google Scholar]
  15. Ashraf, M.; Akram, N.A. Improving salinity tolerance of plants through conventional breeding and genetic engineering: An analytical comparison. Biotechnol. Adv. 2009, 27, 744–752. [Google Scholar] [CrossRef] [PubMed]
  16. García-Abellan, J.O.; Egea, I.; Pineda, B.; Sanchez-Bel, P.; Belver, A.; Garcia-Sogo, B.; Flores, F.B.; Atares, A.; Moreno, V.; Bolarin, M.C. Heterologous expression of the yeast HAL5 gene in tomato enhances salt tolerance by reducing shoot Na+ accumulation in the long term. Physiol. Plant. 2014, 152, 700–713. [Google Scholar] [CrossRef]
  17. Jaime-Pérez, N.; Pineda, B.; García-Sogo, B.; Atares, A.; Athman, A.; Byrt, C.S.; Olías, R.; Asins, M.J.; Gilliham, M.; Moreno, V.; et al. The sodium transporter encoded by the HKT1; 2 gene modulates sodium/potassium homeostasis in tomato shoots under salinity. Plant Cell Environ. 2017, 40, 658–671. [Google Scholar] [CrossRef] [Green Version]
  18. Ali, A.; Khan, I.U.; Jan, M.; Khan, H.A.; Hussain, S.; Nisar, M.; Chung, W.S.; Yun, D.J. The high-affinity potassium transporter EpHKT1; 2 from the extremophile Eutrema parvula mediates salt tolerance. Front. Plant Sci. 2018, 9, 1108. [Google Scholar] [CrossRef] [Green Version]
  19. Olías, R.; Eljakaoui, Z.; Li, J.U.N.; De Morales, P.A.; Marín-Manzano, M.C.; Pardo, J.M.; Belver, A. The plasma membrane Na+/H+ antiporter SOS1 is essential for salt tolerance in tomato and affects the partitioning of Na+ between plant organs. Plant Cell Environ. 2009, 32, 904–916. [Google Scholar] [CrossRef]
  20. Leidi, E.O.; Barragán, V.; Rubio, L.; El-Hamdaoui, A.; Ruiz, M.T.; Cubero, B.; Fernández, J.A.; Bressan, R.A.; Hasegawa, P.M.; Quintero, F.J.; et al. The AtNHX1 exchanger mediates potassium compartmentation in vacuoles of transgenic tomato. Plant J. 2010, 61, 495–506. [Google Scholar] [CrossRef] [Green Version]
  21. Salava, H.; Thula, S.; Mohan, V.; Kumar, R.; Maghuly, F. Application of Genome Editing in Tomato Breeding: Mechanisms, Advances, and Prospects. Int. J. Mol. Sci. 2021, 22, 682. [Google Scholar] [CrossRef]
  22. du Jardin, P. Plant biostimulants: Definition, concept, main categories and regulation. Sci. Hortic. 2015, 196, 3–14. [Google Scholar] [CrossRef] [Green Version]
  23. Research and Markets. Agriculture Biostimulant-Global Market Outlook (2019–2027); Research and Markets; European Union: Maastricht, The Netherlands, 2020. [Google Scholar]
  24. Regulation (EU) 2019/1009. 2019. Available online: https://eur-lex.europa.eu/eli/reg/2019/1009/oj (accessed on 22 September 2021).
  25. Colla, G.; Nardi, S.; Cardarelli, M.; Ertani, A.; Lucini, L.; Canaguier, R.; Rouphael, Y. Protein hydrolysates as biostimulants in horticulture. Sci. Hortic. 2015, 196, 28–38. [Google Scholar] [CrossRef]
  26. Colla, G.; Hoagland, L.; Ruzzi, M.; Cardarelli, M.; Bonini, P.; Canaguier, R.; Rouphael, Y. Biostimulant action of protein hydrolysates: Unraveling their effects on plant physiology and microbiome. Front. Plant Sci. 2017, 8, 2202. [Google Scholar] [CrossRef] [PubMed] [Green Version]
  27. Shukla, P.S.; Mantin, E.G.; Adil, M.; Bajpai, S.; Critchley, A.T.; Prithiviraj, B. Ascophyllum nodosum-based biostimulants: Sustainable applications in agriculture for the stimulation of plant growth, stress tolerance, and disease management. Front. Plant Sci. 2019, 10, 655. [Google Scholar] [CrossRef] [PubMed] [Green Version]
  28. Łangowski, Ł.; Goñi, O.; Marques, F.S.; Hamawaki, O.T.; da Silva, C.O.; Nogueira, A.P.O.; Teixeira, M.A.J.; Glasenapp, J.S.; Pereira, M.; O’Connell, S. Ascophyllum nodosum Extract (SealicitTM) Boosts Soybean Yield Through Reduction of Pod Shattering-Related Seed Loss and Enhanced Seed Production. Front. Plant Sci. 2021, 12, 176. [Google Scholar] [CrossRef] [PubMed]
  29. Goñi, O.; Łangowski, Ł.; Feeney, E.; Quille, P.; O’Connell, S. Reducing Nitrogen Input in Barley Crops While Maintaining Yields Using an Engineered Biostimulant Derived from Ascophyllum nodosum to Enhance Nitrogen Use Efficiency. Front. Plant Sci. 2021, 12, 789. [Google Scholar] [CrossRef] [PubMed]
  30. Carmody, N.; Goñi, O.; Łangowski, Ł.; O’Connell, S. Ascophyllum nodosum extract biostimulant processing and its impact on enhancing heat stress tolerance during tomato fruit set. Front. Plant Sci. 2020, 11, 807. [Google Scholar] [CrossRef] [PubMed]
  31. Paul, K.; Sorrentino, M.; Lucini, L.; Rouphael, Y.; Cardarelli, M.; Bonini, P.; Miras Moreno, M.B.; Reynaud, H.; Canaguier, R.; Trtílek, M.; et al. A combined phenotypic and metabolomic approach for elucidating the biostimulant action of a plant-derived protein hydrolysate on tomato grown under limited water availability. Front. Plant Sci. 2019, 10, 493. [Google Scholar] [CrossRef]
  32. Goñi, O.; Quille, P.; O’Connell, S. Ascophyllum nodosum extract biostimulants and their role in enhancing tolerance to drought stress in tomato plants. Plant Physiol. Biochem. 2018, 126, 63–73. [Google Scholar] [CrossRef]
  33. Ertani, A.; Schiavon, M.; Muscolo, A.; Nardi, S. Alfalfa plant-derived biostimulant stimulate short-term growth of salt stressed Zea mays L. plants. Plant Soil 2013, 364, 145–158. [Google Scholar] [CrossRef]
  34. Lucini, L.; Rouphael, Y.; Cardarelli, M.; Canaguier, R.; Kumar, P.; Colla, G. The effect of a plant-derived biostimulant on metabolic profiling and crop performance of lettuce grown under saline conditions. Sci. Hortic. 2015, 182, 124–133. [Google Scholar] [CrossRef]
  35. Trevisan, S.; Manoli, A.; Quaggiotti, S. A Novel Biostimulant, Belonging to Protein Hydrolysates, Mitigates Abiotic Stress Effects on Maize Seedlings Grown in Hydroponics. Agronomy 2019, 9, 28. [Google Scholar] [CrossRef] [Green Version]
  36. Sitohy, M.Z.; Desoky, E.S.M.; Osman, A.; Rady, M.M. Pumpkin seed protein hydrolysate treatment alleviates salt stress effects on Phaseolus vulgaris by elevating antioxidant capacity and recovering ion homeostasis. Sci. Hortic. 2020, 271, 109495. [Google Scholar] [CrossRef]
  37. Carillo, P.; Ciarmiello, L.F.; Woodrow, P.; Corrado, G.; Chiaiese, P.; Rouphael, Y. Enhancing sustainability by improving plant salt tolerance through macro-and micro-algal biostimulants. Biology 2020, 9, 253. [Google Scholar] [CrossRef] [PubMed]
  38. FAOSTAT. 2020. Available online: http://www.fao.org/faostat/en/#data (accessed on 22 September 2021).
  39. Cuartero, J.; Fernández-Muñoz, R. Tomato and salinity. Sci. Hortic. 1998, 78, 83–125. [Google Scholar] [CrossRef]
  40. Campos, C.A.B.; Fernandes, P.D.; Gheyi, H.R.; Blanco, F.F.; Gonçalves, C.B.; Campos, S.A.F. Yield and fruit quality of industrial tomato under saline irrigation. Sci. Agric. 2006, 63, 146–152. [Google Scholar] [CrossRef] [Green Version]
  41. Del Amor, F.M.; Martinez, V.; Cerda, A. Salt tolerance of tomato plants as affected by stage of plant development. HortScience 2001, 36, 1260–1263. [Google Scholar] [CrossRef] [Green Version]
  42. Bao, H.; Li, Y. Effect of stage-specific saline irrigation on greenhouse tomato production. Irrig. Sci. 2010, 28, 421–430. [Google Scholar] [CrossRef]
  43. Zhang, P.; Yanyan, D.; Masateru, S.; Natsumi, M.; Kengo, I. Interactions of salinity stress and flower thinning on tomato growth, yield, and water use efficiency. Commun. Soil Sci. Plant Anal. 2017, 48, 2601–2611. [Google Scholar] [CrossRef]
  44. Moore, S.; Stein, W.H. A modified ninhydrin reagent for the photometric determination of amino acids and related compounds. J. Biol. Chem. 1954, 211, 907–913. [Google Scholar] [CrossRef]
  45. Gómez-Alonso, S.; Hermosín-Gutiérrez, I.; García-Romero, E. Simultaneous HPLC analysis of biogenic amines, amino acids, and ammonium ion as aminoenone derivatives in wine and beer samples. J. Agric. Food Chem. 2007, 55, 608–613. [Google Scholar] [CrossRef]
  46. Schägger, H. Tricine–sds-page. Nat. Protoc. 2006, 1, 16. [Google Scholar] [CrossRef] [PubMed]
  47. Burrell, T.; Fozard, S.; Holroyd, G.H.; French, A.P.; Pound, M.P.; Bigley, C.J.; Taylor, C.J.; Forde, B.G. The Microphenotron: A robotic miniaturized plant phenotyping platform with diverse applications in chemical biology. Plant Methods 2017, 13, 10. [Google Scholar] [CrossRef] [PubMed] [Green Version]
  48. Galkovskyi, T.; Mileyko, Y.; Bucksch, A.; Moore, B.; Symonova, O.; Price, C.A.; Topp, C.N.; Iyer-Pascuzzi, A.S.; Zurek, P.R.; Fang, S.; et al. GiA Roots: Software for the high throughput analysis of plant root system architecture. BMC Plant Biol. 2012, 12, 116. [Google Scholar] [CrossRef] [PubMed] [Green Version]
  49. Lichtenthaler, H.K.; Buschmann, C. Chlorophylls and carotenoids: Measurement and characterization by UV-VIS spectroscopy. Curr. Protoc. Food Anal. Chem. 2001, 1, F4-3. [Google Scholar] [CrossRef]
  50. VanderGheynst, J.S.; Pettygrove, S.; Dooley, T.M.; Arnold, K.A. Estimating electrical conductivity of compost extracts at different extraction ratios. Compos. Sci. Util. 2004, 12, 202–207. [Google Scholar] [CrossRef]
  51. Majidi, H.; Minaei, S.; Almasi, M.; Mostofi, Y. Total soluble solids, titratable acidity and repining index of tomato in various storage conditions. Aust. J. Basic Appl. Sci. 2011, 5, 1723–1726. [Google Scholar]
  52. Munns, R.; Wallace, P.A.; Teakle, N.L.; Colmer, T.D. Measuring soluble ion concentrations (Na+, K+, Cl) in salt-treated plants. In Plant Stress Tolerance; Humana Press: Totowa, NJ, USA, 2010; pp. 371–382. [Google Scholar] [CrossRef]
  53. Løvdal, T.; Lillo, C. Reference gene selection for quantitative real-time PCR normalization in tomato subjected to nitrogen, cold, and light stress. Anal. Biochem. 2009, 387, 238–242. [Google Scholar] [CrossRef]
  54. Julkowska, M.M.; Hoefsloot, H.C.; Mol, S.; Feron, R.; de Boer, G.J.; Haring, M.A.; Testerink, C. Capturing Arabidopsis root architecture dynamics with ROOT-FIT reveals diversity in responses to salinity. Plant Physiol. 2014, 166, 1387–1402. [Google Scholar] [CrossRef] [Green Version]
  55. Aziz, N.A.; Mahgoub, M.H.; Siam, H.S. Growth, flowering and chemical constituents performence of Amaranthus tricolor plants as influenced by seaweed (Ascophyllum nodosum) extract application under salt stress conditions. J. Appl. Sci. Res. 2011, 7, 1472–1484. [Google Scholar]
  56. Corte, L.; Dell’Abate, M.T.; Magini, A.; Migliore, M.; Felici, B.; Roscini, L.; Sardella, R.; Tancini, B.; Emiliani, C.; Cardinali, G.; et al. Assessment of safety and efficiency of nitrogen organic fertilizers from animal-based protein hydrolysates—A laboratory multidisciplinary approach. J. Sci. Food Agric. 2014, 94, 235–245. [Google Scholar] [CrossRef]
  57. Rouphael, Y.; Carillo, P.; Cristofano, F.; Cardarelli, M.; Colla, G. Effects of vegetal-versus animal-derived protein hydrolysate on sweet basil morpho-physiological and metabolic traits. Sci. Hortic. 2021, 284, 110123. [Google Scholar] [CrossRef]
  58. Juan, M.; Rivero, R.M.; Romero, L.; Ruiz, J.M. Evaluation of some nutritional and biochemical indicators in selecting salt-resistant tomato cultivars. Environ. Exp. Bot. 2005, 54, 193–201. [Google Scholar] [CrossRef]
  59. Magán, J.J.; Gallardo, M.; Thompson, R.B.; Lorenzo, P. Effects of salinity on fruit yield and quality of tomato grown in soil-less culture in greenhouses in Mediterranean climatic conditions. Agric. Water Manag. 2008, 95, 1041–1055. [Google Scholar] [CrossRef]
  60. El-Mogy, M.M.; Garchery, C.; Stevens, R. Irrigation with salt water affects growth, yield, fruit quality, storability and marker-gene expression in cherry tomato. Acta Agric. Scand. Sect. B—Soil Plant Sci. 2018, 68, 727–737. [Google Scholar] [CrossRef]
  61. Rouphael, Y.; Colla, G.; Giordano, M.; El-Nakhel, C.; Kyriacou, M.C.; De Pascale, S. Foliar applications of a legume-derived protein hydrolysate elicit dose-dependent increases of growth, leaf mineral composition, yield and fruit quality in two greenhouse tomato cultivars. Sci. Hortic. 2017, 226, 353–360. [Google Scholar] [CrossRef]
  62. Maggio, A.; De Pascale, S.; Angelino, G.; Ruggiero, C.; Barbieri, G. Physiological response of tomato to saline irrigation in long-term salinized soils. Eur. J. Agron. 2004, 21, 149–159. [Google Scholar] [CrossRef]
  63. Ertani, A.; Pizzeghello, D.; Francioso, O.; Sambo, P.; Sanchez-Cortes, S.; Nardi, S. Capsicum chinensis L. growth and nutraceutical properties are enhanced by biostimulants in a long-term period: Chemical and metabolomic approaches. Front. Plant Sci. 2014, 5, 375. [Google Scholar] [CrossRef] [Green Version]
  64. Colla, G.; Cardarelli, M.; Bonini, P.; Rouphael, Y. Foliar applications of protein hydrolysate, plant and seaweed extracts increase yield but differentially modulate fruit quality of greenhouse tomato. HortScience 2017, 52, 1214–1220. [Google Scholar] [CrossRef]
  65. Tieman, D.; Bliss, P.; McIntyre, L.M.; Blandon-Ubeda, A.; Bies, D.; Odabasi, A.Z.; Rodríguez, G.R.; van der Knaap, E.; Taylor, M.G.; Goulet, C.; et al. The chemical interactions underlying tomato flavor preferences. Curr. Biol. 2012, 22, 1035–1039. [Google Scholar] [CrossRef] [Green Version]
  66. Shi, H.; Quintero, F.J.; Pardo, J.M.; Zhu, J.K. The putative plasma membrane Na+/H+ antiporter SOS1 controls long-distance Na+ transport in plants. Plant Cell 2002, 14, 465–477. [Google Scholar] [CrossRef] [Green Version]
  67. Horie, T.; Motoda, J.; Kubo, M.; Yang, H.; Yoda, K.; Horie, R.; Chan, W.Y.; Leung, H.Y.; Hattori, K.; Konomi, M.; et al. Enhanced salt tolerance mediated by AtHKT1 transporter-induced Na+ unloading from xylem vessels to xylem parenchyma cells. Plant J. 2005, 44, 928–938. [Google Scholar] [CrossRef]
  68. Cosentino, C.; Fischer-Schliebs, E.; Bertl, A.; Thiel, G.; Homann, U. Na+/H+ antiporters are differentially regulated in response to NaCl stress in leaves and roots of Mesembryanthemum crystallinum. New Phytol. 2010, 186, 669–680. [Google Scholar] [CrossRef] [PubMed]
  69. Gálvez, F.J.; Baghour, M.; Hao, G.; Cagnac, O.; Rodríguez-Rosales, M.P.; Venema, K. Expression of LeNHX isoforms in response to salt stress in salt sensitive and salt tolerant tomato species. Plant Physiol. Biochem. 2012, 51, 109–115. [Google Scholar] [CrossRef] [PubMed]
  70. Barragán, V.; Leidi, E.O.; Andrés, Z.; Rubio, L.; De Luca, A.; Fernández, J.A.; Cubero, B.; Pardo, J.M. Ion exchangers NHX1 and NHX2 mediate active potassium uptake into vacuoles to regulate cell turgor and stomatal function in Arabidopsis. Plant Cell 2012, 24, 1127–1142. [Google Scholar] [CrossRef] [PubMed] [Green Version]
  71. Maach, M.; Baghour, M.; Akodad, M.; Gálvez, F.J.; Sánchez, M.E.; Aranda, M.N.; Venema, K.; Rodríguez-Rosales, M.P. Overexpression of LeNHX4 improved yield, fruit quality and salt tolerance in tomato plants (Solanum lycopersicum L.). Mol. Biol. Rep. 2020, 47, 4145–4153. [Google Scholar] [CrossRef]
  72. Munns, R.; Passioura, J.B.; Colmer, T.D.; Byrt, C.S. Osmotic adjustment and energy limitations to plant growth in saline soil. New Phytol. 2020, 225, 1091–1096. [Google Scholar] [CrossRef] [Green Version]
  73. Afzal, I.; Hussain, B.; Basra, S.M.A.; Ullah, S.H.; Shakeel, Q.; Kamran, M. Foliar application of potassium improves fruit quality and yield of tomato plants. Acta Sci. Pol. Hortorum Cultus 2015, 14, 3–13. [Google Scholar]
  74. Ertani, A.; Schiavon, M.; Nardi, S. Transcriptome-wide identification of differentially expressed genes in Solanum lycopersicon L. in response to an alfalfa-protein hydrolysate using microarrays. Front. Plant Sci. 2017, 8, 1159. [Google Scholar] [CrossRef] [Green Version]
  75. Sestili, F.; Rouphael, Y.; Cardarelli, M.; Pucci, A.; Bonini, P.; Canaguier, R.; Colla, G. Protein Hydrolysate Stimulates Growth in Tomato Coupled with N-Dependent Gene Expression Involved in N Assimilation. Front. Plant Sci. 2018, 9, 1233. [Google Scholar] [CrossRef] [Green Version]
  76. Alfosea-Simón, M.; Zavala-Gonzalez, E.A.; Camara-Zapata, J.M.; Martínez-Nicolás, J.J.; Simón, I.; Simón-Grao, S.; García-Sánchez, F. Effect of foliar application of amino acids on the salinity tolerance of tomato plants cultivated under hydroponic system. Sci. Hortic. 2020, 272, 109509. [Google Scholar] [CrossRef]
  77. Lucini, L.; Miras-Moreno, B.; Rouphael, Y.; Cardarelli, M.; Colla, G. Combining molecular weight fractionation and metabolomics to elucidate the bioactivity of vegetal protein hydrolysates in tomato plants. Front. Plant Sci. 2020, 11, 976. [Google Scholar] [CrossRef] [PubMed]
  78. Goñi, O.; Quille, P.; O’Connell, S. Seaweed carbohydrates. In The Chemical Biology of Plant Biostimulants; Geelen, D., Xu, L., Stevens, C.V., Eds.; John Wiley & Sons: Hoboken, NJ, USA, 2020; pp. 57–95. [Google Scholar]
Figure 1. Molecular weight determination of plant protein hydrolysate from PSI-475. (A) SEC analysis. Dashed arrows represent the retention time values of three standards (BSA (66 kDa, cytochrome C (12.4 kDa), and aprotinin (6.5 kDa)). (B) Tricine SDS-PAGE profile focused on the 1–26 kDa range. Lanes 1 and 2 represent the Colour Marker Ultra-low Range marker (C6210) and the sample, respectively.
Agronomy 12 00809 g001
Figure 2. Effect of salinity stress and PSI-475 on sodium transporters gene expression levels in tomato leaf tissue. (A) SOS1; (B) NHX1; (C) HKT1;2 at the T1 sample point. (D) SOS1; (E) NHX1; (F) HKT1;2 at the T2 sample point. The results were expressed as the relative log2 fold-change with respect to the EF1α gene expression level and using the unstressed control as the calibrator sample. Because the interactions S × P were significant, data were subjected to one-way ANOVA with Tukey’s HSD test, comparing all means with each other. Different letters indicate statistical differences between means with p ≤ 0.05 within the same gene and sample point. Number of biological replicates (n ≥ 3). ns, *, **, and *** means non-significant or significant at p ≤ 0.05, p ≤ 0.01, and p ≤ 0.001, respectively.
Agronomy 12 00809 g002
Figure 3. PCA scatter plot based on the first two principal components (PC1 and PC2) generated from the analysed phenotypical, physiological, biochemical, and molecular parameters in tomato plants. Observations corresponding to the four samples were included in the PCA scatter plot: unstressed control (UC); unstressed treated with PSI-475 (UPSI-475), stressed control (SC), and stressed treated with PSI-475 (SPSI-475). Fruit yield variable label was highlighted in the figure for easier localisation.
Agronomy 12 00809 g003
Table 1. Compositional analysis of PSI-475.
Component Concentration
Ash % (w v−1) 3.00 ± 0.15
Uronics acids % (w v−1) 0.85 ± 0.07
Fucose % (w v−1) 0.81 ± 0.05
Laminarin % (w v−1) 0.29 ± 0.02
Free mannitol % (w v−1) 0.56 ± 0.06
Polyphenol % (w v−1) 1.22 ± 0.08
Total free amino acids % (w v−1) 1.90 ± 0.03
Soluble peptides % (w v−1) 1.55 ± 0.02
Elements % (w v−1)N1.03 ± 0.04
P0.13 ± 0.01
K1.65 ± 0.05
S0.26 ± 0.02
Microelements (ppm)Mg561.60 ± 6.34
B443.15 ± 5.87
Zn236.40 ± 7.75
Fe117.61 ± 4.30
Ca68.80 ± 1.45
Data are the means ± SE and expressed with respect to PSI-475 liquid content. Number of biological replicates (n ≥ 3).
Table 2. Effect of salinity stress and PSI-475 on Arabidopsis thaliana root and photosynthetic pigments.
Source of VarianceRoot Length (mm)Root Network (mm)Chl (a + b) (mg g−1 FW)Carotenoids (mg g−1 FW)
Salinity (S)************
PSI-475 (P)***ns******
S × P**ns******
Salinity (S)
Unstressed11.03 b32.03 b0.14 b0.05 b
Stressed9.77 a26.93 a0.06 a0.02 a
PSI-475 (mg L−1) (P)
09.72 a28.960.09 a0.03 a
2.510.21 b28.270.10 b0.03 a
510.47 b30.440.11 b0.04 b
1011.03 c29.630.10 b0.03 a
2510.57 b30.090.11 b0.04 b
S × P
Unstressed × 010.4 bc31.570.12 d0.04 d
Unstressed × 2.510.84 bcd31.250.14 de0.04 d
Unstressed × 511.75 d32.610.14 de0.05 d
Unstressed × 1011.21 bcd32.910.15 e0.05 d
Unstressed × 2510.97 cd31.810.17 f0.06 e
Stressed × 09.04 a26.350.05 a0.02 a
Stressed × 2.59.58 ab25.290.07 bc0.03 bc
Stressed × 59.19 a28.270.08 c0.03 c
Stressed × 1010.86 bcd26.340.05 ab0.02 ab
Stressed × 2510.17 abc28.370.05 a0.02 ab
All data are expressed as the average per sample collected. ns, **, and *** means non-significant or significant at p ≤ 0.01, and p ≤ 0.001, respectively. Different letters indicate statistical differences with p ≤ 0.05 based on t-test (S) or Tukey’s HSD test (P and S × P). Number of biological replicates (root phenotype: n = 32; biochemical: n ≥ 3).
Table 3. Effect of salinity stress and PSI-475 on tomato phenotypic, fruit yield, and fruit quality parameters at harvest (154-day-old plants).
Source of VariancePlant Height (cm)Plant Biomass (g)Root Length (cm)Root Biomass (mg)Fruit NumberFruit Yield (g)Sugar Cont. (°Brix)TTA
(% w v−1)
Salinity (S)***ns******ns*******
PSI-475 (P)nsns*ns*****ns
S × Pnsnsnsnsnsnsnsns
Salinity (S)
Unstressed29.21 b14.3420.45 b65 b13.5728.76 b5.44 a0.61 a
Stressed25.38 a14.2418.62 a49 a12.2217.98 a6.65 b0.73 b
PSI-475 (P)
Untreated27.2414.3319.01 a5510.91 a21.01 a5.76 a0.63
PSI-47527.3614.2520.05 b5914.88 b25.73 b6.33 b0.59
S × P
Unstressed × Untreated28.7714.4620.026412.0126.514.970.63
Unstressed × PSI-47529.6614.2220.876515.1331.015.920.59
Stressed × Untreated25.7014.2118.01469.8115.516.550.73
Stressed × PSI-47525.0614.2819.235314.6220.456.750.72
All data are expressed as the average per plant. ns, *, and *** means non-significant or significant at p ≤ 0.05, and p ≤ 0.001, respectively. Different letters indicate statistical differences with p ≤ 0.05 based on t-test (S, P). Number of biological replicates (plant phenotypic and fruit yield markers: n ≥ 22; fruit quality markers: n ≥ 3).
Table 4. Effect of salinity stress and PSI-475 on tomato leaf potassium and sodium content.
Source of VarianceT1 (87-Day-Old Plants)T2 (101-Day-Old Plants)
K+Na+K+/Na+K+Na+K+/Na+
(mg g−1 DW) (mg g−1 DW)
Salinity (S)ns**************
PSI-475 (P)ns***ns*nsns
S × Pns***nsnsnsns
Salinity (S)
Unstressed53.741.45 a39.69 b44.72 b1.12 a40.62 b
Stressed51.3116.36 b3.06 a38.95 a30.23 b1.31 a
PSI-475 (P)
Untreated50.149.69 b21.6739.54 a14.6518.50
PSI-47554.918.12 a21.0844.47 b17.0123.43
S × P
Unstressed × Untreated51.131.26 a40.7142.031.0235.67
Unstressed × PSI-47556.361.64 a38.6847.411.2245.57
Stressed × Untreated49.1618.12 c2.6337.0528.291.33
Stressed × PSI-47553.4614.60 b3.4841.1232.811.29
All data are expressed as the average per sample collected at T1 or T2 sample points. ns, *, **, and *** means non-significant or significant at p ≤ 0.05, p ≤ 0.01, and p ≤ 0.001, respectively. Different letters indicate statistical differences with p ≤ 0.05 based on t-test (S, P) or Tukey’s HSD test (S × P). Number of biological replicates (n ≥ 3).
Table 5. Effect of salinity stress and PSI-475 on tomato leaf RWC, proline, and soluble sugars content.
Source of VarianceT1 (87-Day-Old Plants)T2 (101-Day-Old Plants)
RWCProlineFructose Glucose SucroseRWCProlineFructoseGlucoseSucrose
%(mg g−1 DW)%(mg g−1 DW)
Salinity (S)******************************
PSI-475 (P)***nsns***ns***********
S × P*ns*nsns*ns*********
Salinity (S)
Unstressed78.14 b1.67 a1.80 a2.20 a1.16 a76.97 b1.35 a2.33 b1.50 a1.51 a
Stressed74.32 a6.20 b3.41 b2.64 b2.68 b71.39 a5.57 b1.97 a1.82 b3.84 b
PSI-475 (P)
Untreated75.36 a3.962.562.00 a1.8772.60 a3.08 a2.06 a1.73 b2.51 a
PSI-47577.10 b3.912.652.84 b1.9875.75 b3.85 b2.24 b1.58 a2.84 b
S × P
Unstressed × Untreated77.02 c1.511.98 a1.691.2375.82 c1.012.10 a1.40 a1.50 a
Unstressed × PSI-47579.26 d1.831.62 a2.711.0978.11 d1.702.57 b1.59 a1.51 a
Stressed × Untreated73.70 a6.413.15 b2.312.5069.37 a5.152.03 a2.06 b3.52 b
Stressed × PSI-47574.94 b5.993.67 b2.962.8673.40 b5.991.92 a1.57 a4.16 c
All data are expressed as the average per sample collected at T1 or T2 sample points. ns, *, and *** means non-significant or significant at p ≤ 0.05, and p ≤ 0.001, respectively. Different letters indicate statistical differences with p ≤ 0.05 based on t-test (S, P) or Tukey’s HSD test (S × P). Number of biological replicates (n ≥ 3).
Table 6. Effect of salinity stress and PSI-475 on tomato leaf soluble protein and photosynthetic pigments content.
Source of VarianceT1 (87-Day-Old Plants)T2 (101-Day-Old Plants)
ProteinChl (a + b)Carot.ProteinChl (a + b)Carot.
(mg g−1 DW)(mg g−1 DW)
Salinity (S)*ns********
PSI-475 (P)****ns*ns
S × Pnsnsnsnsnsns
Salinity (S)
Unstressed82.25 b15.881.90 b81.31 b16.15 b2.09 b
Stressed65.12 a14.861.69 a62.52 a12.66 a1.67 a
PSI-475 (P)
Untreated65.46 a14.30 a1.72 a68.3713.74 a1.83
PSI-47581.91 b16.44 b1.87 b75.4615.08 b1.93
S × P
Unstressed × Untreated69.8814.9715.7680.561.872.06
Unstressed × PSI-47594.6116.7816.5582.051.932.12
Stressed × Untreated61.0313.6311.7256.171.581.59
Stressed × PSI-47569.2116.0913.6168.861.811.74
All data are expressed as the average per sample collected at T1 or T2 sample points. ns, *, **, and *** means non-significant or significant at p ≤ 0.05, p ≤ 0.01, and p ≤ 0.001, respectively. Different letters indicate statistical differences with p ≤ 0.05 based on t-test (S, P). Number of biological replicates (n ≥ 3).
Publisher’s Note: MDPI stays neutral with regard to jurisdictional claims in published maps and institutional affiliations.

