Abstract
High soil salinity, drought, and poor soil fertility, especially phosphorus (P) deficiency, are serious challenges for crop production in arid and desert climate regions. In these regions, irrigation water (mostly groundwater) is saline, and fertilization is one of the strategies used to cope with salinity stress. Crop livestock is one of the major agricultural activities in marginal regions, and blue panicum (Panicum antidotale Retz.), the perennial forage grass, has the potential to furnish forage demand. Thus, a field experiment testing the combination of three levels of irrigation water salinity and three P rate was carried out to evaluate the potential of P fertilizer to enhance yield and salinity tolerance of blue panicum grass. The experiment was conducted for two years between 2019 and 2020 in Foum el Oued, Laayoune, Morocco. It was implemented in a split-plot design with three replications considering irrigation water salinity as the main plot and P rates as sub-plot treatments. The evaluated P rates were 0, 90, and 108 kg P2O5 ha−1 (P1, P2, and P3, respectively), and the irrigation water salinities were 5, 12, and 17 dS·m−1. The results revealed that increasing irrigation water salinity significantly decreased the biomass production and stomatal conductance of blue panicum. Increasing irrigation water salinity from 5 to 12 and 17 dS·m−1 decreased fresh biomass production by 20 and 29%, respectively. Irrigation water salinity also decreased (p < 0.05) leaf N, P, K, Ca, and Zn concentration. However, supplementation of P fertilization enhanced (p < 0.05) biomass production and stomatal conductance mainly by improving leaf OM, Zn, and Fe content. P fertilization at 108 kg P2O5 ha−1 increased fresh biomass by 27%, 32%, and 19% under 5, 12, and 17 dS·m−1, respectively. Considering increased fresh biomass yield, P application at the rate of 108 kg P2O5 ha−1 can be suggested for saline drylands. P application is recommended to reduce the adverse effects of high salinity on growth and productivity and improve salinity tolerance of blue panicum in salt-affected arid and desert regions.
1. Introduction
Increasing freshwater scarcity and declining irrigation water quality are the major challenges limiting agricultural production worldwide. In arid and desert climate regions, soil salinity is increasing mainly due to the high rate of chemical weathering of soil, mineral, and rocks and a higher rate of evapotranspiration than precipitation. In those regions, together with other causes such as extreme temperatures, high winds, and drought, soil salinity stress is causing serious environmental problems, reducing cultivated land, decreasing ecosystem services, declining crop productivity, and affecting agri-food systems [1]. More than 50% of the world’s irrigated land and 20% of the cultivated land has been affected by soil salinity [2].
The Southern region of Morocco (Laâyoune-Boujdour-Sakia, Al Hamra region), which covers approximately 1 million ha of land suitable for agricultural production, has been affected by different levels of soil salinity [3]. In many North African and Mediterranean countries, agricultural areas have been challenged by high soil salinity (>25 dS·m−1), high groundwater salinity (>12 dS·m−1), severe drought, no/low rainfall (<50 mm annual rainfall), unavailability of good quality water for irrigation, poor soil fertility (low soil organic carbon), and gradual degradation of soil quality mostly due poor irrigation water quality [4,5]. Due to those challenges, only a limited number of resilient crop species and some halophytes can be grown in the region [6,7]. As livestock is the major enterprise and the scarcity of livestock forage is severe in the region [8,9], the production of forage crops can significantly contribute to the income and agri-food system. Among the several forage species available in arid and desert regions, blue panicum (Panicum antidotale, Retz.; C4, facultative-halophytic grass, family Poaceae), a species native of Southeast Asia, has shown promising performance for cultivation in saline soils with brackish irrigation water [10,11,12]. It is a robust and short rhizomatous perennial grass that grows up to 2 m in height with a very deep root system [13]. It is suitable for biosaline production systems [14], predominantly found in a wide range of climatic conditions [15]. It tolerates fairly high soil salinity and produces a fair amount of biomass. It has the ability to withstand a variety of soil and climatic stresses, including severe environmental stresses like salinity [10,15,16,17], drought, alkalinity, and waterlogging [18]. It is a highly productive grass with considerable nutritional value and palatability for the animal; it can produce up to 150–180 t ha−1 year−1 of fresh biomass with 15–18% protein content [17]. Proper management of this grass can help minimize the increasing gap between the supply and demand of forage for ruminants in arid and desert regions [19].
Soil salinity affects the growth, productivity, physiology, and nutritional values of a number of plant species, blue panicum in particular [20]. For a better understanding of the yield variation of blue panicum as affected by soil salinity, it is necessary to understand the physiological mechanisms for salinity tolerance [21]. This crop is an ideal fodder grass that can optimally produce fresh biomass up to 60 t ha−1 year−1 at moderate salinity (10–15 dS·m−1) [11]. Up to 12.5 dS·m−1 salinity, biomass production of blue panicum is not affected due to its coping physiological mechanisms such as improved gas exchange and water use efficiency [22]. The growth and yield of blue panicum are correlated with net CO2 assimilation and stomatal conductance rates [23].
Soil salinity reduces soil fertility and crop productivity by affecting multiple soil nutrients such as causing phosphorus (P) deficiency [24]; affecting N metabolism, including N uptake; causing NO3 reduction; affecting NH4 assimilation [25]; lowering soil osmotic potentials; and reducing water absorption [26]. Under saline conditions, the optimal amount of fertilizer application enhances crop yield and nutritional quality by improving the mineral balance and by minimizing Na+ toxicity [11,27,28,29]. Saline soils are characterized by a low activity of nutrient ions and an extremely high ratio of Na+/Ca2+, Na+/K+, Ca2+, and Cl−/NO in the soil [30]. Depending on the severity of salinity stress, the addition of a limiting nutrient enhances salt tolerance and increases plant growth [31]. Halophytes have devolved mechanisms that permit the selective uptake of nutrients from saline soils. The use of nitrogen, phosphorus, and potassium (NPK) fertilizers in the optimal combination enhances the yield of some halophytes [11]. In saline conditions, as uptake, transport, and distribution of P nutrients are affected by salinity stress [32], external application of the optimal amount of P fertilizers minimizes the adverse effects of salinity stress on crop growth [33]. Differences in uptake and translocation of different ions vary across grass species and fertilizer application rates and, consequently, plant tolerance to salinity and yield [34]. Thus, the hypotheses of this study were: (a) P application enhances growth and production of blue panicum under high-salinity conditions, (b) P application improves plant tolerance to salinity (physiological traits), and (c) a higher P rate is required under saline conditions for higher yield. Thus, the experiments were conducted for a better understanding of the growth, productivity, physiological development, and leaf mineral content of blue panicum as affected by different P rates under different irrigation water salinity in arid regions.
2. Materials and Methods
2.1. Soil and Climate
This research was conducted between December 2018 and February 2021 at an experimental farm of the National Institute of Agronomic Research (INRA), Foum el Oued, Laayoune, Morocco (latitude = 27.176° N; longitude = −13.349° W; altitude = 37 m asl). According to the classification provided by Dahnke and Whitney, the soil of the experimental site was sandy loam (61% sand, 18% silt, and 18% clay), moderately saline, and poor in organic matter and plant nutrients (Table 1). The irrigation water (groundwater) used in the experimental site is highly saline.

Table 1.
Soil physical and chemical properties in the experimental site.
The experimental site had a tropical and subtropical desert climate with an average annual temperature of 20 °C, 18 rainy days in a year, and total annual rainfall of 72 mm (Figure 1). August is the warmest month of the year, and January is the coldest month. During the experimental period, the average temperature was 16.2 °C, the highest temperature on 26 August (44 °C), the lowest temperature on 16 January (8 °C), low rainfall (54 mm), and high wind speed (24.3 km h−1).
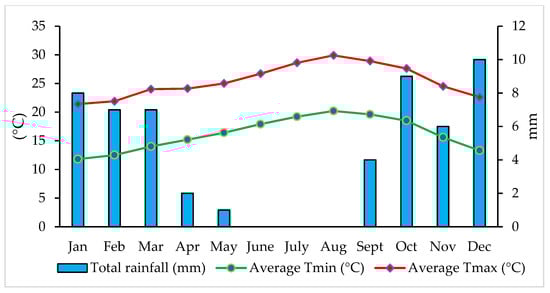
Figure 1.
Variation of temperature and rainfall during 2nd growing season (2020).
2.2. Experimental Design, Treatments, and Crop Management Practices
A field experiment was established in a split-plot design with three irrigation water salinities as the main plot and three P rates as sub-plot treatment with three replications. The P rate of 0, 90, and 108 kg P2O5 ha−1 represented P0, P1, and P2, respectively. The three salinity levels of the irrigation water were characterized by an EC of 5, 12, and 17 dS·m−1. Saline irrigation water treatments were prepared using two sources of irrigation water (Table 2) in addition to salt (NaCl), as shown in Figure 2. The evaluated salinities were groundwater salinity (5 dS·m−1) and two other levels obtained by adding NaCl salt up to EC values of 12 and 17 dS·m−1. The crop was sown on 5 December 2018, manually at a depth of 2 to 3 cm after plowing and gentle compaction (to avoid soil blown away by the wind) of the soil. After establishment, the crop was maintained perennial. The individual plot size was 12 m2 (4 m × 3 m), and each plot consisted of five rows of blue panicum with a 60 cm row to row and 40 cm plant to plant distance. All plots received basal nitrogen (N) at 60 kg·ha−1 at sowing, and P fertilizer (monoammonium phosphate) was incorporated into the soil before sowing. After this, it was applied 2 weeks after each harvest through drip irrigation (fertigation) in 90 and 108 kg P2O5 ha−1 plots. For the initial 30 days, all plots were irrigated using the same (5 dS·m−1) salinity level water twice daily to allow the crop to establish uniformly. The irrigation amount was determined by computing evapotranspiration (ET0) and considering the crop visual symptom of water stress. The yearly total water applied during the growing period was 674 mm (Table 3). To avoid the confounding effect due to variation in irrigation amount, all plots with different salinity treatments received the same quantity of irrigation in each irrigation event. In two high-salinity treatments, the salinity of the irrigation water was gradually increased (2 weeks after) until it reached the desired electrical conductivity.
Table 2.
Chemical properties of irrigation water applied.
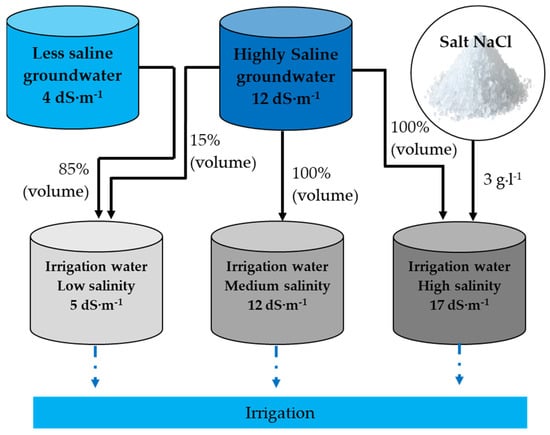
Figure 2.
Schematic view of the irrigation water tanks laid out for using irrigation in the experimental plots.
Table 3.
Total irrigation water (mm) applied in each irrigation during the crop growing period.
2.3. Measurements
2.3.1. Forage Biomass
To determine the total amount of forage biomass, the crop was harvested at the flowering stage of the plants (60 to 120 days after the fertilizer application) and their fresh forage biomass weight was measured from all plots and replications harvesting the whole plot area (12 m2 each sub-plot). In all treatments, the biomass was harvested 7 times per year.
2.3.2. Soil Salinity
After the initial soil measurement, soil salinity was measured in December 2020 (after two years of irrigation with saline water). To measure soil salinity (electrical conductivity; EC), soil samples were collected from each plot and treatment from 0–10 to 10–20 cm depths. Soil salinity was measured using the saturated-soil paste method, as described by Khorsandi [34]. The end soil samples were collected from every 40 cm horizontal distance between the rows at every 10 cm distance interval, and a total of 7 samples per plot were analyzed.
2.3.3. Stomatal Conductance
Stomatal conductance was measured using an automatic SC-1 Leaf Porometer (Decagon Devices, Inc., Pullman, WA, USA). All the time, it was measured during midday on the upper leaf surface well exposed to sunlight. From all three replications, three plants per sub-plot and two leaves per plant were measured for stomatal conductance.
2.3.4. Leaf Mineral Content
The leaf samples were collected at the end of the second year of experimentation on 23 July 2020. The collected plant leaves were oven-dried at 70 °C to achieve a constant weight (three replicates per treatment). The dried plant material was finely ground to pass through a 2 mm sieve. The dried material (0.1–0.5 g) was digested in a digestion mixture (sulfuric acid–hydrogen peroxide) using the methodology described by Wolf [35]. Total nitrogen (N) was determined using the micro-Kjeldahl method. Potassium (K+) and sodium (Na+) in leaves were determined in plant samples by a wet digestion procedure using a mixture of nitric acid and perchloric acid with a ratio of 2:1 using a flame photometer according to the method described by Chapman and Pratt [36]. Concentrations of Na+, K+, and Ca2+ in the digestion mixture were determined using a flame photometer (Jenway, PFP7). For the determination of Cl−, the grounded material (0.1–0.5 g) was extracted using 10 mL of acetic acid at 80 °C for 6 h and determined using a chloride analyzer (Model926, Sherwood Scientific Ltd., Cambridge, UK). K+/Na+ and Ca2+/Na+ ratios in leaves (plant samples) were calculated for all treatments [16].
2.4. Statistical Analysis
Statistical analysis was performed using SPSS 17.0 package in R version R 4.0.5. Two-way analysis of variance (ANOVA) was performed to assess the effects of irrigation water salinity, P fertilizer rates, and their interaction on yield and leaf mineral nutrients. The significant parameters from ANOVA were subjected to Tukey’s multiple comparisons test (p ≤ 0.05). Correlation among the measured parameters was assessed using Pearson’s coefficient. Furthermore, multivariate analysis was conducted with principal component analysis (PCA) using the “ggplot2”, “factoextra”, and “FactoMineR” packages. Visualization of heatmaps for horizontal and vertical distribution soil salinity was performed using the Matplotlib library of the Python 3.10.0 programming language.
3. Results
3.1. Analysis of Variance
The analysis of variance showed a significant effect of irrigation water salinity in all parameters except for leaf N, Mg, and Fe content (Table 4). Phosphorus application had a highly significant (p < 0.001) effect on annual fresh biomass and stomatal conductance. Additionally, P application had a significant effect on leaf Fe and Na content. The interaction effect of irrigation water salinity × P rate was significant for fresh biomass in both years.
Table 4.
Analysis of variance (ANOVA) showing p-value of fresh biomass (FB), stomatal conductance (SC), organic matter (OM), and leaf nutrient content, i.e., leaf nitrogen (N), phosphorus (P), potassium (K), magnesium (Mg), calcium (Ca), zinc (Zn), iron (Fe), and sodium (Na). DF = degree of freedom.
3.2. Effect of Irrigation Water Salinity on Fresh Biomass Production
The fresh forage yield of blue panicum was 76 ± 14 t·ha−1. Combined over two years, irrigation water salinity had a significant (p < 0.001) effect on the fresh biomass production, where 64% and 63% of the variability present in the fresh biomass is explained by irrigation water salinity for 2019 and 2020, respectively. Compared to the control, annual fresh biomass yield was reduced (p < 0.001) by 18% and 25% under irrigation water salinity of 12 and 17 dS·m−1, respectively (Figure 3).
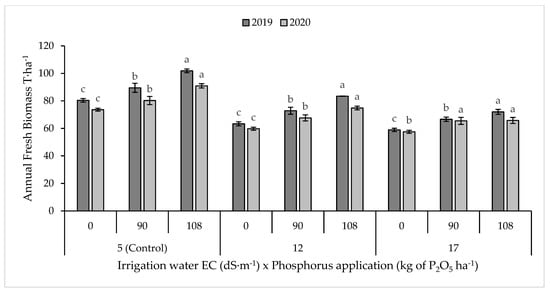
Figure 3.
Annual fresh biomass yield of blue panicum as affected by irrigation water salinity and phosphorus rate. Means with the same letters do not differ significantly at p = 0.05. Error bars indicate the standard deviation.
Application of P fertilizer increased (p < 0.001) fresh biomass yield of blue panicum in both seasons (Figure 3). At a low salinity level (5.4 dS·m−1), compared to the control, total fresh biomass yield was higher (p < 0.01) by 10% and 27% under 90 (P2) and 108 kg P2O5 ha−1 (P3), respectively. At a medium salinity level (ECw = 12.7 dS·m−1), P application increased (p < 0.05) fresh biomass yield by 11% and 32%, respectively, under P2 and P3 compared to control. Similarly, at a high salinity level (ECw = 17.5 dS·m−1), compared to control, P application in soil significantly increased the biomass yield (by 19%) under P3 (p = 0.01); however, no significant effect was observed under P2.
3.3. Stomatal Conductance
Stomatal conductance as affected by irrigation water salinity and P application during 2019–2020 is shown in Figure 4. Stomatal conductance significantly decreased with increasing irrigation water salinity. However, P application significantly increased stomatal conductance of blue panicum under all salinity levels, where it was increased by 24, 27, and 29% under S1, S2, and S3, respectively. Multiple pairwise comparisons indicated that stomatal conductance was not significantly different between 90 and 108 kg P2O5 ha−1; however, it was slightly higher under 108 kg P2O5 ha−1 (Figure 4).
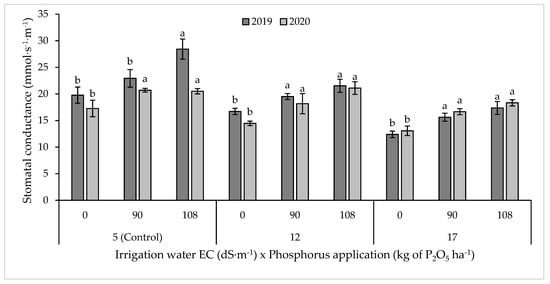
Figure 4.
Stomatal conductance of blue panicum as affected by irrigation water salinity and phosphorus rate. Means sharing the same letters do not differ significantly at 5%. Error bars indicate the standard deviation.
3.4. Leaf Mineral Content
The salinity of irrigation water affected (p < 0.05) almost all leaf mineral nutrient parameters except for N, Mg, and Fe (Table 5). Phosphorus application significantly affected only Mg/Na and Ca/Na equilibrium at high salinity levels. At a high salinity level, P supplementation mainly improved leaf OM, Zn, and Fe content.
Table 5.
Leaf nutrient content of blue panicum as affected by irrigation water salinity and phosphorus fertilizer rate. Any two values within a column are significantly different (p < 0.05) by Tukey’s test if they have no letter in common.
Irrigation water salinity significantly decreased leaf concentration of P, K, Ca, and Zn, while it increased OM and Na content. As a typical observation, blue panicum accumulated more K in its leaves than Na. Additionally, irrigation water salinity significantly reduced leaf K/Na, Ca/Na, and Mg/Na ratios (Table 5).
Compared to the control (5 dS·m−1), raising irrigation water salinity levels to 12 and 17 dS·m−1 resulted in a decrease in leaf K content by 6% and 27%, while it increased Na content by 29% and 40%. Similarly, compared to the control, higher salinity levels (12 and 17 dS·m−1) significantly reduced Ca content (by 10% and 23%, respectively), and they decreased (p < 0.05) Zn content (by 24 %) and P content (by 27%) at the highest salinity level (Table 5).
Increasing salinity led to a reduction in the K/Na, Ca/Na, and Mg/Na concentration ratios in the blue panicum leaf, indicating it accumulated more Na than K, Ca, and Mg under salinity stress. Compared with the control, the ratios of Ca/Na and Mg/Na were decreased by 31% and 21% under 12.7 dS·m−1 and by 46% and 37% at 17.5 dS·m−1, respectively. Additionally, the K/Na ratio was significantly reduced (by 29% and 44%, respectively, under 12 and 17 dS·m−1); however, this ratio was not up to ratio = 6.
3.5. Correlation Matrix
Figure 5 shows the correlation between all investigated parameters for two cropping years. Results show a highly significant and positive correlation between fresh biomass production and stomatal conductance. Moreover, the correlation was significant and moderately positive among measured macro-nutrients (N, P, K, Mg, and Ca). Remarkably, leaf organic matter and iron content were negatively correlated with all the calculated ratios.
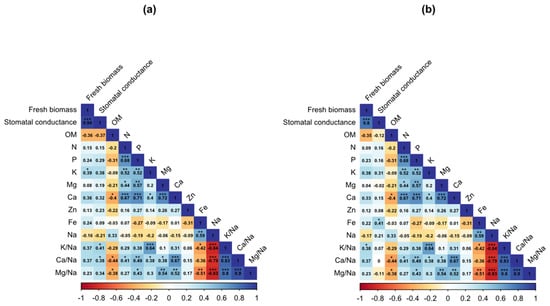
Figure 5.
Pearson’s correlation among leaf mineral nutrients during 2019 (a) and 2020 (b). *, **, and *** indicate significant differences at p < 0.05, 0.01, and 0.001, respectively. Color gradient scale corresponds to Pearson’s coefficient of correlation.
3.6. Multivariate Analysis
Results from the principal component analysis (PCA) indicate that the first three principal components explained 70% of the data variability. According to the projection of variables by cos² (Figure 6), the first dimension (PC1) was explained by Ca/Na, Mg/Na, K/Na, Ca, and P, while PC2 was explained by Fe and Na. Moreover, fresh biomass and stomatal conductance contributed to the formation of PC3. The projection of supplementary dependent variables showed that salinity was correlated positively with leaf Na and OM, and negatively with fresh biomass and stomatal conductance. Moreover, the application of P has a moderate positive correlation with fresh biomass, stomatal conductance, and Fe content.
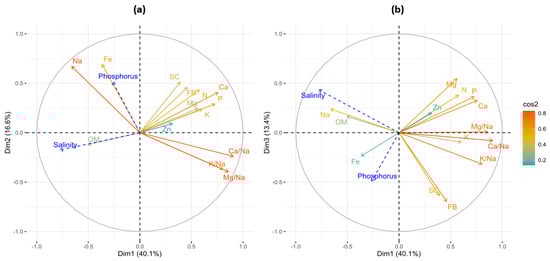
Figure 6.
Correlation among variables in the first three principal components, PC1 and PC2 (a) and PC1 and PC3 (b). The color gradient scale indicates the intensity of contribution of variables according to the cos² for its coordinates. Blue arrows correspond to the projections of supplementary dependent variables. FB is fresh biomass, and SC is stomatal conductance.
3.7. Salinity in Different Soil Depth and Distance from the Plant
Analysis of variance for electrical conductivity indicates that soil salinity was significantly affected by irrigation water salinity level at a 10 cm distance from plants for the two sampled horizons (depths) (Table 6). Interestingly, salt accumulated mainly at a 20 cm depth in the inter-row space.
Table 6.
Effect of irrigation water salinity on spatial (distance and depth) distribution of salt accumulation. Results are presented as mean ± standard deviation. Lowercase and same letters (a, ab, and b) indicate homogeneous group of means using Tukey’s test (p < 0.05).
Spatial (depth-wise) distribution for soil salinity showed that salt mainly accumulated at the topsoil layer at low salinity level (Figure 7b), while this accumulation tends to be more at a 20 cm depth under high-salinity irrigation water (Figure 7c,d).
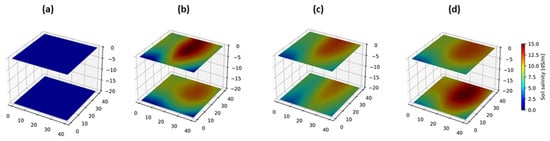
Figure 7.
Heatmap of soil salinity distribution at two depths. Initial salinity level (a); and after two years of experiment under irrigation water salinity of 5.4 dS·m−1 ((b) control); 12.7 dS·m−1 (c), and 17.5 dS·m−1 (d). The point with coordinates (0;0;0) represents plant position.
4. Discussion
Our study clearly shows that irrigation water salinity had a negative effect on the growth and productivity of blue panicum grass (Table 4, Figure 3), where higher irrigation water salinity (12.7 and 17.5 dS·m−1) significantly reduced the fresh biomass yield in both years. Plant growth and yield reduction under high salinity are related to altering physiological functions [11]. Higher salinity reduced growth by decreasing chlorophyll, rubisco, and PSII activity through ROS production [22] and reducing leaf index [14]. Irshad et al. [26] reported that salinity stress affects plant growth by limiting plant N uptake and lowering soil osmotic potentials. However, fresh biomass yield higher than 60 t·ha−1 (ranging from 60 to 102 t·ha−1) of blue panicum in the desert climate with very high salinity (Laayoune, Morocco) (Table 4) is something worthwhile to consider for adoption by the livestock entrepreneurs in the similar climatic condition in other parts of the world. It survives under NaCl concentrations up to 150 mM by adjusting transpiration, photosynthesis, and water use efficiency and using sodium as an osmoticum in both shoot and root tissues [11]. It survives optimally at moderate salinities between 100 and 150 mM NaCl and produces fresh biomass yield up to 60 t·ha−1 year−1 [10] up to 150–180 t·ha−1 year−1 [17]. Salt tolerance in this grass is generally associated with low uptake and accumulation of Na+ in roots [37]. Our study showed higher uptake of Na than K, Ca, and Mg (Table 5). The fairly high yield even under 17.5 dS·m−1 (Figure 3) shows further study might be needed for the systematic understanding of salt tolerance and high yield for wider promotion and adoption under high salinity and dryland conditions.
Consistent with the results obtained by Hussain and Liu [38], we found that salinity in combination with drought significantly affected the growth and biomass yield of blue panicum. As also reported by Farrag et al. [39], this decrease in biomass can be explained by reduced plants’ shoot length (height) and root length with increasing irrigation water salinity: irrigation water salinity from 5 to 15 g·L−1 reduced shoot and root length by 8–32% compared with irrigation with fresh water. In another study, Jamil and Rha [40] reported that root length and plant height provide important insights into the response of plants to salt stress because roots are directly in contact with soil to absorb water and nutrients and supply to shoot and other parts of the plant.
4.1. Effect of Phosphorus Fertilization
Under saline conditions, P application significantly increased the biomass yield of blue panicum, and it reduced the negative effect of salinity. This result is in agreement with the findings of Al-Karaki [41] and Khosh Kholgh Sima et al. [42]. Additionally, the significantly higher forage yield with P application under low salinity (control) indicated, regardless of the salinity condition, P application enhances biomass production of blue panicum in drylands. They also found that an increase in salt level caused a significant decrease in the shoot and the root dry weights of barley, while adding P increased the plant dry weight and subsequently resulted in more resistance to salinity stress. Our results are also consistent with the previous findings reported by Kaya et al. [43], who suggested that soil application of P mitigated partially the adverse effects of salinity on maize. Jahan et al. [44] also reported that phosphorus fertilization had a significant influence on the yield of mungbean. A number of studies have addressed issues related to improvement in crop yield through P supply. Similar results were found in other crops such as green bean, chickpea, wheat, sugar beet [31,42,43,44], forage maize [29], and quinoa [27]. The increase in yield by P application is attributed to the role of phosphorus which increased concentration and uptake of essential plant nutrients mainly increased OM, Zn, and Fe content, decreased the concentration and uptake of toxic ions (Na+ and Cl−), and increased the ratio of beneficial ions by increasing Ca2+ and K+ concentrations.
4.2. Stomatal Conductance
The present study revealed the stomatal conductance was significantly improved through P supplication, while it was reduced under irrigation with saline water. Wang et al. [45] also reported that stomatal closure is the first major response (osmotic effect) under saline conditions that limits CO2 assimilation and photosynthesis processes. Similar results were also found by Ahmad et al. [16], who reported that salt stress generally has a negative effect on all gas exchange parameters for panicum grass grown under salinity between 3 and 19 dS·m−1. As the net CO2 assimilation, transpiration, and stomatal conductance are positively correlated, decreased stomatal conductance under saline conditions affects plant growth and yield [23]. High salinity reduces leaf stomatal conductance and CO2 fixed by the leaf, the major factors that decrease photosynthetic production and translocation to the various organs [46].
4.3. Mineral Nutrition as Affected by Salinity and P Application
In our study, Na+ content in plants significantly increased with irrigation water salinity (NaCl-treated treatments) (Table 5). In those treatments, Na+ interfered with the influx of other ions, especially K, Mg, Ca, N, and P. However, P application mitigated the negative effect of Na+ accumulation and increased the plant longevity and survival under saline stress especially by maintaining K+ concentration (Table 5). High Na+ concentration in the soil solution increases Na+ influx into the plant via roots [47], while low salinity decreases Na+ concentration in the root and shoot and consequently the Na+/K+ ratio [14]. The increased ratio of Na+/K+ decreases the photosynthetic rate and dry matter yield [21]. K+ is an important ion for osmotic adjustment, and the halophytic grasses maintain high K+ content even under high-salinity conditions [47]. Salt-tolerant species of panicum grass maintain relatively higher K+/Na+ ratios [16], and up to a threefold increase in leaf Ca could be the possibility for K+/Na+ homeostasis [48]. K+ transport systems have some affinity for Na+ such as in Na+/K+ symporters, and Na+ competes with K+ for intracellular influx [49]. Under salt stress, plants attempt to maintain a low Na+/K+ ratio to survive. These changes in the Na+/K+ ratio (Table 5) were expected due to Na+ and K+ content changes after NaCl treatment [47]. Our results are in line with the results reported by Ahmad et al. [16], who found that the blue panicum species adapted to high salinity showed a smaller decrease in leaf K+/Na+ and Ca2+/Na+ ratios under salinity stress.
5. Conclusions
The findings from this study revealed that increment in the irrigation water salinity led to a significant reduction in biomass of blue panicum. In addition, the blue panicum leaf mineral nutrient content declined under increased salinity. On the other hand, P fertilization was shown to improve plant mineral content, as well as stomatal conductance under salinity stress conditions. Phosphorus application under saline conditions reduces the adverse effects of high salinity on growth, yield, and mineral nutrient content. In light of these results obtained, P fertilization could be one of the best practices to ameliorate the negative effect of soil salinity stress. Thus, it is suggested to grow blue panicum and apply P fertilizer at the rate of 108 kg P2O5 ha−1 under salinity higher than 12 dS·m−1 (similar amount in non-saline conditions also) for higher forage yield to sustain livestock production in arid and desert climatic conditions.
Author Contributions
Conceptualization, R.C.-A. and A.B.; methodology, H.B.; software, H.B. and A.E.M.; validation, A.H., R.C.-A. and A.B.; formal analysis, H.B.; investigation, H.B. and B.B.; resources, R.C.-A. and B.B.; data curation, A.H.; writing—original draft preparation, H.B., K.P.D. and A.H.; writing—review and editing, A.H., K.P.D. and A.H.; visualization, A.H. and H.B.; supervision, R.C.-A., F.M., A.B. and B.B.; project administration, R.C.-A.; funding acquisition, R.C.-A. All authors have read and agreed to the published version of the manuscript.
Funding
This research was funded by the OCP Foundation in AppHos Project AGR-CHO-01/2017.
Institutional Review Board Statement
Not applicable.
Informed Consent Statement
Not applicable.
Data Availability Statement
Not applicable.
Acknowledgments
The authors thank the OCP Foundation for scientific financial research support and the National Institute for Agronomic Research of Tadla Morocco (INRA) for supporting this study and providing research facilities. We are also grateful to the technical staff of the salinity and plant nutrition laboratory and the soil–water–plant analysis laboratory in INRA Institute and UM6P of Laayoune, Morocco.
Conflicts of Interest
The authors declare no conflict of interest.
References
- Shrivastava, P.; Kumar, R. Soil Salinity: A Serious Environmental Issue and Plant Growth Promoting Bacteria as One of the Tools for Its Alleviation. Saudi J. Biol. Sci. 2015, 22, 123–131. [Google Scholar] [CrossRef] [Green Version]
- Global Map of Salt-Affected Soils | FAO SOILS PORTAL | Food and Agriculture Organization of the United Nations. Available online: https://www.fao.org/soils-portal/data-hub/soil-maps-and-databases/global-map-of-salt-affected-soils/en/ (accessed on 18 March 2022).
- Amimi, T.; Elbelrhiti, K.; Adnani, M.; Elbelrhiti, H.; Chao, J.; Oubbih, J. Soil Map of Khnifiss Lagoon and Its Surrounding Environment. Arab. J. Geosci. 2021, 14, 515. [Google Scholar] [CrossRef]
- Hopmans, J.W.; Qureshi, A.S.; Kisekka, I.; Munns, R.; Grattan, S.R.; Rengasamy, P.; Ben-Gal, A.; Assouline, S.; Javaux, M.; Minhas, P.S. Critical Knowledge Gaps and Research Priorities in Global Soil Salinity. Adv. Agron. 2021, 169, 1–191. [Google Scholar]
- Zeng, H.; Wu, B.; Zhang, M.; Zhang, N.; Elnashar, A.; Zhu, L.; Zhu, W.; Wu, F.; Yan, N.; Liu, W. Dryland Ecosystem Dynamic Change and Its Drivers in Mediterranean Region. Curr. Opin. Environ. Sustain. 2021, 48, 59–67. [Google Scholar] [CrossRef]
- Hasanuzzaman, M.; Nahar, K.; Alam, M.M.; Bhowmik, P.C.; Hossain, M.A.; Rahman, M.M.; Prasad, M.N.V.; Ozturk, M.; Fujita, M. Potential Use of Halophytes to Remediate Saline Soils. BioMed Res. Int. 2014, 2014, e589341. [Google Scholar] [CrossRef]
- Hamed, K.B.; Castagna, A.; Ranieri, A.; García-Caparrós, P.; Santin, M.; Hernandez, J.A.; Espin, G.B. Halophyte Based Mediterranean Agriculture in the Contexts of Food Insecurity and Global Climate Change. Environ. Exp. Bot. 2021, 191, 104601. [Google Scholar] [CrossRef]
- Brakez, M.; Daoud, S.; Harrouni, M.C.; Tachbibi, N.; Brakez, Z. Nutritional Value of Chenopodium Quinoa Seeds Obtained from an Open Field Culture Under Saline Conditions. In Halophytes for Food Security in Dry Lands; Khan, M.A., Ozturk, M., Gul, B., Ahmed, M.Z., Eds.; Academic Press: San Diego, CA, USA, 2016; pp. 37–47. ISBN 9780128018545. [Google Scholar]
- El Aich, A. Fodder Trees and Shrubs in Range and Farming Systems in North Africa. FAO Anim. Prod. Health Pap. 1992, 102, 61–73. [Google Scholar]
- Khan, M.A.; Ansari, R.; Ali, H.; Gul, B.; Nielsen, B.L. Panicum Turgidum, a Potentially Sustainable Cattle Feed Alternative to Maize for Saline Areas. Agric. Ecosyst. Environ. 2009, 129, 542–546. [Google Scholar] [CrossRef]
- Ali, H.; Gul, B.; Adnan, M.Y.; Ahmed, M.Z.; Aziz, I.; Gulzar, S.; Ansari, R.; Khan, M.A. NPK Mediated Improvement in in Biomass Production, Photosynthesis and and Na+ Regulation in Panicum Antidotale Under under Saline Conditions. Pak. J. Bot. 2014, 46, 1975–1979. [Google Scholar]
- Ashraf, M.Y.; Awan, A.R.; Mahmood, K. Rehabilitation of Saline Ecosystems through Cultivation of Salt Tolerant Plants. Pak. J. Bot. 2012, 44, 69–75. [Google Scholar]
- Jacobs, S.W.L.; Wall, C.A. Poaceae. Flora New South Wales 1993, 4, 410–656. [Google Scholar]
- Eshghizadeh, H.R.; Kafi, M.; Nezami, A. The Mechanisms of Salinity Tolerance in the Xero-Halophyte Blue Panicgrass (Panicum antidotale Retz). Not. Sci. Biol. 2012, 4, 59–64. [Google Scholar] [CrossRef] [Green Version]
- Cope, T.A. Poaceae. In Flora of Pakistan; Nasir, E., Ali, S.I., Eds.; Karachi University Press: Karachi, Pakistan, 1982. [Google Scholar]
- Ahmad, M.S.A.; Ashraf, M.; Ali, Q. Soil Salinity as a Selection Pressure Is a Key Determinant for the Evolution of Salt Tolerance in Blue Panicgrass (Panicum antidotale Retz.). Flora Morphol. Distrib. Funct. Ecol. Plants 2010, 205, 37–45. [Google Scholar] [CrossRef]
- Bokhari, U.G.; ALYaeesh, F.; AL Noori, M. Potentials of Forage Crops. Saudi Arab. J. Sci. Res. 1987, 6, 359–367. [Google Scholar]
- Ashraf, M. Some Important Physiological Selection Criteria for Salt Tolerance in Plants. Flora Morphol. Distrib. Funct. Ecol. Plants 2004, 199, 361–376. [Google Scholar] [CrossRef]
- Sallam, S.M.A.; Khalil, M.M.H.; Attia, M.F.A.; El-Zaiat, H.M.; Abdellattif, M.G.; Abo-Zeid, H.M.; Zeitoun, M.M. Utilization of Blue Panic (Panicum antidotale) as an Alternative Feed Resource for Feeding Barky Sheep in Arid Regions. Trop. Anim. Health Prod. 2019, 51, 2351–2360. [Google Scholar] [CrossRef]
- Munns, R.; Day, D.A.; Fricke, W.; Watt, M.; Arsova, B.; Barkla, B.J.; Bose, J.; Byrt, C.S.; Chen, Z.-H.; Foster, K.J.; et al. Energy Costs of Salt Tolerance in Crop Plants. New Phytol. 2020, 225, 1072–1090. [Google Scholar] [CrossRef] [Green Version]
- Munns, R.; Tester, M. Mechanisms of Salinity Tolerance. Annu. Rev. Plant Biol. 2008, 59, 651–681. [Google Scholar] [CrossRef] [Green Version]
- Koyro, H.-W.; Hussain, T.; Huchzermeyer, B.; Khan, M.A. Photosynthetic and Growth Responses of a Perennial Halophytic Grass Panicum turgidum to Increasing NaCl Concentrations. Environ. Exp. Bot. 2013, 91, 22–29. [Google Scholar] [CrossRef]
- Ashraf, M. Relationships between Leaf Gas Exchange Characteristics and Growth of Differently Adapted Populations of Blue Panicgrass (Panicum antidotale Retz.) under Salinity or Waterlogging. Plant Sci. 2003, 165, 69–75. [Google Scholar] [CrossRef]
- Ding, Z.; Kheir, A.M.S.; Ali, M.G.M.; Ali, O.A.M.; Abdelaal, A.I.N.; Lin, X.; Zhou, Z.; Wang, B.; Liu, B.; He, Z. The Integrated Effect of Salinity, Organic Amendments, Phosphorus Fertilizers, and Deficit Irrigation on Soil Properties, Phosphorus Fractionation and Wheat Productivity. Sci. Rep. 2020, 10, 2736. [Google Scholar] [CrossRef] [Green Version]
- Ashraf, M.; Shahzad, S.M.; Imtiaz, M.; Rizwan, M.S. Salinity Effects on Nitrogen Metabolism in Plants–Focusing on the Activities of Nitrogen Metabolizing Enzymes: A Review. J. Plant Nutr. 2018, 41, 1065–1081. [Google Scholar] [CrossRef]
- Irshad, M.; Yamamoto, S.; Eneji, A.E.; Endo, T.; Honna, T. Urea and Manure Effect on Growth and Mineral Contents of Maize under Saline Conditions. J. Plant Nutr. 2002, 25, 189–200. [Google Scholar] [CrossRef]
- Bouras, H.; Choukr-Allah, R.; Amouaouch, Y.; Bouaziz, A.; Devkota, K.P.; El Mouttaqi, A.; Bouazzama, B.; Hirich, A. How Does Quinoa (Chenopodium quinoa Willd.) Respond to Phosphorus Fertilization and Irrigation Water Salinity? Plants 2022, 11, 216. [Google Scholar] [CrossRef]
- Bouras, H.; Bouaziz, A.; Bouazzama, B.; Hirich, A.; Choukr-Allah, R. How Phosphorus Fertilization Alleviates the Effect of Salinity on Sugar Beet (Beta vulgaris L.) Productivity and Quality. Agronomy 2021, 11, 1491. [Google Scholar] [CrossRef]
- Bouras, H.; Bouaziz, A.; Choukr-Allah, R.; Hirich, A.; Devkota, K.P.; Bouazzama, B. Phosphorus Fertilization Enhances Productivity of Forage Corn (Zea mays L.) Irrigated with Saline Water. Plants 2021, 10, 2608. [Google Scholar] [CrossRef]
- Grattan, S.R.; Grieve, C.M. Salinity–Mineral Nutrient Relations in Horticultural Crops. Sci. Hortic. 1998, 78, 127–157. [Google Scholar] [CrossRef]
- Grattan, S.R.; Grieve, C.M. Mineral Element Acquisition and Growth Response of Plants Grown in Saline Environments. Agric. Ecosyst. Environ. 1992, 38, 275–300. [Google Scholar] [CrossRef]
- Dey, G.; Banerjee, P.; Sharma, R.K.; Maity, J.P.; Etesami, H.; Shaw, A.K.; Huang, Y.-H.; Huang, H.-B.; Chen, C.-Y. Management of Phosphorus in Salinity-Stressed Agriculture for Sustainable Crop Production by Salt-Tolerant Phosphate-Solubilizing Bacteria—A Review. Agronomy 2021, 11, 1552. [Google Scholar] [CrossRef]
- Ali, S.; Rizwan, M.; Qayyum, M.F.; Ok, Y.S.; Ibrahim, M.; Riaz, M.; Arif, M.S.; Hafeez, F.; Al-Wabel, M.I.; Shahzad, A.N. Biochar Soil Amendment on Alleviation of Drought and Salt Stress in Plants: A Critical Review. Environ. Sci. Pollut. Res. 2017, 24, 12700–12712. [Google Scholar] [CrossRef]
- Khorsandi, F.; Yazdi, F.A. Estimation of Saturated Paste Extracts’ Electrical Conductivity from 1:5 Soil/Water Suspension and Gypsum. Commun. Soil Sci. Plant Anal. 2011, 42, 315–321. [Google Scholar] [CrossRef]
- Wolf, B. A Comprehensive System of Leaf Analyses and Its Use for Diagnosing Crop Nutrient Status. Commun. Soil Sci. Plant Anal. 1982, 13, 1035–1059. [Google Scholar] [CrossRef]
- Chapman, H.D.; Pratt, P.F. Methods of Analysis for Soils, Plants and Waters; University of California: Berkeley, CA, USA, 1961. [Google Scholar]
- Marcum, K.B.; Murdoch, C.L. Salinity Tolerance Mechanisms of Six C4 Turfgrasses. J. Am. Soc. Hortic. Sci. 1994, 119, 779–784. [Google Scholar] [CrossRef] [Green Version]
- Hussain, T.; Liu, X. Low Salinity Improves Photosynthetic Performance in Panicum Antidotale Under Drought Stress. Front. Plant Sci. 2020, 11, 13. [Google Scholar] [CrossRef]
- Farrag, K.; Abdelhakim, S.G.; Abd El-Tawab, A.R.; Abdelrahman, H. Growth Response of Blue Panic Grass (Panicum antidotale) to Saline Water Irrigation and Compost Applications. Water Sci. 2021, 35, 31–38. [Google Scholar] [CrossRef]
- Jamil, M.; Rha, E.-S. The Effect of Salinity (NaCl) on the Germination and Seedling of Sugar Beet (Beta vulgaris L.) and Cabbage (Brassica oleracea L.). Plant Resour. 2004, 7, 226–232. [Google Scholar]
- AI-Karaki, G.N. Barley Response to Salt Stress at Varied Levels of Phosphorus. J. Plant Nutr. 1997, 20, 1635–1643. [Google Scholar] [CrossRef]
- Khosh Kholgh Sima, N.A.; Ahmad, S.T.; Alitabar, R.A.; Mottaghi, A.; Pessarakli, M. Interactive Effects of Salinity and Phosphorus Nutrition on Physiological Responses of Two Barley Species. J. Plant Nutr. 2012, 35, 1411–1428. [Google Scholar] [CrossRef]
- Kaya, C.; Ashraf, M.; Dikilitas, M.; Tuna, A. Alleviation of Salt Stress-Induced Adverse Effects on Maize Plants by Exogenous Application of Indoleacetic Acid (IAA) and Inorganic Nutrients—A Field Trial. Aust. J. Crop. Sci. 2013, 7, 249–254. [Google Scholar]
- Jahan, M.N.; Barua, S.; Ali, H.; Ali, M.N.; Chowdhury, M.S.H.; Hasan, M.M.; Ferdous, T.; Eti, F.S.; Khayer, A.; Hossen, K. Effects of Phosphorus Fertilization on Hybrid Varieties of Mungbean [Vigna radiata (L.) Wilczek] in a Salinity Prone Area of the Subtropics. Acta Agrobot. 2020, 73, 7338. [Google Scholar] [CrossRef]
- Wang, X.; Wang, W.; Huang, J.; Peng, S.; Xiong, D. Diffusional Conductance to CO2 Is the Key Limitation to Photosynthesis in Salt-Stressed Leaves of Rice (Oryza sativa). Physiol. Plant. 2018, 163, 45–58. [Google Scholar] [CrossRef] [Green Version]
- Munns, R.; James, R.A. Screening Methods for Salinity Tolerance: A Case Study with Tetraploid Wheat. Plant Soil 2003, 253, 201–218. [Google Scholar] [CrossRef]
- Sobhanian, H.; Motamed, N.; Jazii, F.R.; Razavi, K.; Niknam, V.; Komatsu, S. Salt Stress Responses of a Halophytic Grass Aeluropus lagopoides and Subsequent Recovery. Russ. J. Plant Physiol. 2010, 57, 784–791. [Google Scholar] [CrossRef]
- Sun, J.; Wang, M.-J.; Ding, M.-Q.; Deng, S.-R.; Liu, M.-Q.; Lu, C.-F.; Zhou, X.-Y.; Shen, X.; Zheng, X.-J.; Zhang, Z.-K.; et al. H2O2 and Cytosolic Ca2+ Signals Triggered by the PM H+-Coupled Transport System Mediate K+/Na+ Homeostasis in NaCl-Stressed Populus Euphratica Cells. Plant Cell Environ. 2010, 33, 943–958. [Google Scholar] [CrossRef]
- Blumwald, E.; Aharon, G.S.; Apse, M.P. Sodium Transport in Plant Cells. Biochim. Biophys. Acta BBA Biomembr. 2000, 1465, 140–151. [Google Scholar] [CrossRef] [Green Version]
Publisher’s Note: MDPI stays neutral with regard to jurisdictional claims in published maps and institutional affiliations. |
© 2022 by the authors. Licensee MDPI, Basel, Switzerland. This article is an open access article distributed under the terms and conditions of the Creative Commons Attribution (CC BY) license (https://creativecommons.org/licenses/by/4.0/).