
Using the CERES-Maize Model to Simulate Crop Yield in a Long-Term Field Experiment in Hungary


Abstract
:1. Introduction
- -
- Growth and yield of maize hybrids in a context of environmental conditions;
- -
- The initial parameters for the model run were established (soil chemical variables, soil physical properties, soil mechanical structure, soil moisture, etc.);
- -
- Phenological and growth characteristics of individual maize hybrids.
Use of the DSSAT Software under Precision and Experimental Conditions
2. Materials and Methods
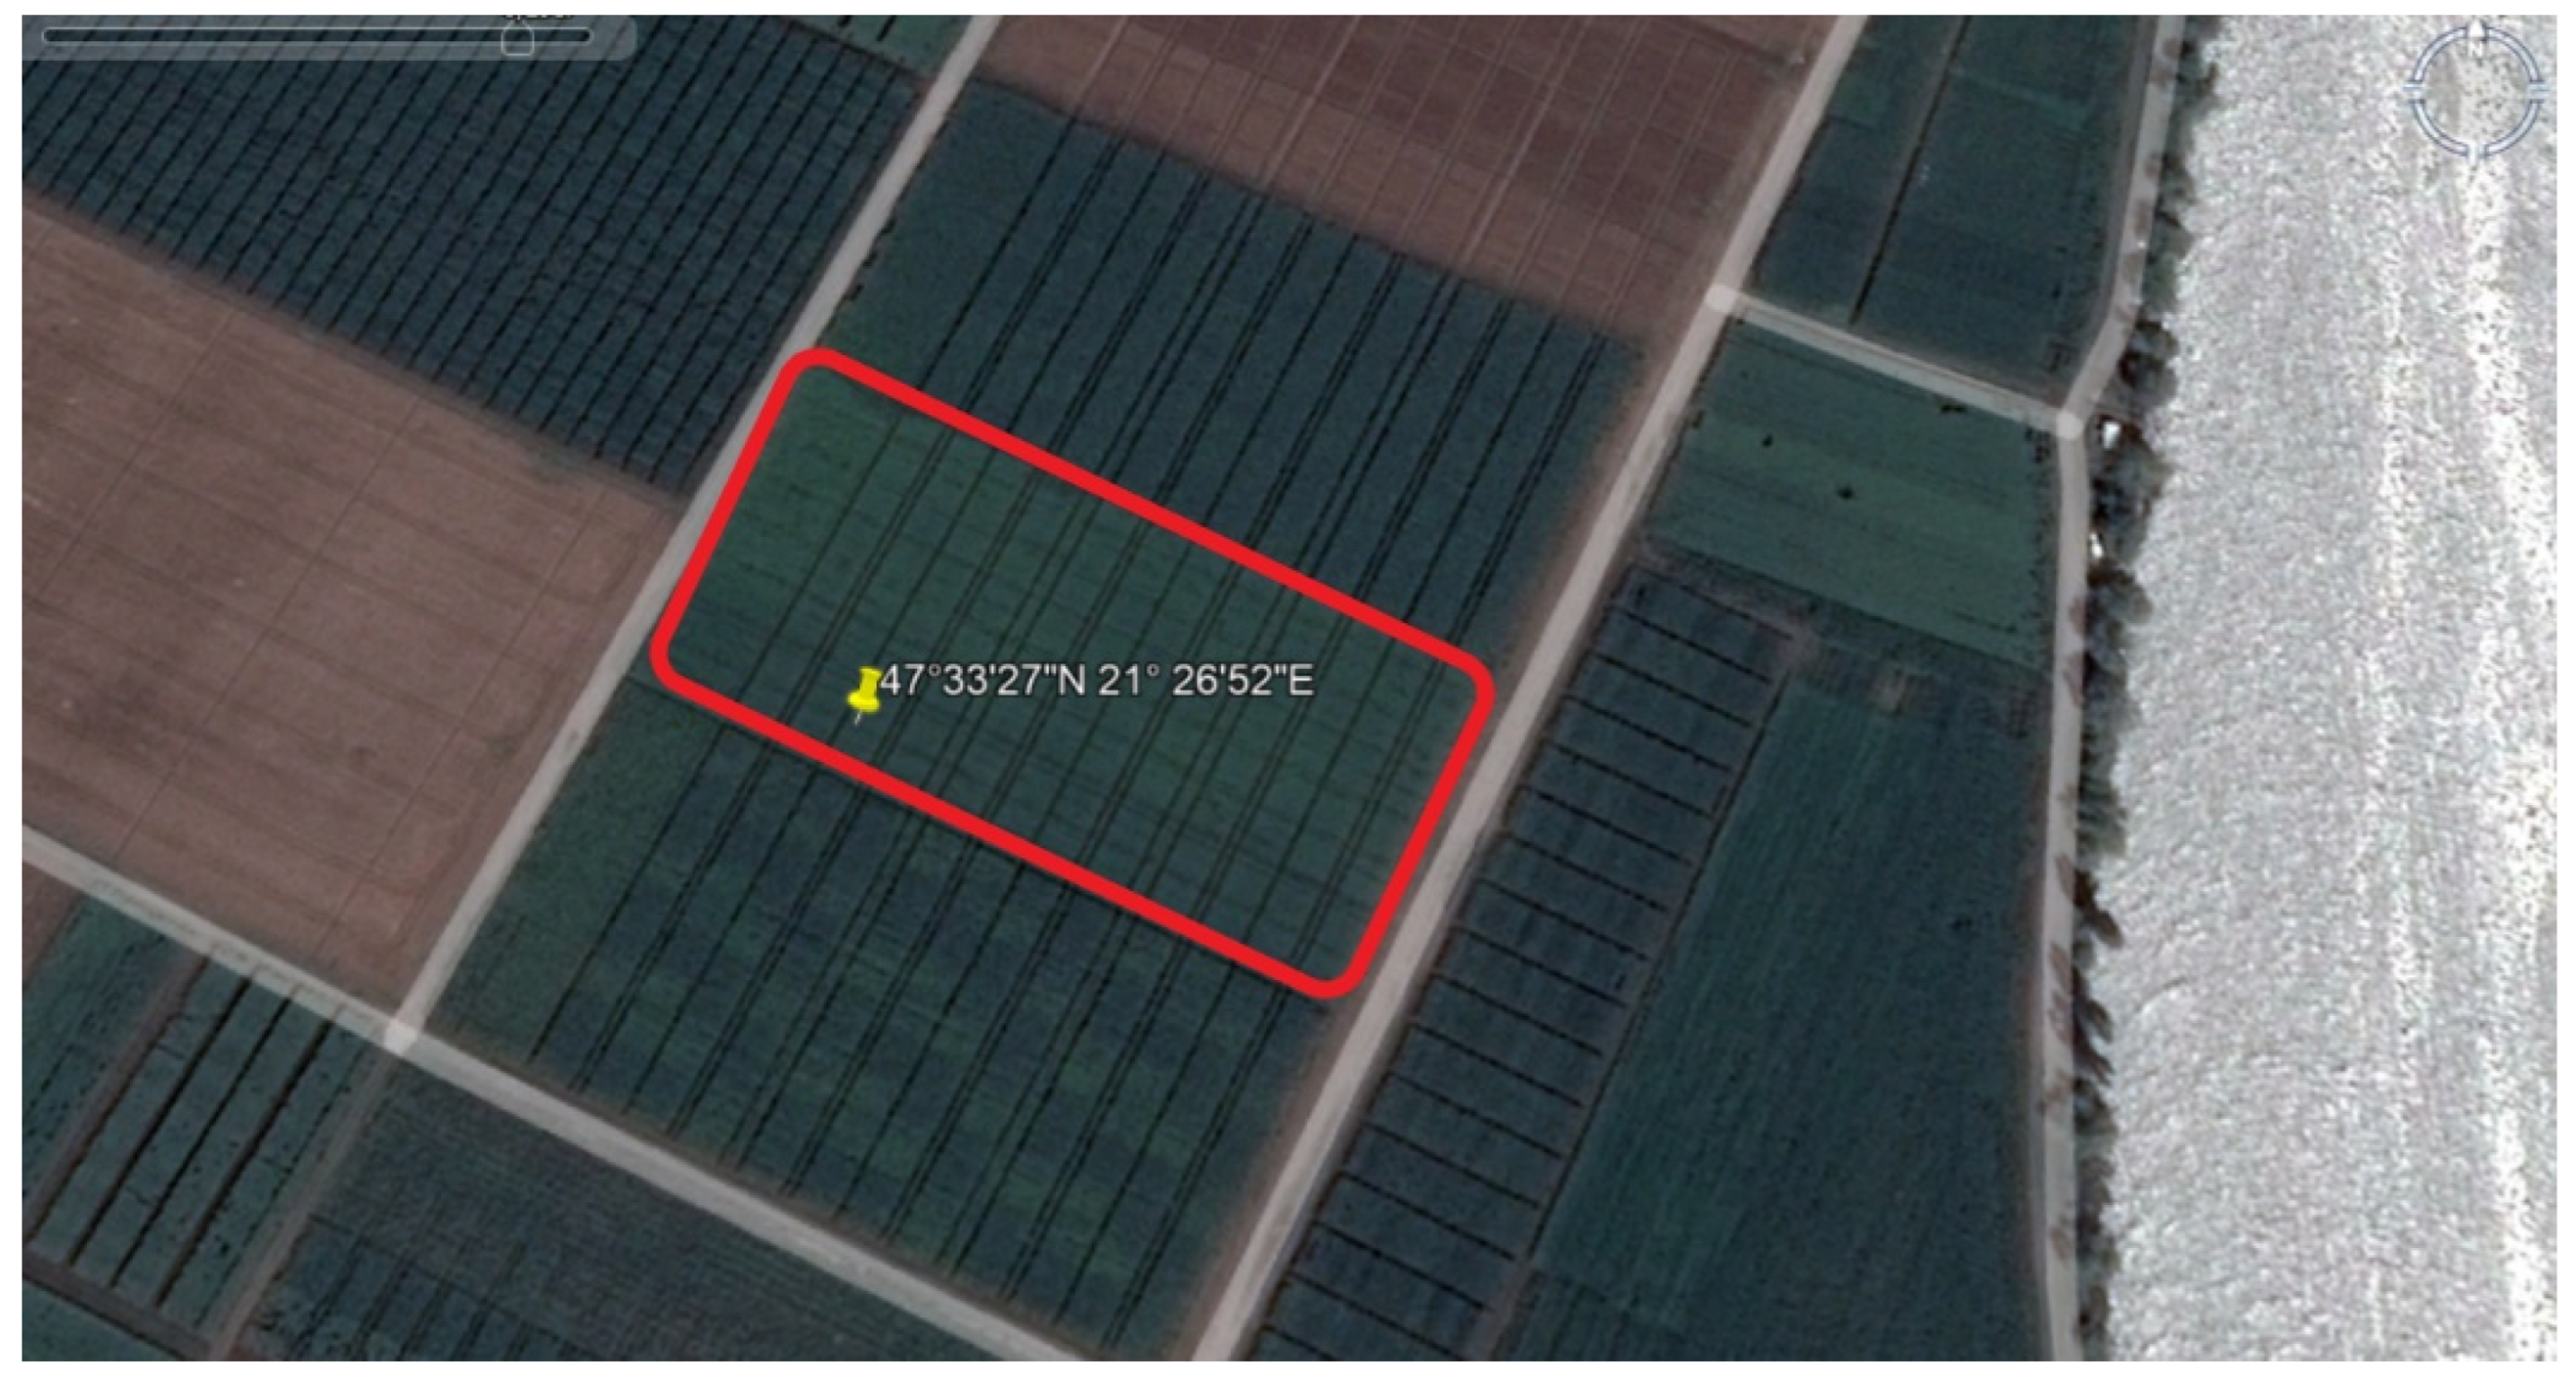
2.1. Experimental Site and Treatments
2.2. Soil Data
2.3. Climatic Conditions of the Experimental Site (2016–2020)
2.4. Model Calibration and Evaluation/Data Requirements for Calibrating and Validating the Ceres-Maize Model
2.5. Weather Data
2.6. Examined Hybrid Parameters
2.7. Statistical Analysis
3. Results and Discussion
3.1. CERES-Maize Simulation Results
3.2. Results of the Statistical Analysis
4. Conclusions
Author Contributions
Funding
Data Availability Statement
Acknowledgments
Conflicts of Interest
Appendix A

| 2017 | |||||||||
|---|---|---|---|---|---|---|---|---|---|
| Layer Depth, cm | Organic Carbon % | Total Nitrogen % | pH in Water | Lower Limit, cm3 cm−3 | Drained Upper Limit, cm3 cm−3 | Saturated Water Holding Capacity, cm3 cm−3 | Bulk Density g/cm3 | Sat. Hydraulic Conduct, cm/h | Root Growth Factor, 0.0 to 1.0 |
| 5 | 1.58 | 0.16 | 7.3 | 0.21 | 0.424 | 0.495 | 1.24 | 0.15 | 1.000 |
| 10 | 1.58 | 0.16 | 7.3 | 0.21 | 0.424 | 0.495 | 1.24 | 0.15 | 1.000 |
| 15 | 1.58 | 0.16 | 7.3 | 0.21 | 0.424 | 0.495 | 1.24 | 0.15 | 1.000 |
| 20 | 1.58 | 0.16 | 7.3 | 0.21 | 0.424 | 0.495 | 1.24 | 0.15 | 1.000 |
| 25 | 1.34 | 0.13 | 7.2 | 0.202 | 0.41 | 0.489 | 1.26 | 0.15 | 0.638 |
| 30 | 1.34 | 0.13 | 7.2 | 0.202 | 0.41 | 0.489 | 1.26 | 0.15 | 0.577 |
| 35 | 1.34 | 0.13 | 7.2 | 0.202 | 0.41 | 0.489 | 1.26 | 0.15 | 0.522 |
| 40 | 1.34 | 0.13 | 7.2 | 0.202 | 0.41 | 0.489 | 1.26 | 0.15 | 0.472 |
| 45 | 0.97 | 0.1 | 7.2 | 0.192 | 0.391 | 0.477 | 1.3 | 0.15 | 0.427 |
| 50 | 0.97 | 0.1 | 7.2 | 0.177 | 0.377 | 0.484 | 1.28 | 0.68 | 0.387 |
| 55 | 0.97 | 0.1 | 7.2 | 0.177 | 0.377 | 0.484 | 1.28 | 0.68 | 0.35 |
| 60 | 0.97 | 0.1 | 7.2 | 0.177 | 0.377 | 0.484 | 1.28 | 0.68 | 0.317 |
| 65 | 0.6 | 0.06 | 8.0 | 0.167 | 0.358 | 0.472 | 1.32 | 0.68 | 0.287 |
| 70 | 0.6 | 0.06 | 8.0 | 0.18 | 0.367 | 0.472 | 1.32 | 0.15 | 0.259 |
| 75 | 0.6 | 0.06 | 8.0 | 0.18 | 0.367 | 0.472 | 1.32 | 0.15 | 0.235 |
| 80 | 0.6 | 0.06 | 8.0 | 0.18 | 0.367 | 0.472 | 1.32 | 0.15 | 0.212 |
| 85 | 0.5 | 0.05 | 8.4 | 0.178 | 0.362 | 0.47 | 1.33 | 0.15 | 0.192 |
| 90 | 0.5 | 0.05 | 8.4 | 0.178 | 0.362 | 0.47 | 1.33 | 0.15 | 0.174 |
References
- Neményi, M. Precision Crop Production and Artificial Intelligence—The Future of Sustainable Agriculture. Acta Agrar. Debr. 2018, 150, 47–58. [Google Scholar] [CrossRef]
- Nagy, J. Kukorica. A Nemzet Aranya—Élelmiszer, Takarmány, Bioenergia; Szaktudás Kiadó Ház: Budapest, Hungary, 2021. [Google Scholar]
- Holzworth, D.P.; Snow, V.; Janssen, S.; Athanasiadis, I.N.; Donatelli, M.; Hoogenboom, G.; White, J.W.; Thorburn, P. Agricultural Production Systems Modelling and Software: Current Status and Future Prospects. Environ. Model. Softw. 2015, 72, 276–286. [Google Scholar] [CrossRef]
- Huzsvai, L.; Nagy, J. Kukorica (Zea mays L.) tőszám és termésösszefüggés elemzése különböző biológiai érvényességgel rendelkező modellekkel. Növénytermelés 1994, 43, 533–544. [Google Scholar]
- Quiring, S.M.; Legates, D.R. Application of CERES-Maize for within-Season Prediction of Rainfed Corn Yields in Delaware, USA. Agric. For. Meteorol. 2008, 148, 964–975. [Google Scholar] [CrossRef]
- Liu, H.L.; Yang, J.Y.; Drury, C.F.; Reynolds, W.D.; Tan, C.S.; Bai, Y.L.; He, P.; Jin, J.; Hoogenboom, G. Using the DSSAT-CERES-Maize Model to Simulate Crop Yield and Nitrogen Cycling in Fields under Long-Term Continuous Maize Production. Nutr. Cycl. Agroecosyst. 2010, 89, 313–328. [Google Scholar] [CrossRef]
- Liu, H.L.; Yang, J.Y.; Tan, C.S.; Drury, C.F.; Reynolds, W.D.; Zhang, T.Q.; Bai, Y.L.; Jin, J.; He, P.; Hoogenboom, G. Simulating Water Content, Crop Yield and Nitrate-N Loss under Free and Controlled Tile Drainage with Subsurface Irrigation Using the DSSAT Model. Agric. Water Manag. 2011, 98, 1105–1111. [Google Scholar] [CrossRef]
- Carberry, P.S.; Muchow, R.C.; McCown, R.L. Testing the CERES-Maize Simulation Model in a Semi-Arid Tropical Environment. Field Crops Res. 1989, 20, 297–315. [Google Scholar] [CrossRef]
- Asadi, M.E.; Clemente, R.S. Evaluation of CERES-Maize of DSSAT model to simulate nitrate leaching, yield and soil moisture content under tropical conditions. J. Food Agric. Environ. 2003, 1, 270–276. [Google Scholar]
- Tofa, A.I.; Chiezey, U.F.; Babaji, B.A.; Adnan, A.A.; Beah, A.; Adam, A.M. Modeling planting-date effects on intermediate-maturing maize in contrasting environments in the nigerian savanna: An application of DSSAT model. Agronomy 2020, 10, 871. [Google Scholar] [CrossRef]
- Li, Z.T.; Yang, J.Y.; Drury, C.F.; Hoogenboom, G. Evaluation of the DSSAT-CSM for Simulating Yield and Soil Organic C and N of a Long-Term Maize and Wheat Rotation Experiment in the Loess Plateau of Northwestern China. Agric. Syst. 2015, 135, 90–104. [Google Scholar] [CrossRef]
- Soler, C.M.T.; Sentelhas, P.C.; Hoogenboom, G. Application of the CSM-CERES-Maize Model for Planting Date Evaluation and Yield Forecasting for Maize Grown off-Season in a Subtropical Environment. Eur. J. Agron. 2007, 27, 165–177. [Google Scholar] [CrossRef]
- White, J.W.; Jones, J.W.; Porter, C.; McMaster, G.S.; Sommer, R. Issues of spatial and temporal scale in modeling the effects of field operations on soil properties. Oper. Res. 2010, 10, 279–299. [Google Scholar] [CrossRef]
- Bassu, S.; Brisson, N.; Durand, J.L.; Boote, K.; Lizaso, J.; Jones, J.W.; Waha, K. How do various maize crop models vary in their responses to climate change factors? Glob. Change Biol. 2014, 20, 2301–2320. [Google Scholar] [CrossRef] [PubMed]
- Ngwira, A.R.; Aune, J.B.; Thierfelder, C. DSSAT modelling of conservation agriculture maize response to climate change in Malawi. Soil Tillage Res. 2014, 143, 85–94. [Google Scholar] [CrossRef]
- Thorp, K.R.; DeJonge, K.C.; Kaleita, A.L.; Batchelor, W.D.; Paz, J.O. Methodology for the Use of DSSAT Models for Precision Agriculture Decision Support. Comput. Electron. Agric. 2008, 64, 276–285. [Google Scholar] [CrossRef] [Green Version]
- Graeff, S.; Link, J.; Binder, J.; Claupei, W. Crop Models as Decision Support Systems in Crop Production. In Crop Production Technologies; InTech: Shangai, China, 2012. [Google Scholar]
- Thorp, K.R.; Batchelor, W.D.; Paz, J.O.; Kaleita, A.L.; DeJonge, K.C. Using Cross-Validation to Evaluate CERES-Maize Yield Simulations within a Decision Support System for Precision Agriculture. Trans. ASABE 2007, 50, 1467–1479. [Google Scholar] [CrossRef] [Green Version]
- Paz, J.O.; Batchelor, W.D.; Babcock, B.A.; Colvin, T.S.; Logsdon, S.D.; Kaspar, T.C.; Karlen, D.L. Model-Based Technique to Determine Variable Rate Nitrogen for Corn. Agric. Syst. 1999, 61, 69–75. [Google Scholar] [CrossRef]
- Salmerón, M.; Cavero, J.; Isla, R.; Porter, C.H.; Jones, J.W.; Boote, K.J. DSSAT nitrogen cycle simulation of cover crop–maize rotations under irrigated Mediterranean conditions. Agron. J. 2014, 106, 1283–1296. [Google Scholar] [CrossRef] [Green Version]
- Zhu, X.; Zhang, G.; Tholen, D.; Wang, Y.; Xin, C.; Song, Q. The next Generation Models for Crops and Agro-Ecosystems. Sci. China Inf. Sci. 2011, 54, 589–597. [Google Scholar] [CrossRef]
- Soil Classification. Available online: http://www.nrcs.usda.gov/wps/portal/nrcs/main/soils/survey/class/ (accessed on 30 January 2022).
- Gombos, B.; Nagy, J. Az időjárás értékelése kukorica (Zea mays L.) tartamkísérletek eredményei alapján. Növénytermelés 2019, 68, 5–23. [Google Scholar]
- Nagy, J. Maize Production; Akadémiai Kiadó: Budapest, Hungary, 2006. [Google Scholar]
- Jones, C.A.; Kiniry, J.R. CERES-Maize: A Simulation Model of Maize Growth and Development; Texas A & M University Press: College Station, TX, USA, 1986; ISBN 08-909-62693. [Google Scholar]
- Banda, S.K.A. Impact of Rainfall Variability and Agricultural Factors on Maize Yields in Lusaka Province 1976–2002; UNZA Press: Lusaka, Zambia, 2005. [Google Scholar]
- Nyéki, A.; Gombos, B.; Nagy, J. Nitrogéntrágyázás hatékonyságának vizsgálata Ceres-Maize modellel a Debrecen–Látókép tartamkísérlet eredményeinek felhasználásával. Növénytermelés 2020, 69, 33–52. [Google Scholar]
- Hanway, J.J. Growth stages of corn (Zea mays, L.) 1. Agron. J. 1963, 55, 487–492. [Google Scholar] [CrossRef]
- Yang, J.Y.; Huffman, E.C.T. Easy Grapher: Software for graphical and statistical validation of DSSAT outputs. Comput. Electron. Agric. 2004, 45, 125–132. [Google Scholar] [CrossRef]
- Willmott C, J. Some comments on the evaluation of model performance. Bull. Am. Meteorol. Soc. 1982, 63, 1309–1313. [Google Scholar] [CrossRef] [Green Version]
- Nagy, J.; Hadászi, L.; Illés, Á.; Bojtor, C.; Zelenák, A.; Nyéki, A. Fornad (FAO 420) kiváló Smart” kukorica hybrid termesztési eredményei. Növénytermelés 2020, 69, 1–19. [Google Scholar]
- Bao, Y.; Hoogenboom, G.; McClendon, R.; Vellidis, G. A comparison of the performance of the CSM-CERES-Maize and EPIC models using maize variety trial data. Agric. Syst. 2017, 150, 109–119. [Google Scholar] [CrossRef] [Green Version]
- Széles, A.; Nagy, J.; Rátonyi, T.; Harsányi, E. Effect of differential fertilisation treatments on maize hybrid quality and performance under environmental stress condition in Hungary. Maydica 2019, 64, 14. [Google Scholar]
- He, J.; Dukes, M.D.; Hochmuth, G.J.; Jones, J.W.; Graham, W.D. Identifying irrigation and nitrogen best management practices for sweet corn production on sandy soils using CERES-Maize model. Agric. Water Manag. 2012, 109, 61–70. [Google Scholar] [CrossRef]
- He, J. Best Management Practice Development with the CERES-Maize Model for Sweet Corn Production in North Florida; University of Florida: Gainesville, FL, USA, 2008. [Google Scholar]
- Chisanga, C.B. Evaluation of the CERES-Maize Model in Simulating Maize (Zea mays L.) Growth, Development and Yield at Different Planting Dates and Nitrogen Rates in a Subtropical Environment of Zambia; The University of Zambia: Lusaka, Zambia, 2014. [Google Scholar]
- Nyéki, A.; Milics, G.; Kovács, A.J.; Neményi, M. Improving yield advisory models for precision agriculture with special regards to soil compaction in maize production. In Precision Agriculture ’13; Stafford, J.V., Ed.; Wageningen Academic Publishers: Wageningen, The Netherlands, 2013. [Google Scholar]
- Nyéki, A.; Milics, G.; Kovács, A.J.; Neményi, M. Effects of Soil Compaction on Cereal Yield. Cereal Res. Commun. 2017, 45, 1–22. [Google Scholar] [CrossRef] [Green Version]


| Fertilizer Amount | N | P2O5 | K2O | Sum |
|---|---|---|---|---|
| 0 | - | - | - | - |
| 1 | 30 | 23 | 27 | 80 |
| 2 | 60 | 46 | 54 | 160 |
| 3 | 90 | 69 | 81 | 240 |
| 4 | 120 | 92 | 108 | 320 |
| 5 | 150 | 115 | 135 | 400 |
| Depth (cm) | Sand | Silt | Clay | ||||
|---|---|---|---|---|---|---|---|
| cm | 2–0.25 | 0.25–0.05 | 0.05–0.02 | 0.02–0.01 | 0.01–0.005 | 0.005–0.002 | <0.002 |
| 0–20 | 0.08 | 8.24 | 34.81 | 12.78 | 8.55 | 7.47 | 28.07 |
| 20–45 | 0.04 | 8.6 | 32.72 | 15.34 | 8.05 | 7.34 | 27.91 |
| 45–65 | 0.04 | 10.39 | 32.43 | 15.51 | 7.8 | 8.81 | 25.02 |
| 65–95 | 0.24 | 10.15 | 29.11 | 14.88 | 7.87 | 10.12 | 27.63 |
| 95–105 | 0.2 | 8.36 | 32.82 | 15.93 | 7.79 | 8.2 | 26.7 |
| 105–140 | 0.32 | 11.5 | 34.08 | 15.7 | 8.12 | 7.28 | 23 |
| 2016 | 2017 | 2018 | 2019 | 2020 | |
|---|---|---|---|---|---|
| April (1) | 13.3 (+2.1) | 10.7 (−0.5) | 16.0 (+4.8) | 12.4 (+1.2) | 10.8 (−0.4) |
| May (2) | 16.5 (−0.1) | 17.2 (+0.6) | 19.7 (+3.1) | 14.1 (−2.5) | 14 (−2.6) |
| June (3) | 21.1 (+1.8) | 22.2 (+2.9) | 20.2 (+0.9) | 22.8 (+3.5) | 19.6 (+0.3) |
| July (4) | 22.3 (+1.0) | 22.3 (+1.0) | 21.7 (+0.4) | 21.1 (−0.2) | 20.9 (−0.4) |
| August (5) | 20.8 (0) | 23.2 (+2.4) | 23.2 (+2.4) | 23.1 (+2.3) | 22.6 (+1.8) |
| September (6) | 17.6 (+1.6) | 16.4 (+0.4) | 17.1 (+1.1) | 17.1 (+1.1) | 17.9 (+1.9) |
| October (7) | 9.7 (−0.9) | 10.8 (+0.2) | 12.3 (+1.7) | 12.6 (+2.0) | 11.7 (+1.1) |
| Summer period (IV–IX.) (8) | 18.6 (+1.1) | 18.7 (+1.2) | 19.7 (+2.2) | 18.4 (+0.9) | 17.6 (+0.1) |
| Winter period (X–III.) (9) | 3.9 (−0.3) | 4.1 (−0.1) | 4.1 (−0.1) | 4.4 (+0.2) | 4.6 (+0.4) |
| 2016 | 2017 | 2018 | 2019 | 2020 | |
|---|---|---|---|---|---|
| April (1) | 16 (−37) | 51 (−2) | 37 (−16) | 33 (−20) | 17 (−36) |
| May (2) | 68 (+4) | 27 (−37) | 57 (−7) | 76 (+12) | 45 (−19) |
| June (3) | 146 (+80) | 67 (+1) | 64 (−2) | 32 (−34) | 119 (+53) |
| July (4) | 87 (+21) | 73 (+7) | 55 (−11) | 99 (+33) | 188 (+122) |
| August (5) | 72 (+23) | 61 (+12) | 92 (+43) | 15 (−34) | 70 (+21) |
| September (6) | 64 (+16) | 76 (+28) | 14 (−34) | 35 (−13) | 44 (+4) |
| October (7) | 98 (+60) | 38 (0) | 9 (−29) | 22 (−16) | 79 (+41) |
| Summer period (IV–IX.) (8) | 453 (+107) | 354 (+8) | 318 (−28) | 290 (−56) | 483 (+137) |
| 2020 | |||||||||
|---|---|---|---|---|---|---|---|---|---|
| Layer Depth, cm | Organic Carbon % | Total Nitrogen % | pH in Water | Lower Limit, cm3 cm−3 | Drained Upper Limit, cm3 cm−3 | Saturated Water Holding Capacity, cm3 cm−3 | Bulk Density g/cm3 | Sat. Hydraulic Conduct, cm/h | Root Growth Factor, 0.0 to 1.0 |
| 5 | 1.39 | 0.13 | 7.3 | 0.204 | 0.414 | 0.489 | 1.26 | 0.15 | 1.000 |
| 10 | 1.39 | 0.13 | 7.3 | 0.204 | 0.414 | 0.489 | 1.26 | 0.15 | 1.000 |
| 15 | 1.45 | 0.14 | 7.3 | 0.206 | 0.417 | 0.488 | 1.26 | 0.15 | 1.000 |
| 20 | 1.45 | 0.14 | 7.3 | 0.206 | 0.417 | 0.488 | 1.26 | 0.15 | 1.000 |
| 25 | 1.39 | 0.13 | 7.2 | 0.203 | 0.412 | 0.489 | 1.26 | 0.15 | 0.638 |
| 30 | 1.39 | 0.13 | 7.2 | 0.203 | 0.412 | 0.489 | 1.26 | 0.15 | 0.577 |
| 35 | 1.59 | 0.15 | 7.2 | 0.209 | 0.423 | 0.495 | 1.24 | 0.15 | 0.522 |
| 40 | 1.59 | 0.15 | 7.2 | 0.209 | 0.423 | 0.486 | 1.24 | 0.15 | 0.472 |
| 45 | 0.27 | 0.12 | 7.2 | 0.2 | 0.406 | 0.493 | 1.27 | 0.15 | 0.427 |
| 50 | 0.27 | 0.12 | 7.2 | 0.186 | 0.392 | 0.484 | 1.25 | 0.68 | 0.387 |
| 55 | 0.95 | 0.09 | 7.2 | 0.177 | 0.376 | 0.484 | 1.28 | 0.68 | 0.35 |
| 60 | 0.95 | 0.09 | 7.2 | 0.177 | 0.376 | 0.484 | 1.28 | 0.68 | 0.317 |
| 65 | 0.81 | 0.08 | 8.0 | 0.173 | 0.369 | 0.478 | 1.3 | 0.68 | 0.287 |
| 70 | 0.81 | 0.08 | 8.0 | 0.186 | 0.378 | 0.478 | 1.3 | 0.15 | 0.259 |
| 75 | 0.75 | 0.07 | 8.0 | 0.184 | 0.375 | 0.479 | 1.3 | 0.15 | 0.235 |
| 80 | 0.75 | 0.07 | 8.0 | 0.184 | 0.375 | 0.479 | 1.3 | 0.15 | 0.212 |
| 85 | 0.92 | 0.09 | 8.4 | 0.189 | 0.384 | 0.481 | 1.29 | 0.15 | 0.192 |
| 90 | 0.92 | 0.09 | 8.4 | 0.189 | 0.384 | 0.481 | 1.29 | 0.15 | 0.174 |
| Hybrid | P1 | P2 | P5 | G2 | G3 | PHINT |
|---|---|---|---|---|---|---|
| Sushi | 118 | 0.500 | 926 | 830 | 7.1 | 42 |
| Years | Sowing Date | Harvest Date |
|---|---|---|
| 2016 | 19 April | 14 October |
| 2017 | 25 April | 12 October |
| 2018 | 24 April | 19 September |
| 2019 | 16 April | 16 October |
| 2020 | 17 April | 24 October |
| Year | N Rate (kg N ha−1) | Grain Yield (kg ha−1) | |
|---|---|---|---|
| Measured | Simulated | ||
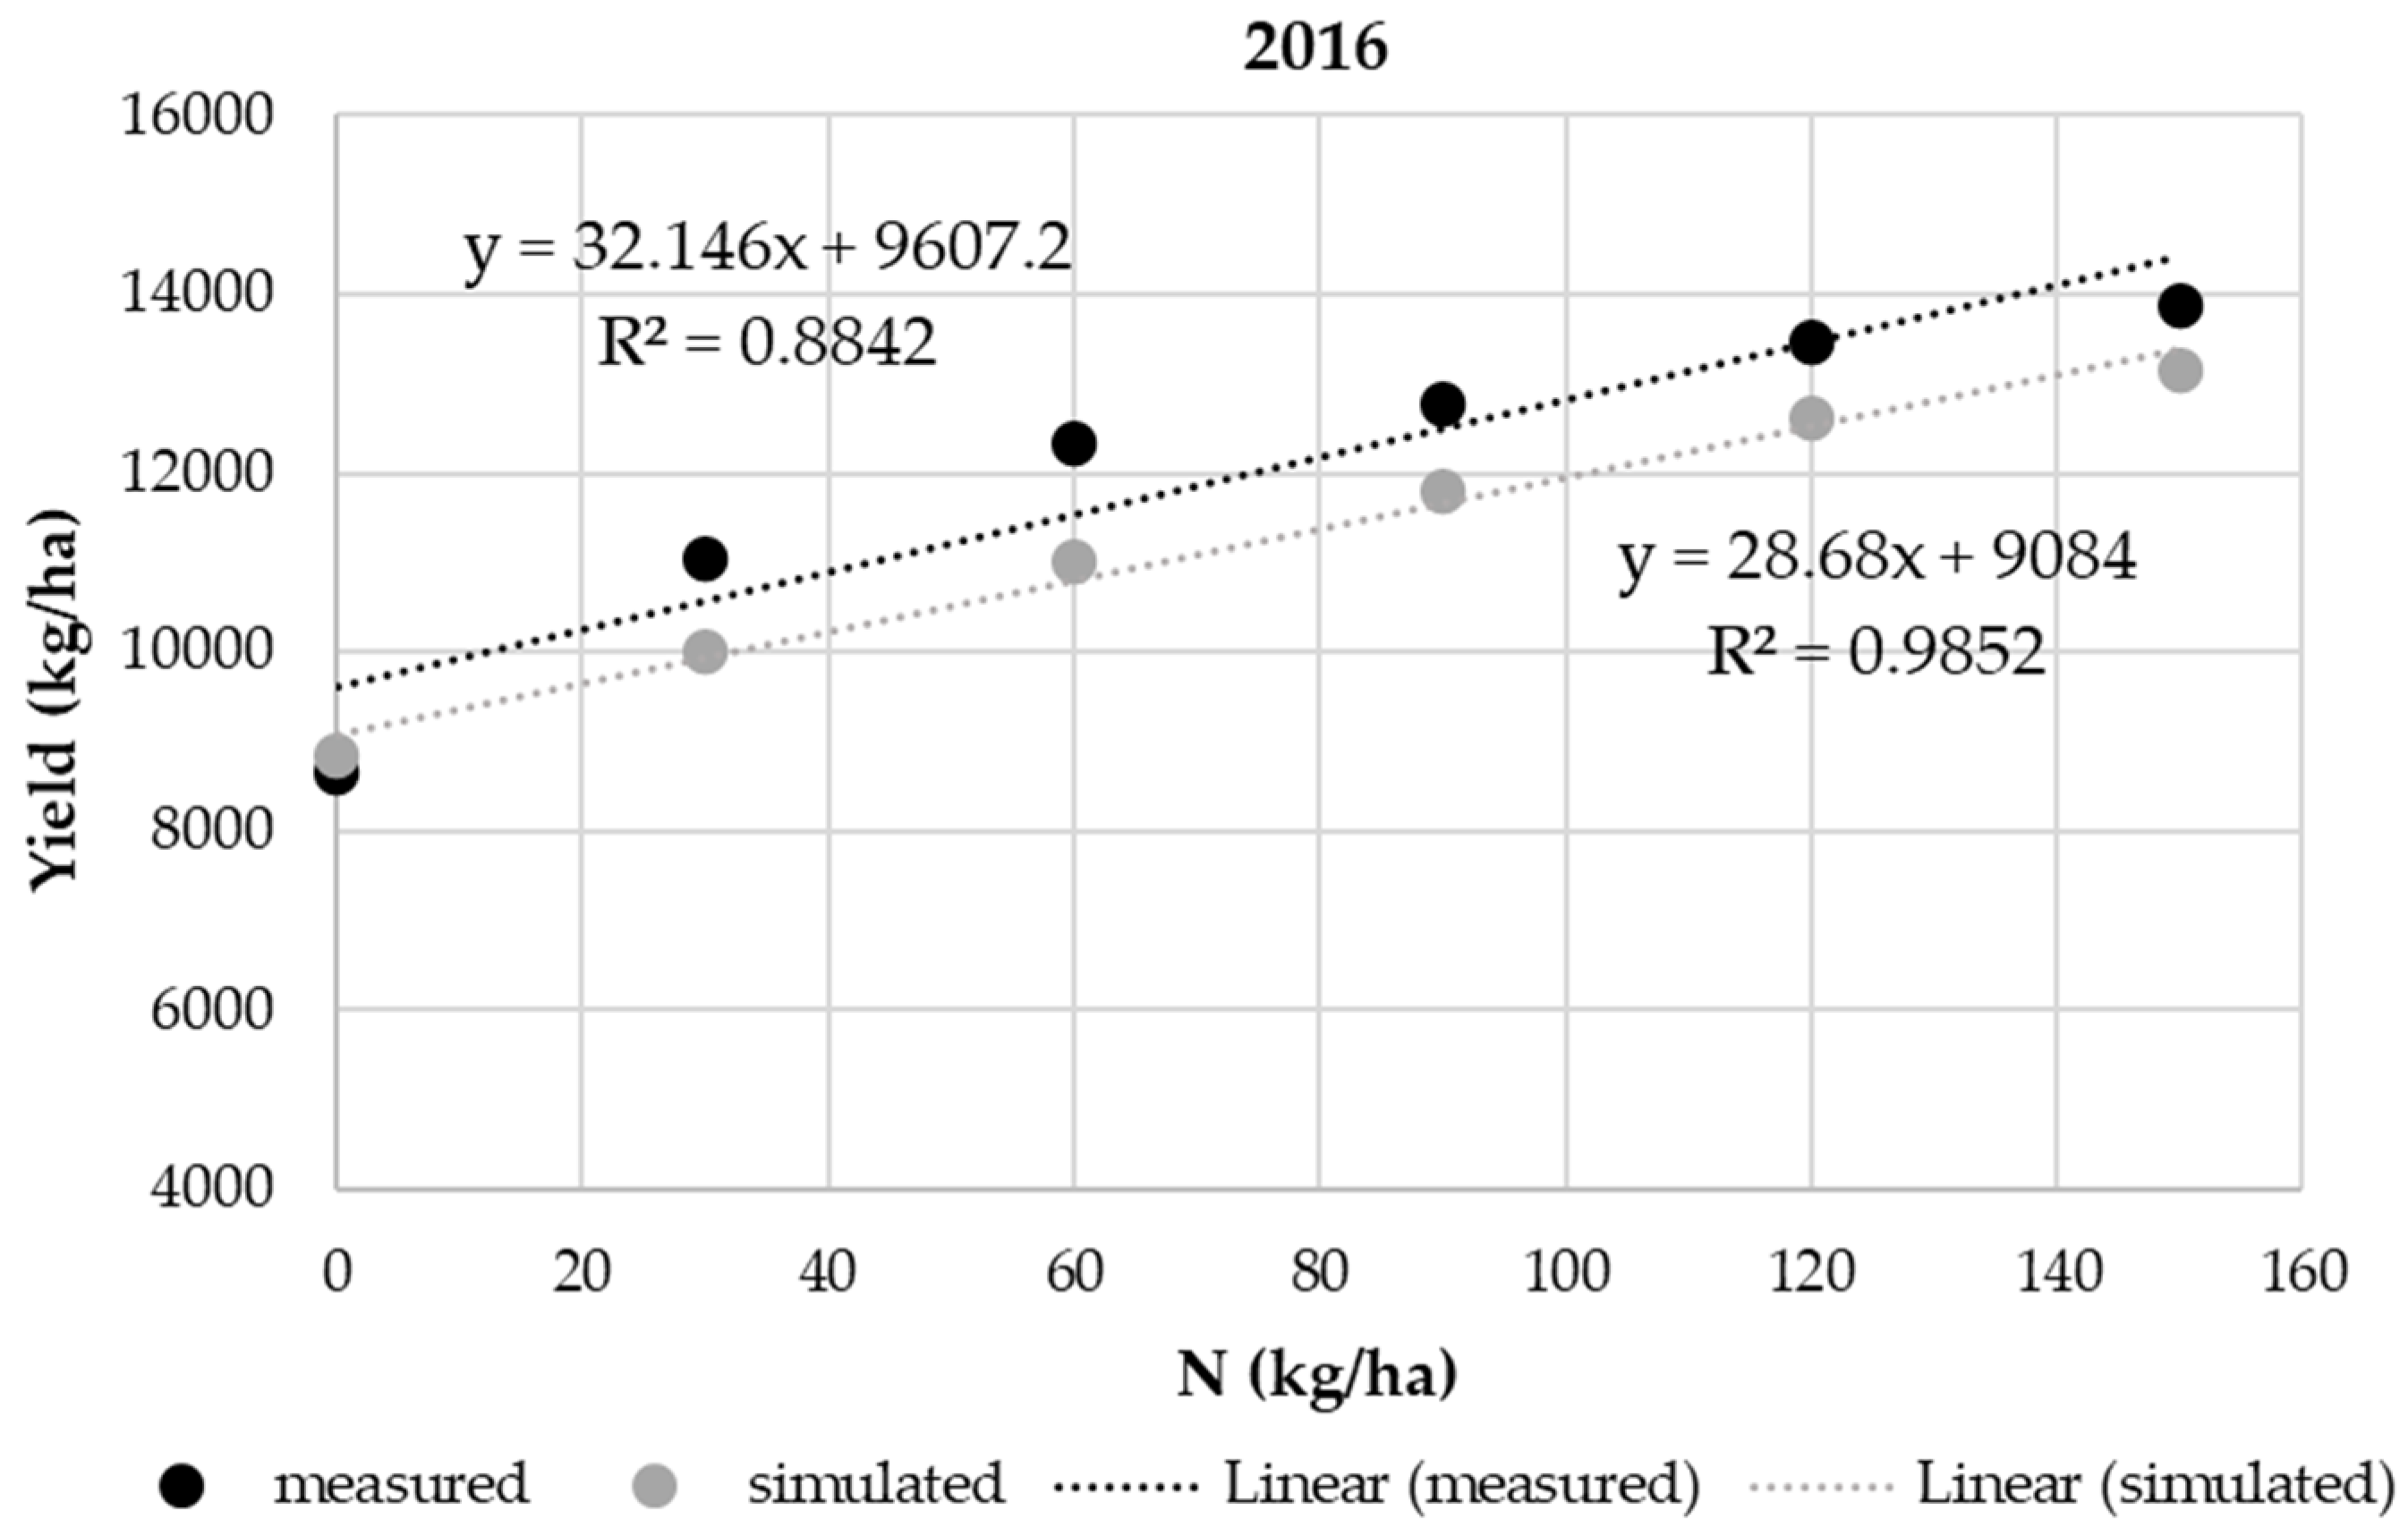
| 2016 | 0 | 8657 | 8838 |
| 30 | 11,036 | 10,010 | |
| 60 | 12,318 | 11,010 | |
| 90 | 12,773 | 11,792 | |
| 120 | 13,467 | 12,624 | |
| 150 | 13,858 | 13,136 | |
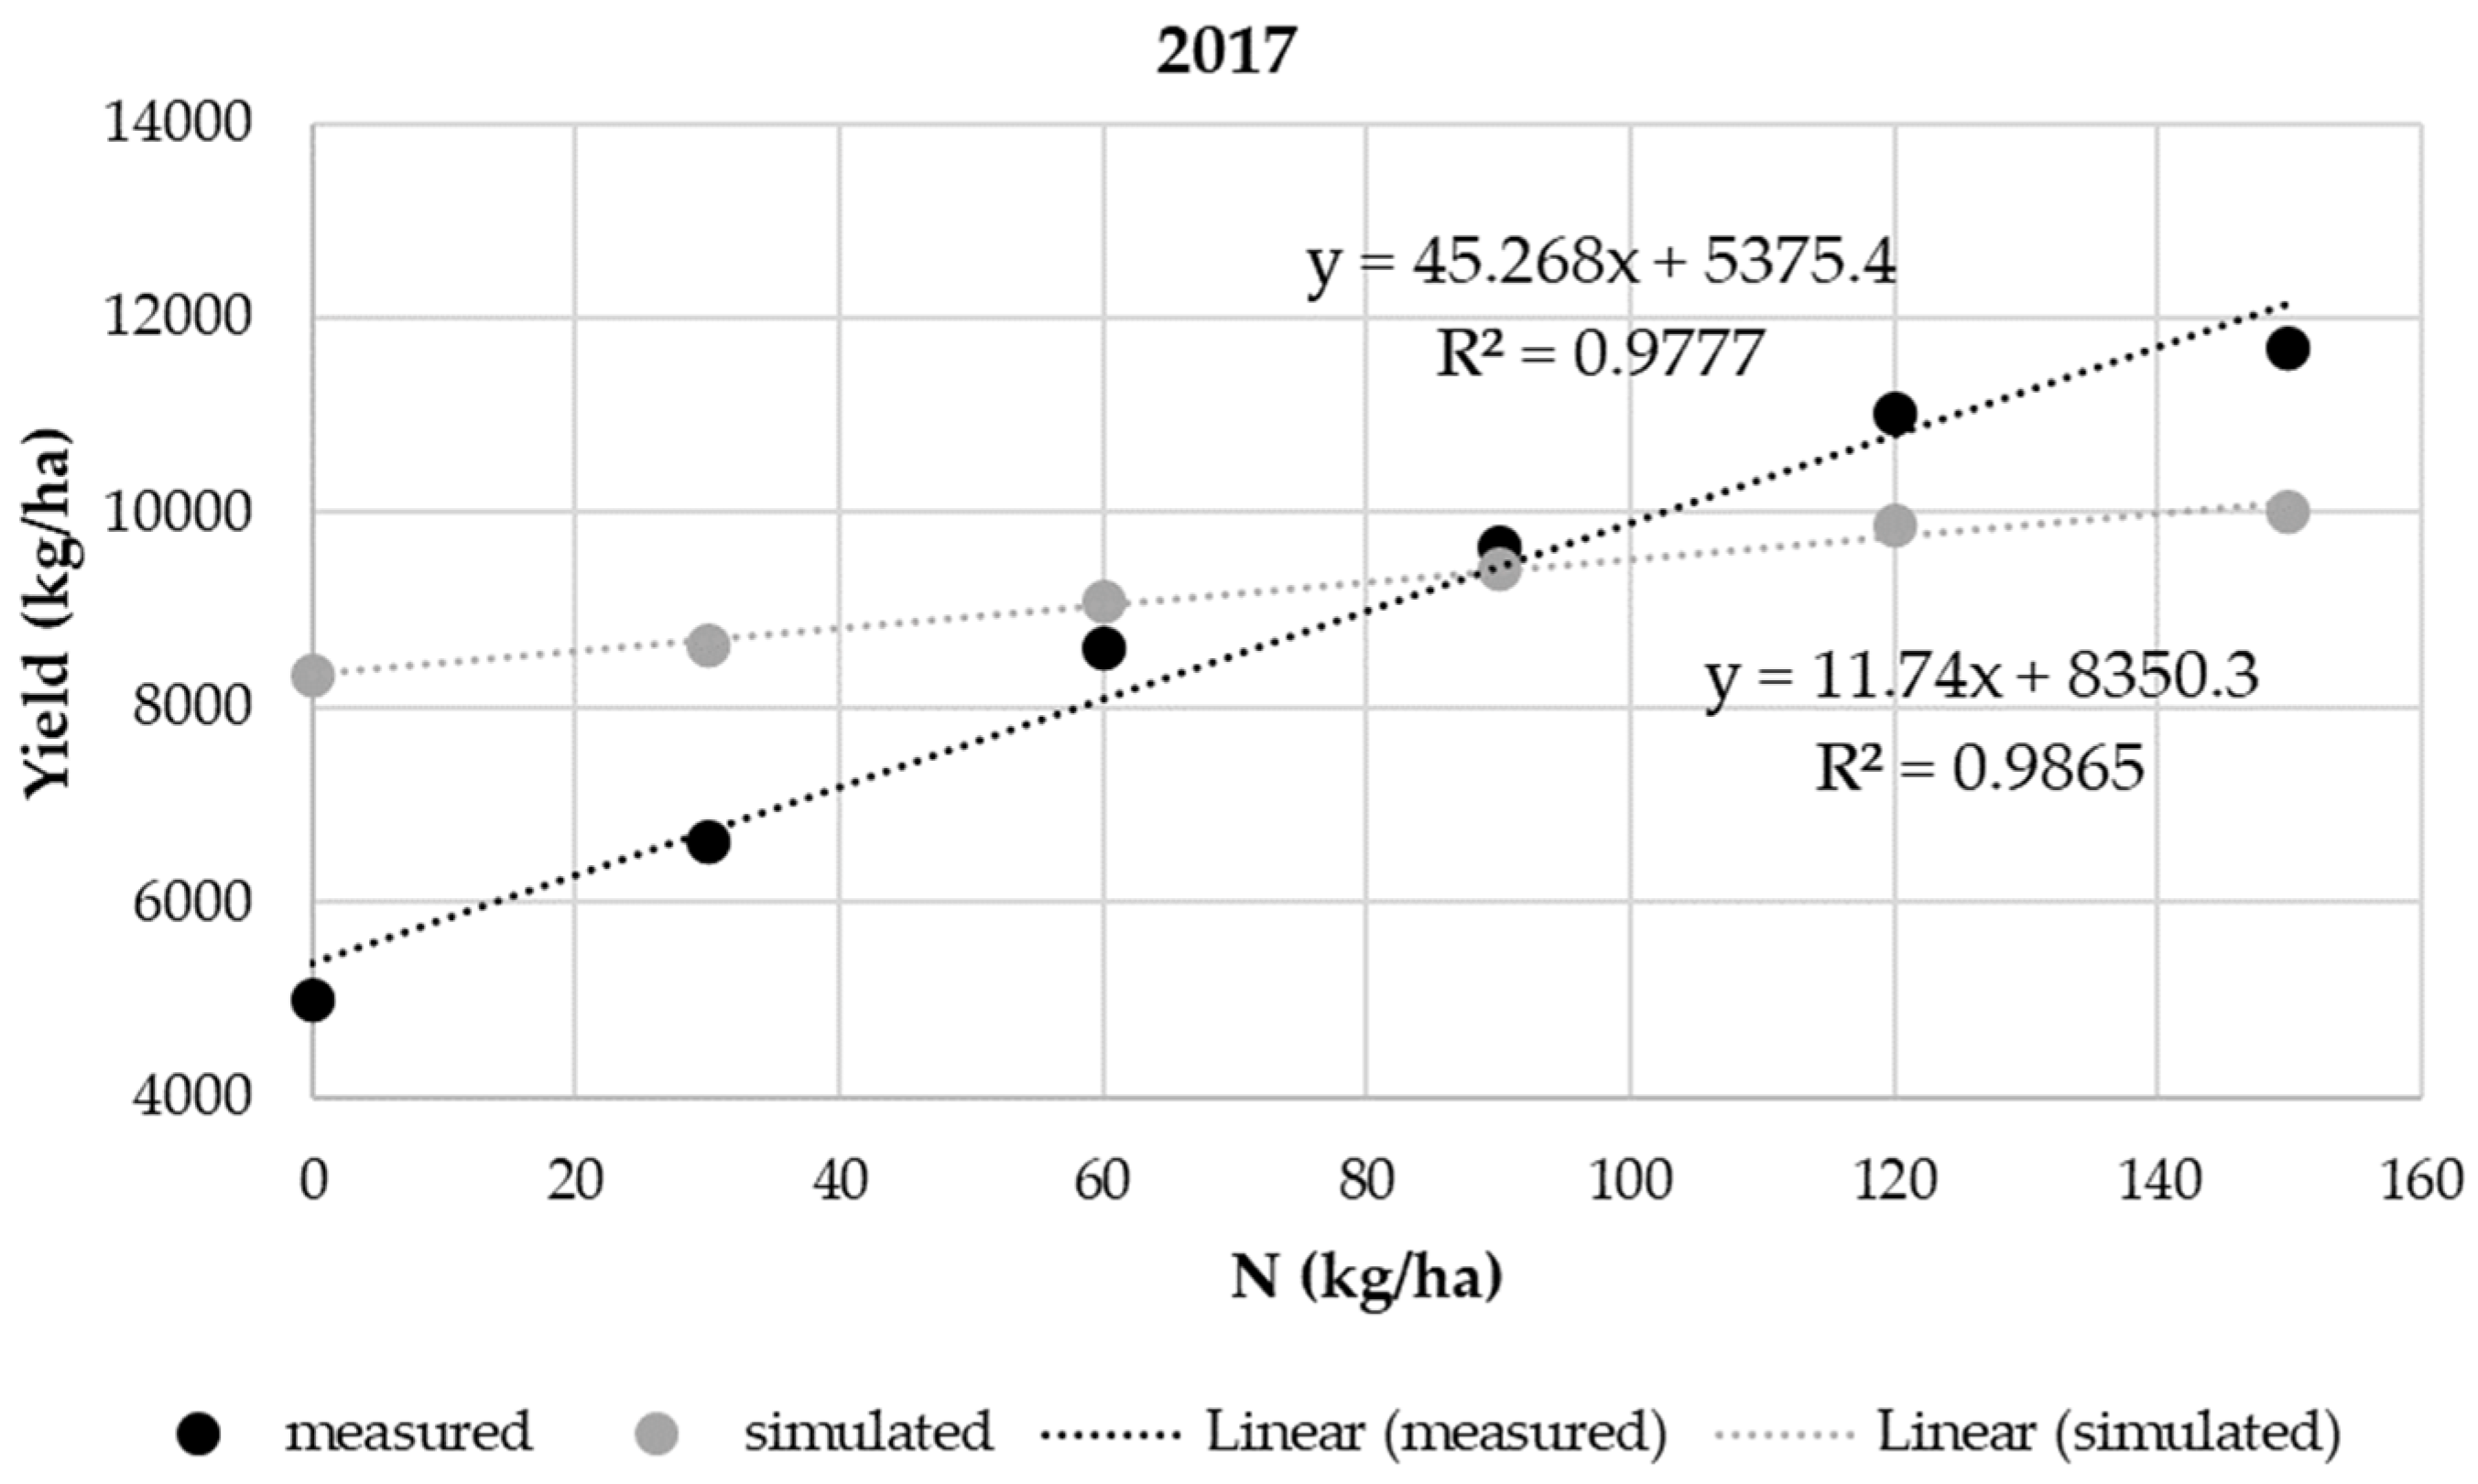
| 2017 | 0 | 5016 | 8344 |
| 30 | 6629 | 8638 | |
| 60 | 8627 | 9095 | |
| 90 | 9652 | 9438 | |
| 120 | 11,011 | 9866 | |
| 150 | 11,688 | 10,004 | |
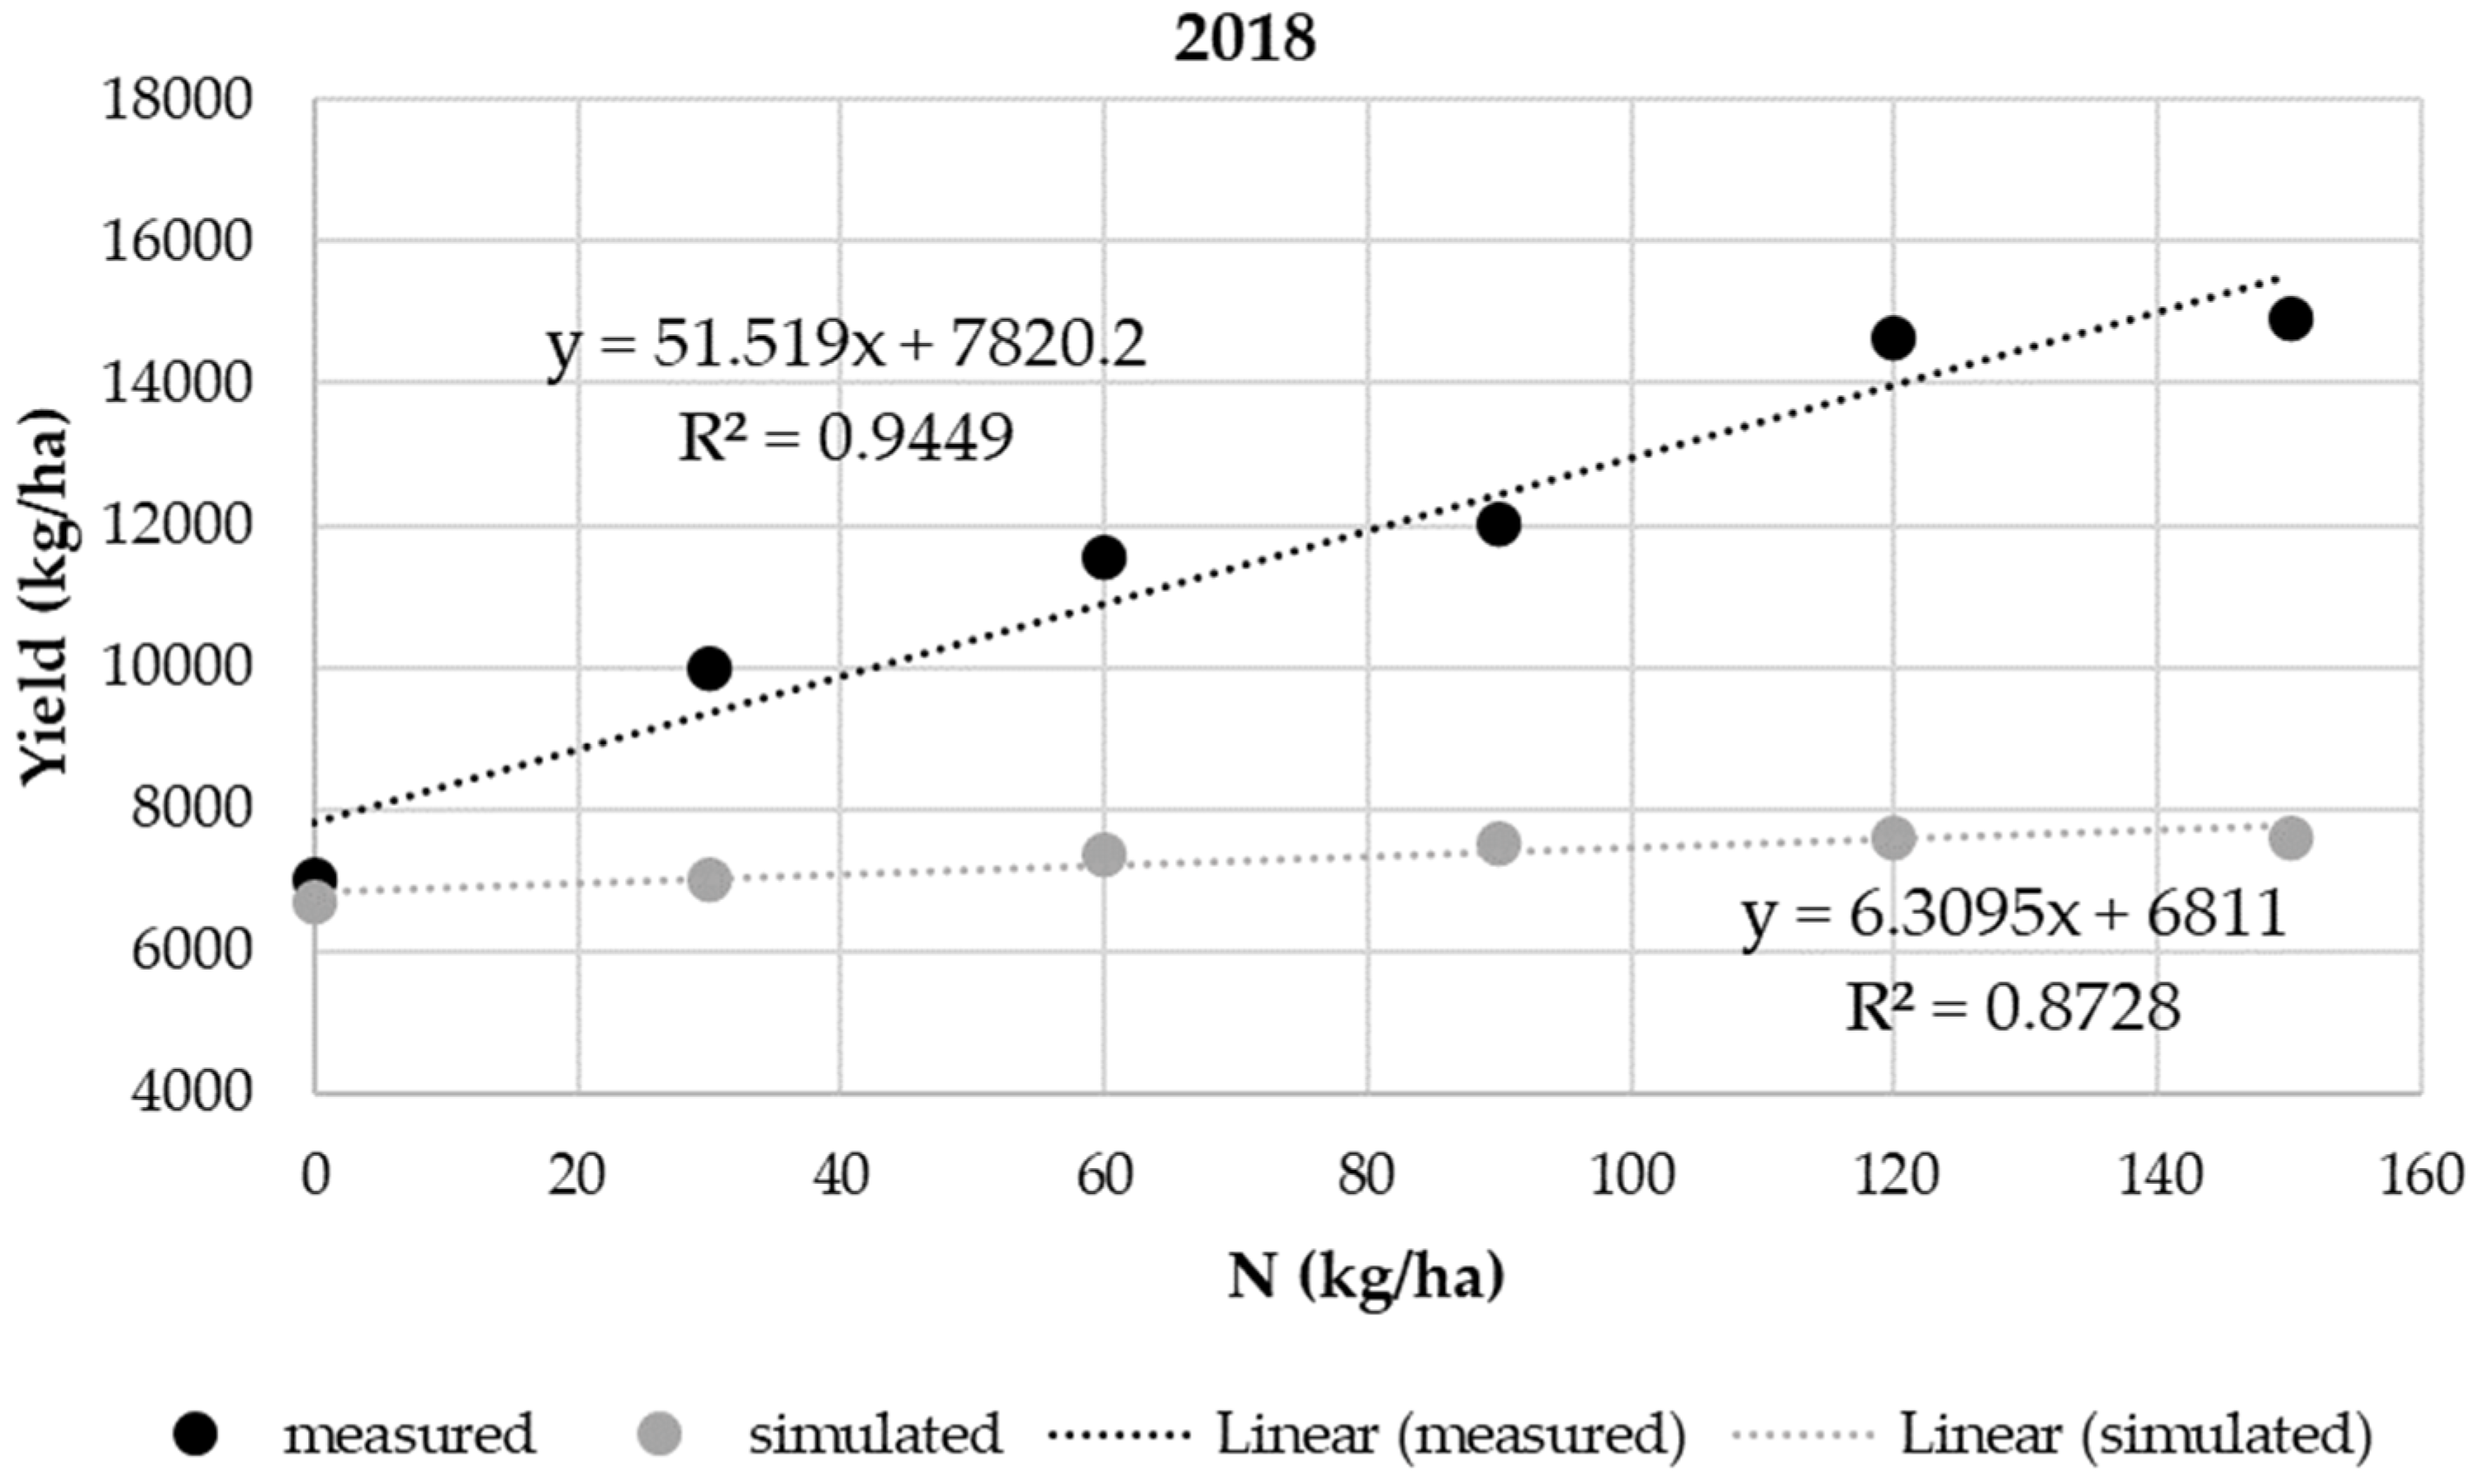
| 2018 | 0 | 6995 | 6671 |
| 30 | 9980 | 6984 | |
| 60 | 11,540 | 7338 | |
| 90 | 12,030 | 7525 | |
| 120 | 14,640 | 7595 | |
| 150 | 14,920 | 7592 | |
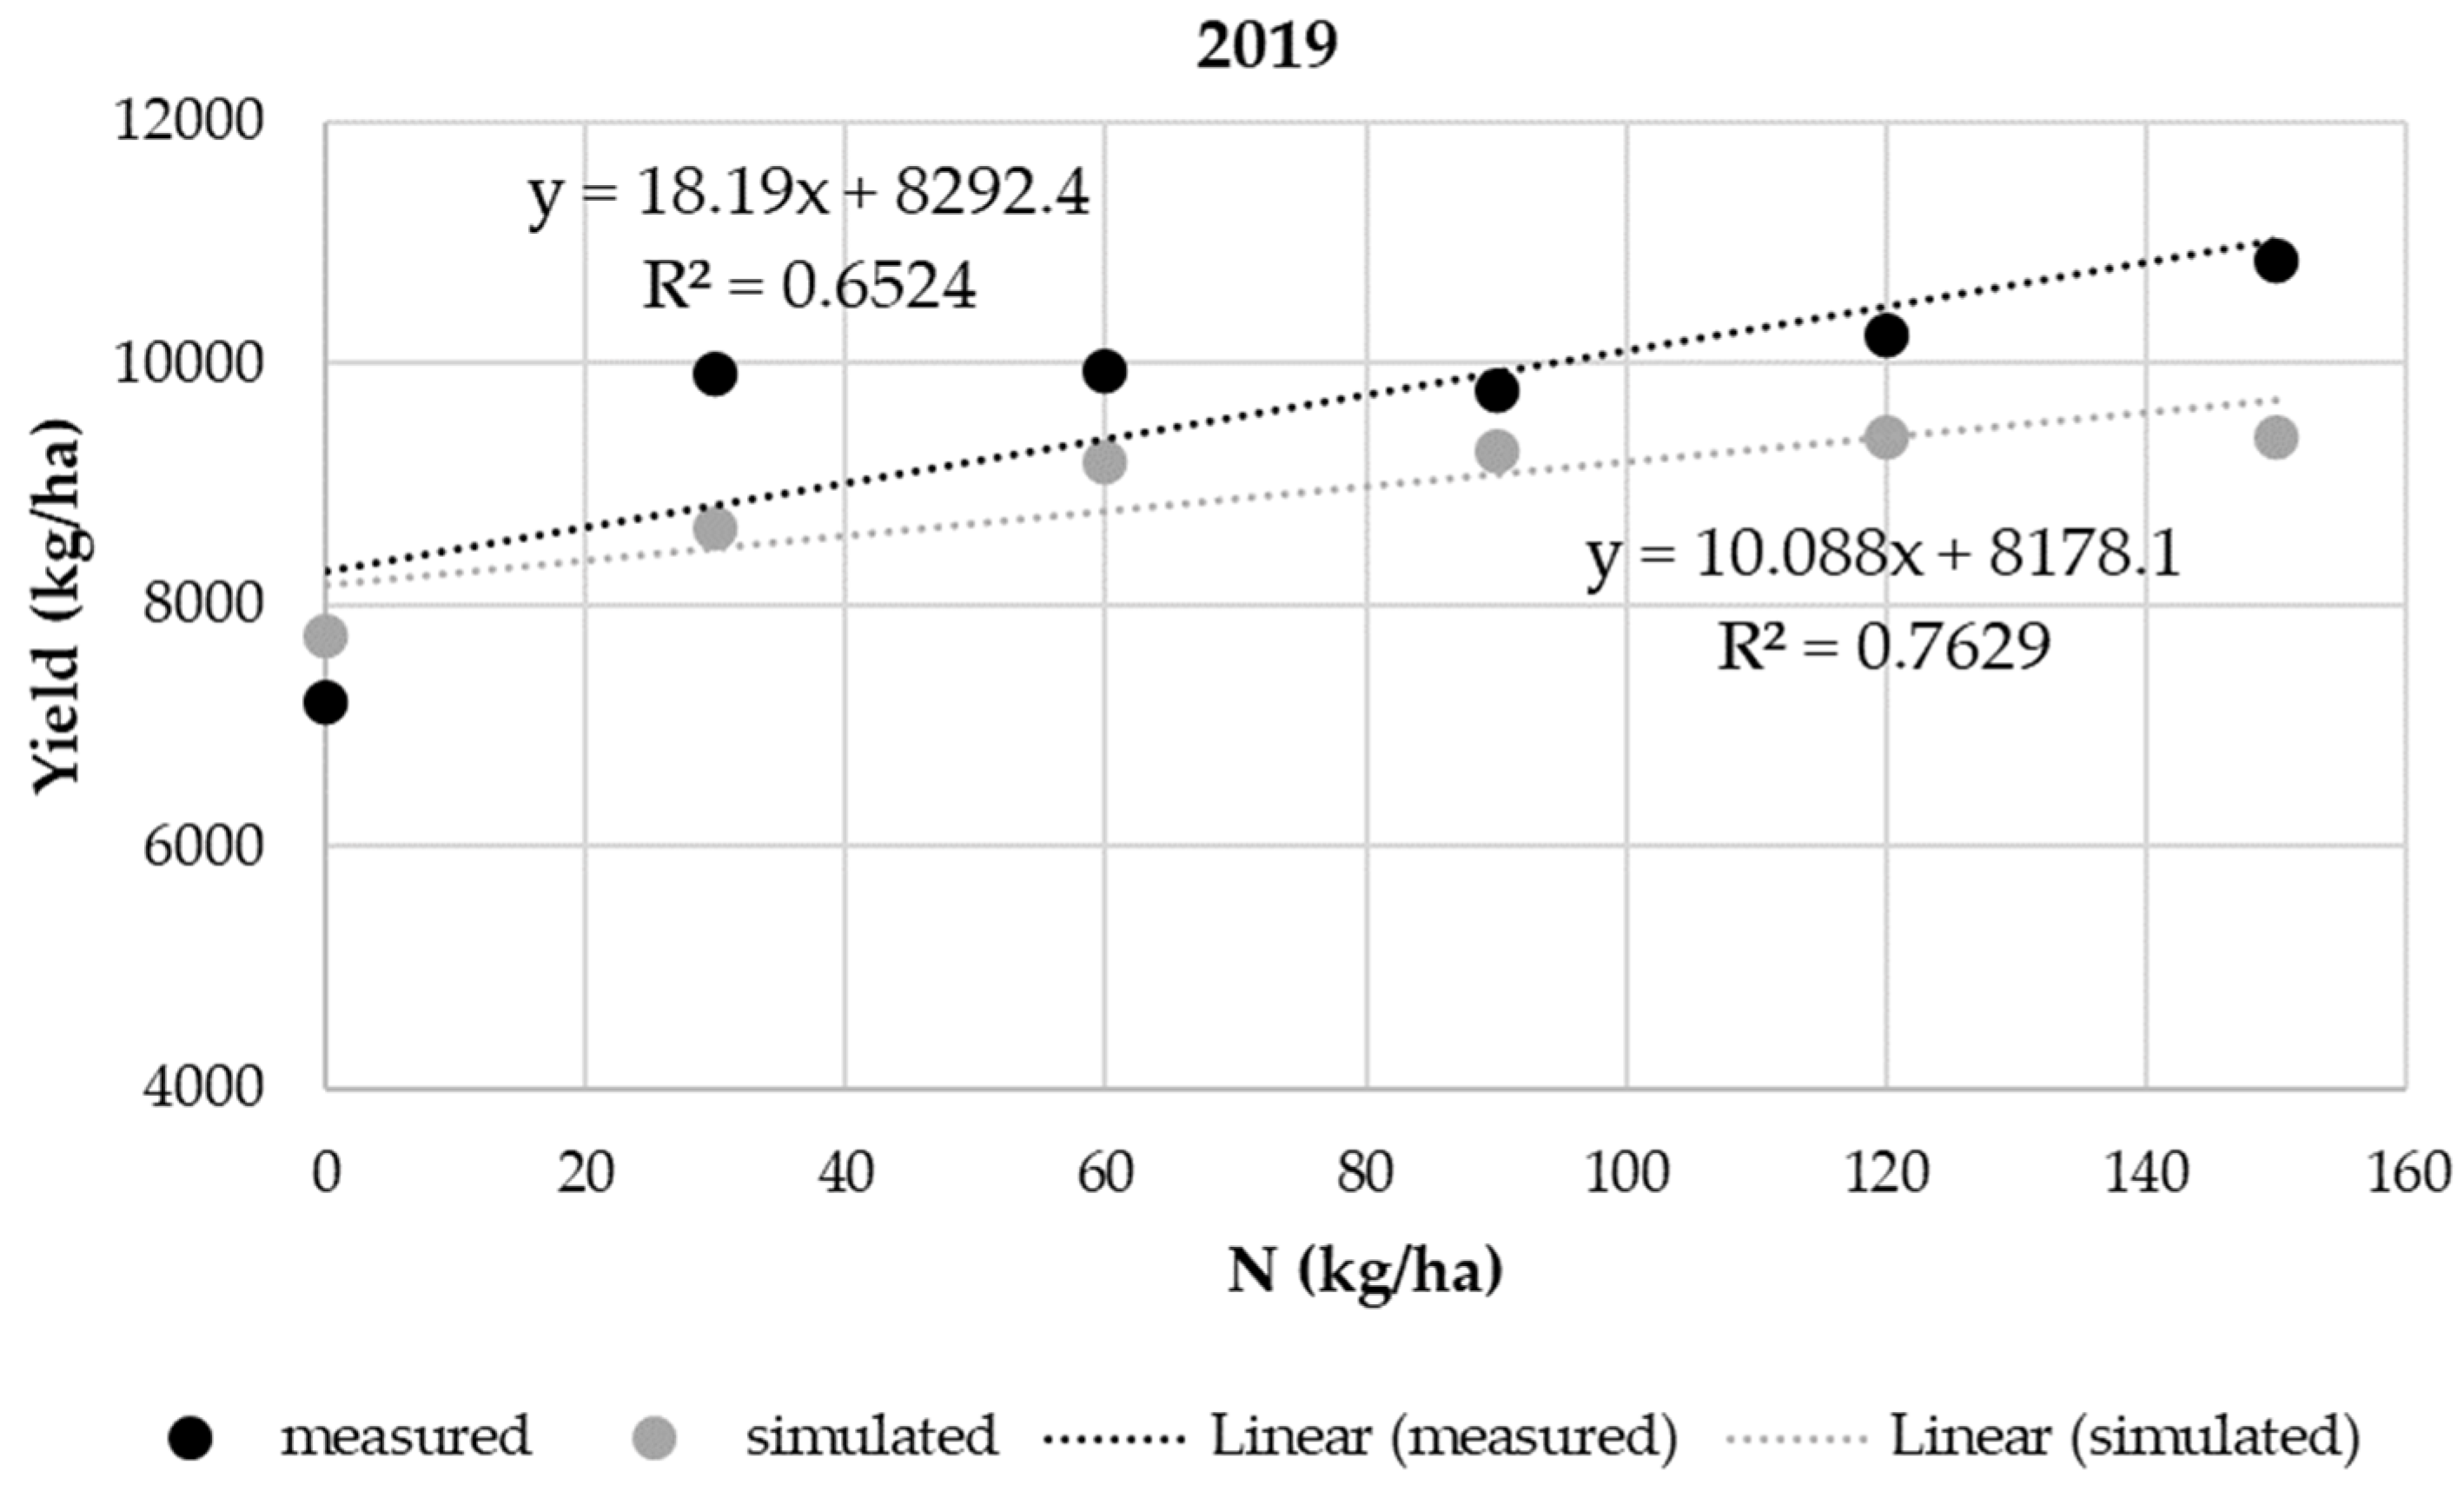
| 2019 | 0 | 7200 | 7740 |
| 30 | 9920 | 8639 | |
| 60 | 9940 | 9181 | |
| 90 | 9780 | 9269 | |
| 120 | 10,240 | 9387 | |
| 150 | 10,860 | 9392 | |
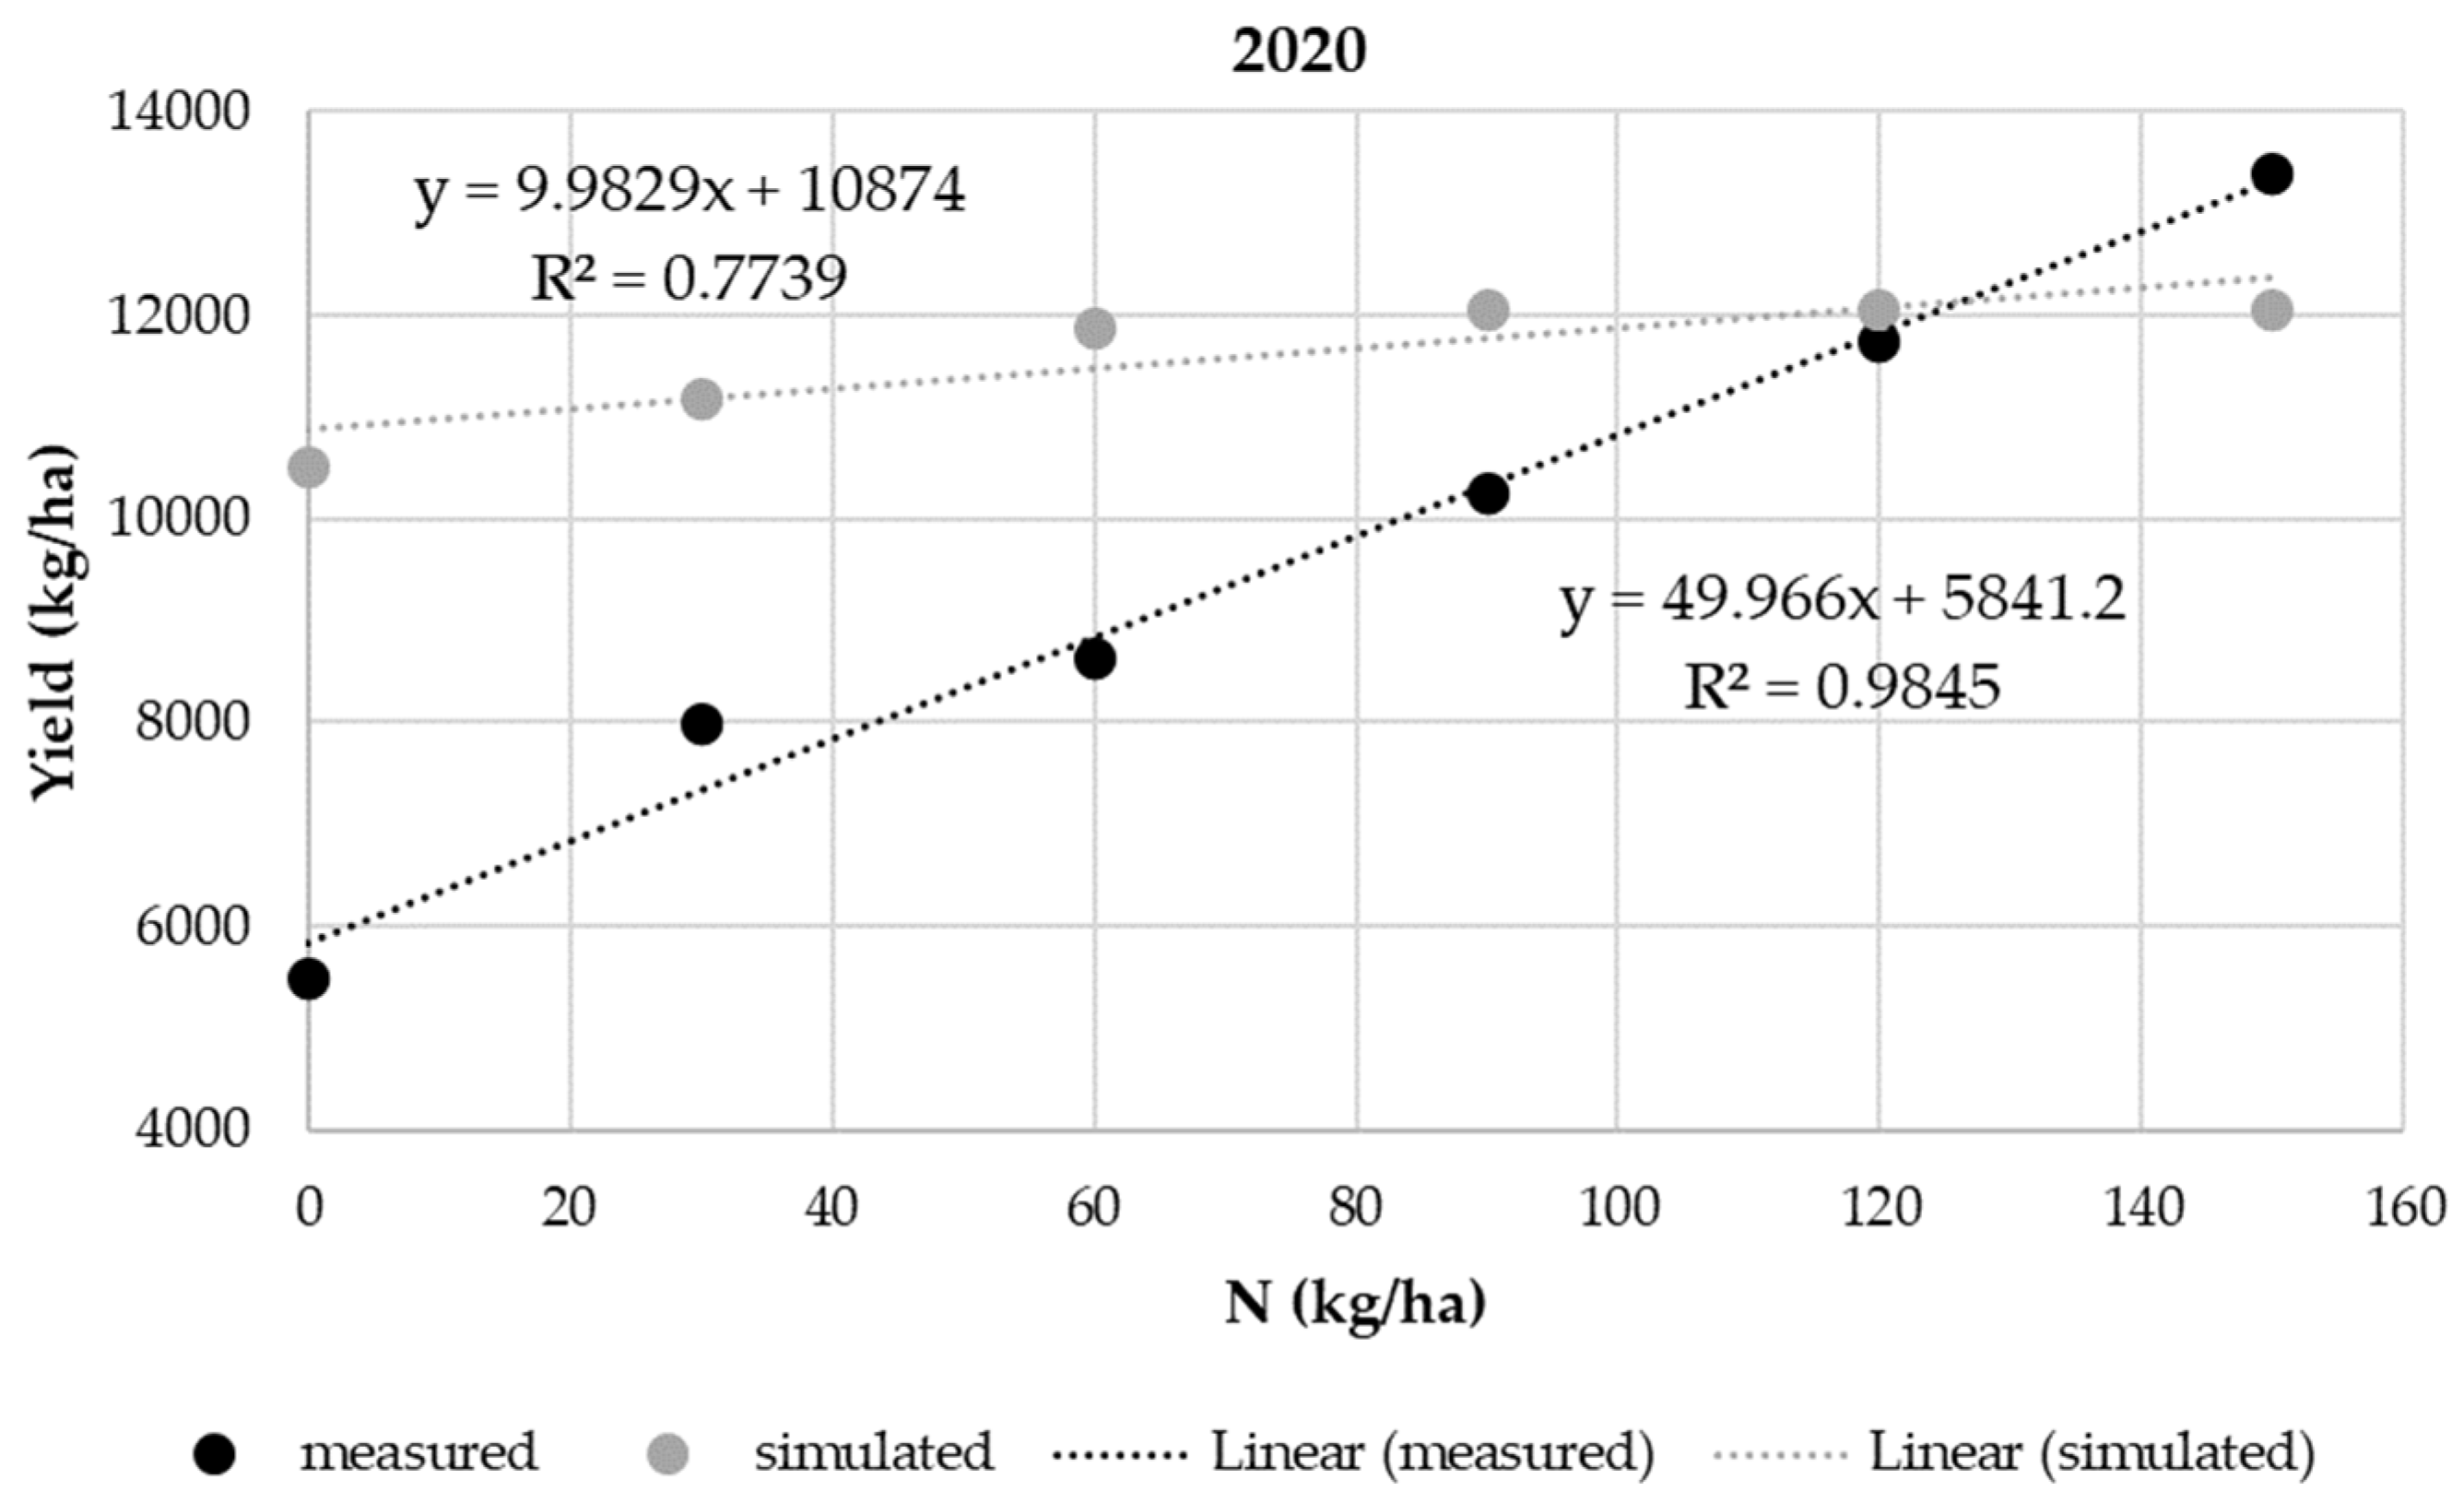
| 2020 | 0 | 5488 | 10,520 |
| 30 | 7999 | 11,186 | |
| 60 | 8629 | 11,864 | |
| 90 | 10,259 | 12,056 | |
| 120 | 11,757 | 12,056 | |
| 150 | 13,400 | 12,056 | |
| Source | DF | Adj SS | Adj MS | F-Value | p-Value |
|---|---|---|---|---|---|
| year | 4 | 57283327 | 14320832 | 5.78 | 0.001 |
| N | 5 | 114917792 | 22983558 | 9.28 | <0.001 |
| type | 1 | 2040570 | 2040570 | 0.82 | 0.396 |
| Error | 49 | 121361829 | 2476772 | ||
| Total | 59 | 295603519 |
| Year | N | Mean | Grouping | |
|---|---|---|---|---|
| 2016 | 12 | 11,626.6 | A | |
| 2020 | 12 | 10,605.8 | A | B |
| 2018 | 12 | 9484.2 | B | |
| 2019 | 12 | 9295.7 | B | |
| 2017 | 12 | 9000.7 | B | |
| N | N | Mean | Grouping | ||
|---|---|---|---|---|---|
| 150 | 10 | 11,690.6 | A | ||
| 120 | 10 | 11,264.3 | A | ||
| 90 | 10 | 10,457.4 | A | B | |
| 60 | 10 | 9954.2 | A | B | |
| 30 | 10 | 9102.0 | B | C | |
| 0 | 10 | 7546.9 | C | ||
| Type | N | Mean | Grouping |
|---|---|---|---|
| M | 30 | 10,187.0 | A |
| S | 30 | 9818.2 | A |
| Year | Source | DF | Adj SS | Adj MS | F-Value | p-Value |
|---|---|---|---|---|---|---|
| 2016 | N | 5 | 30900853 | 6180171 | 47.16 | <0.001 |
| type | 1 | 1840050 | 1840050 | 14.04 | 0.013 | |
| Error | 5 | 655247 | 131049 | |||
| Total | 11 | 33396151 | ||||
| 2017 | N | 5 | 26086128 | 5217226 | 2.86 | 0.137 |
| type | 1 | 635720 | 635720 | 0.35 | 0.581 | |
| Error | 5 | 9125963 | 1825193 | |||
| Total | 11 | 35847811 | ||||
| 2018 | N | 5 | 27856557 | 5571311 | 1.63 | 0.303 |
| type | 1 | 58080000 | 58080000 | 16.98 | 0.009 | |
| Error | 5 | 17102215 | 3420443 | |||
| Total | 11 | 103038772 | ||||
| 2019 | N | 5 | 8826853 | 1765371 | 6.99 | 0.026 |
| type | 1 | 1563852 | 1563852 | 6.19 | 0.055 | |
| Error | 5 | 1262346 | 252469 | |||
| Total | 11 | 11653051 | ||||
| 2020 | N | 5 | 28850326 | 5770065 | 2.20 | 0.204 |
| type | 1 | 12415536 | 12415536 | 4.73 | 0.082 | |
| Error | 5 | 13118546 | 2623709 | |||
| Total | 11 | 54384408 |
| Year | Type | N | Mean | Grouping | |
|---|---|---|---|---|---|
| 2016 | S | 6 | 12,018.2 | A | |
| M | 6 | 11,235.0 | B | ||
| 2017 | S | 6 | 9230.83 | A | |
| M | 6 | 8770.50 | A | ||
| 2018 | M | 6 | 11,684.2 | A | |
| S | 6 | 7284.2 | B | ||
| 2019 | M | 6 | 9656.67 | A | |
| S | 6 | 8934.67 | A | ||
| 2020 | S | 6 | 11,623.0 | A | |
| M | 6 | 9588.7 | A | ||
Publisher’s Note: MDPI stays neutral with regard to jurisdictional claims in published maps and institutional affiliations. |
© 2022 by the authors. Licensee MDPI, Basel, Switzerland. This article is an open access article distributed under the terms and conditions of the Creative Commons Attribution (CC BY) license (https://creativecommons.org/licenses/by/4.0/).
Share and Cite
Zelenák, A.; Szabó, A.; Nagy, J.; Nyéki, A. Using the CERES-Maize Model to Simulate Crop Yield in a Long-Term Field Experiment in Hungary. Agronomy 2022, 12, 785. https://doi.org/10.3390/agronomy12040785
Zelenák A, Szabó A, Nagy J, Nyéki A. Using the CERES-Maize Model to Simulate Crop Yield in a Long-Term Field Experiment in Hungary. Agronomy. 2022; 12(4):785. https://doi.org/10.3390/agronomy12040785
Chicago/Turabian StyleZelenák, Annabella, Atala Szabó, János Nagy, and Anikó Nyéki. 2022. "Using the CERES-Maize Model to Simulate Crop Yield in a Long-Term Field Experiment in Hungary" Agronomy 12, no. 4: 785. https://doi.org/10.3390/agronomy12040785
APA StyleZelenák, A., Szabó, A., Nagy, J., & Nyéki, A. (2022). Using the CERES-Maize Model to Simulate Crop Yield in a Long-Term Field Experiment in Hungary. Agronomy, 12(4), 785. https://doi.org/10.3390/agronomy12040785