Article

Mechanical Pruning of ‘Clemenules’ Mandarins in Spain: Yield Effects and Economic Analysis

1
Centro de Agroingeniería, Instituto Valenciano de Investigaciones Agrarias (IVIA), CV-315, Km 10.7, Moncada, 46113 Valencia, Spain
2
Departamento de Ingeniería Rural y Agroalimentaria, Universitat Politècnica de València, Camino de Vera s/n, 46022 Valencia, Spain
*
Author to whom correspondence should be addressed.
Agronomy 2022, 12(4), 761; https://doi.org/10.3390/agronomy12040761
Submission received: 28 February 2022 / Revised: 14 March 2022 / Accepted: 17 March 2022 / Published: 22 March 2022
(This article belongs to the Section Agricultural Biosystem and Biological Engineering)

Abstract

:
Pruning is one of the most expensive tasks in citrus production, and its mechanization could increase the productivity and competitiveness of citrus farms. The effect of mechanical pruning on yield depends on the variety, crop condition, and location; among other factors. The ‘Clemenules’ mandarin variety is one of the most important ones; therefore, the aim of this work was to study the effects of twelve pruning strategies on ‘Clemenules’ yield over four years, and to conduct an economic analysis. These strategies included fully manual pruning, annual alternation of mechanical/manual pruning, mechanical pruning with manual follow-up, and fully mechanical pruning with different types of cuttings. The results showed that pruning strategies affected the yield and fruit size in some years of the study but not when the four years overall are considered. Strategies that annually alternated mechanical pruning with manual pruning had higher yields than the fully mechanical approaches, and similar yields to the manual and control (no pruning) strategies. Furthermore, although the mechanical pruning costs per hectare were as minimum two times less than those with manual pruning, higher net value was achieved with the manual pruning approach followed by alternate annual mechanical/manual pruning. In conclusion, after four years of study, the pruning strategy with the best global results for ‘Clemenules’ mandarin was that which involved annually alternating mechanical (topping and one-sided hedging) and manual pruning. This strategy allows maintaining regular tree dimensions without dry branches inside.

1. Introduction

Spain is the sixth largest world producer of citrus and the biggest exporter of citrus for fresh consumption. The Spanish citrus area takes up around 300,000 ha, with a production of 6.2 × 10⁶ t in 2019, and with 54% of this production being of oranges, 31% of mandarins, and 18% of lemons. With a production of 1.9 × 10⁶ t of mandarins (tangerines, clementines, and satsumas) in 2019, Spain is the world’s second highest producer, after China, and is followed by Turkey and Morocco [1].
In the last decades, the crop experienced important economic problems because fruit prices stalled or even decreased, while costs rose continuously [2,3]. A reduction in production costs is necessary to guarantee the profitability of farmers as well as to compete with other countries, where the production costs, mainly manpower costs, are lower because of the lower salaries [4,5].
A reduction in costs must be achieved to increase the competitiveness of citrus producers, and the mechanization of farming practices is a key factor [6]. The current level of mechanization on Spanish citrus orchards is lower than for other 3D crops such as olives, apples, grapes, etc. [7], mainly due to the focus being on marketing high-quality fresh products [8]. After harvesting, pruning is the second most expensive task in Spanish citrus production. Overall, manual pruning costs represent between 10% and 15% of the total costs of citrus production [9] and account for between 30% and 50% of the total labour costs [10,11]. Consequently, the mechanization of pruning is one of the most appropriate ways of reducing costs.
Pruning practices in citriculture are important in supporting plant health to reach an acceptable balance between vegetative and reproductive growth, which is a key factor in many stages of citrus crop development [12]; in fact, pruning can be used to control alternate-bearing behaviour in citrus, bearing itself, or even yield [13,14,15,16]. In addition, pruning removes unproductive and/or damaged branches, reduces excess fruit on the tree, and allows nutrients to be better distributed, thus leading to the obtaining of larger fruits. In general, the tree response to pruning depends on several factors, including variety, rootstock, tree age, growing conditions, time of pruning in the growing season, and production practices [17,18]. It also influences the microclimate around the trees, which can modify the productivity and quality of the fruit directly or indirectly; for example, facilitating or hindering the activity of pests and diseases, influencing the incidence of solar radiation, etc. [19,20].
Manual pruning in citrus in Spain is conducted mainly with hand scissors and saws; the use of power-assisted tools, such as electrical or air shears and chainsaws, is not widespread. Nevertheless, they are being introduced gradually, especially electrical tools. In contrast, in other countries, such as Italy, pneumatic systems are widely used for this operation [12]. The advantage of manual pruning is that the pruner can decide which branch to prune, and therefore, if this decision is based on knowledge of the crop, the pruning would be almost perfect. However, this method also has drawbacks; on the one hand it is slow and high costly, and on the other, there is a lack of specialized manpower comprising people who know how to prune properly.
Mechanical pruning is not selective and focuses on the periphery of the trees, in terms of height (topping), laterally (hedging), and with the low branches (skirting). However, these operations admit various intensities (reaching a greater or lesser depth), inclination angles, and dates of completion [21,22], which can influence the exposure of the internal parts of trees to the sun, induce the emission of new shoots that may be susceptible to pests or even frost, etc. [23,24].
From the 1950s when the first experiences with mechanical pruning in citrus were carried out in USA [25,26,27] until now, different studies in other citrus-growing areas have been conducted with controversial results regarding its effect on yield. Several researchers have not found differences in yield between manual and mechanical pruning but others have. However, all the studies where efficiency or economic implications were analysed agree with the higher productivity of the pruning operation.
In Spain, Ortiz-Cañavate [28] and Zaragoza and Alonso [29] observed that in ‘W. Navel’, there were no differences in yield between mechanical pruning and manual pruning or no pruning, while in ‘Salustiana’, mechanical pruning significantly reduced the yield compared to the other treatments.
Raciti et al. [30] observed in Italian conditions that for three years, in lemons var. ‘Feminello comune’, there were, on average, no differences in yield, although in the treatments with mechanical pruning, it was lower. In the case of oranges, var. ‘Tarocco’ and ‘Sanguinello’, severe mechanical pruning reduced yield with respect to no pruning and in mandarines var. ‘Avara’, no differences were noticed. They concluded that light mechanical pruning did not reduce yield in any species or variety.
Spina et al. [31] carried out an experiment in ‘Tarocco’ oranges over three years and no significant differences were found in yield, fruit size, and fruit qualitative characteristics between treatments. Manual pruning required 562 h∙ha−1 with traditional tools and 302 h∙ha−1 with pneumatic tools, compared to 5.4 h∙ha−1 in mechanical pruning.
Wheaton et al. [32] performed an experiment on cross hedging, tree removal, and topping that showed that annual topping to control tree height generally reduced fruit yield.
In California, Kallsen [33] observed that severe manual pruning in ‘Frost Nucellar’ navel orange significantly reduced total yield and fancy fruit with respect to moderate pruning treatments or no pruning. Severe topping reduced total yield, although no significant differences were found between the intensity levels of topping treatments with respect to yield, number of fruits, and fruit size. Over the four years, the mechanically pruned trees produced as much or more fruits of the most valuable sizes than the severe or moderate manual treatments, with lower pruning costs.
Mendonça et al. [34] observed that after an initial year of severe topping pruning in ‘Ponkan’ tangerines adult trees in which topping reduced yields, in the following years, the plants recovered. In addition, the plants that were skirted presented higher yields than those that were not trimmed.
Yildirim et al. [35] obtained the highest production levels of grapefruits when using mechanical pruning treatments that combined topping and hedging, and the worst production was observed in those approaches that consisted only of topping.
Velázquez and Fernández [36] found that mechanical pruning with manual follow-up increased yields by 30 kg∙tree−1 as compared to manual pruning, but with similar costs, which meant an increase in profits. The productivity of the mechanical pruning systems ranged between 1.3 and 5.4 h∙ha−1, manual follow-up pruning required 66.6–80.5 h∙ha−1, and manual pruning needed 107.2 h∙ha−1; consequently, all systems involving mechanical pruning showed the ability to reduce the time needed to complete the task.
Martin-Gorriz et al. [22] found that the only treatment that significantly reduced yield compared to manual pruning was the one that applied continuous mechanical pruning during the three years and justified this drop with the fact that the pruning was carried out with the fruits already set, because it is a late harvesting variety. However, when mechanical and manual pruning were alternated in consecutive years, in the manual pruning year, the trees were able to recover from the loss of yield that corresponded to the year of mechanical pruning. Similar trials of mechanical pruning combined with manual pruning in ‘Fino’ lemons showed that the manual pruning was surpassed in yield by the treatment consisting in mechanical pruning all years (topping, skirting, and one-sided hedging) and by the treatment that annually alternated mechanical pruning (topping, skirting, and bilateral hedging) with manual pruning [10]. Both treatments, in addition to improving yield, substantially reduced costs and pruning time compared to the manual system. The treatments with mechanical pruning combined with manual follow-up pruning did not improve yields, nor did they substantially reduce execution costs.
Chueca et al. [11] carried out a similar trial with orange trees var. ‘Navel Foyos’, in which no significant differences in yield between the manual pruning and the four mechanical pruning treatments, alone and combined with manual follow-up, were found. However, all the treatments that included mechanical pruning were associated with substantially reduced costs, which decreased from 502.8 €∙ha−1 for the manual treatment to 70.4 €∙ha−1 in the mechanical pruning treatment that included bilateral skirting and topping and one-sided hedging.
In general, mechanical pruning reduces pruning costs and execution times, but its effects on production can be highly variable, depending on the species and varieties, as well as the type (hedging, topping, or skirting) and intensity of the pruning applied; for this reason, it is not feasible to obtain general formulas and it is instead necessary to experiment for each variety and cultivation system, since factors such as the vigour of the plant and the pruning calendar are also very important.
For these reasons, the objective of this work was to study the effects of different strategies of pruning, involving different combinations of mechanical and/or manual pruning, as well as annual alternations between manual and mechanical pruning, on the yield and the fruit size of ‘Clemenules’ mandarins (Citrus clementina Hort. ex Tan.) in the Mediterranean area, because there is a lack of experience in mechanical pruning for this variety, which is one of the most widespread in this area. Additionally, the working capacities and the economic costs of the different pruning strategies were studied.

2. Materials and Methods

2.1. Experimental Site and Vegetal Material

Trials were conducted in a commercial orchard of ‘Clemenules’ clementine mandarins (on Citrange Carrizo rootstock) (Revacitrus S.L.). It was located in Chiva (Valencia, eastern Spain) (geographic coordinates: 39°26′30″ N, 0°32′60″ W; altitude: 93 m above sea level). The trees were planted in 1998, in rows directed North–South with trapezoidal-shaped ridges of 0.57 m height. The orchard had a planting frame with 6 m row spacing and 3 m tree spacing (with a tree density of 556 trees∙ha−1).

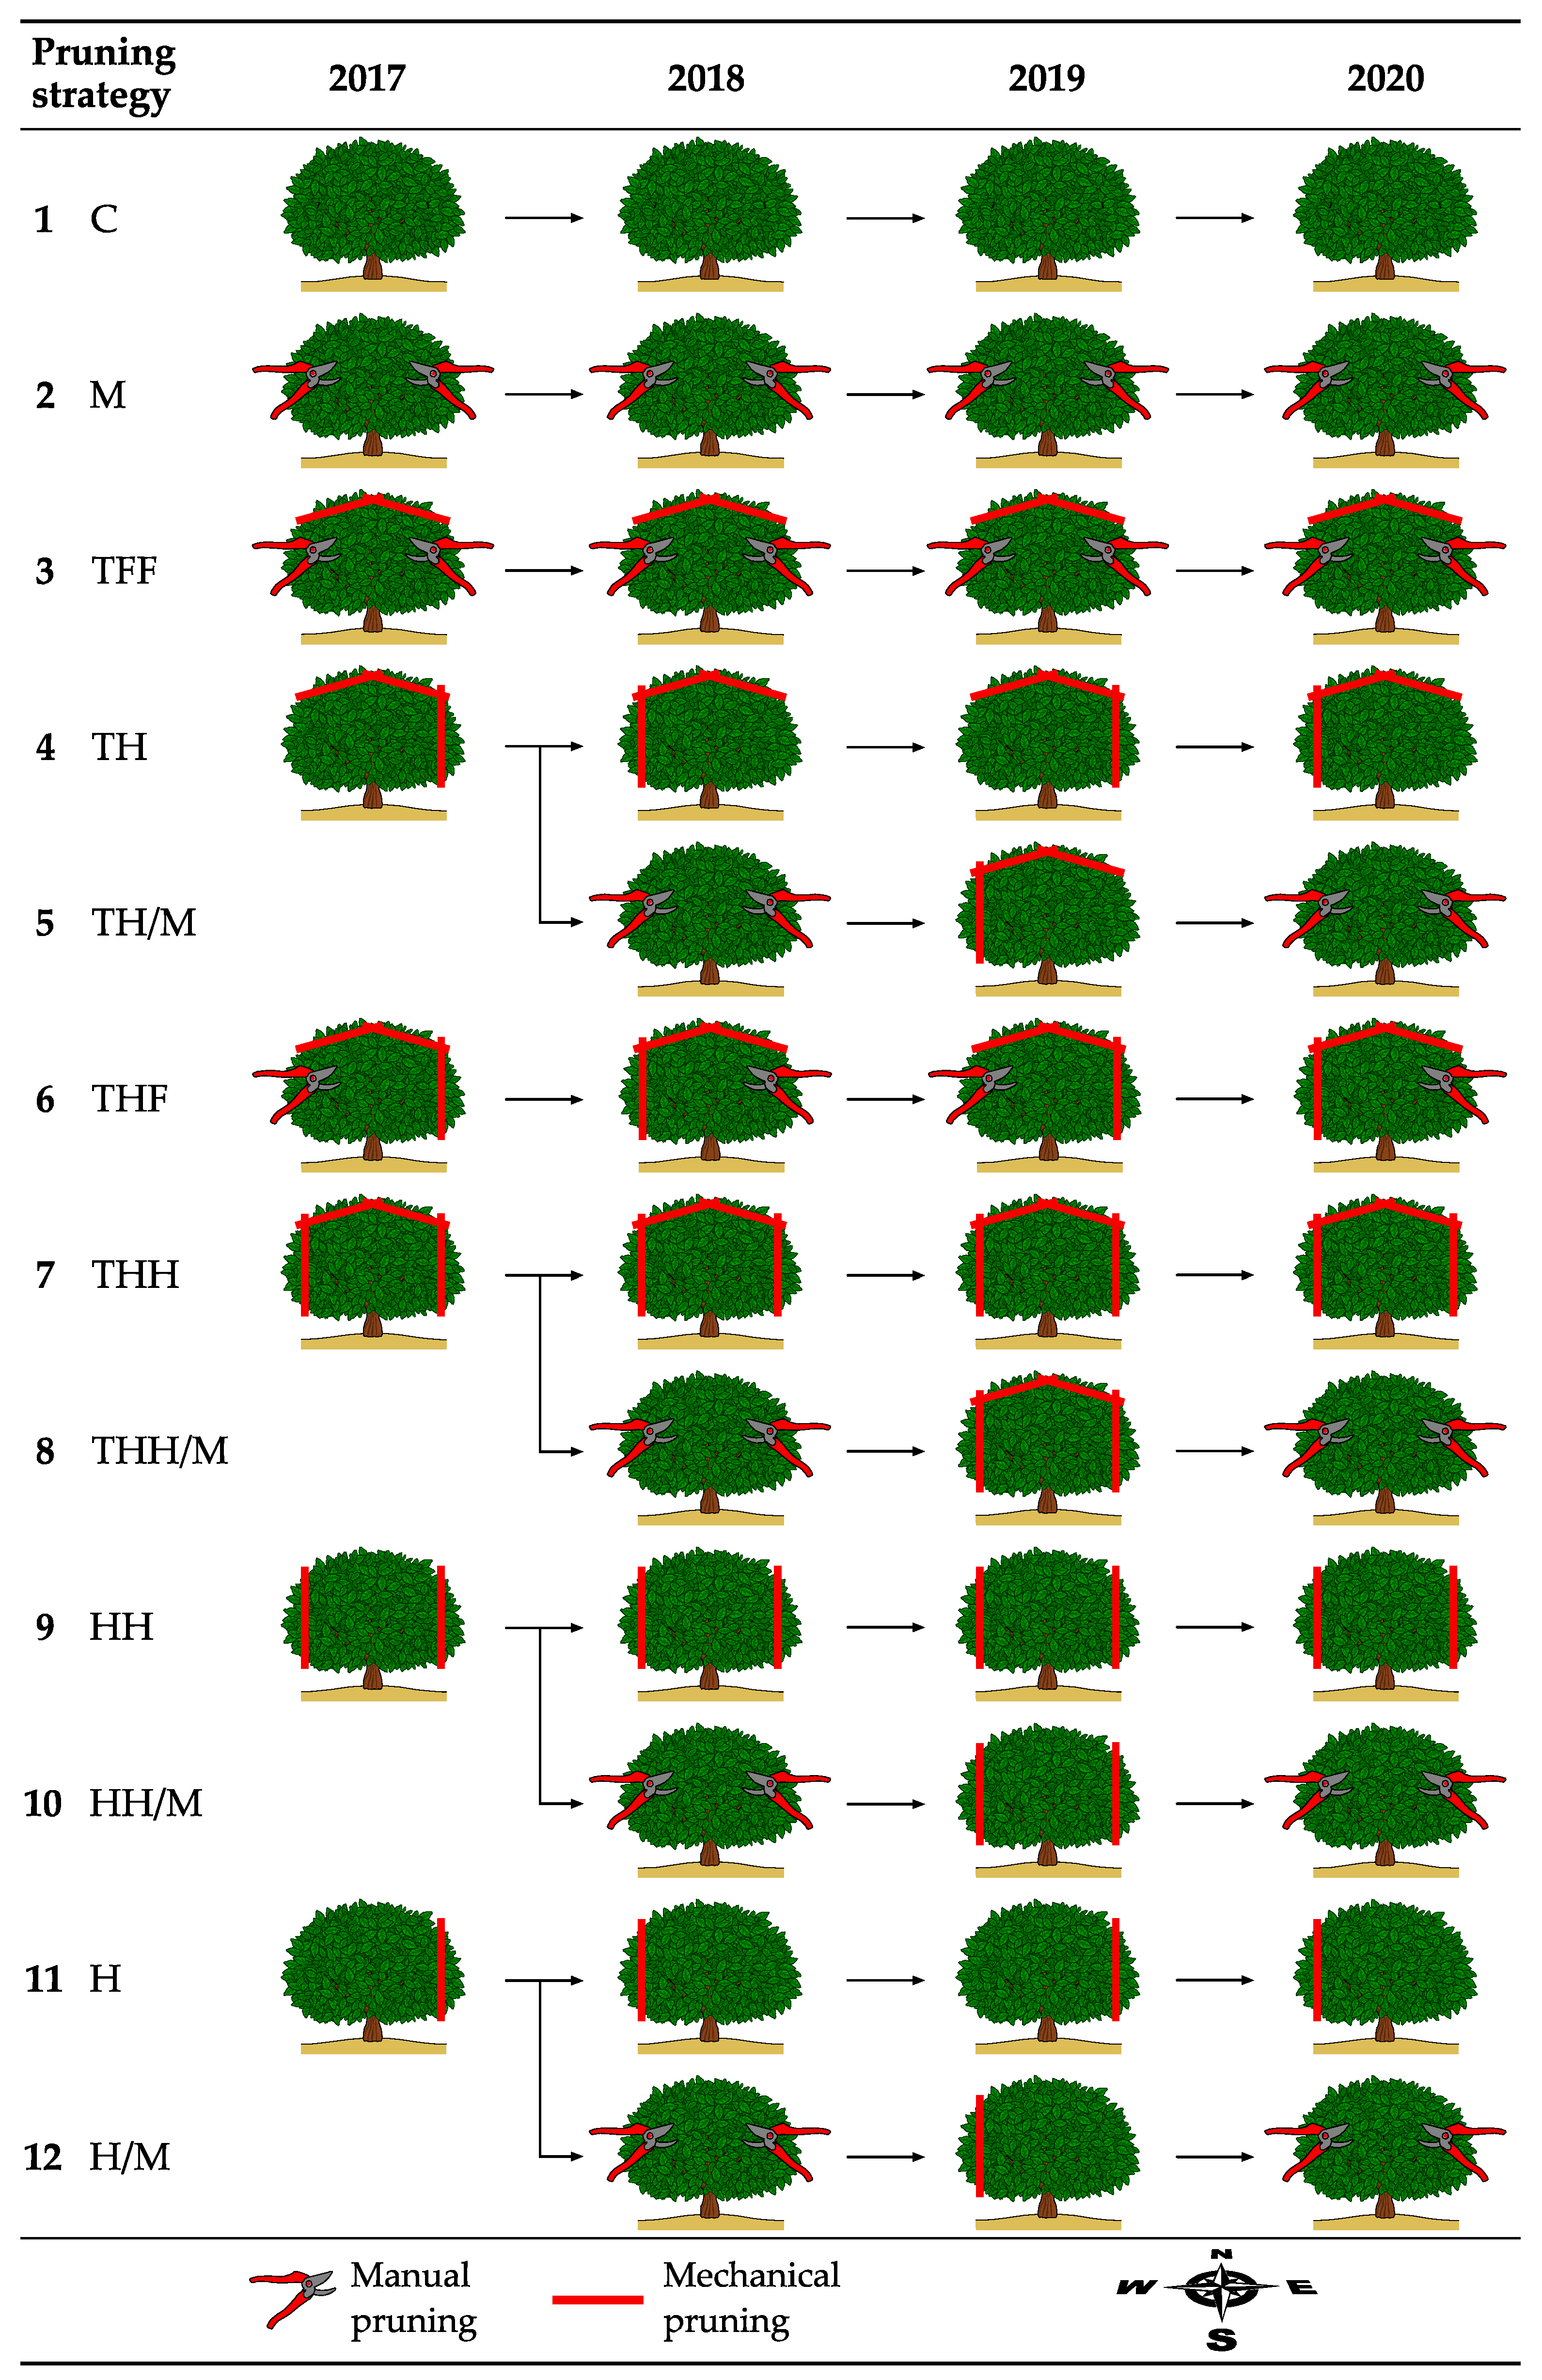
2.2. Experimental Design

A randomized block design with five repetitions was followed for four consecutive seasons, from 2017 to 2020. The study factor was the pruning strategy, with twelve levels that are defined in Table 1 and shown in Figure 1.
The response variables were the citrus production (yield and fruit size), the pruning working capacity, the economic costs of the pruning operations, and the economic profit (net value).
Manual pruning was carried out by specialized workers who decided the branches to cut and prune from the internal to the external part of the tree, removing dried branches and some main branches to open the trees. Mechanical pruning consisted of cutting the external branches and, depending on the strategy, included hedging and topping. Hedging consisted of a vertical cut of the corresponding side of the tree, depending on the strategy and year, with a vertical angle of 5° towards the upper part of the canopy. Topping was conducted with two oblique cuttings, with a horizontal angle between 5 and 15° for each side of the canopy (East and West).
The same strategy was applied to the same trees during the four years (Figure 1). All the trees in the experiment were subjected to the same fertilization, irrigation, and phytosanitary treatments.
In the second year of the experiment, strategies 4, 7, 9, and 11 were divided into strategies 5, 8, 10, and 12, respectively, of annual alternation between mechanical pruning and manual pruning (Figure 1). A minimum of 10 consecutive trees were used for each strategy and repetition, except for the control, in which each repetition consisted of five consecutive trees. All the evaluations were carried out in a representative tree that was randomly selected from the experimental unit (except the extreme trees) in each strategy and repetition, except in the control, in which the central tree was used for this purpose.
Dates of the pruning treatments and the BBCH (Biologische Bundesanstalt, Bundessortenamt and Chemical industry) citrus stage are shown in Table 2.

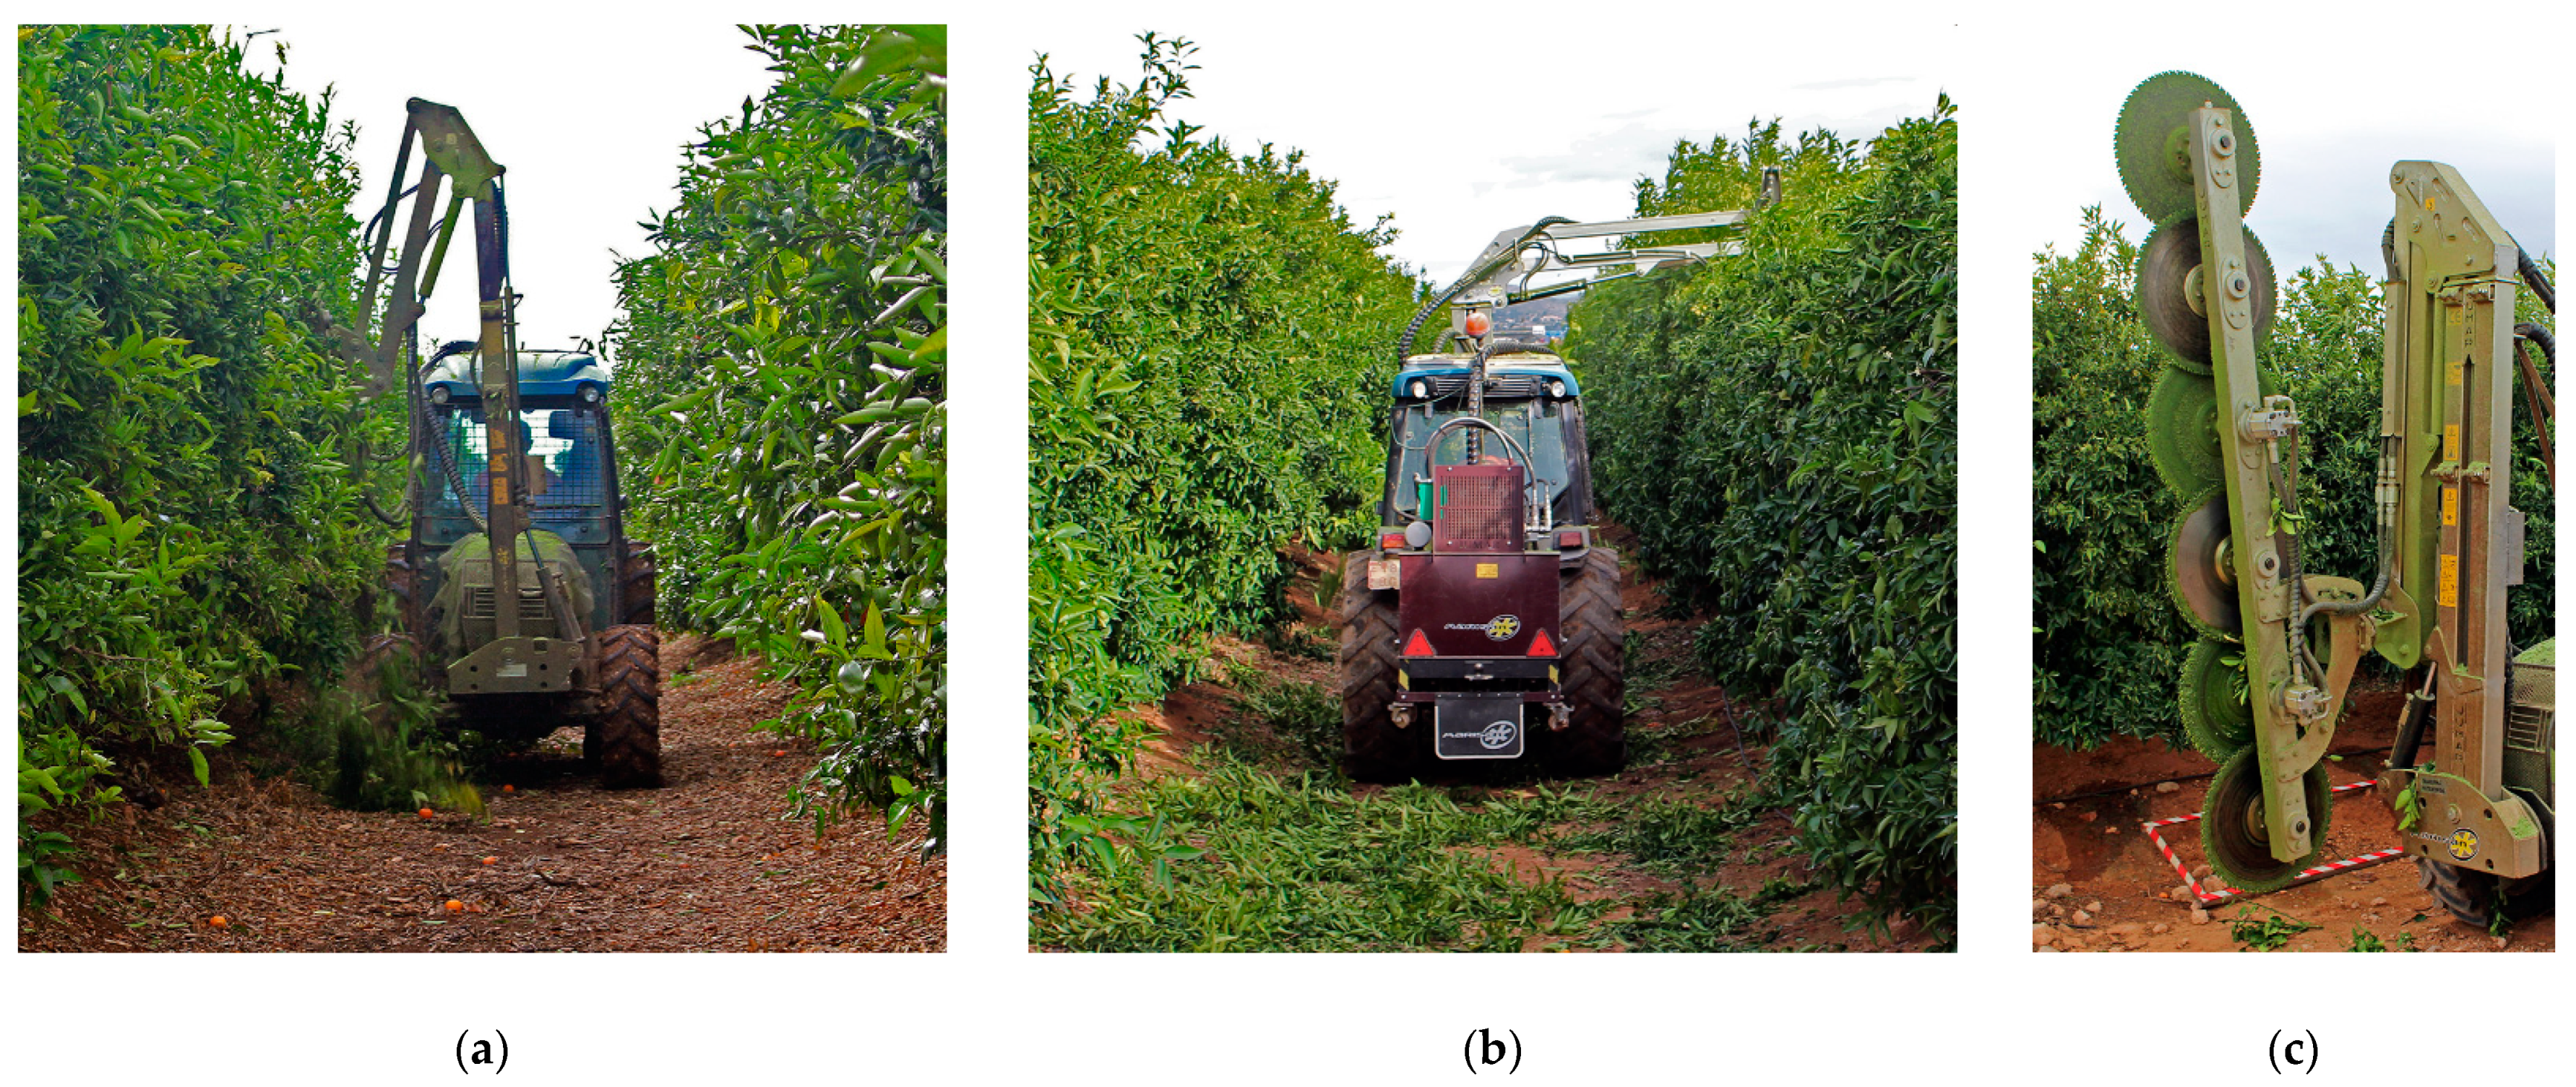
2.3. Pruning Machines

Manual pruning was performed with handsaws and manual or electric pruning shears (Electrocoup F3015, Infaco s.a.s., Cahuzac-sur-Vère, France), depending on the diameter of the branches.
Mechanical pruning (hedging and topping) was performed using a pruner of a single arm provided with cutting discs. In the 2017–2019 trials, the pruner used was the model PF-605 S-R with five discs, and in 2020, the model PF-606 S-R pruner, with six discs, was used (Figure 2), in both cases of Jumar Agrícola S.L. (Cenicero, La Rioja, Spain). The pruner was powered by a Landini REX 4-090 S tractor (Landini Argo Tractors S.p.A., Fabbrico, Italy).

2.4. Assessments

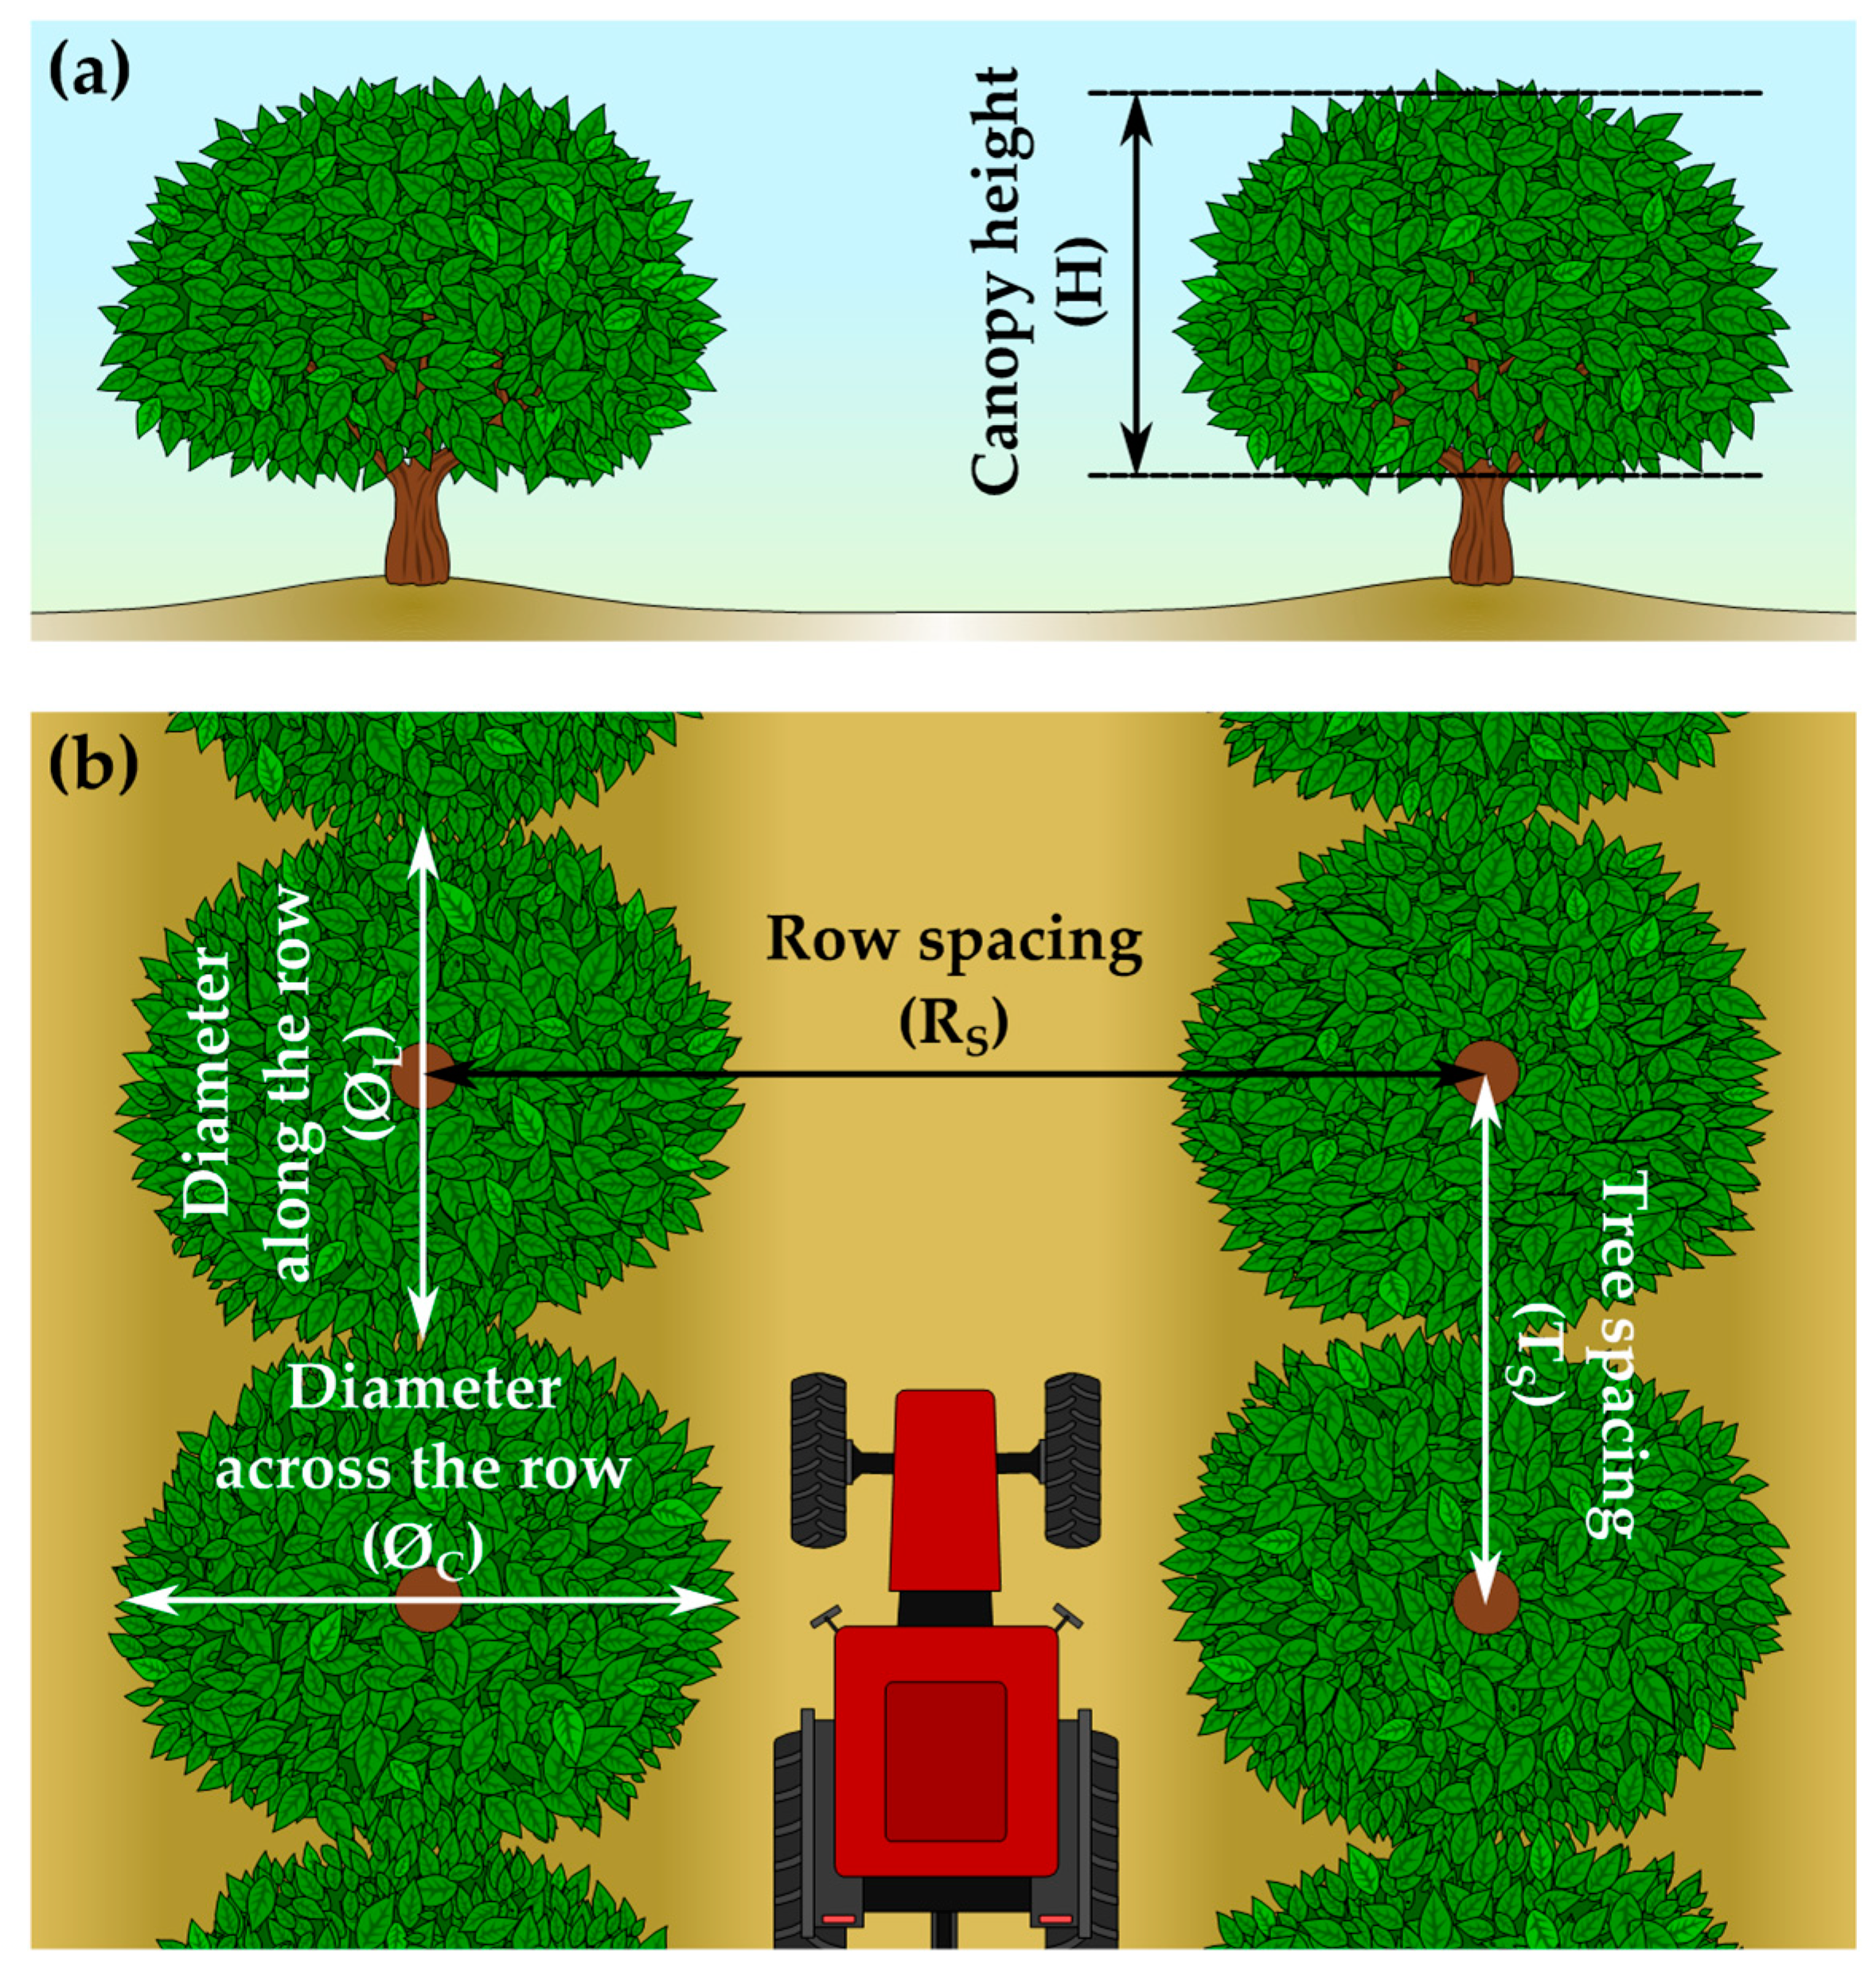
2.4.1. Characterization of Pruned Biomass and Trees

The sizes of the trees were measured before pruning (Table 2) to calculate the canopy volume. The geometrical parameters measured were the canopy height (H), the canopy diameter along the row (ØL), and the canopy diameter across the row (ØC) (Figure 3). The canopy height was calculated by subtracting the height from the ground to the skirts from the total tree height. All measurements were taken without considering unusual extreme shoots.
The volume of vegetation was calculated considering the citrus canopy as an ellipsoid, as shown in Equation (1):
Canopy   volume   ( m 3 ) = π 6 · H · Ø C · Ø L
where H is the canopy height (m), ØC is the canopy across-row diameter (m), and ØL is the canopy along-row diameter (m).
Furthermore, fresh pruned biomass was characterized after pruning, to determine the intensity of each pruning strategy for each year, through the following parameters:
-
The length (cm) and the diameter (mm) of the branch in the cutting area were measured in a minimum of 100 branches for the topping, hedging, and manual follow-up cuttings, and in a minimum of 50 branches for the manual cutting. For this, the branches were chosen from pruning strategies in which there was no annual alternation between manual and mechanical pruning.
-
The quantity of fresh biomass removed with each pruning strategy was measured (kg∙tree−1). For this, all the pruned branches in each type of cutting of the evaluation tree were weighed using a digital dynamometer (Advanced Force Gauge 500 N, Mecmesin Ltd., England, UK). Afterwards, the total fresh biomass of each sample tree was calculated by adding the weights obtained in the different types of cuts included in each strategy.
-
The moisture content (%) of the fresh biomass was measured in the laboratory, based on the thermogravimetric analysis method, for the first year of the trial. For this, five random samples of fresh pruned biomass of each type of cutting (topping, hedging, manual follow-up, and manual pruning) were selected. Each sample was divided into leaves and wood, and dried in an oven (Dry-Big 2003741, J.P. Selecta S.A., Abrera, Barcelona, Spain) at 65 °C for the time necessary to reach a constant weight. In this way, the moisture content (%) in the biomass of leaves and wood, respectively, was calculated with Equation (2):
M   ( % ) = 100 · W D W
where M is the moisture content (%), W is the weight of the wet sample (g), and D is the weight of the dry sample (g).

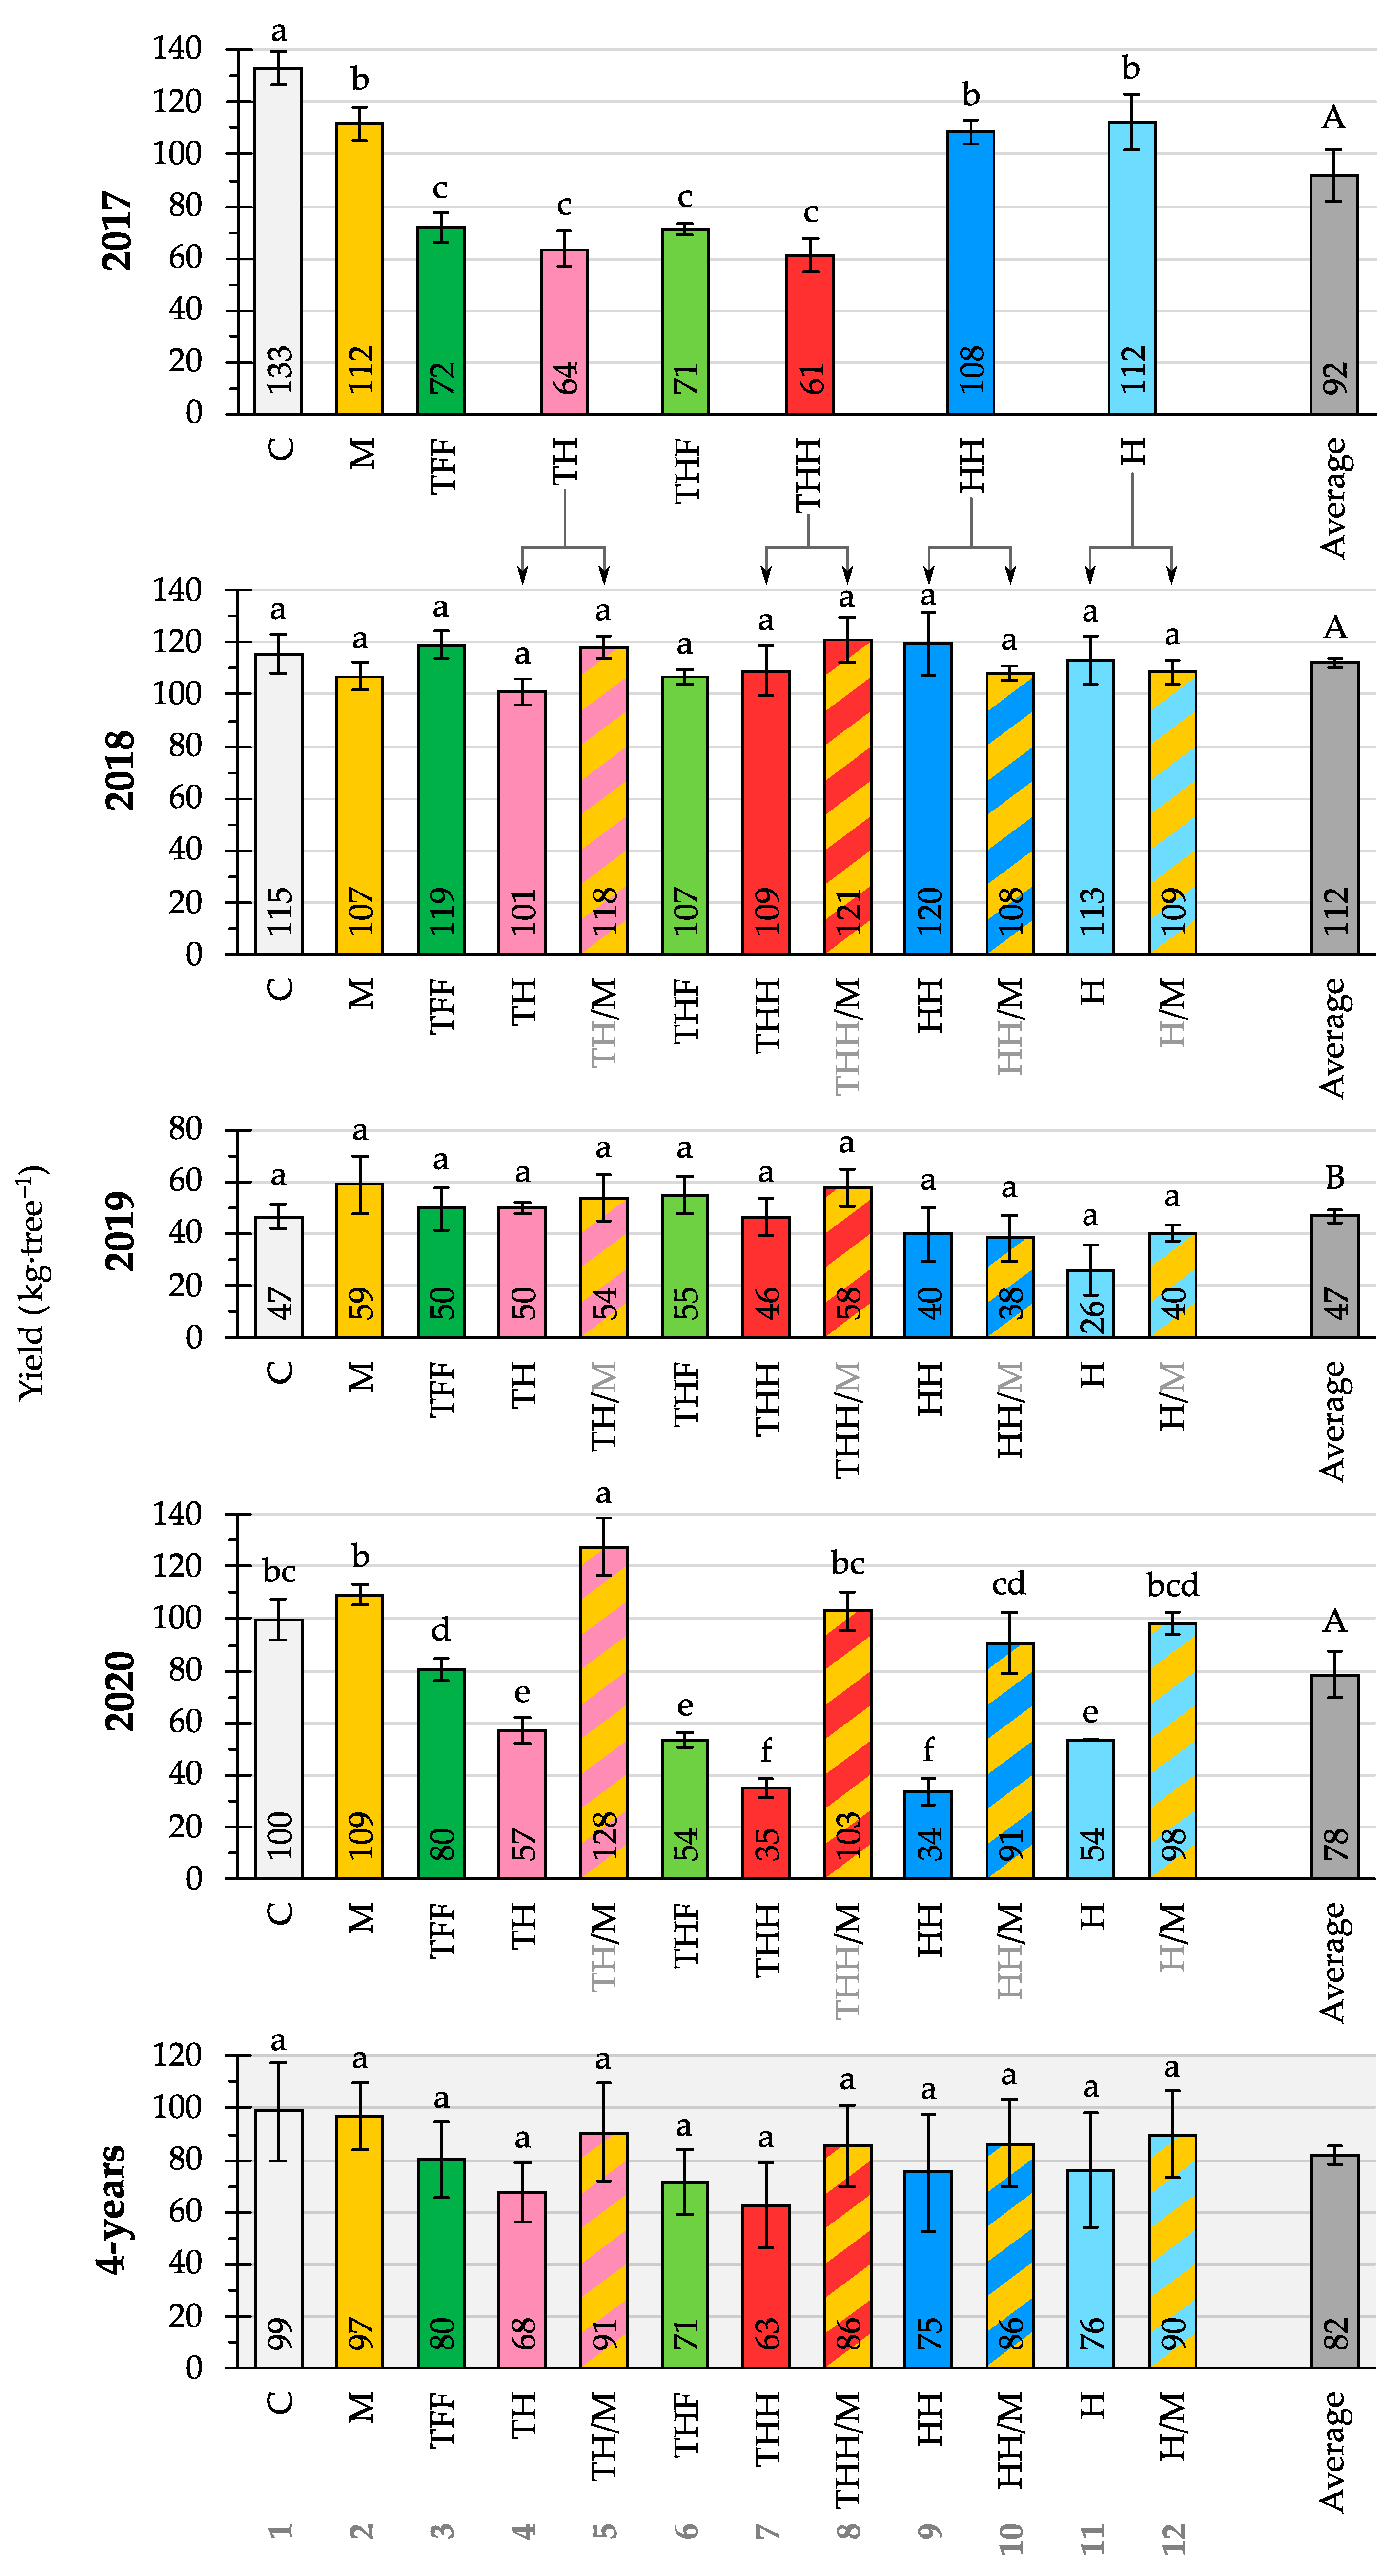
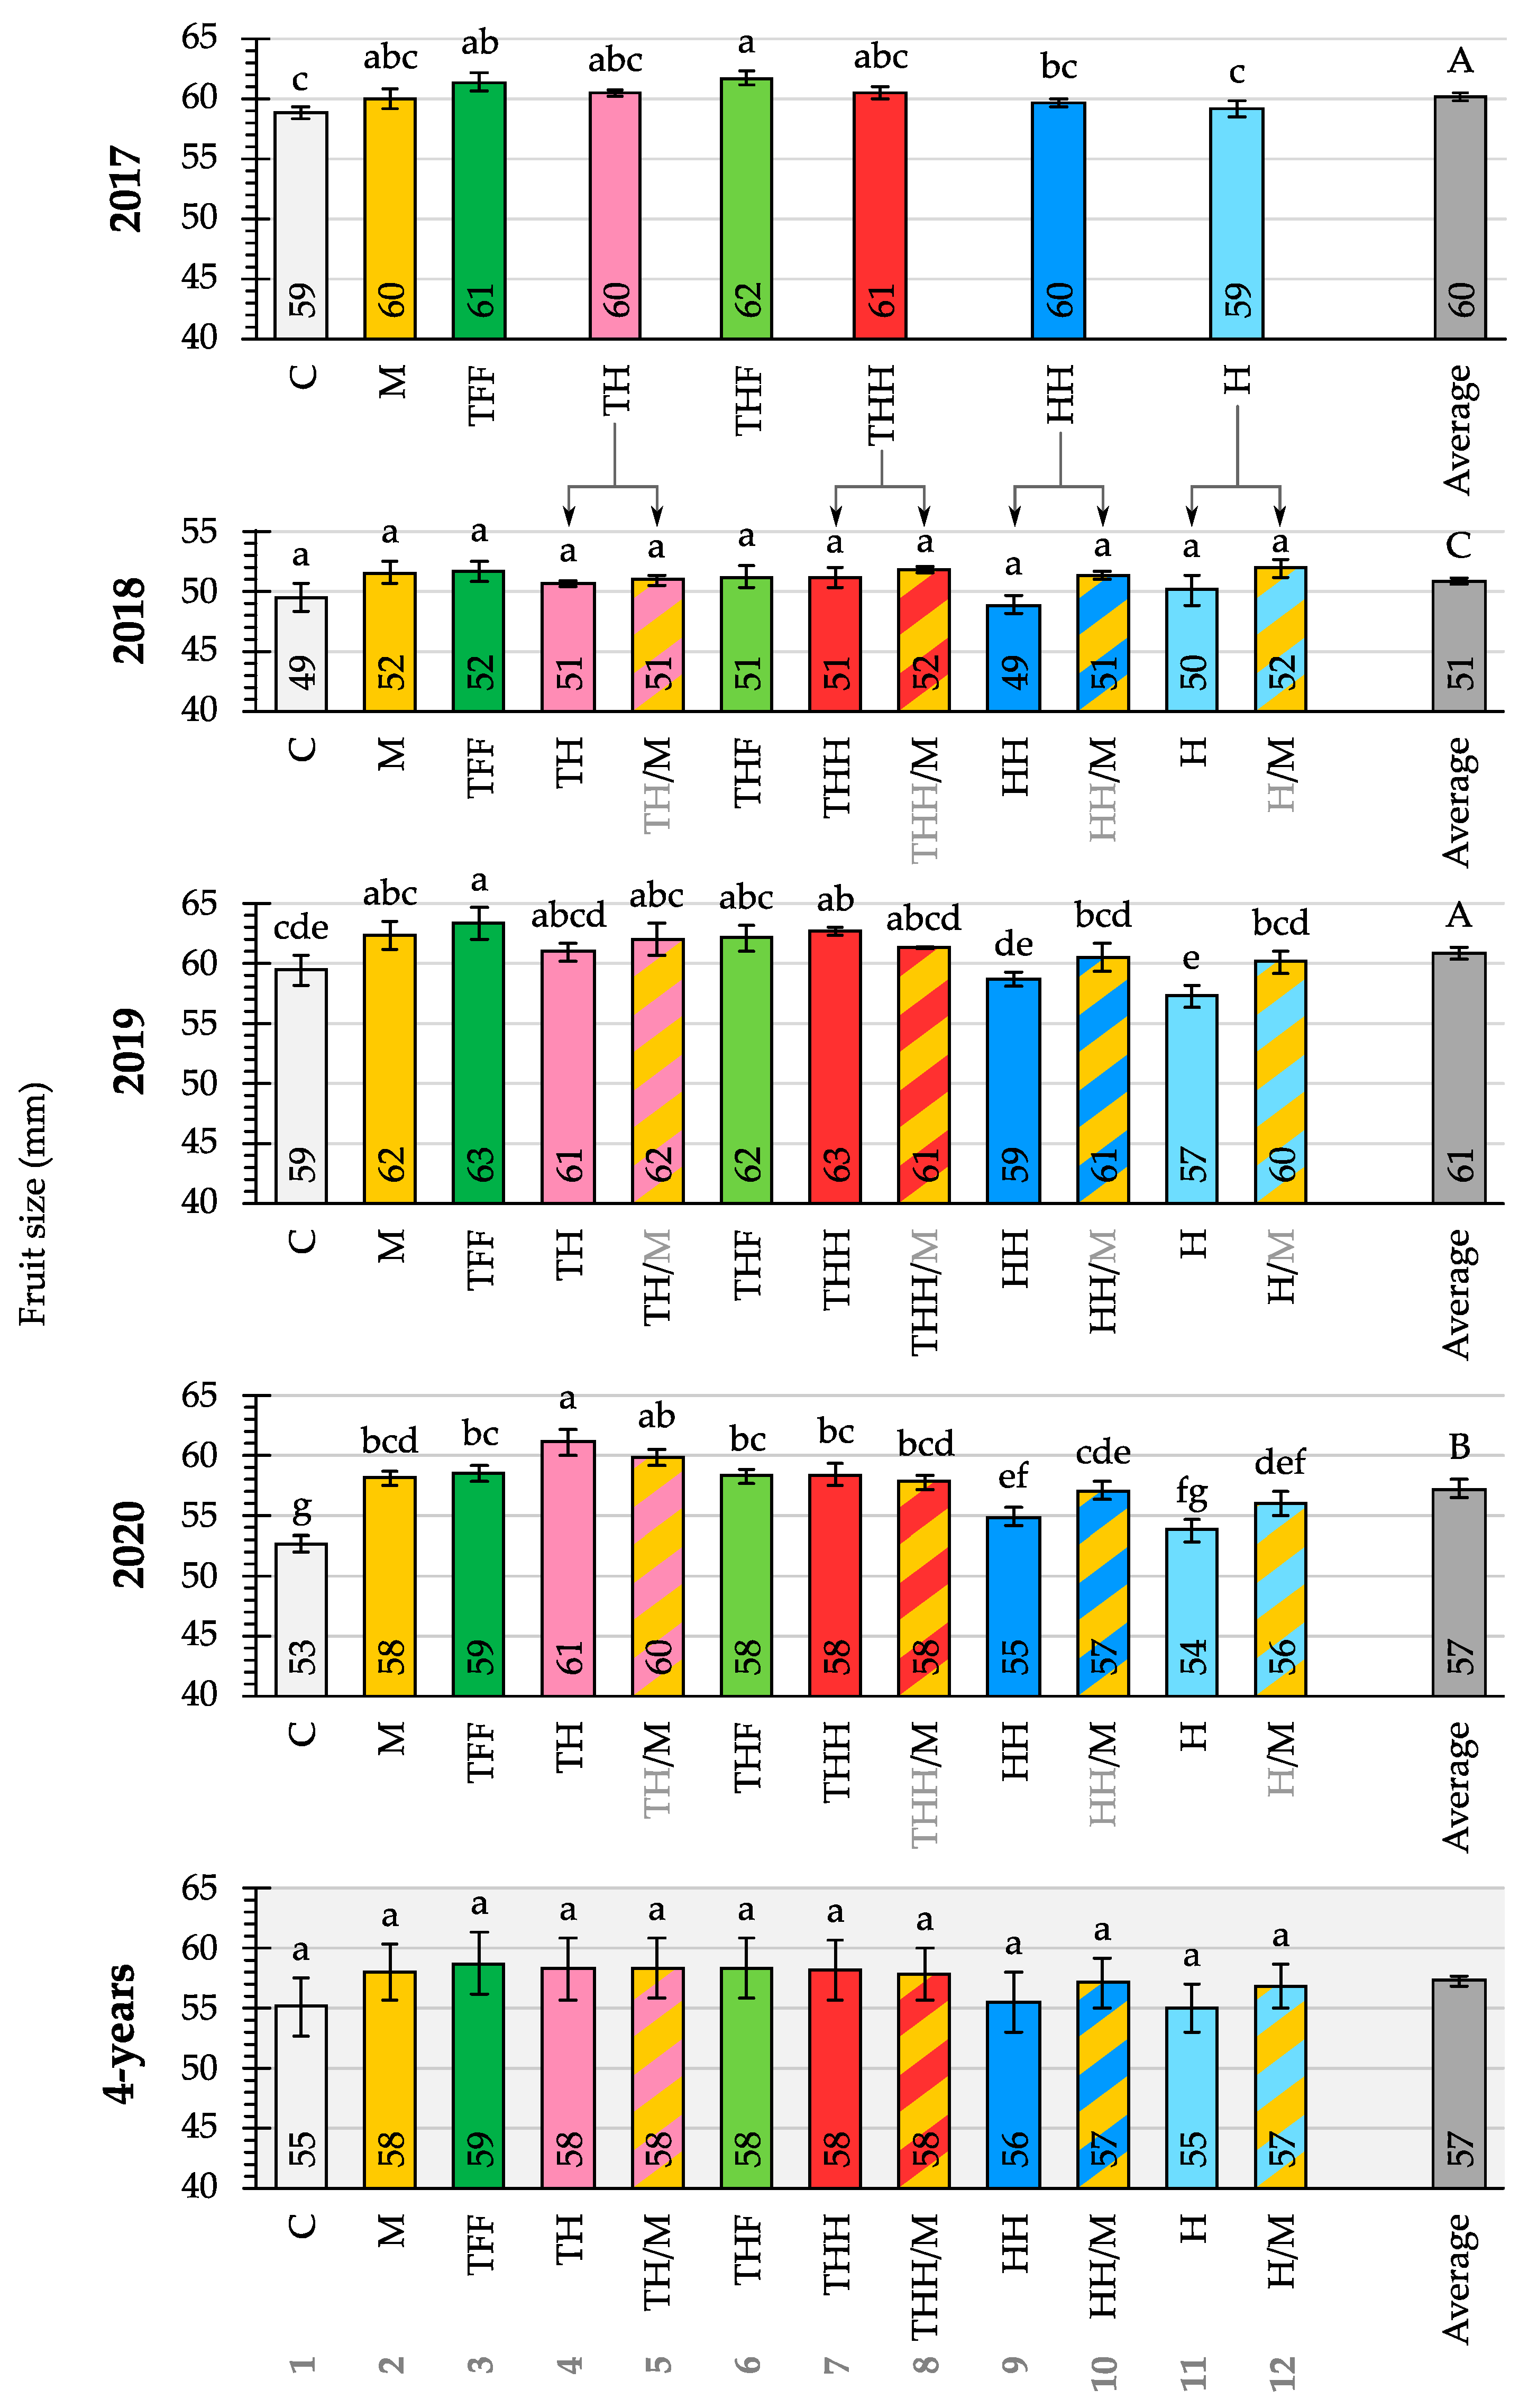
2.4.2. Pruning Effect on Citrus Production: Yield and Fruit Size

To evaluate the effect of the pruning strategy on citrus production each year, the yield and fruit size were determined at harvest time. To obtain the yield (kg∙tree−1), all of the fruits of the trees under study (one of each strategy and repetition) were collected and weighed with an electronic scale (model PCE-EP 150P1, 150 kg capacity, PCE Ibérica S.L., Tobarra, Albacete, Spain).
Fruit size was determined by measuring the outer equatorial diameter (mm) of 50 fruits that were randomly selected from each tree under study using an automatic computer vision inspection system developed by IVIA [38,39]. This vision system consists of one industrial colour camera (Manta G-125C, Allied Vision Technologies GmbH, Germany) located on a line of fruit transport rollers, and a lighting system based on LED strips. The system acquired 4 images per fruit, with a resolution of 1292 × 964 pixels per image, and the images were processed on an industrial computer (NUVO 5006E-POE, Neousys Technology Inc., Taiwan) that ran the image analysis algorithms and obtain the fruit size results. With these data, the average fruit size for each pruning strategy and year was obtained.

2.4.3. Pruning Working Capacity and Costs

The theoretical working capacity (TWC; trees∙h−1∙operator−1) of each pruning strategy was determined based on the productive time spent to prune a tree (min∙tree−1∙operator−1). This time was measured in a different way depending on whether mechanical or manual pruning was used. In the case of mechanical pruning, the tractor forward speed was determined in several rows, for each year, for the topping and hedging cuts conducted in one side. For this, the time taken by the tractor to prune a row of known distance and number of trees was measured with a chronometer. From these values, the average productive time per tree was calculated. In the case of manual pruning, both for the fully manual strategy and the follow-up approaches included in the TFF (whole tree) and THF (half tree) strategies, the productive pruning time was determined by timing with a chronometer the pruning of a single tree with a handsaw and manual pruning shears. A minimum of 13 randomly chosen trees were measured each year. The productive time spent per whole tree was multiplied by the number of operators involved in the operation (usually one or two specialised workers) to calculate the time needed by a single worker (min∙tree−1∙operator−1).
Once the four-year average productive time (min∙tree−1∙operator−1) spent per type of cutting (one-sided topping, one-sided hedging, and whole-tree manual) was obtained, the productive time of each strategy was estimated by adding all of the productive times used in the different types of cuttings included in each strategy. Based on these values, the average number of trees pruned per hour for each operator (TWC), in each strategy, was calculated.
In addition to the TWC value, the work performance (h∙operator∙ha−1) for each pruning strategy was calculated using Equation (3):
Work   performance   ( h · operator · ha 1 ) = N TWC
where N is the tree density (trees∙ha−1; in this orchard: 556 trees∙ha−1) and TWC is the theoretical working capacity (trees∙h−1∙operator−1).
Finally, the average cost of the pruning operation (€∙ha−1), without considering dead time, for each strategy was determined with Equation (4):
Pruning costs (€∙ha−1) = Work performance ∙ C
where C is the hourly pruning cost (€∙h−1). Data of hourly pruning service prices were obtained directly from the orchard technicians who contracted them, and were 7.9 €∙h−1 for manual pruning and 39 €∙h−1 for mechanical pruning. The cost structure of C includes the labour cost and the equipment cost (manual pruning = labour + manual tools; mechanical pruning = tractor driver + tractor + pruner).

2.4.4. Economic Profit

The economic profit was evaluated by calculating the confidence interval of the net value + k (€∙ha−1) for each strategy and year, and for the four-years average, where k is the sum of all the production costs except the pruning ones and was considered the same for all pruning strategies. For that, the net value + k per hectare was calculated with Equation (5):
Net value + k (€∙ha−1) = Gross value (€∙ha−1) − Pruning cost (€∙ha−1)
where Gross value (€∙ha−1) was calculated according to Equation (6):
Gross value (€∙ha−1) = Yield (kg∙tree−1) ∙ Mandarins price (€∙kg−1) ∙ N (trees∙ha−1)
where Yield (kg∙tree−1) is the kilograms of mandarins produced per tree each year; Mandarins price refers to the average citrus prices at the harvest dates of each year (Table 3) obtained from the official citrus price table [40]; N is the tree density of the orchard (556 trees∙ha−1).
Afterwards, the confidence interval of the net value + k per strategy and year was calculated using Equation (7):
CI net   value + k   ( · ha 1 ) = A net   value + k ± z × s n
where Anet value + k is the average of the net value (€∙ha−1), z is the confidence level value (95%), s is the standard deviation, and n is the number of elements in the sample.

2.5. Statistical Methods

For each year and for the 4-year overall, the effects of the pruning strategies on the canopy volume, the pruned fresh biomass, the yield, the fruit size, and the net value + k, and the effects of the type of cutting used on the dimensions (diameter and length) of the cut branches, the percentages of fresh leaf biomass and wood biomass, and the contents of leaf and wood biomass moisture, were studied through a one-way analysis of variance (ANOVA). The assumption of homoscedasticity was verified with the Levene test, and normality was evaluated with the normal probability plot of the residuals for each ANOVA. When these assumptions were not fulfilled, data transformation was applied. If homoscedasticity or normality assumptions were still not fulfilled, a nonparametric Kruskal–Wallis test was applied.
Fisher’s least significant difference (LSD) test was used for comparisons of means in the ANOVA analysis. In the Kruskal–Wallis tests, the significance of differences in the medians was determined through the non-overlapping of the median notches in the box plots. A 95% confidence level was considered in all tests.
A descriptive analysis was performed to study the productive pruning time and the pruning costs for each pruning strategy. For the net value, the confidence interval was calculated as explained in Equation (7).

3. Results

3.1. Characterization of Pruned Biomass and Canopy Dimensions

The dimensions of the canopy before pruning (dates in Table 2) for each pruning strategy, and for each year, are shown in Table 4. In 2017, the canopy volume of the trees before starting the assay ranged between 15.90 and 24.23 m3∙tree−1; in 2018, the canopy volume of the pruned trees (strategies 2 to 12) was between 21.76 and 25.18 m3∙tree−1; in 2019, the canopy volume of the pruned trees was between 17.63 and 23.75 m3∙tree−1; and in 2020, this value was between 20.46 and 25.14 m3∙tree−1. The canopy volumes of the unpruned trees (control), from 2017 to 2020, were 18.49, 24.49, 24.19, and 24.99 m3∙tree−1, respectively (Table 4).
The average diameter and length of the cut branches by type of cutting and year are shown in Table 5. The branches that were pruned mechanically (topping and hedging) had a smaller size than the branches that were subjected to manual pruning or manual follow-up pruning. For the four-years overall, in the hedging cut, the branches were 6.78 mm in diameter and 43.72 cm in length; in the topping cut, they were 7.24 mm in diameter and 64.15 cm in length. The branches that were pruned manually had a diameter of 20.06 mm. These branches had a length of 133.84 cm in exclusively manual pruning (strategy 2), and a length of 112.94 cm in manual follow-up pruning (Table 5). These values evidenced that mechanical pruning removed the younger external branches, while manual pruning removed older and larger branches, and aimed to open windows in the canopy in order to allow aeration, incidence of solar radiation, penetration of pesticides, etc.
The pruned fresh biomass for each pruning strategy and year is shown in Table 6. On average for the four years, the amount of biomass pruned with exclusively mechanical pruning strategies (strategies 4, 7, 9, and 11; between 3.18 and 11.48 kg∙tree−1) was lower than with pruning strategies that included any manual cutting (between 16.25 and 26.96 kg∙tree−1). Furthermore, within the mechanical pruning strategies, more than twice the biomass was removed in the strategies that included topping (4 and 7) than in the strategies without topping (9 and 11). Moreover, it was observed that with the manual pruning strategies (strategy 2 (all years), and strategies 5, 8, 10, and 12 (2018 and 2020)), a higher amount of biomass was removed than with the mechanical pruning strategy (topping) with manual follow-up in the complete tree (strategy 3) every year. While with strategy 2 (M), 26.96 kg∙tree−1 was pruned on average in the four years, with strategy 3 (TFF), this quantity dropped to 21.72 kg∙tree−1. For the strategies that alternated between manual and mechanical pruning, it was observed that in the years when manual pruning was used (2018 and 2020), as much or more biomass was removed than was the case for wholly manual strategy (strategy 2), which could tentatively be explained as a compensatory response to the lighter mechanical pruning of the previous year.
The percentages of fresh leaves and wood in the pruned biomass samples for the different types of cut (hedging, topping, manual follow-up, and manual), as well as their moisture contents, are shown in Table 7. Globally, without differentiating by type of cut, the leaf biomass represented 56.47% of the total fresh biomass, and its moisture content was 63.04%. The percentage of wood was 43.53%, with a moisture content of 45.12%. However, it was observed that the moisture content in the manually pruned wood was lower in comparison with that of the mechanically pruned wood. This could be explained in terms of type of branches; the branches that were cut by mechanical pruning were younger and non-lignified, while the branches that were cut manually were mature and lignified. It could also have been due to the fact that during manual pruning, the operators cut, among others branches, the dried ones that they found in the internal part of the tree.

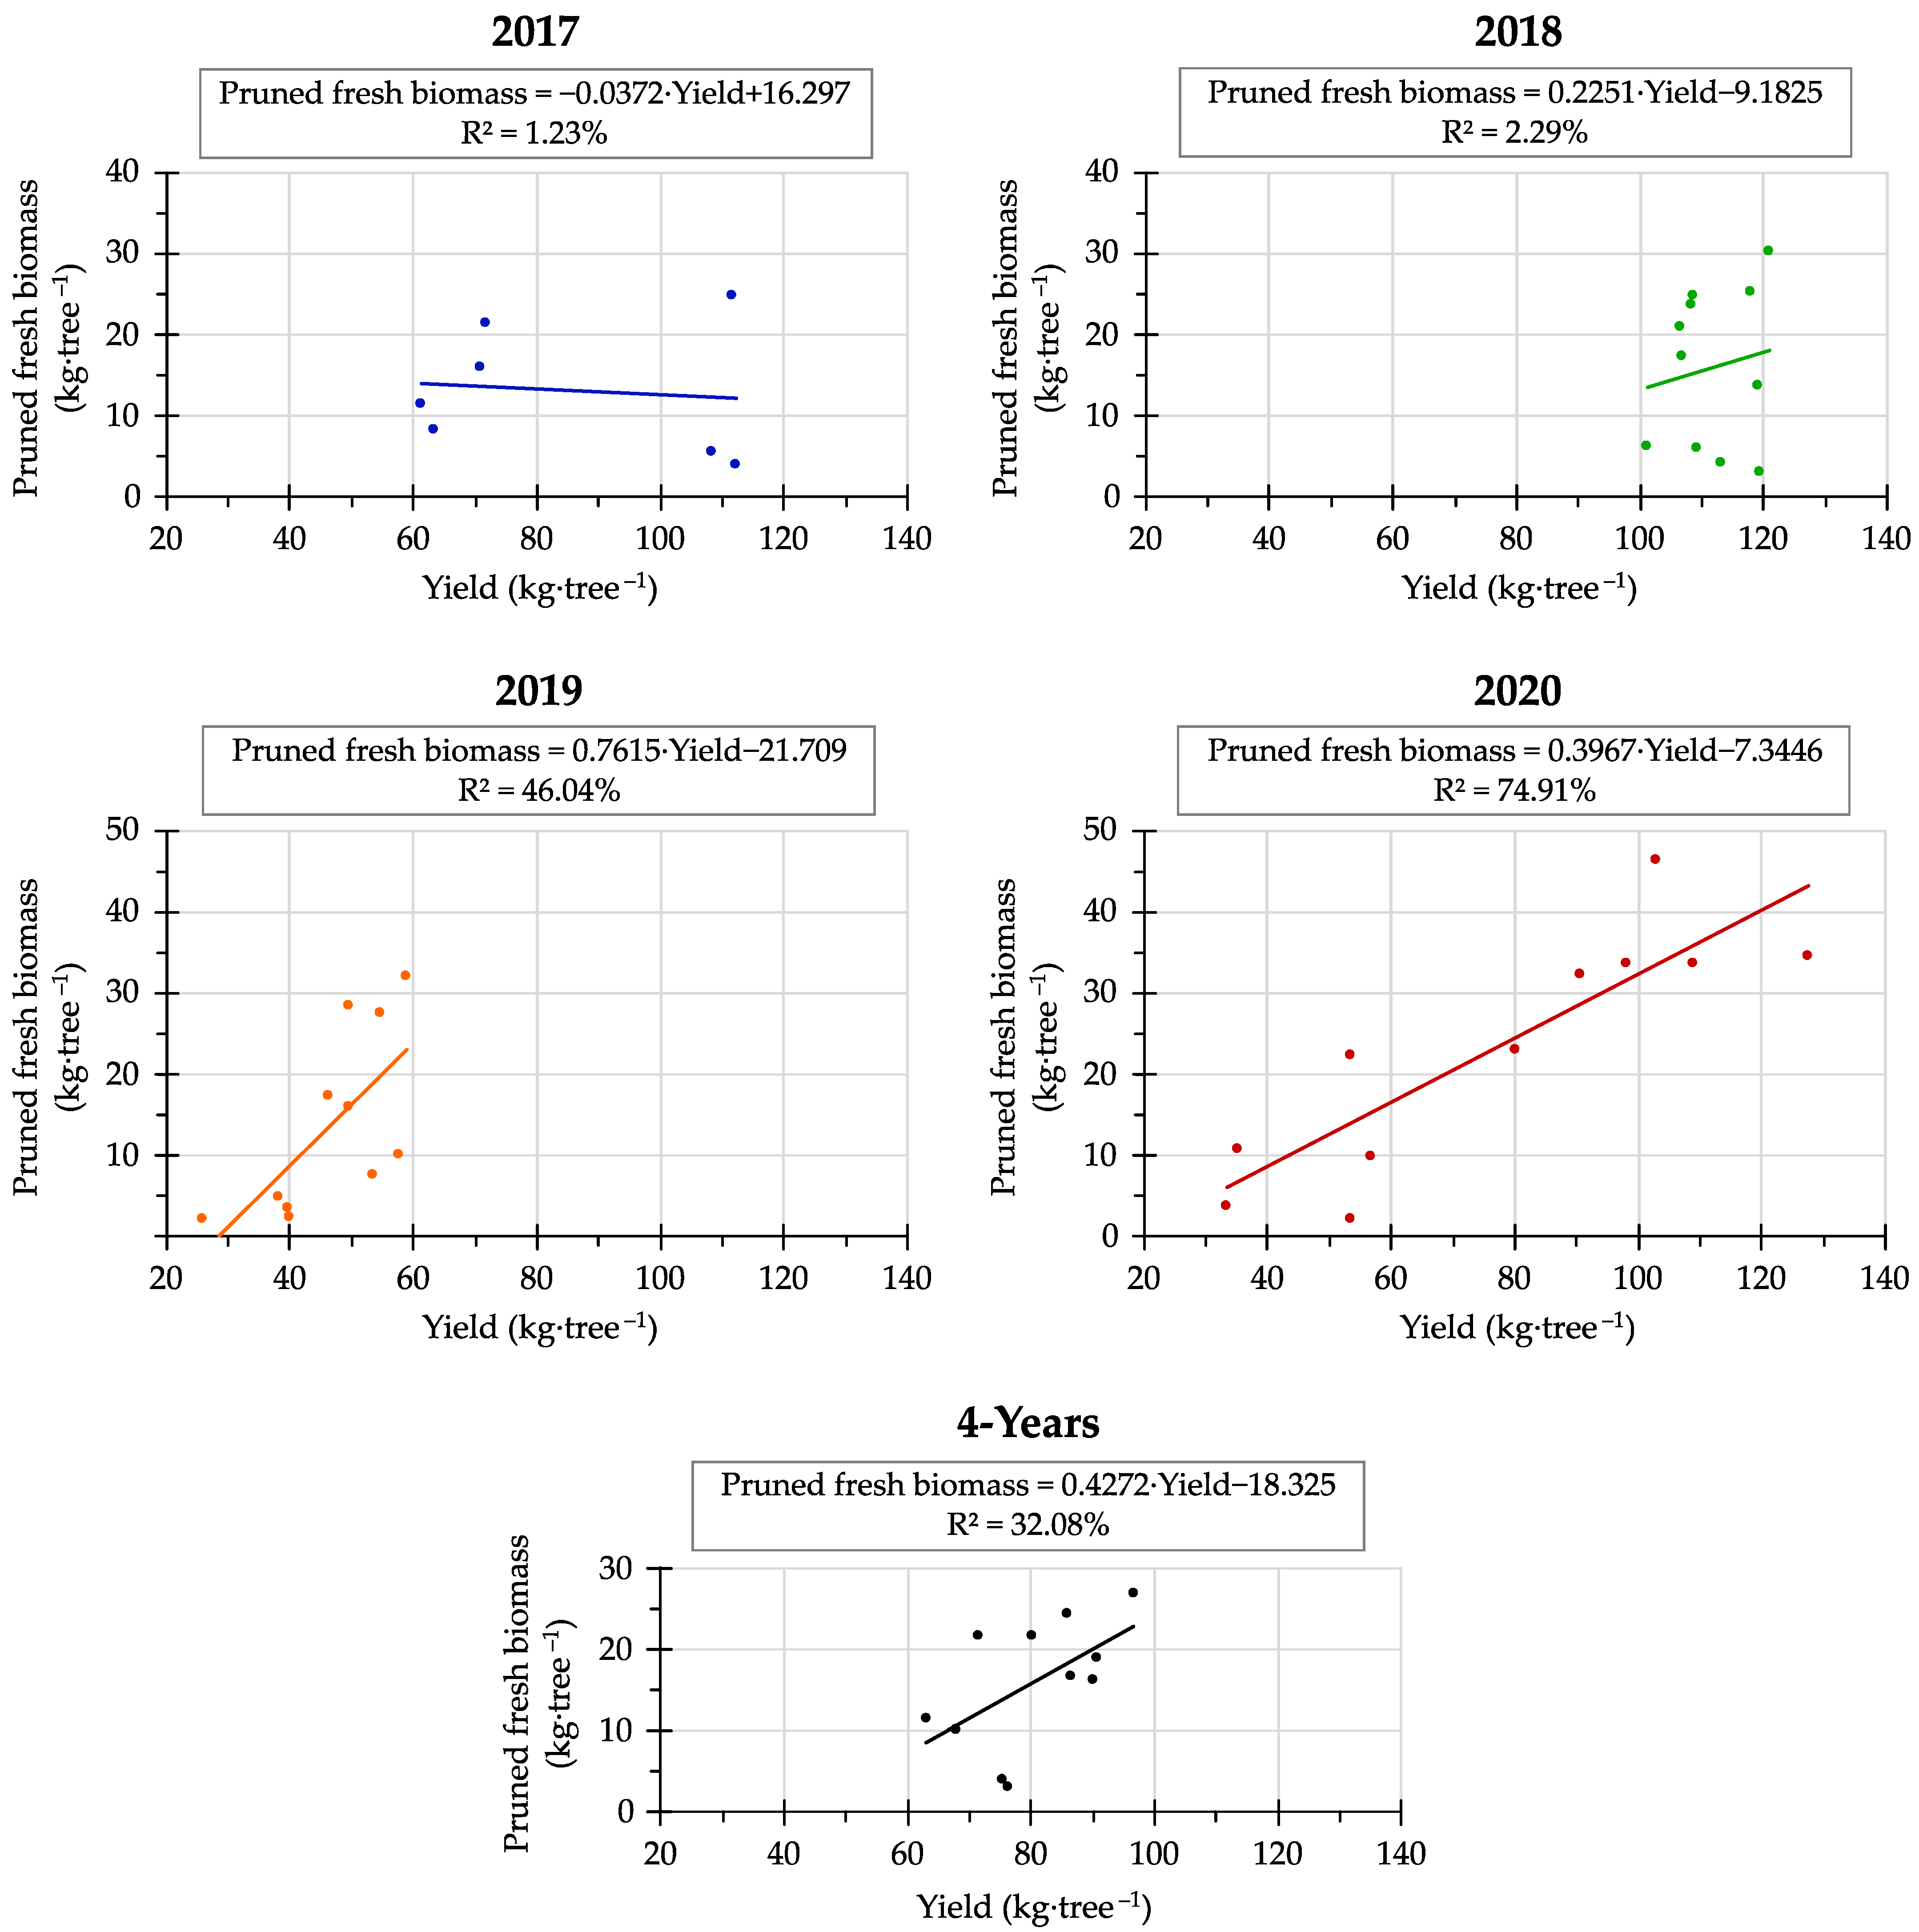
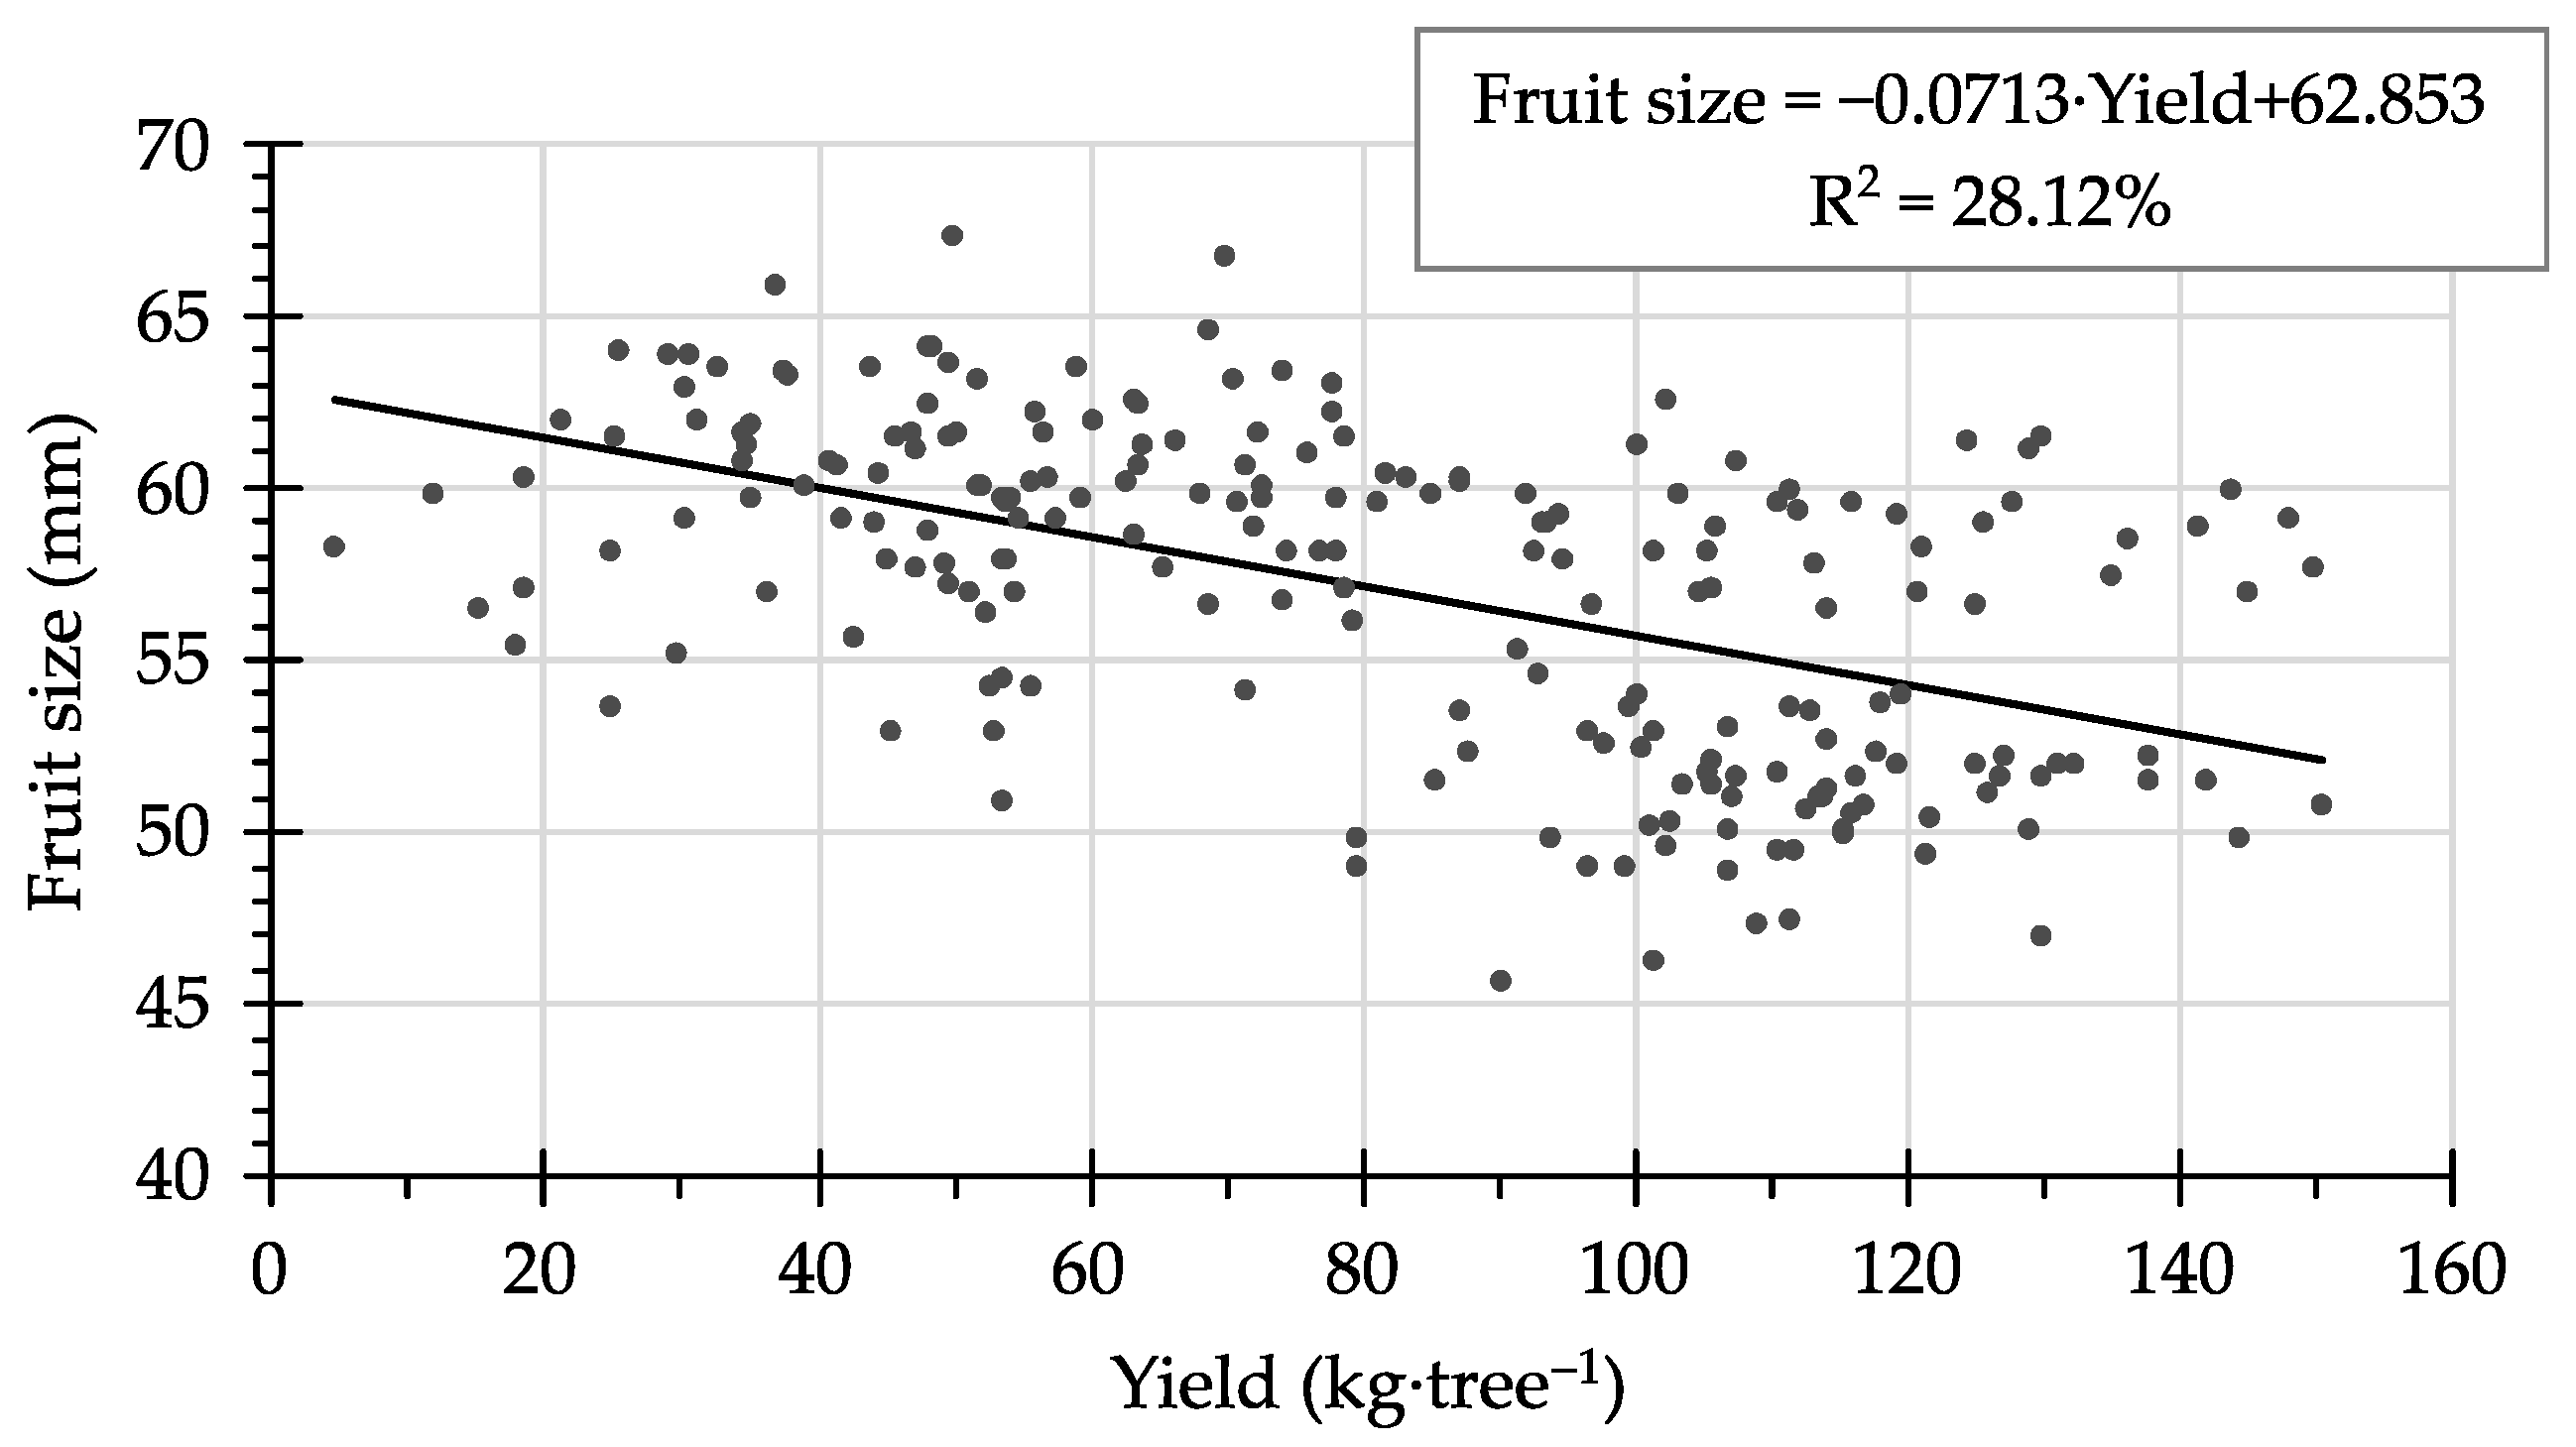
3.2. Pruning Effect on Citrus Production: Yield and Fruit Size

In the yield analysis, it was observed that the year had a significant effect (Kruskal–Wallis test, p = 1.01 × 10⁻⁵). The yield did not significantly differ in 2017 (91.61 kg∙tree−1 on average), 2018 (112.25 kg∙tree−1) and 2020 (78.42 kg∙tree−1), but it significantly decreased in 2019 (46.74 kg∙tree−1) (Figure 4).
When differences between strategies for each year were analysed, it was found that in the first year (2017), strategies including topping (strategies 3, 4, 6, and 7; between 61.24 and 71.67 kg∙tree−1) had significantly lower yields than the manual (strategy 2, 111.66 kg∙tree−1) and mechanical pruning strategies that did not include topping (strategies 9 and 11, 108.49 and 112.39 kg∙tree−1, respectively), and the control trees had the highest yield (132.87 kg∙tree−1) (F = 17.98; df = 7, 39; p < 0.001).
In the second year (2018), all strategies had high yields, and no differences between strategies were found (F = 0.81; df = 11, 59; p = 0.6289).
In the third year (2019), significant yield reductions were observed regardless of strategy, and no significant differences were found between strategies (F = 1.47; df = 11, 58; p = 0.175).
In the fourth year of the trial (2020), statistically significant differences were again observed between strategies (F = 23.13; df = 11, 59; p < 0.001). A significantly greater yield was achieved with pruning strategy 5 (TH/M) (127.67 kg∙tree−1) than with the others. Trees that were pruned manually (strategy 2 and strategies 5, 8, 10, and 12), with manual follow-up on both sides (strategy 3: TFF), as well as those that were not pruned (control) (between 80.32 and 127.67 kg∙tree−1), had significantly higher yields than trees that were pruned exclusively mechanically (strategies 4, 7, 9, and 11) or mechanically with manual follow-up only on one side (strategy 6: THF) (between 33.51 and 56.77 kg∙tree−1). In addition, it was observed that the mechanical pruning strategies that included hedging on both sides of the tree had significantly lower yields than the strategies involving hedging only on one side (20.14 kg∙tree−1 less in HH than in H, and 21.70 kg∙tree−1 less in THH than in TH) and the strategy that included manual follow-up on both sides (TFF) had significantly higher yield (26,72 kg∙tree−1 more) than the strategy of manual follow-up on one side and mechanical hedging cutting on the other side (THF). On the other hand, it was observed that in mechanical pruning strategies, topping did not affect yield (there were no significant differences between THH and HH, nor between TH and H). However, when comparing full manual pruning (M) strategy with that of manual pruning plus topping (TFF), a significant reduction in yield was observed (28.70 kg∙tree−1 more in M than in TFF).
Finally, when the average for the four years was considered, non-significant differences between strategies were found (F = 0.45; df = 11, 47; p = 0.9188). However, on average, the no pruning, manual pruning, or mechanical pruning alternated annually with manual pruning strategies had higher yield than that of exclusively mechanical pruning. Furthermore, the mechanical pruning strategy with the highest number of cuts (THH) had the lowest yield (62.93 kg∙tree−1 on average) (Figure 4).
With regard to the fruit size, there were also significant differences between years (F = 79.49; df = 3, 43; p < 0.001), with the fruits produced in 2018, when the yield was higher, being significantly smaller (50.89 mm) than the fruits of 2020 (57.23 mm), and in turn, significantly smaller than those of 2017 and 2019 (60.20 and 60.92 mm, respectively) (Figure 5).
Comparing the strategies by year, in the first year of the experiment (2017), there were significant differences in fruit size between strategies (F = 2.82; df = 7, 39; p = 0.021). It was observed that with mechanical pruning strategies that involved manual follow-up pruning, on one (THF) or on both sides (TFF) of the tree, the fruits had a significantly larger diameter than with mechanical pruning only on one side of the tree (H) or with the trees not being pruned (control).
In 2018, no significant differences were found between strategies (F = 1.48; df = 11, 59; p = 0.1715).
In 2019, with the hedging cutting strategies (HH and H), the fruits had a significantly smaller diameter than with manual pruning (M), mechanical pruning with manual follow-up (TFF and THF), or mechanical pruning with topping and hedging on both sides (THH) (F = 3.28; df = 11, 58; p = 0.0021).
In 2020, significant differences were also found between pruning strategies (F = 9.94; df = 11, 59; p < 0.001). During this year, significantly larger fruits were obtained with the TH and TH/M strategies than with the HH, HH/M, H, and H/M strategies and with no pruning (control).
When considering the average fruit size of the four years, no significant differences were found between strategies (F = 0.33; df = 11, 47; p = 0.9727). However, it was observed that the HH and H strategies, as well as the control (without pruning), were associated with smaller fruit sizes (between 55.09 and 55.54 mm) compared to the rest of the strategies, for which similar fruit sizes were observed (between 56.80 and 58.73 mm) (Figure 5).

3.3. Pruning Working Capacity and Costs

The productive time to perform the topping cut for one side of the tree was 0.10 min∙tree−1∙operator−1 with a tractor ground speed of 1.85 km∙h−1. For the one-sided hedging cut, this was 0.08 min∙tree−1∙operator−1 with a tractor ground speed of 2.30 km∙h−1. Furthermore, the time to manually prune a whole tree was 5.48 min∙tree−1∙operator−1, on average, for the four years. The estimated productive time for each strategy is shown in Table 8.
In general, the exclusively mechanical pruning strategies (strategies 4, 7, 9, and 11) had high working capacities, between 166.79 and 754.21 tree∙h−1∙operator−1. The strategies involving pure manual pruning (strategy 2) or including manual follow-up (strategies 3 and 6) had the lowest working capacities, between 10.55 and 19.85 tree∙h−1∙operator−1. The strategies that alternated mechanical pruning with manual pruning annually (strategies 5, 8, 10, and 12), had an intermediate TWC, on average, for the four years, between 88.86 and 382.58 tree∙h−1∙operator−1 (Table 8).
The pruning cost of the exclusively mechanical strategies ranged between 28.75 and 130.01 €∙ha−1 depending on the number of pruner passes (one pass in strategy 11, two passes in strategy 9, three passes in strategy 4, and four passes in strategy 7). This represented a reduction of between 67.62% and 92.84% with respect to the costs of the pure manual pruning approach (strategy 2). In the strategy involving mechanical pruning and manual follow-up pruning on one side only (strategy 6), the cost was reduced by around 24.78% with respect to the pure manual pruning strategy. The strategy comprising mechanical topping and manual follow-up of the whole tree (strategy 3) had a cost that was 18.06% higher than the pure manual pruning strategy. Pruning strategies that alternated manual with mechanical pruning annually had costs that were between 33.81% and 46.42% lower than the strategy of manual pruning for four consecutive years (Table 8).

3.4. Economic Profit

The confidence interval of the net value + k (€∙ha−1) per pruning strategy and year is shown in Table 9. In the first year, pruning strategies involving topping (TFF, TH, THF, and THH) had the lowest net values + k, between 7838 and 13,061 €∙ha−1. In the second and third years, in general the intervals of all strategies overlapped and, therefore, no differences were found in the net values + k. In the fourth year, the mechanical pruning strategies on both sides, with and without topping (THH and HH), had the lowest net values + k (between 3575 and 6819 €∙ha−1). With the pure manual pruning strategy (M; between 15,463 and 17,921 €∙ha−1), higher net values + k were achieved than with the exclusively mechanical or mechanical pruning strategies involving manual follow-up (TFF, TH, THF, THH, HH, and H; between 3575 and 13,416 €∙ha−1). Furthermore, with the alternate mechanical/manual pruning strategies, the net values + k were much higher than with the corresponding mechanical pruning strategies. When considering the averages of the four years, as observed in the graph in Table 9, there were no significant differences in the net values + k between the different pruning strategies (F = 0.86; df = 11, 47; p = 0.5861). However, on average, with exclusively manual pruning and mechanical/manual pruning strategies and with no pruning, higher net values + k were achieved than with exclusively mechanical or mechanical pruning strategies involving manual follow-up.

4. Discussion

In this study, the pruning strategies can be grouped into two large groups according to the amount of biomass removed, namely the strategies that included some type of manual pruning (2, 3, and 6; and 5, 8, 10, and 12), with the largest amount of biomass pruned (20.99 kg∙tree−1 on average) due to bigger branches removed both in length and diameter, and the ones with only mechanical pruning including topping (strategies 4 and 7) or without topping (strategies 9 and 11), with a biomass removed of 10.80 kg∙tree−1 and 3.62 kg∙tree−1 on average, respectively. These values are in the same order of magnitude as the ones obtained in pruned citrus by Velázquez and Fernández [36] and Velázquez-Martí et al. [41] and the moisture content was also similar, at around 30–45%, but without distinguishing between manual and mechanical pruning; furthermore, in this work, it was observed that the wood moisture content was higher (57.59% on average) with mechanical pruning than with manual pruning (32.64%), which can be explained because the removed branches were external, younger, and greener.
A poor relationship between biomass removed and yield was observed for the four years overall, with a correlation coefficient of only R2 = 0.3208 (linear regression) (Figure A1 of Appendix A). Furthermore, this tendency was similar when analysing the data for each year, except in 2020, with a correlation coefficient of 0.7491. In 2017, with large significant differences in yield between pruning strategies, no pruned-biomass–yield relationship was found (R2 = 0.0123), and in 2018 and 2019, with no significant differences in yield between pruning strategies, the correlation coefficient was also low (R2 = 0.0229 in 2018 and R2 = 0.4604 in 2019).
However, the pruning strategy can affect the yield. In fact, in the first year of assay (2017), the strategies involving topping led to significantly reduced yields in comparison with the rest of the strategies, in a similar way to that observed by Wheaton et al. [32] and Kallsen [33]. However, in this work, it was also observed that after the yield reduction for the first year in the strategies involving topping, in the second and third years, the yield was recovered and this behaviour was also found in ‘Ponkan’ tangerines, according to Mendonça et al. [34]. Anyway, the effects of pruning strategies seem to be noticed after some years of experience. In the fourth year (2020), trees with mechanical pruning for four consecutive years had lower yield although the differences were not significant. Meanwhile, strategies that annually alternated mechanical pruning with manual pruning had a higher yield, similar to those the manual and control strategies. As observed by Martin-Gorriz et al. [22] in ‘Fortune’ mandarins, the annual or biannual alternation of manual pruning with mechanical pruning obtained an accumulated yield close to that of continued manual pruning and a higher yield than that obtained with mechanical pruning only. In ‘Salustiana’ oranges, there was a reduction of 17% in the yield of the trees that were pruned mechanically compared to the hand-pruned trees considering the average yield of the four years [29,42]. Continued mechanical pruning produces zig-zag branches that become unproductive over time, and more severe rejuvenation pruning is needed after a few years [16]. Alternating mechanical pruning with selective manual pruning avoids the accumulation of unproductive branches in the canopy, and avoids having to undertake a more severe rejuvenation pruning, with the consequent yield reduction in production that it would entail for that year.
In contrast to these results, in ‘Navel Foyos’ oranges, no significant differences in yield and fruit size between manual and mechanical pruning strategies were found for the three years [11] and this was also the case with those obtained for ‘Washington Navel’ oranges, where the average yields for the four years in the manual pruning strategy, in the mechanical pruning strategy, and in the strategy involving a mix of mechanical and manual pruning were similar [29,42]. Moreover, in ‘Nadorcott’, a mandarin variety with a marked biennial bearing, which means that trees will have great fruiting one year and very little flowering the following year, Mesejo et al. [16] demonstrated that cutting the flowering shoots annually with a pruning strategy based on topping and hedging on both sides and with different severity levels of the topping (greater or lesser depth), between 7.2% and 24.5% greater yields, respectively, were obtained, compared to non-pruned trees, after four years of experimentation.
Agustí et al. [43] indicated that the size of the fruit was inversely related to the number of fruits per tree, although this relationship was only clear under conditions of low productivity. If the yield was high, the correlation between both variables would be low. In this work, it can be observed in Figure A2 of Appendix A that the sizes of the fruits (equatorial diameter) decreased as the yield increased, although the coefficient of determination was low (R2 = 0.2812, linear regression), in a similar way to that which was observed by Martin-Gorriz et al. [22]. In addition, when considering the different years, it was observed that 2018, the year with the highest yields, had the lowest fruit sizes, and 2019, the year with the lowest yields, had the highest fruit sizes. However, when considering the pruning strategies, this trend could not be observed. In some cases, strategies with lower production also had smaller fruits and vice versa. Ahmad et al. [44] found no significant differences in fruit size between pruned and non-pruned trees in the ‘Kinnow’ mandarin hybrid. Bevington and Bacon [13] did not find a consistent relationship between hedging and fruit size, although on average, the unpruned trees had smaller fruits. However, Morales et al. [19] observed that pruning (topping, with or without skirting) increased the percentage of large fruits and reduced the number of small fruits, as well as decreasing yields, of ‘Orlando’ tangelo.
Regarding the productive pruning time, it was observed that in ‘Clemenules’, the pruning workers took the same time in the full manual follow-up pruning as in the manual pruning, since the operators cut similar numbers of internal branches, although trees were previously pruned mechanically in the external part. In fact, the diameter in the cutting area of the branches pruned in manual and manual follow-up pruning strategies were the same, on average, for the four years (20.06 mm). Meanwhile, in ‘Fortune’ mandarins, Martin-Gorriz et al. [22] found that manual follow-up pruning after mechanical pruning required between 13% and 15% less time than manual pruning. Anyway, because this time depends directly on the subjective vision of the pruner operator regarding which internal branches should be cut, a high reduction in time was not expected. On the contrary, mechanical pruning reduced the time required for pruning, allowing a larger orchard area to be pruned in less time. Furthermore, although the prices per hour for mechanical pruning were higher than for manual pruning (39 €∙h−1 versus 7.9 €∙h−1), the mechanical pruning costs per hectare were between 3 (strategy THH) and 14 (H) times lower, depending on the number of pruner passes, than those of manual pruning (M).
The net value + k takes into consideration the other variables studied: yield, working capacity, and costs, with yield being the one with the highest weight. For this reason, the higher the yield, the greater the net value + k, and vice versa. For the four years overall, the highest net value + k was achieved with the control (trees not pruned), ranging between 10,948 and 20,305 €∙ha−1. Nonetheless, this should not be an option to consider as a normal practice since pruning is necessary to control the overgrowth of the trees, and to guarantee their correct development, as well as their health and future yield [12,14,15,16]. In the long term, it is expected that approaches involving no pruning may reduce production and, consequently, net value would decrease. The strategies with higher net values + k were manual pruning (M) and alternate annual mechanical/manual pruning (TH/M; THH/M; HH/M; H/M), and the ones with lower net values + k were mechanical pruning (TH; THH; HH; H) and mechanical pruning with manual follow-up (TFF; THF).

5. Conclusions

After four years of pruning experimentation in ‘Clemenules’, it may be concluded that alternating mechanical pruning in one year with manual pruning in the next year may be a better option than using exclusively mechanical pruning or mechanical pruning with manual follow-up every year because the yield obtained with the former approach was higher and similar to those of the manual and control strategies. Furthermore, with this system, the dry branches would be removed from the interior of the tree, internal aeration would be improved, and the problems of non-selective mechanical pruning continued over time would be avoided. At the same time, the dimensions of the trees would be more regular, facilitating the movement of tractors between the tree rows. In addition, this strategy would mean a significant cost reduction compared to traditional manual pruning. For all these reasons, this system should be boosted in farm practices through the diffusion of these results in agricultural extension channels.
Among the strategies that alternated mechanical and manual pruning yearly, the strategy that combined mechanical pruning in topping and one-sided hedging on with completely manual pruning in the following year (TH/M) was the one with the highest yield (91 kg∙tree−1 on average for the four years). This strategy, by including the topping cut, makes it possible to control the growth of the trees, since, if the growth in height of citrus trees is not limited, the harvesting tasks, which in the Valencian region are usually carried out manually, and the spraying of plant protection products will become difficult.
The results obtained in this research were focussed on the ‘Clemenules’ variety and, as has been observed in the literature, were different to the results obtained for other citrus varieties/species; this is a limitation of this work and more research is required on other citrus varieties to observe their behaviour after mechanical pruning. On the other hand, the effect of pruning may affect other aspects of production such as the presence of pests/diseases and its control. This, together the influence of climate change in all aspects of citrus production, are future challenges for this research area.

Author Contributions

Conceptualization, A.T. and P.C.; methodology, A.T., C.G. and P.C.; validation, A.T., C.G. and P.C.; formal analysis, A.F., A.T., G.M. and P.C.; investigation, A.F., A.T., C.G., G.M. and P.C.; resources, A.T. and P.C.; data curation, A.F.; writing—original draft preparation, A.F.; writing—review and editing, A.T., C.G., G.M. and P.C; visualization, A.F., A.T., C.G., G.M. and P.C.; supervision, A.T., C.G. and P.C.; project administration, A.T. and P.C.; funding acquisition, A.T. and P.C. All authors have read and agreed to the published version of the manuscript.

Funding

This research was funded by (1) the project “Application of new technologies for a comprehensive strategy of mechanized citrus harvesting (CITRUSREC)” funded by the Spanish National Institute for Agriculture and Food Research and Technology (INIA) and the Ministry of Economy, Industry, and Competitiveness of Spain (project RTA2014-00025-C05-00), co-funded by the European Regional Development Fund (ERDF); (2) the project of the Operative Group “Technological advances for modernization and sustainability in citrus production (GO CITRUSTECH)” co-funded by the European Agricultural Fund for Rural Development (EAFRD) (80%) and the Ministry of Agriculture, Fisheries, and Food (20%); (3) the project “Engineering developments to ensure profitable, sustainable and competitive agriculture from farm to fork” co-financed by the Valencian Institute of Agricultural Research (IVIA) and by the European Regional Development Fund (ERDF). G.M. was a beneficiary of a scholarship for training and specialization from the European Social Fund (ESF).

Institutional Review Board Statement

Not applicable.

Informed Consent Statement

Not applicable.

Data Availability Statement

The data presented in this study are available on request from the corresponding author.

Acknowledgments

The authors thank Revacitrus S.L. for allowing us the use of their citrus plot and the farm technicians for their collaboration. Furthermore, thanks are extended to the IVIA and UPV staff (Iván Carrillo, Laura Català, Begoña Cebrián, Jaime Cuquerella, Juan José Gil, María Gyomar González-González, Diego Guerra, Hector Izquierdo, Florentino Juste, Coral Ortiz, and Ramón Salcedo) who gave us their technical support.

Conflicts of Interest

The authors declare no conflict of interest.

Appendix A

Figure A1. Pruned fresh biomass (kg∙tree−1) versus total yield (kg∙tree−1) for each pruning strategy (strategies 2–12), in each year under study (2017–2020), and for the 4-year overall. The model equations that describe the relationships between pruned fresh biomass and yield are indicated.
Agronomy 12 00761 g0a1
Figure A2. Average fruit size (equatorial diameter, mm) versus total yield (kg∙tree−1) for each tree under study during the four years of trials (N = 219). The model equation that describes the relationship between fruit size and yield is indicated.
Agronomy 12 00761 g0a2

References

  1. FAOSTAT. 2021. Available online: http://www.fao.org/faostat/en/#data/QC (accessed on 5 July 2021).
  2. Fernández-Zamudio, M.A. La citricultura valenciana, la evolución de sus costes de producción e insumos que los determinan. Levante Agrícola 2021, 455, 57–62. (In Spanish) [Google Scholar]
  3. Junta de Andalucía, Consejería de Agricultura, Ganadería, Pesca y Desarrollo Sostenible. Observatorio de Precios y Mercados—Cítricos. Available online: https://www.juntadeandalucia.es/agriculturaypesca/observatorio/servlet/FrontController?action=Static&subsector=21&url=subsector.jsp (accessed on 10 February 2022). (In Spanish).
  4. Juste, F.; Martín, B.; Fabado, F.; Moltó, E. Estudio sobre la reducción de los costes de producción de cítricos mediante la mecanización de las prácticas de cultivo. Comunitat Valencia. Agrar. 2000, 12, 23–29. (In Spanish) [Google Scholar]
  5. Soro, R. Panorama actual citrícola. Phytoma 2019, 307, 16–17. (In Spanish) [Google Scholar]
  6. Caballero, P.; de-Miguel, M.D.; Fernández-Zamudio, M.A. Análisis de los costes de producción de cítricos y posibles actuaciones empresariales. Vida Rural 2011, 328, 52–57. (In Spanish) [Google Scholar]
  7. Chueca, P.; Castro García, S.; Martin-Gorriz, B.; Torregrosa, A.; Mateu, G.; González-González, M.G.; Garcerá, C. La mecanización de los tratamientos fitosanitarios, la poda y la recolección: Presente y futuro. In Una Hoja de Ruta Para la Citricultura Española; García, J.M., Moltó, E., Eds.; Fundación Cajamar: Almería, Spain, 2020; pp. 177–190. (In Spanish) [Google Scholar]
  8. Caballero, P.; Carmona, B.; Fernández-Zamudio, M.A. Opciones en la reducción de los costes de producción y sus efectos en la competitividad y en la rentabilidad de los agrios. Levante Agrícola 2010, 403, 376–386. (In Spanish) [Google Scholar]
  9. Mateu, G.; Caballero, P.; Torregrosa, A.; Segura, B.; Juste, F.; Chueca, P. Análisis de la influencia de las operaciones de cultivo sobre los costes de producción en la citricultura de la Comunidad Valenciana. Levante Agrícola Rev. Int. Cítricos 2018, 440, 60–64. (In Spanish) [Google Scholar]
  10. Martin-Gorriz, B.; Martínez-Barba, C.; Torregrosa, A. Lemon trees response to different long-term mechanical and manual pruning practices. Sci. Hortic. 2021, 275, 109700. [Google Scholar] [CrossRef]
  11. Chueca, P.; Mateu, G.; Garcerá, C.; Fonte, A.; Ortiz, C.; Torregrosa, A. Yield and Economic Results of Different Mechanical Pruning Strategies on “Navel Foyos” Oranges in the Mediterranean Area. Agriculture 2021, 11, 82. [Google Scholar] [CrossRef]
  12. Intrigliolo, F.; Roccuzzo, G. Modern trends of citrus pruning in Italy. Adv. Hort. Sci. 2011, 25, 187–192. [Google Scholar]
  13. Bevington, K.B.; Bacon, P.E. Effect of hedging on the productivity of Valencia orange trees. Am. J. Expt. Agric. Anim. Husb. 1978, 18, 591–596. [Google Scholar] [CrossRef]
  14. Agustí, M.; Martínez-Fuentes, A.; Reig, C.; Iglesias, D.J.; Primo-Millo, E.; Mesejo, C. Alleviation of alternate bearing in Citrus by means of mechanical pruning. In Proceedings of the International Symposium on Flowering, Fruit Set and Alternate Bearing, Palermo, Italy, 19–23 June 2017. [Google Scholar]
  15. Monselise, S.P.; Goldschmidt, E.E. Alternate bearing in fruit trees. Am. Soc. Hortic. Sci. 1982, 4, 128–173. [Google Scholar]
  16. Mesejo, C.; Martínez-Fuentes, A.; Reig, C.; Balasch, S.; Primo-Millo, E.; Agustí, A. Mechanical pruning attenuates alternate bearing in ‘Nadorcott’ mandarin. Sci. Hortic. 2020, 261, 108993. [Google Scholar] [CrossRef]
  17. Fallahi, E.; Kilby, M. Rootstock and pruning influence on yield and fruit quality of ‘Lisbon’ lemon. Fruit Var. J. 1997, 51, 242–246. [Google Scholar]
  18. Vashisth, T.; Zekri, M.; Alferez, F. 2021–2022 Florida Citrus Production Guide: Canopy Management: Chapter 19, CMG16/HS1303, Rev. 4/2021. EDIS 2021, 4. Available online: https://edis.ifas.ufl.edu/pdf/HS/HS1303/HS1303-Dxj7z1csni.pdf (accessed on 18 February 2022). [CrossRef]
  19. Morales, P.; Davies, F.S.; Littell, R.C. Pruning and skirting affect canopy microclimate, yield and fruit quality of “Orlando” tangelo. HortScience 2000, 35, 30–35. [Google Scholar] [CrossRef]
  20. Phillips, P.A.; O’Connell, N.V.; Menge, J.A. Citrus skirt pruning—A management technique for Phytophthora brown rot. Calif. Agric. 1990, 44, 6–7. [Google Scholar] [CrossRef]
  21. Krajewski, A.; Pittaway, T. Manipulation of citrus flowering and fruiting by pruning. In Proceedings of the International Citrus Congresses, Orlando, FL, USA, 3–7 December 2000; Volume 1, pp. 357–360. [Google Scholar]
  22. Martin-Gorriz, B.; Porras Castillo, I.; Torregrosa, A. Effect of mechanical pruning on the yield and quality of ‘Fortune’ mandarins. Span. J. Agric. Res. 2014, 12, 952–959. [Google Scholar] [CrossRef]
  23. Tucker, D.P.H.; Wheaton, T.A.; Muraro, R.P. Citrus Tree Pruning Principles and Practices. UF Coop Ext. Ser.; Fact Sheet HS-144. 1994, p. 9. Available online: http://ufdcimages.uflib.ufl.edu/IR/00/00/46/22/00001/CH02700.PDF (accessed on 18 February 2022).
  24. Zekri, M. Mechanical Pruning of Citrus Trees. UF Coop Ext. Ser. HS1267. 2018. Available online: https://edis.ifas.ufl.edu/publication/HS1267 (accessed on 18 February 2022).
  25. Prosser, D. Hedging practices in Florida citrus groves. Calif. Citrogr. 1955, 40, 292. [Google Scholar]
  26. Moore, P.W.; Nauer, E. Mechanical hedging in California orchards. Calif. Citrogr. 1955, 40, 399. [Google Scholar]
  27. Moore, P.W. Mechanical pruning for citrus. Calif. Agric. 1958, 11, 7–13. [Google Scholar]
  28. Ortiz-Cañavate, J. Mechanical pruning of citrus. An. Inst. Nac. Investig. Agrar. Tecnol. Agrar. 1979, 5, 155–167. (In Spanish) [Google Scholar]
  29. Zaragoza, S.; Alonso, E. Citrus pruning in Spain. Proc. Int. Soc. Citric. 1981, 1, 172–175. [Google Scholar]
  30. Raciti, G.; Spina, P.; Scuderi, A.; Intrigliolo, F. Three years of mechanical pruning of citrus in Italy. Proc. Intl. Soc. Citricult. 1981, 1, 175–180. [Google Scholar]
  31. Spina, P.; Giuffrida, A.; Melita, E. Comparative trials of citrus mechanical and aided pruning. In Proceedings of the International Society of Citriculture 1, 1984, International Citrus Congress, Sao Paulo, Brazil, 15–20 July 1984; pp. 106–109. [Google Scholar]
  32. Wheaton, T.A.; Whitney, J.D.; Castle, W.S.; Tucker, D.P.H. Crosshedging, tree removal, and topping affect fruit yield and quality of citrus hedge rows. Proc. Intl. Soc. Citricult. 1984, 1, 109–114. [Google Scholar]
  33. Kallsen, C.E. Topping and manual pruning effects on the production of commercially valuable fruit in a midseason Navel Orange variety. HorTecnology 2005, 15, 335–341. [Google Scholar] [CrossRef]
  34. Mendonça, V.; Ramos, J.D.; Neto, S.E.A.; Rufini, J.C.M. Production of ‘Poncan’ tangerine tree after pruning recovery. Cienc. Agrotecnol. 2008, 32, 103–109. [Google Scholar] [CrossRef] [Green Version]
  35. Yildirim, B.; Yesiloglu, T.; Incesu, M.; Kamiloglu, M.; Ozguven, F.; Tuzcu, O.; Kaçar, Y.A. The effects of mechanical pruning on fruit yield and quality in ‘Star Ruby’ grapefruit. J. Food Agric. Environ. 2010, 8, 834–838. [Google Scholar]
  36. Velázquez, B.; Fernández, E. The influence of mechanical pruning in cost reduction, production of fruit, and biomass waste in citrus orchards. Appl. Eng. Agric. 2010, 26, 531–540. [Google Scholar] [CrossRef]
  37. Agustí, M.; Zaragoza, S.; Bleiholder, H.; Buhr, L.; Hack, H.; Klose, R.; Stauß, R. Codificación BBCH de los Estadios Fenológicos del Desarrollo de los Agrios (Gén. Citrus). Ficha Técnica. Serie Citricultura Nº 6. Generalitat Valenciana. Conselleria d’Agricultura, Peixca i Alimentació. 1995. Available online: https://agroambient.gva.es/documents/163228750/167772287/Codificaci%C3%B3n+BBCH+de+los+estadios+fenol%C3%B3gicos+del+desarrollo+de+los+agrios/127b4d39-2bcc-4206-9537-247e049f7649 (accessed on 27 January 2021). (In Spanish).
  38. Cubero, S.; Moltó, E.; Gutiérrez, A.; Aleixos, N.; García-Navarrete, O.L.; Juste, F.; Blasco, J. Real-time inspection of fruit on a mobile harvesting platform in field conditions using computer vision. Prog. Agric. Eng. Sci. 2010, 6, 1–16. [Google Scholar]
  39. Cubero, S.; Aleixos, N.; Albert, F.; Torregrosa, A.; Ortiz, C.; García-Navarrete, O.; Blasco, J. Optimised computer vision system for automatic pre-grading of citrus fruit in the field using a mobile platform. Precis. Agric. 2014, 15, 80–94. [Google Scholar] [CrossRef] [Green Version]
  40. Cámara de Valencia. Lonja de Cítricos. Información de la Mesa de Precios de Cítricos del Consulado de la Lonja de Valencia. 2021. Available online: http://www.precioscitricos.com/indexp.asp (accessed on 4 August 2021). (In Spanish).
  41. Velázquez-Martí, B.; Fernández-González, E.; López-Cortés, I.; Callejón-Ferre, A. Prediction and evaluation of biomass obtained from citrus trees pruning. J. Food Agric. Environ. 2013, 11, 1485–1494. [Google Scholar]
  42. Zaragoza, S.; Alonso, E. La poda mecanizada de los agrios en España. An. Inst. Nac. Investig. Agrar. Ser. Prod. Veg. 1980, 12, 157–180. (In Spanish) [Google Scholar]
  43. Agustí, M.; Mesejo, C.; Reig, C. Citricultura, 3rd ed.; Ediciones Mundi-Prensa: Madrid, Spain, 2020. (In Spanish) [Google Scholar]
  44. Ahmad, S.; Chatha, Z.A.; Nasir, M.A.; Aziz, A.; Virk, N.A.; Khan, A.R. Effect of pruning on the yield and quality of Kinnow fruit. J. Agric. Soc. Sci. 2006, 2, 51–53. [Google Scholar]
Figure 1. Intervention sequences by pruning strategy and year. Legend: 1 C = control (no pruning); 2 M = manual pruning; 3 TFF = topping and manual follow-up pruning of a complete tree; 4 TH = topping and one-sided hedging, alternating annually between sides (East/West); 5 TH/M = alternating annually between TH and M; 6 THF = TH plus manual follow-up pruning of the non-hedged side; 7 THH = topping and bilateral hedging; 8 THH/M = alternating annually between THH and M; 9 HH = bilateral hedging; 10 HH/M = alternating annually between HH and M; 11 H = one-sided hedging, alternating annually between sides (East/West); 12 H/M = alternating annually between H and M.
Agronomy 12 00761 g001
Figure 2. Tractor-mounted pruning machine used in the trials: (a) hedging cutting; (b) topping cutting; (c) articulated arm with six cutting discs.
Agronomy 12 00761 g002
Figure 3. Canopy dimensions: (a) side view across the row of a standard citrus trees and (b) top view of a citrus orchard.
Agronomy 12 00761 g003
Figure 4. Yield (kg∙tree−1) (average value—indicated numerically within the column—with standard error bar) by pruning strategy (1–12) and the average for all strategies, for each year and for the four years overall. Different lowercase letters above the bars for each year and four-year overall indicate significant differences (LSD test, p < 0.05). Different capital letters above the bars of the averages of all strategies for each year indicate significant differences (median notched box plot, p < 0.05).
Agronomy 12 00761 g004
Figure 5. Fruit size (equatorial diameter, mm) (average value—indicated numerically within the column—with standard error bar) by pruning strategy (1–12) and the average for all strategies, for each year and for the four years overall. Different lowercase letters above the bars for each year and four-year overall indicate significant differences (LSD test, p < 0.05). Different capital letters above the bars of the averages of all strategies for each year indicate significant differences (LSD test, p < 0.05).
Agronomy 12 00761 g005
Table 1. Nomenclature and definition of pruning strategies (1–12).
Pruning StrategyDefinition
Nomenclature 1
1CControl (no pruning).
2MManual pruning.
3TFFTopping and manual follow-up pruning of a complete tree.
4THTopping and one-sided hedging, alternating annually between sides (East/West).
5TH/MAlternating annually between TH and M.
6THFTH plus manual follow-up pruning of the nonhedged side.
7THHTopping and two-sided hedging.
8THH/MAlternating annually between THH and M.
9HHTwo-sided hedging.
10HH/MAlternating annually between HH and M.
11HOne-sided hedging, alternating annually between sides (East/West).
12H/MAlternating annually between H and M.
1 C = control; F = manual follow-up; H = hedging; M = manual; T = topping; / = annual alternation.
Table 2. Dates of the canopy dimension measurements, and dates of the pruning and BBCH citrus developmental stage at pruning times [37].
YearMeasurementPruningBBCH Stage
201720 March20 March55–56Flowers developing: flowers visible and flower petals elongating.
201826 February5–7 March11–15Leaves developing: first leaves visible but without reaching the final size.
201926 March27–29 March51–59Flowers developing: buds swell and burst, flowers visible and flower petals elongating, sepals open and flowers have closed petals and elongated ball shapes.
20206 March9–11 March51–59Flowers developing: buds swell and burst, flowers visible and flower petals elongating, sepals open and flowers have closed petals and elongated ball shapes.
Table 3. Average prices of ‘Clemenules’ citrus fruit at the corresponding harvesting dates for each trial season in Valencia [40].
YearHarvesting DateMandarins Price DateMandarins Price (€∙kg−1)
20171 December4 December0.294
20188 November12 November0.235
201927–28 November2 December0.388
202010–11 November16 November0.282
Table 4. Characterization of the canopy size before pruning for each pruning strategy and year. Data are expressed as averages, with standard errors in parentheses. H = canopy height; ØC = canopy across-row diameter; ØL = canopy along-row diameter. Different letters between pruning strategies for canopy volume for each year indicate significant differences 1 according to Fisher’s LSD test with 95% confidence intervals.
YearPruning
Strategy
H
(m)
ØC
(m)
ØL
(m)
Canopy
Volume
(m3∙tree−1)
20171C2.67 (0.19)4.47 (0.24)3.03 (0.38)18.49 (0.93) bc
2M2.65 (0.10)4.80 (0.17)3.27 (0.26)21.58 (0.79) ab
3TFF2.60 (0.10)4.73 (0.09)3.73 (0.19)24.23 (2.63) a
4TH2.53 (0.06)4.50 (0.21)3.97 (0.17)23.69 (1.67) a
5TH/M
6THF2.57 (0.14)4.37 (0.18)3.13 (0.09)18.41 (1.48) bc
7THH2.37 (0.06)4.37 (0.13)3.33 (0.03)18.01 (0.38) bc
8THH/M
9HH2.37 (0.09)4.33 (0.20)2.97 (0.32)15.90 (1.90) c
10HH/M
11H2.52 (0.02)4.53 (0.23)3.00 (0.06)17.95 (1.23) bc
12H/M
20181C3.39 (0.13)4.68 (0.30)2.88 (0.18)24.49 (3.63) a
2M3.25 (0.15)4.40 (0.11)2.88 (0.18)21.76 (2.58) a
3TFF3.33 (0.04)4.74 (0.13)3.00 (0.24)25.00 (2.74) a
4TH3.44 (0.08)4.76 (0.14)2.80 (0.18)24.09 (1.99) a
5TH/M
6THF3.38 (0.07)4.48 (0.25)2.90 (0.07)23.06 (2.05) a
7THH3.43 (0.15)4.42 (0.15)3.06 (0.12)24.41 (2.00) a
8THH/M
9HH3.36 (0.13)4.58 (0.16)3.12 (0.09)25.18 (1.74) a
10HH/M
11H3.32 (0.05)4.64 (0.13)2.96 (0.11)23.94 (1.43) a
12H/M
20191C3.14 (0.19)4.77 (0.11)3.05 (0.19)24.19 (3.09) a
2M2.59 (0.03)4.77 (0.03)2.85 (0.15)18.43 (1.05) a
3TFF2.76 (0.10)4.67 (0.21)2.97 (0.18)19.88 (0.28) a
4TH2.95 (0.24)4.60 (0.06)2.88 (0.25)20.29 (1.28) a
5TH/M2.66 (0.12)4.70 (0.12)3.07 (0.33)19.88 (0.98) a
6THF3.04 (0.05)4.27 (0.09)2.92 (0.17)19.78 (1.01) a
7THH3.26 (0.17)4.38 (0.07)2.90 (0.06)21.77 (1.84) a
8THH/M2.93 (0.04)4.70 (0.13)2.53 (0.24)18.20 (1.23) a
9HH3.03 (0.16)4.38 (0.03)2.53 (0.02)17.63 (1.02) a
10HH/M2.65 (0.16)4.60 (0.22)3.05 (0.06)19.32 (0.26) a
11H3.26 (0.13)4.57 (0.17)3.05 (0.13)23.75 (1.26) a
12H/M2.89 (0.14)4.77 (0.02)3.25 (0.28)23.49 (2.48) a
20201C3.12 (0.15)4.87 (0.10)3.12 (0.10)24.99 (2.19) a
2M2.91 (0.08)4.64 (0.10)3.19 (0.11)22.44 (0.59) a
3TFF2.73 (0.05)4.56 (0.14)3.14 (0.07)20.46 (0.71) a
4TH2.96 (0.05)4.60 (0.11)2.94 (0.17)20.99 (1.47) a
5TH/M2.77 (0.11)4.62 (0.07)3.12 (0.15)20.91 (1.52) a
6THF2.87 (0.05)4.36 (0.13)3.18 (0.20)20.77 (1.06) a
7THH3.09 (0.04)4.30 (0.06)3.22 (0.18)22.44 (1.44) a
8THH/M2.87 (0.05)4.38 (0.06)3.40 (0.19)22.31 (0.87) a
9HH3.33 (0.08)4.34 (0.09)3.10 (0.16)23.34 (0.65) a
10HH/M3.08 (0.03)4.32 (0.08)3.02 (0.16)21.04 (1.22) a
11H3.30 (0.06)4.54 (0.15)3.20 (0.24)25.14 (2.13) a
12H/M3.13 (0.08)4.50 (0.17)3.22 (0.12)23.68 (0.96) a
1 ANOVA results for canopy volume each year: 2017—F = 3.88; df = 7, 23; p = 0.0118; 2018—F = 0.2; df = 7, 37; p = 0.983; 2019—F = 2.14; df = 11, 35; p = 0.0575; 2020—F = 1.49; df = 11, 59; p = 0.1669.
Table 5. Diameter of the cutting area (Øbranches, mm) and length (Lbranches, cm) of cut branches by type of cutting, for each year and for the four years overall. Branches were chosen from pruning strategies in which there was no annual alternation between manual and mechanical pruning. Data are expressed as averages, with standard errors in parentheses. Different letters between types of cutting for Øbranches and Lbranches indicate significant differences (p < 0.05) according to the median notched box plot for each year 1 and according to Fisher’s LSD test for the 4-year overall 2.
YearType of CuttingØbranches (mm)Lbranches (cm)
2017Hedging8.90 (0.30) b56.43 (1.54) d
Topping9.51 (0.45) b62.37 (2.48) c
Manual follow-up16.47 (0.62) a104.44 (2.53) b
Manual17.63 (0.80) a121.30 (3.88) a
2018Hedging6.87 (0.26) b45.92 (0.98) c
Topping5.77 (0.24) c63.20 (1.77) b
Manual follow-up20.12 (0.82) a125.50 (3.25) a
Manual17.86 (0.99) a140.90 (5.09) a
2019Hedging5.58 (0.26) c35.55 (1.61) c
Topping7.77 (0.25) b82.12 (2.64) b
Manual follow-up21.77 (0.79) a110.71 (3.29) a
Manual21.62 (1.21) a132.14 (7.29) a
2020Hedging5.78 (0.20) b37.00 (1.36) d
Topping5.92 (0.16) b48.90 (1.40) c
Manual follow-up21.86 (1.00) a111.11 (3.51) b
Manual23.15 (1.67) a141.00 (6.01) a
4-yearsHedging6.78 (0.76) b43.72 (4.81) d
Topping7.24 (0.88) b64.15 (6.83) c
Manual follow-up20.06 (1.26) a112.94 (4.46) b
Manual20.06 (1.38) a133.84 (4.67) a
1 Kruskal–Wallis results for each year (2017–2020): p < 0.001. 2 ANOVA results for the 4-year overall: ØbranchesF = 46.95; df = 3, 15; p < 0.001; LbranchesF = 62.81; df = 3, 15; p < 0.001.
Table 6. Pruned fresh biomass (kg∙tree−1) by pruning strategy for each year and for the four years overall. Data are expressed as averages, with standard errors in parentheses. Different letters between pruning strategies indicate significant differences (p < 0.05) according to Fisher’s LSD test for each year 1 and according to median notched box plot for the 4-year overall 2.
Pruning StrategyPruned Fresh Biomass (kg∙tree−1)
20172018201920204-Years
1C
2M24.83 (0.94) a17.29 (0.51) cd32.06 (1.44) a33.66 (4.28) b26.96 (3.75) a
3TFF21.53 (1.44) a13.80 (1.91) d28.49 (4.95) a23.07 (2.21) c21.72 (3.03) a
4TH8.26 (0.73) cd6.39 (0.30) e16.01 (0.82) b9.84 (1.26) de10.13 (2.09) bc
5TH/M25.38 (0.70) ab7.59 (0.41) cd34.56 (0.95) b18.95 (6.64) abc
6THF16.13 (2.47) b20.92 (4.44) bc27.64 (3.11) a22.48 (1.08) c21.79 (2.37) a
7THH11.48 (1.99) c6.13 (0.71) e17.40 (1.10) b10.91 (0.90) d11.48 (2.31) b
8THH/M30.21 (3.16) a10.17 (0.59) c46.30 (2.23) a24.54 (8.58) abc
9HH5.62 (0.68) d3.10 (0.92) e3.64 (0.58) ef3.85 (0.74) ef4.05 (0.55) c
10HH/M23.75 (1.41) b5.04 (0.94) de32.33 (1.93) b16.68 (6.79) abc
11H3.92 (0.89) d4.35 (1.16) e2.25 (0.43) ef2.19 (0.21) f3.18 (0.56) c
12H/M24.83 (3.09) ab2.46 (0.68) ef33.80 (4.20) b16.25 (7.77) abc
1 ANOVA results for each year: 2017—F = 30.31; df = 6, 20; p < 0.001; 2018—F = 21.57; df = 10, 32; p < 0.001; 2019 (significant differences based on square-root-transformed data)—F = 55.91; df = 10, 32; p < 0.001; 2020—F = 42.58; df = 10, 32; p < 0.001. 2 Kruskal–Wallis result for the 4-year average: p = 0.01123.
Table 7. Percentage of fresh weight of biomass of leaves and wood of the cut branches and their percentage of moisture, by type of cutting and globally. Data are expressed as averages, with standard errors in parentheses. Different letters in a column indicate significant differences between types of cutting for each parameter 1 according to Fisher’s LSD test (p < 0.05).
Type of CuttingFresh Leaf Biomass (%)Fresh Wood
Biomass (%)
Leaf Biomass Moisture (%)Wood Biomass Moisture (%)
Hedging47.98 (2.54) a52.02 (2.54) a57.74 (1.19) c59.29 (0.94) a
Topping59.45 (2.25) a40.55 (2.25) a59.52 (0.58) bc55.89 (1.99) a
Manual follow-up59.66 (2.04) a40.34 (2.04) a70.84 (1.95) a34.46 (0.70) b
Manual58.78 (5.55) a41.22 (5.55) a64.04 (2.72) b30.82 (2.29) b
GLOBAL56.47 (1.93)43.53 (1.93)63.04 (1.42)45.12 (2.99)
1 ANOVA results for fresh leaf biomass (%): F = 2.77; df = 3, 19; p = 0.0756; fresh wood biomass (%): F = 2.77; df = 3, 19; p = 0.0756; leaf biomass moisture (%): F = 10.54; df = 3, 19; p = 0.0005; wood biomass moisture (%): F = 79.9; df = 3, 19; p < 0.001.
Table 8. Four-year average estimated productive pruning time (min∙tree−1∙operator−1), pruning theoretical working capacity (TWC, tree∙h−1∙operator−1), work performance (h∙operator∙ha−1), and pruning cost (€∙ha−1) for each pruning strategy. Data are expressed as averages.
Pruning
Strategy
Productive Time
(min∙tree−1∙operator−1)
TWC
(tree∙h−1∙operator−1)
Work Performance (h∙operator∙ha−1)Pruning Cost
(€∙ha−1)
1C
2M5.4810.9450.82401.52
3TFF5.6910.5552.68474.02
4TH0.28214.152.60101.26
5TH/M2.88112.544.94251.39
6THF3.0219.8528.01302.02
7THH0.36166.793.33130.01
8THH/M2.9288.866.26265.76
9HH0.16377.111.4757.50
10HH/M2.82194.022.87229.51
11H0.08754.210.7428.75
12H/M2.78382.581.45215.13
Table 9. Net value + k (€∙ha−1) for each pruning strategy, for each year and for the four years overall. Data are expressed as 95% confidence interval. The graphic represents the data for the 4-year overall (average value with 95% confidence interval bar). Different letters indicate significant differences between pruning strategies (LSD test, p < 0.05).
Pruning
Strategy
Net Value + k (€∙ha−1)
20172018201920204-years →
1C19,771–23,66613,148–17,0308237–11,88513,295–17,98210,948–20,305 Agronomy 12 00761 i001
2M15,801–19,90012,208–14,9387737–16,82415,463–17,92112,545–17,653
3TFF9423–13,06113,723–16,4636862–13,59210,824–13,41610,116–14,225
4TH8103–12,46111,837–14,4139661–11,5877257–10,3438948–12,467
5TH/M13,934–16,0857717–15,16516,140–23,0919972–18,202
6THF10,531–12,08612,915–14,3238433–14,5487255–89488900–13,359
7THH7838–11,92111,604–16,6566772–12,9394248–64906303–13,314
8THH/M13,203–17,6069256–15,42013,527–17,92310,628–16,046
9HH16,172–19,18112,515–18,6184090–12,8983575–68195985–17,482
10HH/M13,032–14,4514404–11,94610,250–17,3549517–17,180
11H14,902–21,78512,351–17,1481484–96368215–85506041–17,477
12H/M12,645–14,9507267–10,00013,672–16,3349996–17,893
Publisher’s Note: MDPI stays neutral with regard to jurisdictional claims in published maps and institutional affiliations.

