Article

Spatial Variation and Influencing Factors of Trace Elements in Farmland in a Lateritic Red Soil Region of China

1
College of Natural Resources and Environment, South China Agricultural University, Guangzhou 510642, China
2
South China Academy of Natural Resources Science and Technology, Guangzhou 510642, China
3
College of Tropical Crops, Hainan University, Haikou 570208, China
*
Author to whom correspondence should be addressed.
Agronomy 2022, 12(2), 478; https://doi.org/10.3390/agronomy12020478
Submission received: 9 December 2021 / Revised: 10 February 2022 / Accepted: 11 February 2022 / Published: 14 February 2022
(This article belongs to the Special Issue Soil Sustainability in the Anthropocene)

Abstract

:
Trace elements in farmland soil are important indicators of soil quality and farmland health, and also maintain the nutrient balance and promote the healthy growth of plants. In this study, taking Conghua District of Guangzhou city as the study area, the effects of topography, soil, land use, and other factors on trace elements in soil were investigated, and the spatial variability of boron (B), manganese (Mn), molybdenum (Mo), copper (Cu), and zinc (Zn) in farmland soil in a typical red soil region were mapped using a geographically weighted regression (GWR) method. The pH and land economic index (LEI) were important factors affecting the changes in trace element concentrations in the five soils, and the Cu and Zn concentrations were clearly affected by human factors. In the study area, 86.99% of B measurements were classified as low and very low levels, 50.61% and 49.20% of Mo measurements were also low and very low, 71.79% of Mn measurements were classified as moderate, while 91.02% of Cu and 52.95% of Zn measurements were classified as high. After a cross validation, the GWR Kriging (GWRK) model results of each element were relatively stable, and the order of the fitting coefficient (R2) was Cu > Zn > B> Mn > Mo. This study clarifies the spatial distribution and influencing factors of soil microelements in the studied region. This information can be used to improve the nutrient imbalance, further guide agricultural production, strengthen the management of farmland, and improve the healthy productivity of cultivated land.

1. Introduction

Trace elements in farmland soils are important environmental indicators [1,2], and are also used to characterize soil quality [3,4]. The abundance/deficiency of each trace element in the soil directly affects the growth and development of crops, as well as human health to a certain extent [5]. In recent years, due to natural disasters and long-term overexploitation, the fertility, productivity, and quality of soils in China has declined. Soil health issues, particularly the spatial variability of trace elements and their influencing factors, have attracted increasing attention from researchers worldwide [6,7,8]. Due to the combined effect of soil formation processes and human factors, the distribution of trace elements in different regions and on different scales has a certain spatial heterogeneity [9,10]. Therefore, it is of great significance to accurately describe the spatial variability of trace elements in farmland and clarify the influence of various factors on the evolution of trace elements in the farmland ecosystem to improve the yield and quality of plants, implement field management, and increase farmland health and productivity.
In studies of the spatial variability of trace elements in soil, geostatistical methods have been widely used to analyze the spatial variability of regional variables [11,12,13,14,15]. Correlation analysis, single factor analysis of variance (ANOVA), geostatistics, and geographic information system (GIS) technology have been used to systematically analyze the spatial variability of trace elements in cultivated land in Jiangxi Province, and their influence in terms of topographical, chemical, soil-forming, and random factors [5]. With the development of digital soil mapping technology, spatial measurement models based on data-mining algorithms have become more widely used in soil spatial mapping [16,17]. Machine-learning methods have been used to map and analyze the main soil properties that affect crop growth, such as organic matter, plant essential nutrients, and trace elements. One study identified the soil properties that were related to plant growth and protection [18]. Another study used soil sampling data, remote sensing data, and ground spectral data as predictors in digital soil mapping research, employing tree structure-based data mining technology, and found that mapping accuracy was significantly better than that using ordinary Kriging methods [19].
Previous studies have determined the spatial variability of trace elements in soil based on different methods, but most of them have only considered the impact of natural factors and have not considered the spatial variability caused by human factors. There is also uncertainty in how to reflect the overall change in soil properties based on information on combined natural and human-made factors. Zhao et al. [20] proposed a geographically weighted regression (GWR) method that used the location of sampling points to determine the spatial variability of soil attributes, effectively revealing some local changes that may have been hidden by spatial non-stationarity. The method has achieved good results for assessing spatial variation and for spatial mapping of soil organic carbon (SOC) and soil organic matter (SOM) [21,22,23].
Due to long-term application of large element chemical fertilizer which caused imbalance of soil trace elements and nutrients, the role of trace elements in soil in agricultural production has attracted more and more attention. Soil trace elements, such as copper (Cu), iron (Fe), manganese (Mn), and zinc (Zn), are important components of crop nutrients. At the same time, boron (B), manganese (Mn), and molybdenum (Mo) are essential nutrients for plant growth and play an important role in crop yield and product quality [2,5]. In the present study, we measured the trace elements, B, Mn, Mo, Cu, and Zn, in farmland soil in Conghua District, Guangzhou City, a typical red soiled hilly area. A land use index (LUI) and land economic index (LEI) were introduced based on topographical and soil chemical factors, with GWR methods used to determine the spatial variability of trace elements and their influencing factors. The results provide a reference for the protection and improvement of cultivated land in terms of health and productivity.

2. Materials and Methods
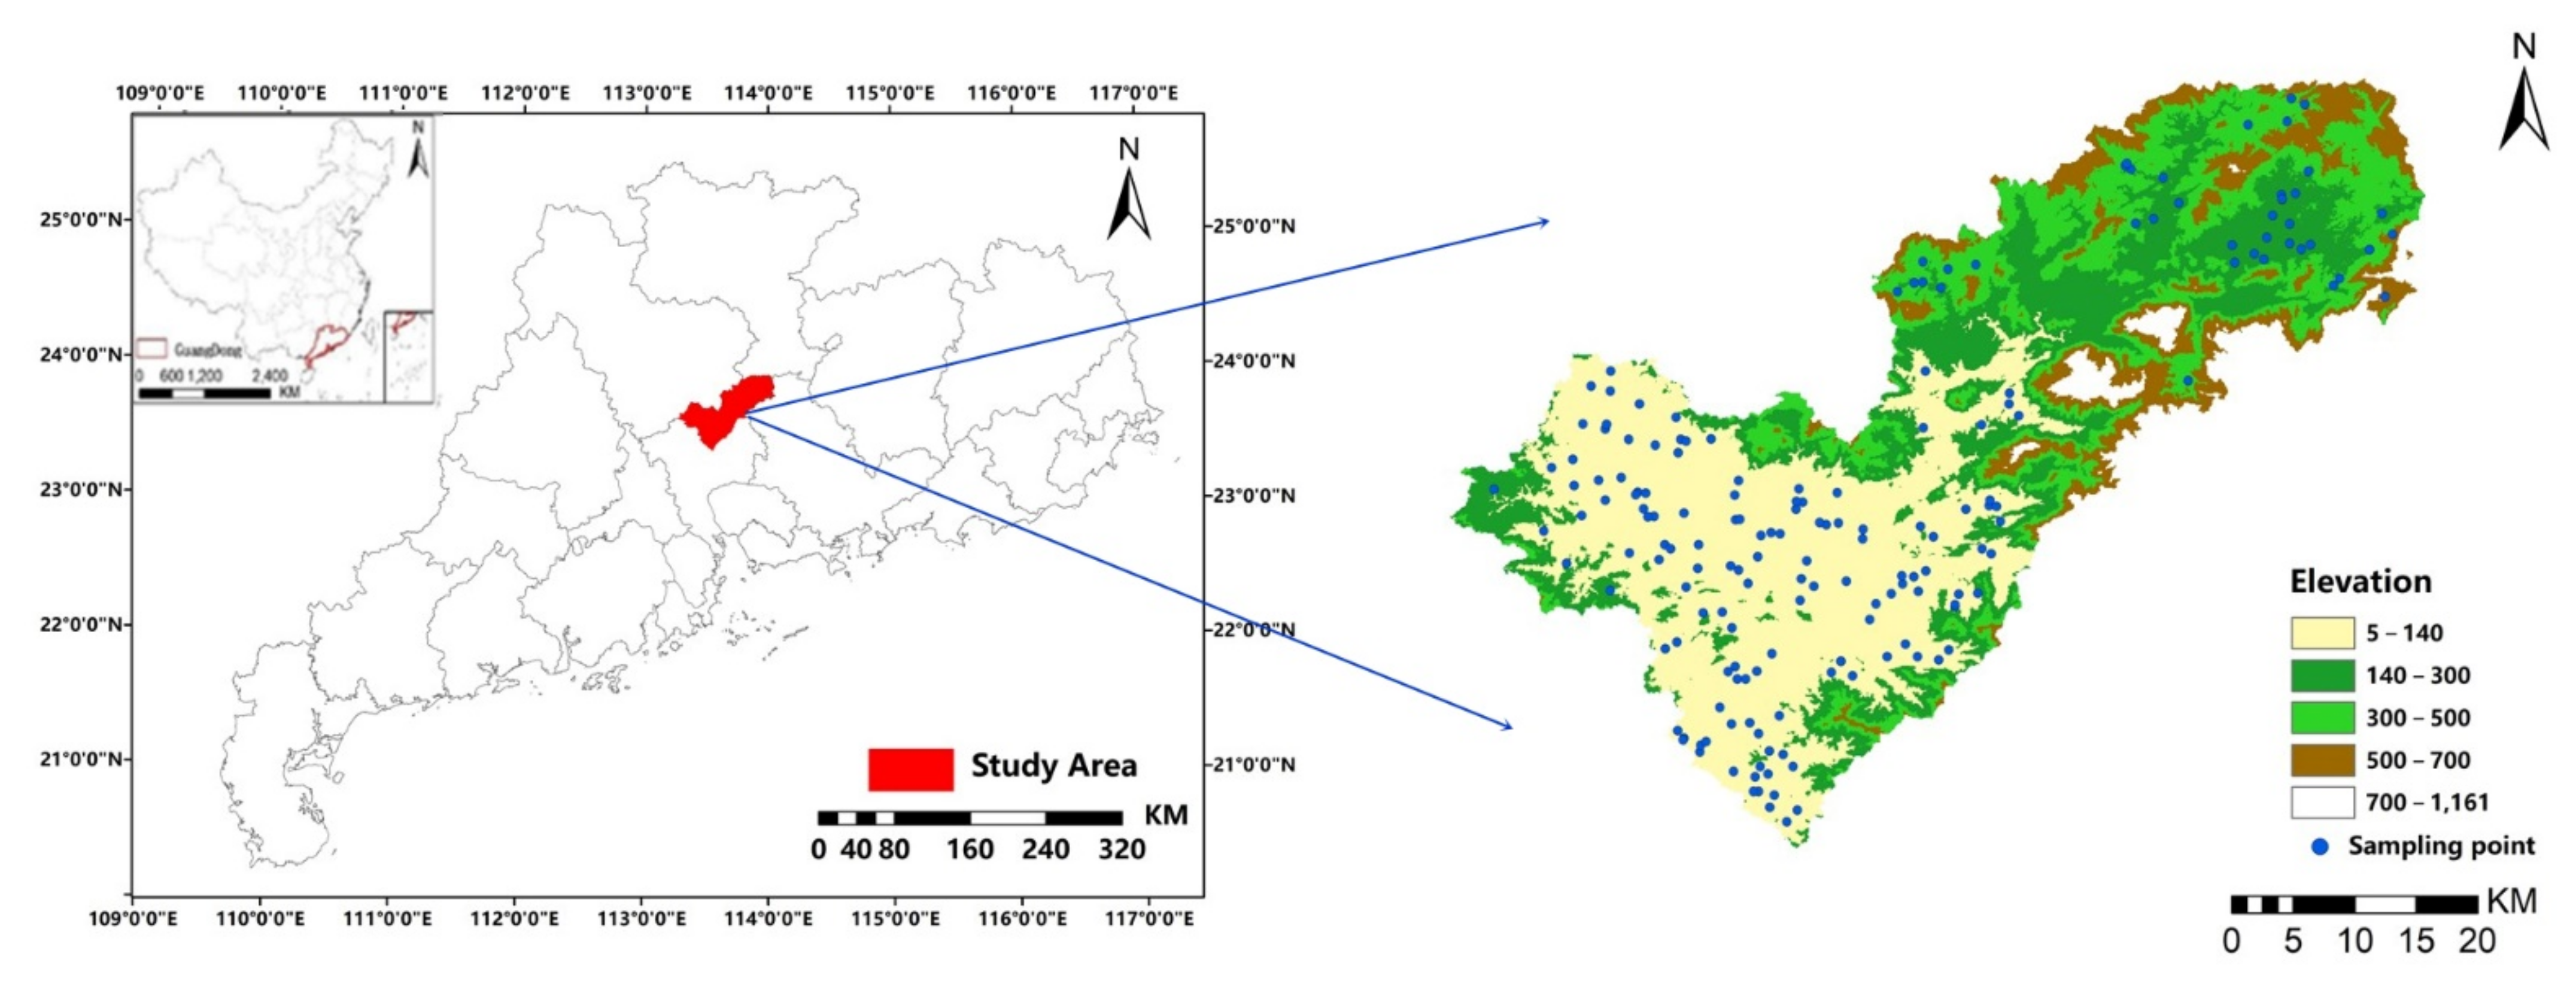
2.1. Study Area

Conghua District (E 113°17′–114°04′, N 23°22′–23°56′) is located in the central part of Guangdong Province, northeast of Guangzhou City. The terrain slopes from north to south. The topography is ladder-shaped, with the northeast dominated by mountains and hills, the center and south dominated by hills and valleys, and the west dominated by hills and terraces (Figure 1). The region has a subtropical monsoon climate, which is mild, with abundant rainfall throughout the year. The annual average temperature is 21.4 °C, the sunshine duration is 1857.2 h, the effective accumulated temperature is 6700 °C, the annual average rainfall is 2000 mm, and the evaporation is 1250 mm.
Paddy soil is the largest cultivated soil type in the district, with gleyic paddy soil sporadically distributed on the hillside terraces of moderate and low hills. The paddy soil is mainly distributed in the low mountain basin and valley alluvial plain in the north. Permeable paddy soil is mainly found in the high-altitude terrain of the hilly plain area, and gleyic paddy soil is distributed in pit fields in mountainous areas [24,25,26]. The natural vegetation in the district is a subtropical evergreen seasonal rain forest. The vegetation types mainly include coniferous and broad-leaved mixed forest, scattered Masson pine shrub grass slopes, hilly grass slopes, and mountain grass slopes. The abundant light and precipitation conditions, and a convenient transportation network, have contributed favorably to agricultural production in Conghua District, which has become an important grain production area in Guangdong Province.

2.2. Soil Sampling and Analysis

Soil samples were collected from July to October 2017. Combined with the soil types and topographic and geomorphic characteristics of the study area, 204 cultivated land surface soil samples (0–20 cm) were collected using a combination of grid point distribution and multi-point mixing (Figure 1), and the location of the sampling points was recorded by GPS. Based on the soil sampling requirements of the “Technical specification for cultivated land fertility investigation and quality evaluation” [27], the following sampling protocols were followed. Large areas of farmland were selected, sampling points were more than 100 m from roads and railways, and locations that would directly affect soil properties, such as composting sites and irrigation outlets, were avoided. After removing animal and plant residues and stones, soil samples were dried naturally at room temperature and uniformly screened by passing them through a 1 mm mesh after grinding.
The inductively coupled plasma mass spectrometry (ICP-MS) technique is a commonly used detection method for soil elemental analysis, with the advantages of low detection limit, high precision, wide linear range, low interference, and good stability. It can be used for rapid analysis and determination of multiple elements simultaneously. The test instrument used was an ELAN 9000 DRC II inductively coupled plasma mass spectrometer (Perkin Elmer Company, Norwalk, Connecticut, USA). Reagents include ultra-pure HNO3, superior pure perchloric acid (HCLO4), hydrofluoric acid (HF), concentration 50% hydrochloric acid (HCL), ultra-pure water, B, Mn, Mo, Cu, and Zn elements standard solutions, national soil standard substances like GBW 07403 (GSS-3), etc.
Sample preparation involved weighing 0.25 g of soil sample to be tested and adding 2:2:1:1 ultrapure water (H2O), hydrofluoric acid (HF), high-grade pure perchloric acid (HCLO4), ultrapure HNO3, and 50% hydrochloric acid (HCL) to digest on the electric heating plate until it is completely evaporated. Then 50% HCL solution was poured into the residue. The digestion solution was transferred to the test tube after heating and cooling, the volume with fixed with dilute HCL solution, and put on the machine for testing.
For precision assessment, the content of soil B, Mn, Mo, Cu, and Zn were determined by ICP-MS under optimized conditions, accompanied by a blank experiment, and the limit of detection for each element was obtained by multiplying the equivalent concentration of three times the standard deviation by a dilution factor (1000). The national soil standard GSS-3 was also digested and measured 10 times until the mean value, relative standard deviation, and relative error of each element tested were less than 5% to ensure the precision and accuracy of the assay.

2.3. Data Processing and Analysis Methods

The total number of data points was 204. In an ArcGIS 10.2 random classification, 80% of the samples were used as the modeling set and 20% of the samples were used as the verification set to verify the accuracy of the model. Then, modeling data were statistically analyzed using the SPSS 19.0 statistical software, and GWR models corresponding to trace elements as the dependent variable were constructed using GWR4.0 software. A Kriging spatial interpolation method was used to map and analyze the spatial variation in trace elements. Spatial variation semi variance analyses were used for model fitting using the GS + 9.0 software, where the model with the largest determination coefficient R2 and the smallest residual sum of squares was considered the optimal model with optimal parameters.
Geographically weighted regression is a spatial analysis technology that has increasingly been used in geography and related disciplines involving spatial data processing. A local regression equation was established at each point in the spatial range to reflect the spatial interaction between the independent and dependent variables [26,27], and was expressed as:
Y g w r u i , v i = β 0 u i , v i + z = 1 k β z ( u i , v i ) X k u i , v i
where ( u i , v i ) is the longitude and latitude of sample point i; βz( u i , v i ) is the continuous function of βz (u, v); z is the regression parameter value at sample point i; X k u i , v i is the actual value of the function X k (u, v) at sample point i; and k is the number of regression terms of sample point i. The weight of the model was determined by a Gaussian function, and the Akaike information criterion (AIC) method was selected to determine the most effective bandwidth.

2.4. Accuracy Assessment

Using the cross-validation method [28], the accuracy of the model was evaluated according to the mean error (ME), mean absolute error (MAE), and root mean square error (RMSE), which were calculated as follows:
ME = 1 N i = 1 N Z x i Z * x i
MAE = 1 N i = 1 N Z x i Z * x i
RMSE = 1 N i = 1 N Z x i Z * x i   2  
where N is the number of verification points, Z x i is the measured value of the ith verification point, and Z * x i is the predicted value. The ME is a measure of the bias of an interpolation; the closer it is to 0, the more unbiased the result. The MAE and RMSE are measures of interpolation accuracy; the smaller their values, the higher the interpolation accuracy of the model.

3. Results

3.1. Descriptive Statistics

Descriptive data are presented in Table 1 and the classification standards of the trace elements are given in Table 2. The B concentration in the study area was 0.08–0.89 mg·kg−1 (average, 0.42 mg·kg−1), which was classified as low. The Mn concentration was 3.20–46.72 mg·kg−1 (13.03 mg·kg−1), which was classified as moderate. The Mo concentration was 0.02–0.20 mg·kg−1 (0.10 mg·kg−1), which was classified as low, being less than the accepted critical value of 0.15 mg·kg−1. The Cu concentration was 0.30–11.42 mg·kg−1 (1.65 mg·kg−1), which was classified as high, indicating a rich Cu content in the soil in the study area. The Zn concentration was 0.57–12.13 mg·kg−1 (1.89 mg·kg−1), which was also classified as high.
The coefficient of variation is an important index reflecting the spatial variation in soil attributes. A coefficient of variation ≥100% indicates strong variation, 10–100% indicates moderate variation, and ≤10% indicates weak variation [29,30]. The coefficient of variation for the five trace elements were in the range of 40.00–64.02%, which indicates a moderate degree of variation. The degree of variation followed the order of Zn > Cu > Mn > B > Mo.

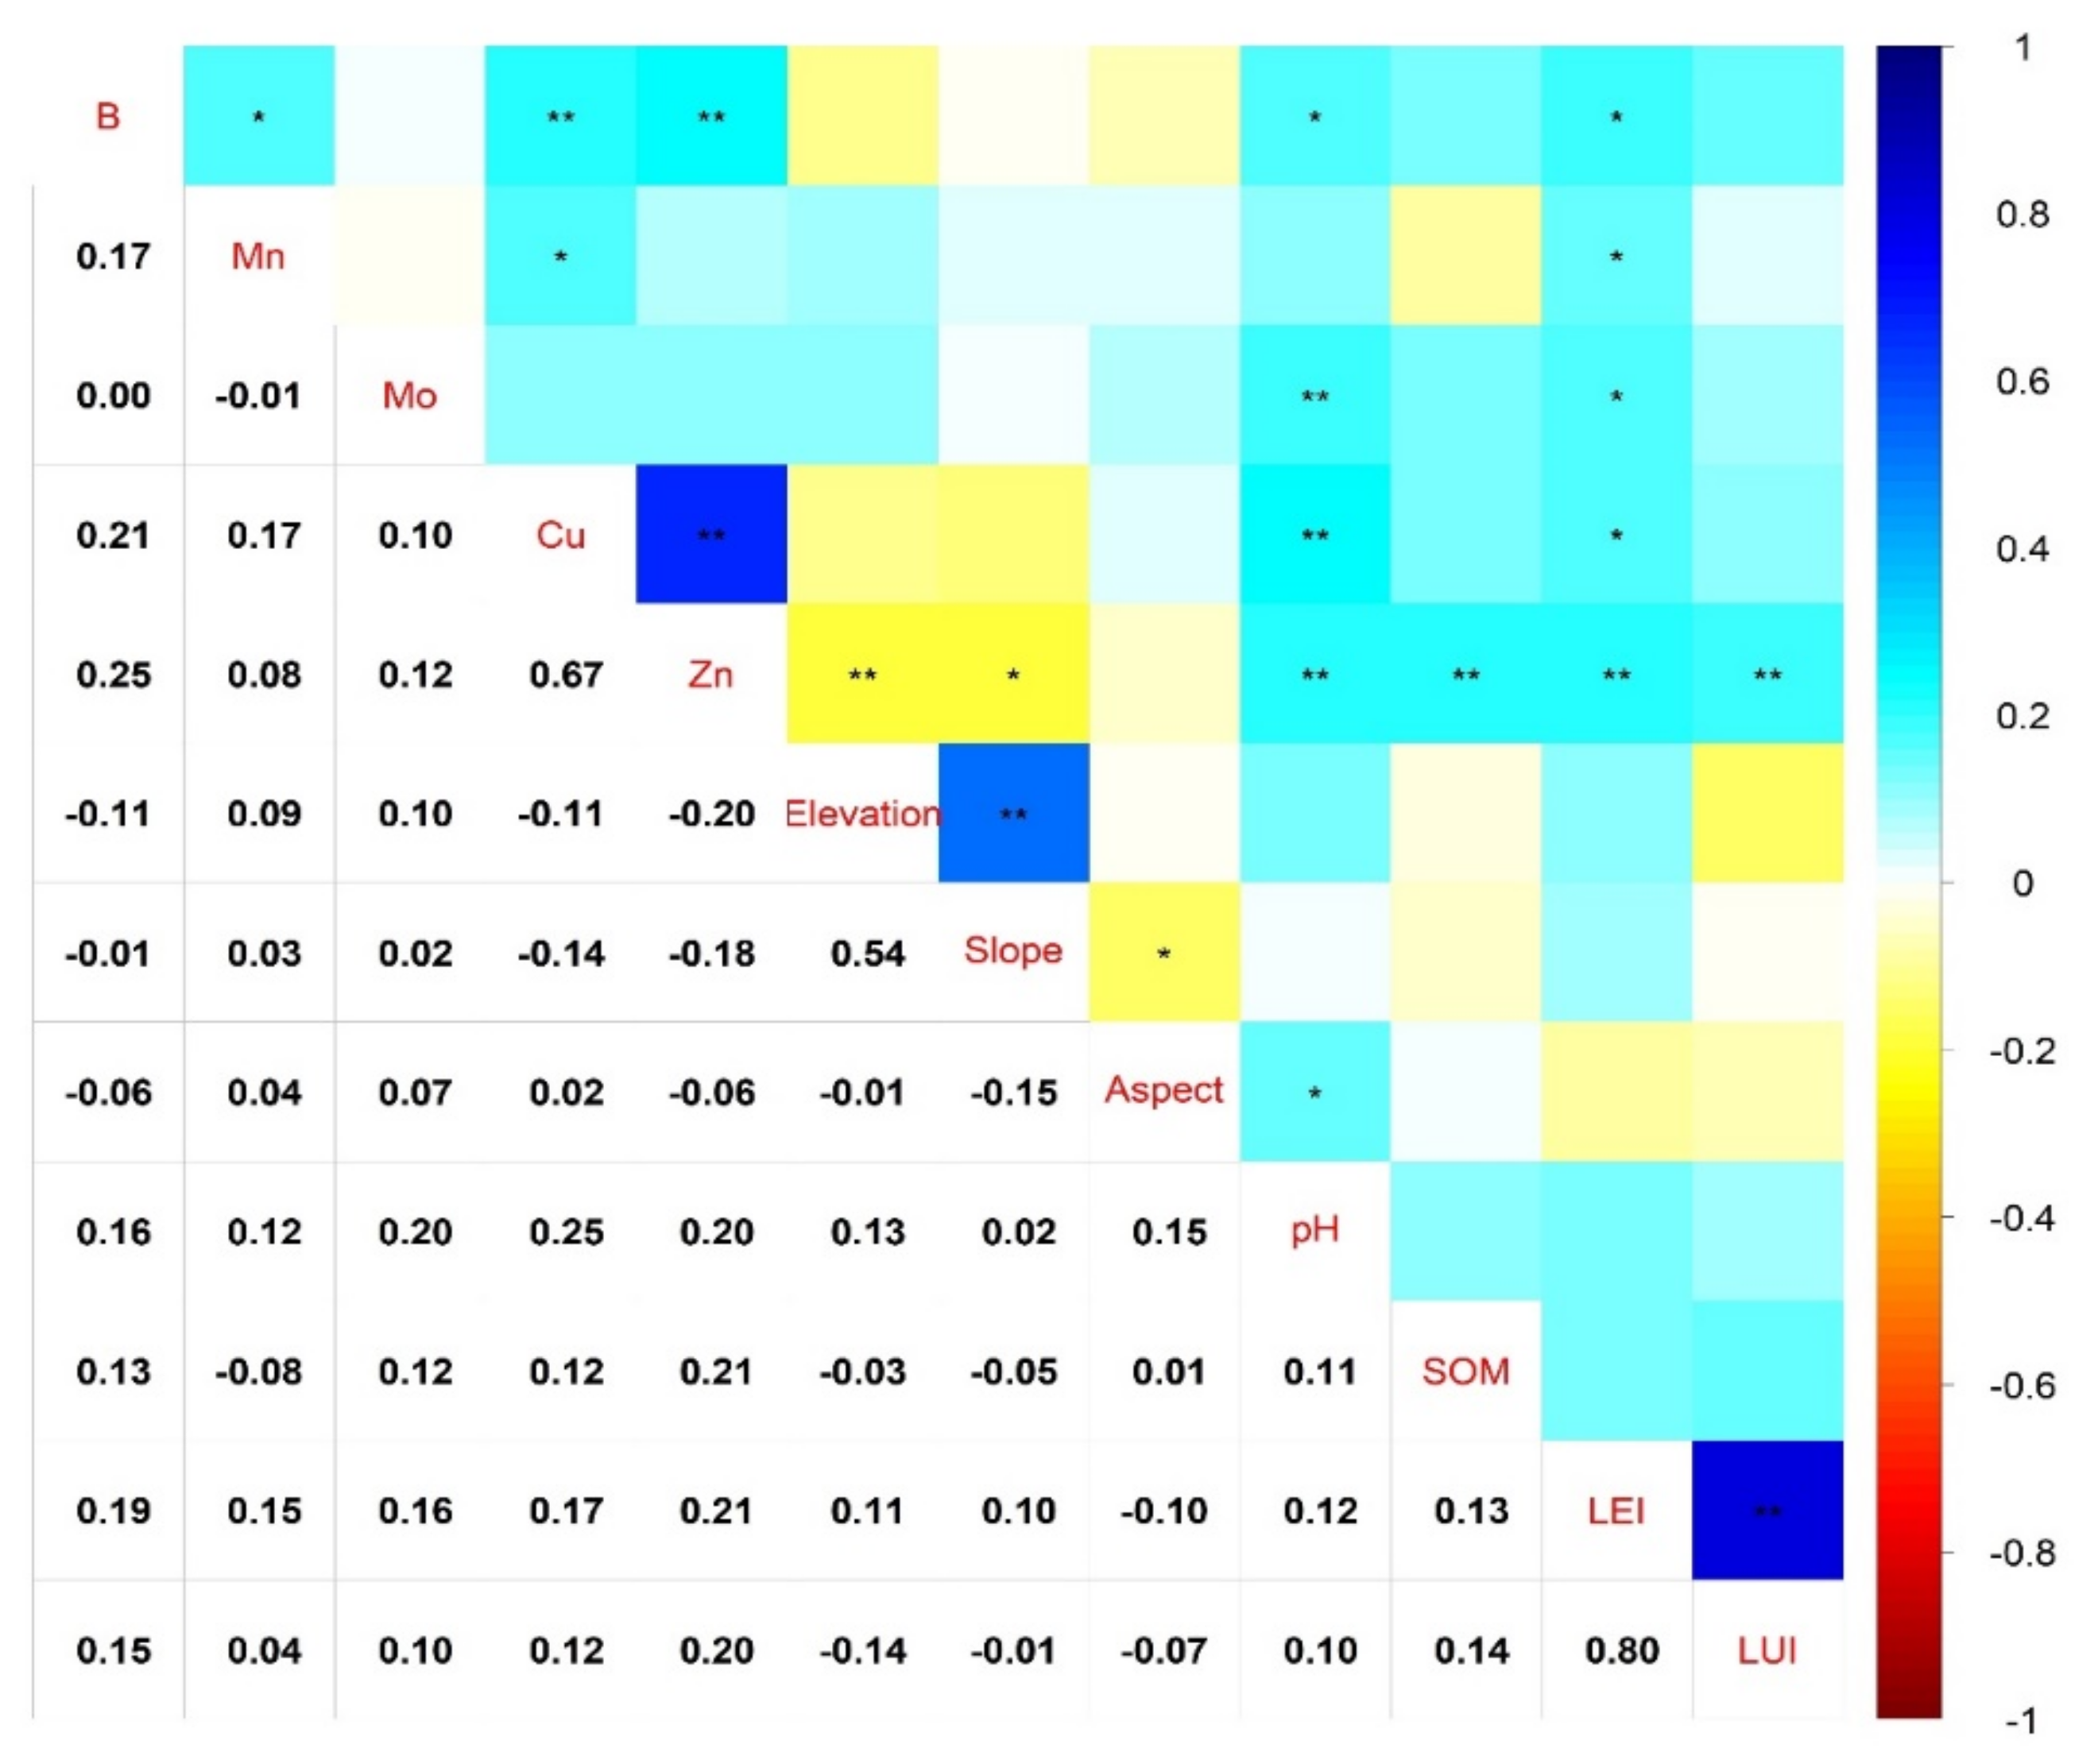
3.2. Correlation Analysis of the Influencing Factors of Trace Elements

Soil is formed and developed under the comprehensive action of various natural conditions and human factors. Changes in the trace element content of soil are therefore affected by both natural and humanmade driving forces. When investigating the spatial variation in trace elements, it is necessary to analyze the correlation between trace elements in the study area and selected topographic factors, soil factors, and human factors. Our results are shown in Figure 2. Especially, the elevation, slope, and aspect values were extracted from DEM in the study area. The pH, soil organic matter (SOM), land economic index (LEI), and land use index (LUI) data were from the evaluation of cultivated land quality and productivity in the study area in 2017.
In the study area, the B concentration was significantly positively correlated with pH in terms of soil factors, and the LEI in terms of human factors. This suggests that the energy transformation of the soil itself and the input level of external land production are the main driving factors of changes in B concentration [31]. There was a significant positive correlation between the Mn concentration and the LEI, which indicates that the input level of land production directly affects the accumulation of Mn in the soil. There was a significant positive correlation between the Mo concentration and both pH and the LEI, and therefore a change in soil pH and an increase in LEI will promote the accumulation of Mo in the soil. The same was true for Cu concentration, further suggesting that, in flat terrain, areas with high external input are vulnerable to those inputs. The inputs in this case were mainly industrial pollution emissions and excessive fertilization, as also reported in previous studies [32,33]. The Zn concentration was significantly negatively correlated with slope and elevation, and there was a significant positive correlation with pH, SOM, the LEI, and LUI. This indicates that in areas with a large slope, high elevation, and low SOM content, degree of land use, and input levels, the accumulation of Zn is hindered to some extent [2,30].

3.3. Geographically Weighted Regression Modeling and Semi Variance Function Analysis

To further explore the impacts of various factors influencing trace elements and more accurately estimate their spatial distribution, variables with a strong correlation with trace elements were analyzed further. To eliminate the influence of multifactor collinearity, the stepwise multiple regression method was used to screen the variables. Finally, a spatial regression analysis model between trace elements and significant variables was established using the GWR4.0 software.
In geostatistics, the semi variance function is an effective tool for exploring the natural phenomenon of randomness in the spatial distribution of soil attributes; it can effectively characterize the degree of variation in each sample [29]. The residual of the soil trace element GWR modeling results was analyzed using GS+ 9.0 software, and the results are shown in Table 3.
The optimal semi variance function model was spherical for B and Mo, exponential for Cu and Zn, and Gaussian for Mn. The highest fitting coefficient (R2) was Mn (0.93), and the smallest was B (0.42), with an order of Mo > Cu > Zn > B. This model can determine the degree of spatial correlation among regionalized variables using the nugget-to-sill ratio (NSR), which reflects the spatial dependence of soil attributes. According to the grading standard for such analyses [34], an NSR less than 25% indicates a strong correlation; a rate between 25% and 75% is moderate, and >75% is weak.
The NSR values were 30.76 and 67.94 for Mo and Zn, respectively, with a moderate spatial correlation of 25–75%, indicating that the spatial variation in Mo and Zn was the result of the joint action of structural and random factors in the system. The spatial variation in Mo was affected more by structural factors than random factors. The randomness factor of the spatial variation in Zn was stronger than the structural factor. The NSR values were 21.05% and 20.59% for B and Mn, respectively. The spatial correlations were strong, indicating that their spatial variation was obviously affected by structural factors in the system, such as the parent material, terrain, and soil-forming processes. The NSR value was 76.33% for Cu and the spatial correlation was weak, indicating that Cu in the study area was mainly affected by human factors such as farming, fertilization, and industrial pollution. Therefore, human activities play an important role in the accumulation of Cu in the soil.
The distance over which trace elements significantly varied in the study area ranged between 2.24 and 3.38 km, with the differences for each element being small. The distance was largest for Cu at 3.38 km, while Mn had the smallest distance of 2.24 km. In general, the spatial correlation range was relatively small, due to the scale of the selected study area.

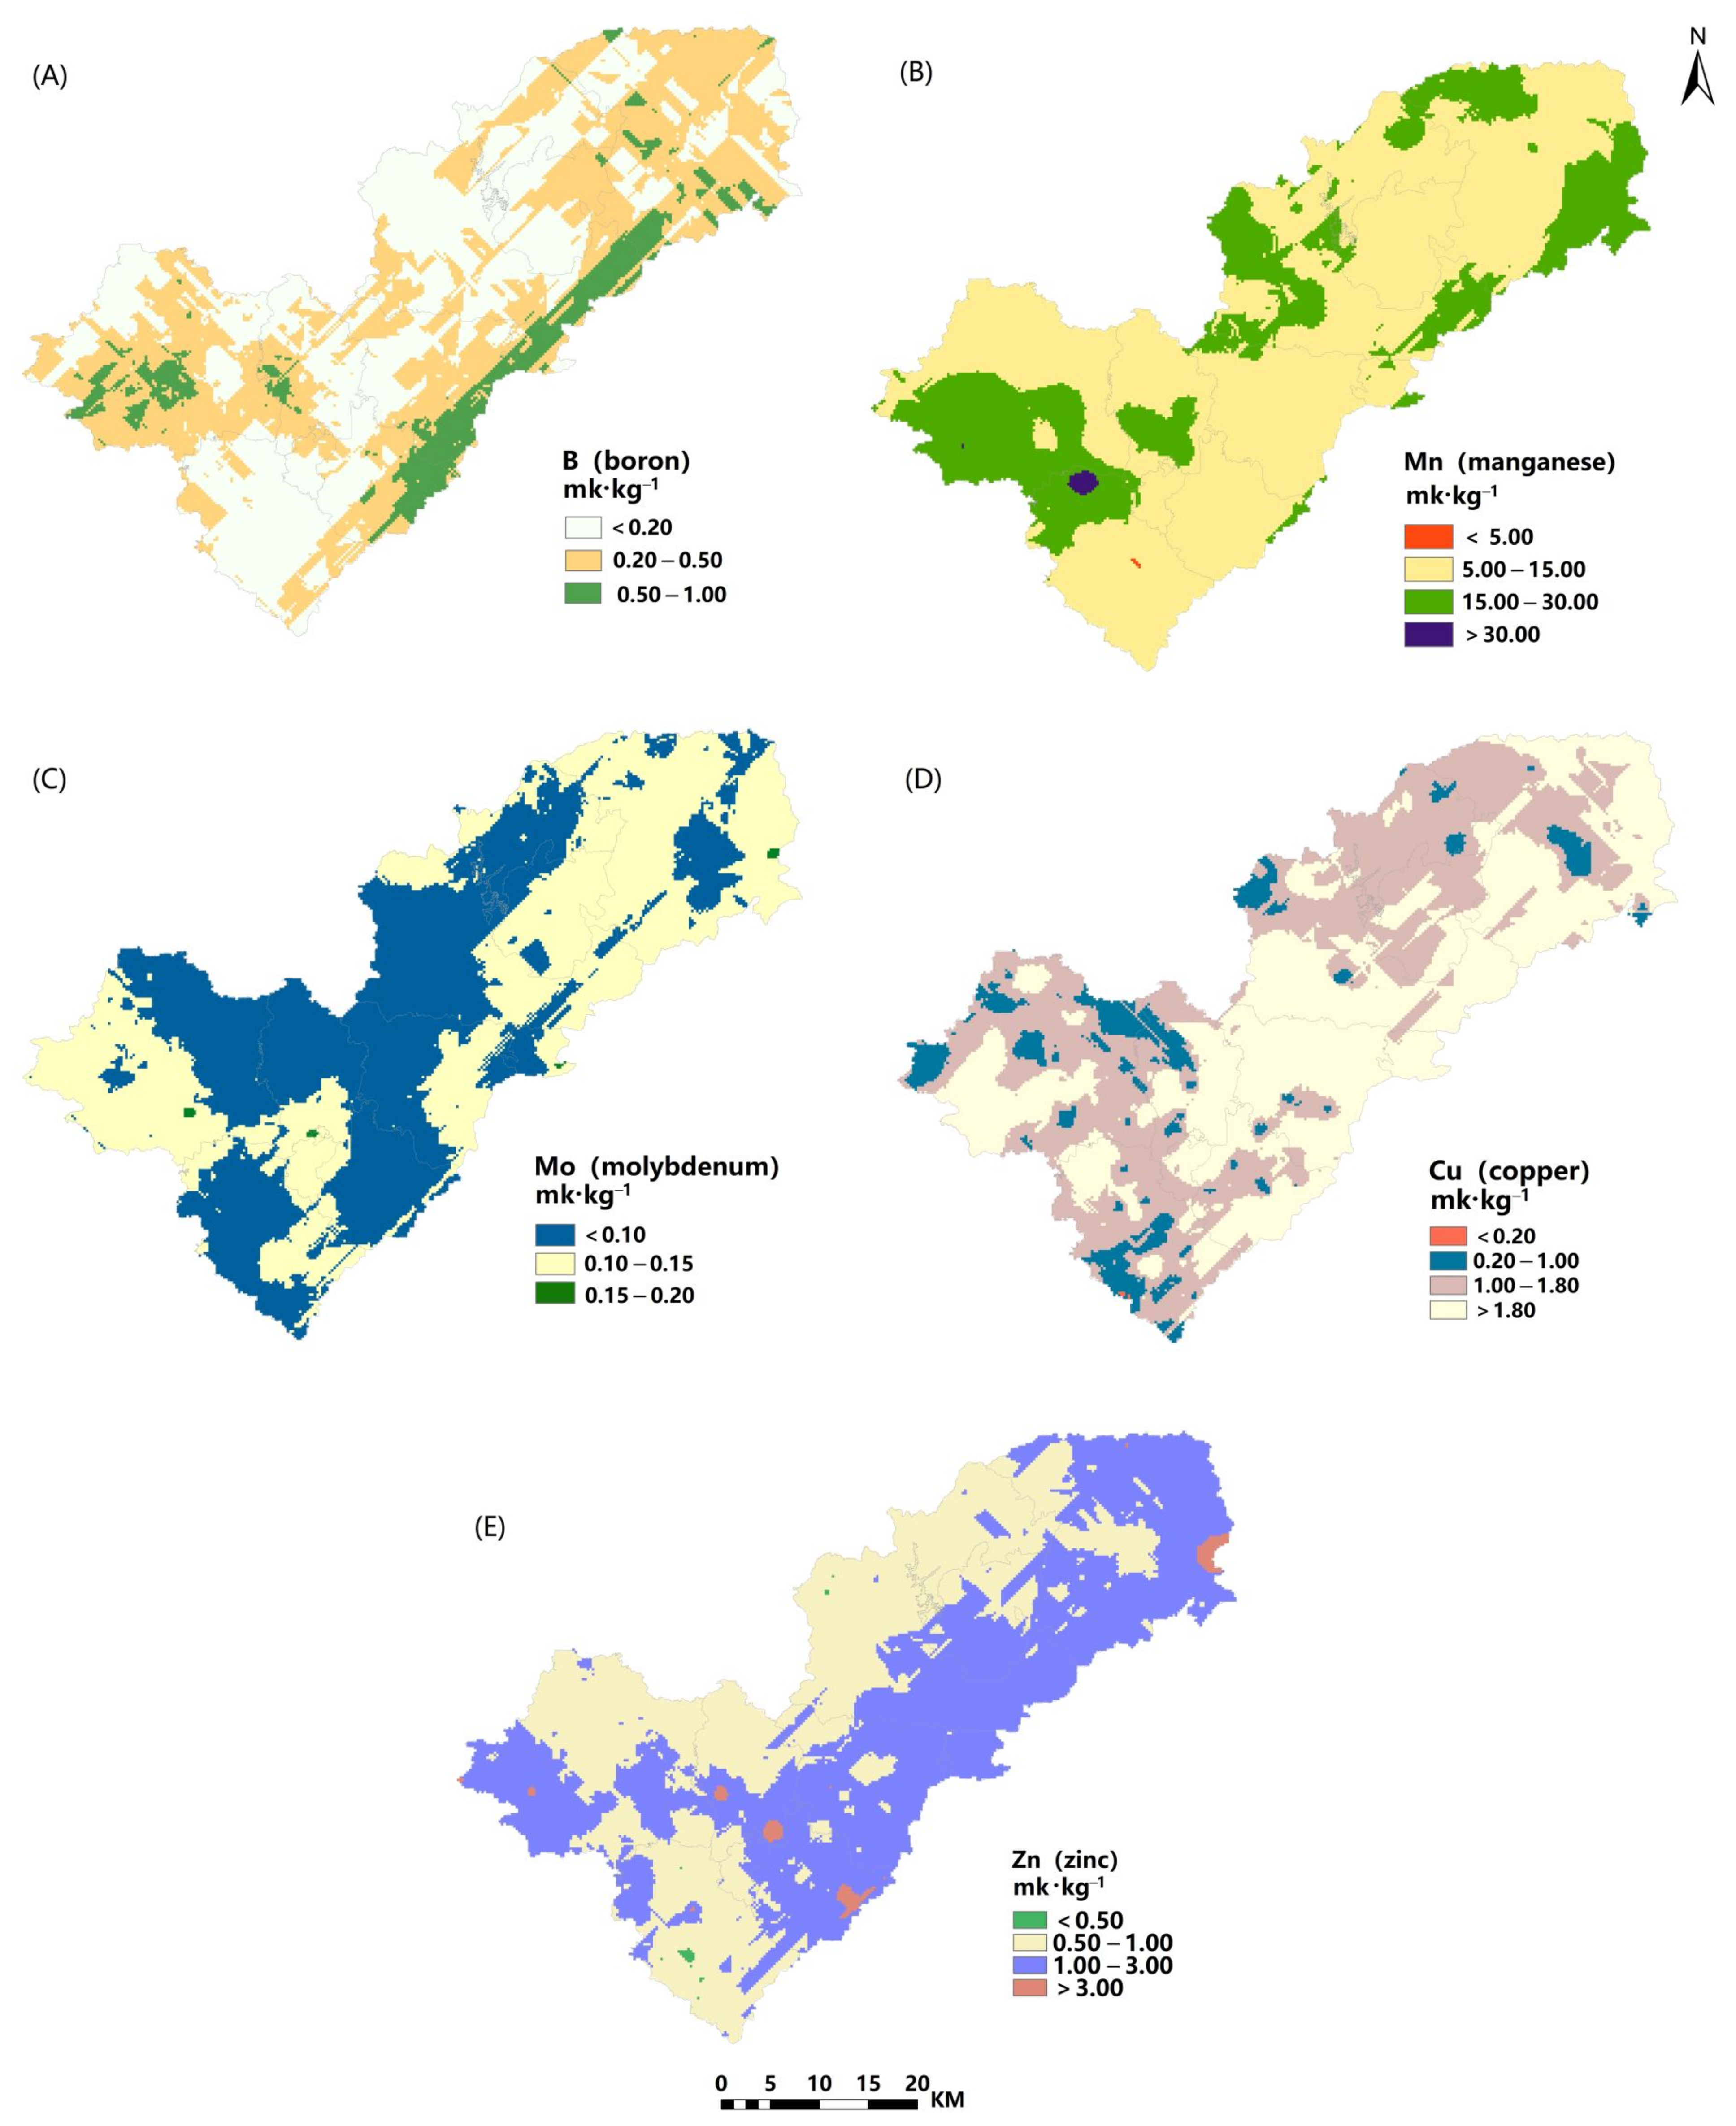
3.4. Spatial Distribution Characteristics

To reflect the spatial distribution of the trace element concentrations more intuitively, spatial interpolation was conducted using the geostatistical module in ArcGIS 10.2 to obtain the spatial distributions of trace elements based on the GWR Kriging (GWRK) method (Figure 3). Farmland area and the proportion of different trace elements at each level were determined by region (Table 4).
Figure 3 and Table 4 show the results. In 86.99% of the total farmland area, B was present at low and very low levels, while for the remaining 13.01% it was present at a moderate level. There were no areas with high levels, and the overall spatial distribution was relatively scattered. Overall, 40.52% of the farmland had extremely low levels, mainly distributed in the center, north, and south of the study area. See the figure for more details. The levels of Mn were mostly moderate to high, with high levels found mainly on the northern and western edges of the study area. There was a serious lack of Mo, with low and extremely low levels nearly throughout. Only 0.19% of the area had a moderate level. Spatially, the extremely low levels were concentrated in the northern mountainous areas, and the central, southern, and northeastern areas, while the low levels were concentrated in the northeast and southwest.
Cu was generally present at high (43.67%) and extremely high (47.45%) levels, with the highest levels in the central and eastern plains. Zn was present at a moderate or high level, almost across the entire area (99.88% of the total area). In terms of spatial distribution, moderate levels (46.93%) were mainly distributed in the north, northwest, and southwest, and high levels were in the northeast, east, and western marginal areas, with some extremely high levels (1.02%) scattered throughout the southern plain.

3.5. Evaluation of Prediction Methods

Using the sample point data in the validation set, the accuracy of the GWRK model was evaluated using a cross-validation method. The results (Table 5) showed that among the trace elements, the smallest ME, MAE, and RMSE were obtained for B and Mo, due to the relatively low concentrations of those two elements. The MAE (5.483) and RMSE (7.667) of Mn were larger than those of the other elements, indicating that the Mn data were more discrete. According to the descriptive statistical results of the data in Table 1, the maximum value of Mn element is 46.72, the minimum value is 3.20, and the values of skewness and kurtosis are 2.13 and 6.85, respectively; there was also a larger error between the predicted and actual values. In addition, the fitting coefficient (R2 = 0.496) was smaller than for the other elements. The ME, MAE, and RMSE of Cu and Zn were similar, with R2 values of 0.686 and 0.665, respectively, indicating better prediction than for the other elements. These data suggest that the model effectively reflected the spatial distribution of each trace element.

4. Discussion

Trace elements provide the necessary nutrient conditions for plant growth and are mainly supplemented by soil fertilization. In recent years, with the increase in the application of nitrogen, phosphorus, and other elemental fertilizers, the proportion of farmland nutrients has gradually become unbalanced, resulting in increasingly serious problems such as trace element deficiencies [35]. To effectively alleviate such imbalances and enhance the sustainable supply of elements available for plant growth, it is necessary to take targeted field management measures according to the spatial variation in trace element concentrations in soil [36]. To this end, it is necessary to clarify the driving factors affecting changes in trace element concentrations in soil.
The driving factors of changes in trace elements are both natural and human activities [31]. In this study, the driving factors were investigated via a correlation analysis. The Zn concentration was significantly negatively correlated with elevation and slope, indicating that the higher the elevation and greater the slope, the less conducive the topography would be to the accumulation of Zn. There was a significant positive correlation between B, Mo, Cu, Zn, and pH in the study area, indicating that a change in soil pH directly affects the accumulation of these trace elements. The study area has a lateritic red soil. The soil is acidic, and the effects of acid rain and precipitation further intensify the degree of soil acidification. Changes in soil pH within a certain range affects the solubility of trace elements [37]. Among human factors, the concentrations of the five trace elements were strongly correlated with the LEI, indicating that economic investment in land plays an important role in the changes to and accumulation of trace elements. Due to data limitations, we were unable to consider what kinds of land use or production input level, such as straw being returned to the field, chemical fertilizer application, or plastic film use [38,39,40,41], affected element concentrations. This will be the focus of the next stage of this research.
Regarding spatial distribution, B was mainly present at low and extremely low levels. Hence, it is necessary to adopt biological or engineering measures to improve the B concentration throughout much of the study area. There was rich Mn in most of the study area, whereas Mo was lacking throughout. The extremely low levels were concentrated in the northern mountainous areas, the central region, and the southern and northeastern regions, while the low levels were concentrated in the northeastern and southwestern regions. The agricultural management department should advise farmers to take relevant countermeasures in these areas, improve field management, and improve the current situation of soil Mo deficiency. Cu concentrations were high in the study area, with high and extremely high levels accounting for 91.02% of the area. Spatially, the western and southern plains had high levels, and the central and eastern plains had extremely high levels. These areas have a flat terrain and a high degree of industrialization. When taking field management measures to improve the Cu concentration, it will be necessary to guard against the input of exogenous pollution, including transportation, atmosphere, rivers, etc. Zn concentrations were generally at a moderate to high level, with high levels over 52.95% of the total area. Although not as obvious as Cu, these high levels cannot be ignored. In terms of spatial distribution, moderate levels were mainly in the north, northwest, and southwest, and high levels were concentrated in the northeast, east, and western marginal areas. Both Zn and Cu are heavy metals, and excess concentrations will lead to soil pollution, affecting plant growth and the health of agricultural products. Therefore, specific field measures need to be implemented to prevent excess concentrations accumulating in the soils of these areas.

5. Conclusions

The concentrations of five trace elements in the study area, particularly Cu and Zn, were affected by natural factors, soil factors, and human factors. Overall, B and Mo concentrations were low, Mn levels were appropriate, and Cu and Zn concentrations were high. The spatial distribution of Mn was relatively uniform, but those of the other elements were relatively dispersed. Field management measures should be taken according to these findings. This could be accomplished through the application of soil improvers, by strategic plantings, and other methods that would improve the trace element concentrations. Clarifying the spatial distributions and influencing factors of trace elements will not only improve the current soil nutrient imbalance, but also further guide agricultural production, strengthen farmland field management, and improve the health and productivity of cultivated land.

Author Contributions

Conceptualization, R.Z., Y.Z., Y.H., L.W., Y.X., L.L., H.Y. and J.L.; methodology, R.Z. and Y.Z.; validation, R.Z. and Y.X.; formal analysis, R.Z., L.W., Y.X. and H.Y.; investigation, R.Z.; resources, L.W., Y.H. and L.L.; data curation, R.Z., Y.Z. and Y.X.; writing—original draft preparation, R.Z., Y.Z. and Y.X.; writing—review and editing, R.Z., L.W., L.L., H.Y. and J.L.; project administration, L.W.; funding acquisition, Y.H. All authors have read and agreed to the published version of the manuscript.

Funding

This research was funded by the National Natural Science Foundation of China (U1901601).

Institutional Review Board Statement

Not applicable.

Informed Consent Statement

Not applicable.

Data Availability Statement

Not applicable.

Acknowledgments

We greatly thank Sun Xiaolin, Mao Xiaoyun and Ren Xiangning for their strong support in the course of writing.

Conflicts of Interest

The authors declare no conflict of interest. The funders had no role in the design of the study; in the collection, analyses, or interpretation of data; in the writing of the manuscript; or in the decision to publish the results.

References

  1. Narducci, J.; Quintas, S.C.; Castro, A.; Som, C.R.; Brandt, J.S. Implications of urban growth and farmland loss for ecosystem services in the western United States. Land Use Policy 2019, 86, 1–11. [Google Scholar] [CrossRef]
  2. Yu, H.M.; Zhu, Q.; Fu, Q.Y.; Guo, X. Spatial variability characteristics and impacting factors of soil trace elements in Poyang Lake plain, Jiangxi of China. Plant Nutr. Fertil. Sci. 2020, 26, 172–184. [Google Scholar]
  3. Ballesta, R.J.; Bueno, P.C.; Rubi, J.; Giménez, R.G. Pedo-geochemical baseline content levels and soil quality reference values of trace elements in soils from the Mediterranean (Castilla La Mancha, Spain). Cent. Eur. J. Geosci. 2010, 2, 441–454. [Google Scholar] [CrossRef]
  4. Baldantoni, D.; Leone, A.; Iovieno, P.; Morra, L.; Zaccardelli, M.; Alfani, A. Total and available soil trace elements concentrations in two Mediterranean agricultural systems treated with municipal waste compost or conventional mineral fertilizers. Chemosphere 2010, 80, 1006–1013. [Google Scholar] [CrossRef]
  5. Jiang, Y.F.; Zhong, S.; Rao, L.; Sun, K.; Guo, X. Spatial variability of soil available microelement contents of cultivated land in Jiangxi Province and their influencing factors. Resour. Environ. Yangtze Basin 2018, 27, 1159–1169. [Google Scholar]
  6. Burgos, P.; Madejón, E.; Pérez-De-Mora, A.; Cabrera, F. Spatial variability of the chemical characteristics of a trace-element-contaminated soil before and after remediation. Geoderma 2006, 130, 157–175. [Google Scholar] [CrossRef]
  7. Behera, S.K.; Shukla, A.K. Spatial distribution of surface soil acidity, electrical conductivity, soil organic carbon content and exchangeable potassium, calcium and magnesium in some cropped acid soils of India. Land Degrad. Dev. 2015, 26, 71–79. [Google Scholar] [CrossRef]
  8. Guo, J.L.; Wu, S.W.; Jin, H.; Lu, S.G. Spatial Variability and Controlling Factors of Microelements Contents in Farmland Soils. J. Soil Water Conserv. 2010, 24, 145–149. [Google Scholar]
  9. Wang, G.X.; Zeng, C.; Zhang, F.; Zhang, Y.L.; Scott, C.A.; Yan, X.D. Traffic-related trace elements in soils along six highway segments on the Tibetan Plateau: Influence factors and spatial variation—ScienceDirect. Sci. Total Environ. 2017, 582, 811–821. [Google Scholar] [CrossRef]
  10. Bock, L.; Schvartz, C.; Colinet, G. Factors affecting trace element content in periurban market garden subsoil in Yunnan Province, China. J. Environ. Sci. 2011, 23, 488–496. [Google Scholar]
  11. Li, S.; Li, Q.Q.; Zhang, H.; Wang, C.Q.; Xie, Y.B.; Li, B.; Jiang, X.H. Spatial Variability of Soil Available Microelement Contents and Their Influencing Factors in Luzhou’s Tobacco Planting Area, Southwestern Sichuan. Soils 2016, 48, 1215–1222. [Google Scholar]
  12. White, J.G.; Welch, R.M.; Norvell, W.A. Soil Zinc Map of the USA using Geostatistics and Geographic Information Systems. Soil Sci. Soc. Am. J. 1997, 61, 185–194. [Google Scholar] [CrossRef]
  13. Webster, R.; Nortcliff, S. Improved estimation of micro nutrients in hectare plots of the Sonning Series. J. Soil Sci. 2010, 35, 667–672. [Google Scholar] [CrossRef]
  14. Li, Q.; Zhou, J.H.; Zhang, Y.A.; Wu, L.Z.; Zhang, Z.Y.; Zhang, Y.Y.; Xie, Y.; Liu, J.H. Spatial variability and influencing factors of available microelements in tobacco growing soils in Qujing. Tob. Sci. Technol. 2013, 47, 93–96. [Google Scholar]
  15. Yang, Q.P.; Wu, W.; Liu, H.B. Prediction of spatial distribution of soil available iron in a typical hilly farmland using terrain attributes and random forest model. Chin. J. Eco-Agric. 2018, 26, 422–431. [Google Scholar]
  16. Liu, F.; Rossiter, D.G.; Song, X.D.; Zhang, G.L.; Yang, R.M.; Zhao, Y.G.; Li, D.C.; Ju, B. A similarity-based method for three-dimensional prediction of soil organic matter concentration. Geoderma 2016, 263, 254–263. [Google Scholar] [CrossRef]
  17. Liu, F.; Zhang, G.L.; Sun, Y.J.; Zhao, Y.G.; Li, D.C. Mapping the Three-Dimensional Distribution of Soil Organic Matter across a Subtropical Hilly Landscape. Soil Sci. Soc. Am. J. 2013, 77, 1241–1253. [Google Scholar] [CrossRef]
  18. Koley, S. Machine learning for soil fertility and plant nutrient management using back propagation neural networks. Soc. Sci. Electron. Publ. 2014, 2, 292–297. [Google Scholar]
  19. Zhou, Y.; Biswas, A.; Ma, Z.Q.; Lu, Y.L.; Chen, Q.X.; Shi, Z. Revealing the scale~ specific controls of soil organic matter at large scale in Northeast and North China Plain. Geoderma 2016, 271, 71–79. [Google Scholar] [CrossRef]
  20. Zhao, M.S.; Liu, B.Y.; Lu, H.L.; Li, D.C.; Zhang, G.L. Spatial modeling of soil organic matter over low relief areas based on geographically weighted regression. Trans. Chin. Soc. Agric. Eng. 2019, 35, 102–110. [Google Scholar]
  21. Kumar, S.; Lal, R.; Liu, D. A geographically weighted regression kriging approach for mapping soil organic carbon stock. Geoderma 2012, 190, 627–634. [Google Scholar] [CrossRef]
  22. Griffith, D.A. Spatial~ Filtering~ Based Contributions to A Critique of Geographically Weighted Regression (GWR). Environ. Plan. A 2008, 40, 2751–2769. [Google Scholar] [CrossRef]
  23. Wang, Y.N.; Zhao, T. Study on Spatial Difference of Carbon Emissions in China Based on GWR Model. China Popul. Resour. Environ. 2016, 26, 27–34. [Google Scholar]
  24. Dai, W.J.; Wang, D.J.; Lu, Y. Evaluation of county level cultivated land quality and productivity in south China:A case study of Wuchuan City, Guangdong Province. J. Agric. Resour. Environ. 2019, 36, 419–430. [Google Scholar]
  25. Zeng, Z.B.; Tang, J.D.; Liu, Y.F. Changes and Driving Forces of Farmland Organic Matter in Guangdong Province, China. Soils 2013, 45, 86–92. [Google Scholar]
  26. Dou, L.; Du, H.Y.; Huang, Y.H.; Lai, Q.H.; You, Y.H. Main Research Achievements of Agro-geological and Eco-Geochemical Research in Pearl River Delta Economic Zone, Guangdong Province, China. Geol. Surv. China 2015, 2, 47–55. [Google Scholar]
  27. Ye, X.Y.; Tang, J.D. Achievements and its application prospect of cropland capacity survey and quality evaluation in Gaoming, Guangdong. Ecol. Environ. 2003, 12, 248–249. [Google Scholar]
  28. Shao, Y.C.; Wang, J.H.; Ge, Y. Spatial Mapping of PM2.5 Concentrationin China with Geographically Weighted Regression Kriging Model. Remote Sens. Technol. Appl. 2018, 33, 123–131. [Google Scholar]
  29. Zou, R.Y.; Zhou, H.J.; Guo, X.; Dan, C.L.; Lv, T.G.; Li, H.Y. Spatial Distribution and Mapping of Influencing Factors of Farmland Soil Organic Carbon in the Poyang Lake Region. Resour. Environ. Yangtze Basin 2019, 28, 121–131. [Google Scholar]
  30. Song, F.J.; Chang, Q.R.; Zhong, D.Y.; Fang, R.H. Spatial variability and controlling factors of soil trace elements in hilly and gully area of the Loess Plateau. Agric. Res. Arid Areas 2012, 30, 42–48. [Google Scholar]
  31. Wang, Z.W.; Xu, L.S.; Zhang, W.J. Corresponding Relationship between Trace Elements in Soil and Human Activity Intensity. Chin. J. Soil Sci. 2002, 33, 303–305. [Google Scholar]
  32. Li, J.F.; Qu, M.K.; Liu, G. Assessment of the Availability of Soil Copper and Related Influencing Factors at a County Scale. Environ. Sci. 2018, 39, 363–370. [Google Scholar]
  33. Wang, M.; Li, S.T.; Ma, Y.B.; Huang, S.M.; Wang, B.R.; Zhu, P. Influence of Different Long-term Fertilization Practices on Fractionations and Bioavailability of Cu, Zn, and Cd in Soils. J. Agro-Environ. Sci. 2014, 8, 1500–1510. [Google Scholar]
  34. Wang, R.M.; Zou, R.Y.; Liu, J.M.; Liu, L.; Hu, Y.M. Spatial Distribution of Soil Nutrients in Farmland in a Hilly Region of the Pearl River Delta in China Based on Geostatistics and the Inverse Distance Weighting Method. Agriculture 2021, 11, 50. [Google Scholar] [CrossRef]
  35. Li, K.; Peng, M.; Yang, Z.; Yang, K. Trace Metals Pollution and Health Risks for Planning Area Soils of 193 Chinese Cities. Environ. Sci. 2020, 41, 1825–1837. [Google Scholar]
  36. Zhu, J.; Huang, B.; Sun, W.X.; Ding, F.; Zou, Z.; Sun, J.P. Temporal-Spatial Variability and Its Influencing Factors of Available Trace Metals in Soils. J. Nanjing Univ. 2007, 43, 1–12. [Google Scholar]
  37. Mu, G.Z.; Luo, J.; Cai, L.M.; Jiang, H.H.; He, M.H.; Wang, Q.S.; Wang, S.; Wang, H.Z. Relationship between soil trace elements with Organic Matter and pH in Jiexi County, Guangdong Province. Chin. J. Agric. Resour. Reg. Plan. 2019, 40, 208–215. [Google Scholar]
  38. Guo, D.J.; Liu, X.H.; Xu, L.P.; Ma, Y.; Yan, S.H.; Luo, J. Effects of continuous multi season application of pig manure organic fertilizer on the contents of Cu and Zn in soil and crops in Greenhouse. Jiangsu Agric. Sci. 2020, 48, 283–286. [Google Scholar]
  39. Zhang, P.F.; Li, S.H.; He, Z.; Deng, Y.C.; Hu, Y.M. Collaborative mapping rice planting areas using multisource remote sensing data. In Proceedings of the 2021 IEEE International Geoscience and Remote Sensing Symposium, Brussels, Belgium, 11–16 July 2021; pp. 5969–5972. [Google Scholar]
  40. Zhang, J.Q.; Zheng, X.Q.; Zhang, H.L.; Lv, W.G.; Li, S.X. Effects of Long-term Straw Returning and Nitrogen Fertilizer Regulation on Soil Quality and Yields of Rice Field. Acta Agric. Boreali-Sin. 2019, 34, 185–191. [Google Scholar]
  41. Li, S.P.; Cai, Z.C.; Yang, H.; Wang, J.K. Effects of long-term fertilization and plastic film covering on some soil fertility and microbial properties. Acta Ecol. Sin. 2009, 29, 2489–2498. [Google Scholar]
Figure 1. Location of the study area and sampling point distribution.
Agronomy 12 00478 g001
Figure 2. Correlation heat map of soil trace elements and influencing factors. B, boron; Mn, manganese; Mo, molybdenum; Cu, copper; Zn, zinc; SOM, soil organic matter; LEI, land economic index; LUI, land use index; * means p < 0.05; ** means p < 0.01.
Agronomy 12 00478 g002
Figure 3. Spatial distribution of soil trace elements based on GWRK method: (A) boron, (B) manganese, (C) molybdenum, (D) copper, (E) zinc.
Agronomy 12 00478 g003
Table 1. Descriptive statistics of soil trace elements.
ElementsMaxMiniMeanStd. Dev.SkewnessKurtosisCV/%
B (mg·kg−1)0.890.080.420.190.83−0.0745.23
Mn (mg·kg−1)46.723.2013.036.232.136.8547.81
Mo (mg·kg−1)0.200.020.100.041.181.5740.00
Cu (mg·kg−1)11.420.301.650.971.734.1558.79
Zn (mg·kg−1)12.130.571.891.211.140.9364.02
B, boron; Mn, manganese; Mo, molybdenum; Cu, copper; Zn, zinc; Max, Maximum; Mini, Minimum; Std. Dev., standard deviation; CV, coefficient of variation, (Std. Dev./Mean).
Table 2. Classification standard of soil trace elements in Guangdong Province.
ElementsExtremely LowLowMediumHighExtremely HighCritical Value
B (mg·kg−1)<0.200.20–0.500.50–1.001.00–2.00>2.000.50
Mn (mg·kg−1)<1.001.00–5.005.00–15.0015.00–30.00>30.005.00
Mo (mg·kg−1)<0.100.10–0.150.15–0.200.20–0.30>0.300.15
Cu (mg·kg−1)<0.100.10–0.200.2–1.001.00–1.80>1.800.20
Zn (mg·kg−1)<0.300.30–0.500.50–1.001.00–3.00>3.000.50
B, boron; Mn, manganese; Mo, molybdenum; Cu, copper; Zn, zinc.
Table 3. Semi variance function parameters of GWR prediction model for soil trace elements.
ElementsModelNugget
(C0)
Sill
(C0 + C)
NSR
[Co/(C0 + C),%]
Range
(Km)
R2
(%)
Residual
BSpherical0.0400.19021.053.040.425.938 × 10−3
MnGaussian13.50165.56020.592.240.9322.200
MoSpherical0.0040.01330.762.760.792.356 × 10−7
CuExponential1.4901.95276.333.380.720.818
ZnExponential1.4562.14367.943.230.680.654
B, boron; Mn, manganese; Mo, molybdenum; Cu, copper; Zn, zinc; NSR, Nugget to Sill ratio; R2, R-squared.
Table 4. The soil trace elements in different grades of soil area and proportion.
GradeBMnMoCuZn
Area
(km2)
Proportion
(%)
Area
(km2)
Proportion
(%)
Area
(km2)
Proportion
(%)
Area
(km2)
Proportion
(%)
Area
(km2)
Proportion
(%)
Extremely low818.3640.52--1002.5650.61----
Low903.6946.470.380.02974.6249.200.780.042.250.12
Medium257.9513.011422.0671.793.430.19175.138.84929.6246.93
High--552.4427.89--865.0043.671028.3751.93
Extremely high--5.670.30--939.8147.4520.251.02
B, boron; Mn, manganese; Mo, molybdenum; Cu, copper; Zn, zinc.
Table 5. Precision evaluation index of soil trace elements prediction model.
ElementsModelMEMAERMSER2
BGWRK−0.0010.0310.5720.528
MnGWRK−0.0405.4837.6670.496
MoGWRK0.0020.0250.1020.473
CuGWRK−0.0600.7811.2180.686
ZnGWRK−0.0570.9861.3490.665
B, boron; Mn, manganese; Mo, molybdenum; Cu, copper; Zn, zinc; ME, mean error; MAE, mean absolute error; RMSE, root mean square error; R2, R-squared.
Publisher’s Note: MDPI stays neutral with regard to jurisdictional claims in published maps and institutional affiliations.

