Abstract
Various cropping patterns are extensively used on the North China Plain, which greatly alter various soil properties. Although these soil properties respond differently to the different cropping patterns, little is known about the possible effects of cropping patterns on desalinized soils. To assess the effects of the different cropping patterns on soil properties and enzyme activities, a long-term field experiment was conducted at the Nanpi Agro-Ecological Station in Hebei Province, China. The cropping patterns under study were the single-cropping patterns of winter wheat (Triticum aestivum L.), spring maize (Zea mays), and spring cotton (Gossypium hirsutum), and the double-cropping pattern of winter wheat–summer maize (WW–SM), which is the predominant cropping pattern on the North China Plain. Soil samples were collected at a depth of 0–100 cm, depending on the soil properties. Our results indicated that soil available phosphorous (P) and available potassium (K) concentrations at 0–20 cm were greater than those of the subsurfaces. Soil organic matter declined with depth, and WW–SM had the highest amount in the deep levels. The WW–SM cropping pattern also generally showed greater levels of enzyme activities than did the single-cropping patterns, proving that diverse crops can enhance enzyme activities. Soil pH generally increased with depth despite there being no significant differences between the cropping patterns. No significant effects were observed on soil electrical conductivity (EC). However, EC generally increased with depth in spring cotton and winter wheat and declined in spring maize and WW–SM. Winter wheat had a significant aggregate size (<0.053 mm) at 20–40 cm depth and generally showed the lowest amount of nutrients. This study suggests that a fallow period allows the soil to regenerate its structure, whereas WW–SM enhances high soil organic matter in the deep soil layers and promotes increased soil enzyme activities. This indicates that crop rotation could sustainably exploit soil resources without reducing fertility over a long period. There is a need to incorporate different soil management practices for single-cropping patterns to increase their productivity, especially in spring maize, whose organic matter declined the most. Our results also show a need to diversify to different crop rotations to utilize their benefits and enhance soil productivity while increasing crop output.
1. Introduction
Soil quality is highly dependent on soil management practices, and it influences crop production. Assessing soil properties under different long-term cropping patterns is essential to preserving soil quality since soil plays an essential role in the ecosystem, linking soil nutrients, water availability, and crop growth [1]. As a developing country, China not only faces water scarcity problems but also the challenge to maintain soil health and guarantee food security [2].
The North China Plain (NCP), known for intensive cropping, is among the most notable agricultural production regions, producing about 61% and 45% of the nation’s grain yields of wheat and maize, respectively, covering approximately 19% of the arable land [3]. The double-cropping pattern of winter wheat—summer maize (WW–SM) is the major form of crop production on the NCP, providing about a third of the Chinese food supply [4]. This cropping pattern consumes a lot of water, which is already scarce in this region. Cropping patterns, such as monocultures of maize and wheat and a three-crop pattern of winter wheat–summer maize–spring maize (WW–SM–SM3), have been highly researched and recommended to replace the double-cropping pattern of WW–SM due to its high water-consumption level [5,6,7,8,9]. These studies have provided a theoretical and practical basis for adapting to alternate cropping patterns that consume less water.
Soil salinity is another major concern affecting the NCP [10], and it has led to serious issues in regards to sustainable agricultural development in the area. Several projects on the reclamation and restoration of the saline soils [11] have been undertaken. However, because water scarcity is a major issue in the NCP, existing research work has focused on identifying alternative cropping patterns that would consume less water and how these cropping patterns affect water use, whereas studies based on soil properties, particularly in desalinized soils, are still scarce for the NCP.
Changes to different cropping patterns may have a major influence on soil properties, especially due to increased application of fertilizer and low nutrient-use efficiency, hence altering soil quality. The results of numerous studies show that an increase in crop yield becomes unsustainable due to changes in the soil chemical, physical, and biological properties, which are not beneficial to the agricultural pattern in the long run [2,12,13,14]. Soil changes reflect the different management practices applied to soil, such as crop rotation and the diversification of crops. These soil changes are not only related to tillage practices and fertilizer application, but also to crop types and different planting techniques in agricultural patterns [15]. Studies on cropping pattern effects on soil properties include Shi et al. [10], who reported that wheat and maize cropping patterns increase soil organic matter between 61.3–68.1% and 31.9–38.8%, respectively. Wang et al. [2] also reported a decrease in soil pH in a fallow–WW–SM rotation.
Assessing the influence of different cropping patterns should allow for the determination of the roles of crop type and rotation in soil properties and enzymatic activities on the NCP. Impacts of cropping patterns are observed in the soil surface, where crop residues are deposited, and to the depth where tillage is exerted [16], as soil organic matter is highly dependent on the decomposition of crop residues [17]. Different crop types affect C and N through their residues or root exudates, which are determined by root depth and distribution [18]. Crops with deep root systems increase soil organic matter more than those with shallow root systems, and winter wheat and spring cotton are identified as crops with deep root systems [19,20]. Crops that are grown in rotation also tend to increase soil organic matter due to the varying quality and quantity of plant biomass [21]. They have the potential to increase microbial activity and improve soil fertility, thereby increasing nutrient supply to crops through the mineralization and immobilization of nutrients [22]. Soil enzymes are useful biological soil indicators. They were studied due to their sensitivity and quick response to any soil management changes long before other soil quality indicators are detectable. Spring cotton was also included due to its high importance on China’s economy.
High-quality soil conditions play an essential role in crop productivity [23], and several studies have demonstrated the cumulative effects of cropping patterns on soil enzymatic activities and soil properties after years of experimental trials [24,25]. However, little information is available on the NCP, especially under desalinized soils in long-term experimental studies. As a result, a long-term project was conducted at the Nanpi Agro-Ecological Station of the Chinese Academy of Sciences, located in Hebei Province, North China Plain, to investigate the effects of various cropping patterns on soil health. We included the major cropping patterns adapted on the NCP, which are the double-cropping pattern of winter wheat—summer maize (WW–SM) and the single-cropping patterns of winter wheat, spring maize, and spring cotton. Considering the limited research documentation on desalinized soils on the NCP, we focused on how different cropping patterns affect soil chemical and physical changes, excluding factors such as irrigation. Therefore, the objective of this study was to investigate the long-term impacts of different cropping patterns adapted on the NCP on soil physico-chemical properties and enzyme activities.
2. Materials and Methods
2.1. Site Description
An experiment evaluating different cropping patterns was established in 2010 at the Nanpi Agro-Ecological Station of the Chinese Academy of Sciences, located in Hebei Province, North China Plain (38°06′ N, 116°40′ E, 20 m above sea level). The experiment is located in an alluvial plain with an elevation of 11 m. The station is located in a semi-humid region characterized by a monsoon climate with an annual temperature of 15.3 °C and average annual precipitation of 576 mm, which is concentrated during the period of June to September in the summer season. The soil at the experimental site was previously desalinized [11] and is classified as fluvisol according to the FAO system.
2.2. Experimental Design and Treatment Management
The experiment consisted of different cropping patterns with plot sizes measuring 2 × 3.3 m. The treatments consisted of the double-cropping pattern of winter wheat–summer maize (WW–SM), and the single-cropping patterns of winter wheat, spring maize, and spring cotton. Throughout the 10 years of experimental study, cropping patterns relied on rainfall, and no irrigation was performed. However, plastic mulch was used in the spring cotton cropping pattern to conserve soil moisture. Compound fertilizer was applied manually, once per year in October for all crop patterns at uniform rates of 127.5 kg N ha−1 as urea (278 kg ha−1), 127.5 kg P2O5 ha−1 as triple superphosphate (332 kg ha−1), and 127.5 kg K2O ha−1 as potassium sulfate (332 kg ha−1). Tillage was similar for all plots, and it was carried out in October after the cotton and maize harvests and also before the wheat was sown. The 0–20 cm soil layer was hand-tilled, and only cotton below-ground biomass was removed, while that of wheat and maize was left in the ground. The above-ground biomass of all crops was removed.
The cropping patterns were sown in different seasons. Spring maize and spring cotton were sown in late April, and summer maize in early June. They were all harvested in early October, and the plots were left fallow between October and early June, during the winter season of each year. Winter wheat was grown in early October and harvested in early June every year. The winter wheat cropping pattern was left fallow between June and early October every year, and WW–SM was the only cropping pattern with crops throughout the year.
2.3. Soil Sampling and Analysis
In October 2020, soil samples were collected with a soil auger from 0–100 cm depth from the four cropping patterns and their three replicates, each separated into 0–20, 20–40, 40–60, 60–80, and 80–100 cm depths. To determine the chemical properties, samples were air-dried, ground, and sieved using a 2 mm sieve. Fresh soil samples were used for soil enzyme analysis. Soil samples were analyzed for bulk density, structural aggregate, soil ions, soil pH, EC, soil available phosphorous (P), soil available potassium (K), soil organic matter, and soil enzymes. Soil bulk density was determined by taking the soil samples with a metal ring, weighing them while wet, and then drying and weighing them again [26]. The metal ring had a diameter of 5 cm, and its height was 5.1 cm. The metal ring was placed on an undisturbed, flat, horizontal surface in the soil prepared with a spade. Soil structural aggregates were determined by obtaining the mass proportion of aggregates at different sizes and calculating the mean weight diameter (MWD) using procedures from [27]. The aggregate size fractions were determined using the wet-sieving method. Samples of 80 g of soil were air-dried and placed on top of the sieve nests with a series of seven sieves (2 mm, 1 mm, 0.5 mm, 0.25 mm, 0.106 mm, 0.053 mm, and <0.053 mm) to isolate seven aggregate size fractions. The air-dried soil in the sieves was submerged in water for 10 min before the start of the wet-sieving action. After that, wet-sieving was performed using a mechanical shaker with a stroke length of 4 cm vertical, a frequency of 30 cycle min−1, and an oscillation time of 10 min. The material remaining on each sieve was collected, dried at 80 °C, and weighed. The stable aggregate distribution was calculated based on the percentage of total mass in each aggregate fraction by adding two aggregate sizes together. The seven aggregate-size fractions were used to determine the mean weight diameter.
Soil available phosphorous and available potassium were determined using a spectrophotometer at a 890 nm wavelength [28] and a flame photometer from procedures by [29], respectively. Soil pH and EC were determined by extracting a soil solution from a 1:5 suspension. EC and pH were determined using an electrical conductance meter and a pH meter, respectively. Soil ions that were detected were calcium ions, magnesium ions, potassium and sodium ions, chloride ions, bicarbonate ions, sulfate ions, and total soluble salts. A soil solution of 1:5 suspension was used for ion determination. These ions were determined using methods described by [30]. Briefly, bicarbonate ions were determined by double-indicator titration against standard hydrochloric acid, using methyl orange as an indicator. Chloride ion content was determined by silver nitrate titration. Sulfate, calcium, and magnesium ions were determined by the ethylenediaminetetraacetic acid (ETDA) titrimetric method, and potassium and sodium ions were measured by an atomic absorption spectrophotometer. Soil organic carbon determination was based on the Walkley–Black chromic acid wet oxidation method described by Walkley and Black [31], and soil organic matter was determined by multiplying organic carbon concentration by the Van Bemmelen factor of 1.724 [32].
Soil enzyme activities were analyzed using methods involving the base substrate p-nitrophenol [33]. Specifically, the activities of soil β-glucosidase (EC 3.2.1.21), urease (EC 3.5.1.5), alkaline phosphate (EC 3.1.3.1), and arylsulfatase (EC 3.1.6.1) were investigated using methods involving the base substrate p-nitrophenol. Soil β-glucosidase was measured by increasing the absorption rate to 405 nm. Standard mother liquor (1 mg/mL) was prepared, and 1 mL of distilled water was added to the standard Eppendorf PCR tube (EP). The mother liquor was diluted into a standard product with different concentration gradients. The EP tubes were added one by one: 200 μL of standard product, 130 μL of steaming water, 300 μL of tris-hydroxymethyl aminomethane, and 1 mL of 0.5 mol L−1 calcium chloride (CaCl2). They were mixed well, 200 μL was placed into a 96-well plate, and the absorbance was read at 405 nm.
Urease activity was determined by incubating 2 g of soil for 24 h at 37 °C with urea solution, tris (hydroxymethyl) aminomethane (THAM) buffer, and toluene. Distilled water was added, mixed, and centrifuged at 12,000 pm at 25 °C for 10 min, and the supernatant was taken. It was placed at 37 °C for 20 min, and the absorbance value was read at 578 nm.
Alkaline phosphatase activity was measured by preheating a microplate reader for 30 min and adjusting the wavelength to 405 nm. An amount of 5 g of fresh soil, 2 mL of toluene, 10 mL of disodium phenyl phosphate solution and 10 mL of borate buffer were mixed. This mixture was centrifuged at 12,000 rpm for 10 min at room temperature. An amount of 200 µL of supernatant liquid was taken and transferred into a 96-well plate, and the absorbance value of each tube was read at 405 nm.
Arylsulfatase activity was determined by pre-heating the microplate for more than 30 min and adjusting the wavelength to 410 nm. Amounts of 10 μL of standard product, 10 μL of toluene, 240 μL of sodium hydroxide, and 250 μL of calcium chloride were added to the P tube and mixed well. An amount of 200 μL supernatant liquid was taken and transferred into a 96-well plate, and the absorbance value of each tube was measured at 410 nm.
2.4. Statistical Analysis
Statistical analysis was performed using IBM SPSS Statistics 20.0. One-way analysis of variance (ANOVA) was employed to test the significance of mean differences at a p-value of 0.05. A significant effect was determined at p < 0.05, and means were separated using Duncan’s multiple range procedures. The fixed effects were cropping patterns, while the random effects were soil properties. Linear regression and Pearson correlation coefficients were used to determine the relationship between different soil properties.
3. Results and Discussion
3.1. Soil Physical Properties
3.1.1. Soil Aggregate Formation
The greatest mass proportion aggregate was observed at >1 mm in all cropping patterns at the 0–20 cm depth (Table 1). There were no significant differences of MWD, but generally, the greatest mean weight diameter (MWD) was obtained in the winter wheat cropping pattern with 0.73 mm in the 0–20 cm depth and the spring cotton cropping pattern at 20–40 cm depth with 0.68 mm. Significant differences were obtained only in the 20–40 cm depth at <0.053 mm aggregate size.

Table 1.
Mean (±SD) Soil structural aggregation at different aggregate sizes: > 1 mm, 0.25–1 mm, 0.053–0.25 mm, <0.053 mm, and the mean weight diameter (MWD), as affected by different cropping patterns at 0–20 cm and 20–40 cm depths.
Soil structural aggregate size at <0.053 mm in the 20–40 cm depth was highest in winter wheat and lowest in spring cotton. This is probably due to the fact that, during that crop period, winter wheat was at a fallow period; hence, the abandonment of land and reduced physical disruptions in that period allowed the soil to restore its aggregate structure [34]. Baeva et al. [35] concluded that abandoning agricultural land promotes soil structure aggregate formation and stability. Burdukovskii et al. [36] also found fallow soils to have significantly better stability than frequently cultivated soils. An increase in clay and silt content in the 20–40 cm depth could also have caused differences due to translocation, especially after the summer rains. This occurred after all the cropping patterns were tilled in the upper layer [37]. Despite no significant differences in the MWD, there was a trend at both depths. At the 0–20 cm depth, winter wheat had the greatest MWD numerically, followed by spring cotton and WW–SM, whereas spring maize had the least. At the 20–40 cm depth, the trend was as follows: spring cotton, followed by spring maize, then WW–SM, and winter wheat had the lowest. Spring cotton, which generally had a high soil organic matter (Figure 1) also, had the greatest MWD at the 20–40 cm depth. Although this was not statistically significant, the trend was similar to that of Liu et al. [38], who reported that organic matter stabilizes soil aggregates. The soil organic matter could have promoted the rapid recovery of soil aggregate stability [39].
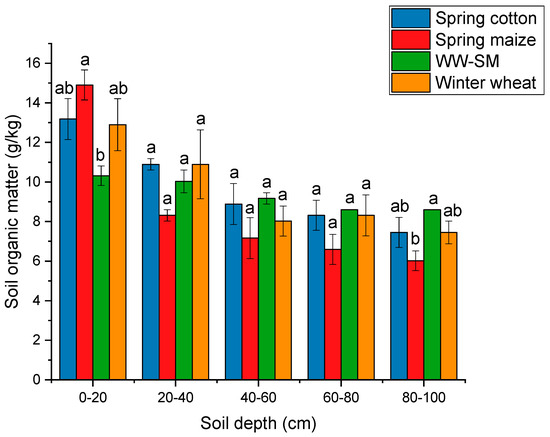
Figure 1.
Soil organic matter showing multiple depths from 0 to 100 cm. Cropping patterns under different labels represent: spring cotton; spring maize; WW–SM: winter wheat–summer maize; and winter wheat. Different letters on the graph represent significant differences between cropping patterns within depth intervals (p < 0.05).
Generally, since cropping patterns had different MWDs, the results showed how every cropping pattern influences soil properties differently. Haynes and Beare [40] attributed root binding and less annual tillage to differences in crop-type aggregate stability. In this study, all cropping patterns had the same tillage application; therefore, root binding could have been a major factor in their differences. Zhang et al. [41] found that winter wheat is known to have deep roots, and in our study, the winter wheat below-ground biomass was not removed. Spring cotton, whose roots also grow deeper, but which were uprooted after the growing season, may have disrupted the soil profile and impacted on the structural aggregate. Corn grown in rotation had a higher proportion of aggregate size compared to continuous corn [42]. Our study obtained similar results where maize grown in rotation had generally higher aggregate size than the mono-cropped spring maize at the 0–20 cm depth.
3.1.2. Soil Bulk Density
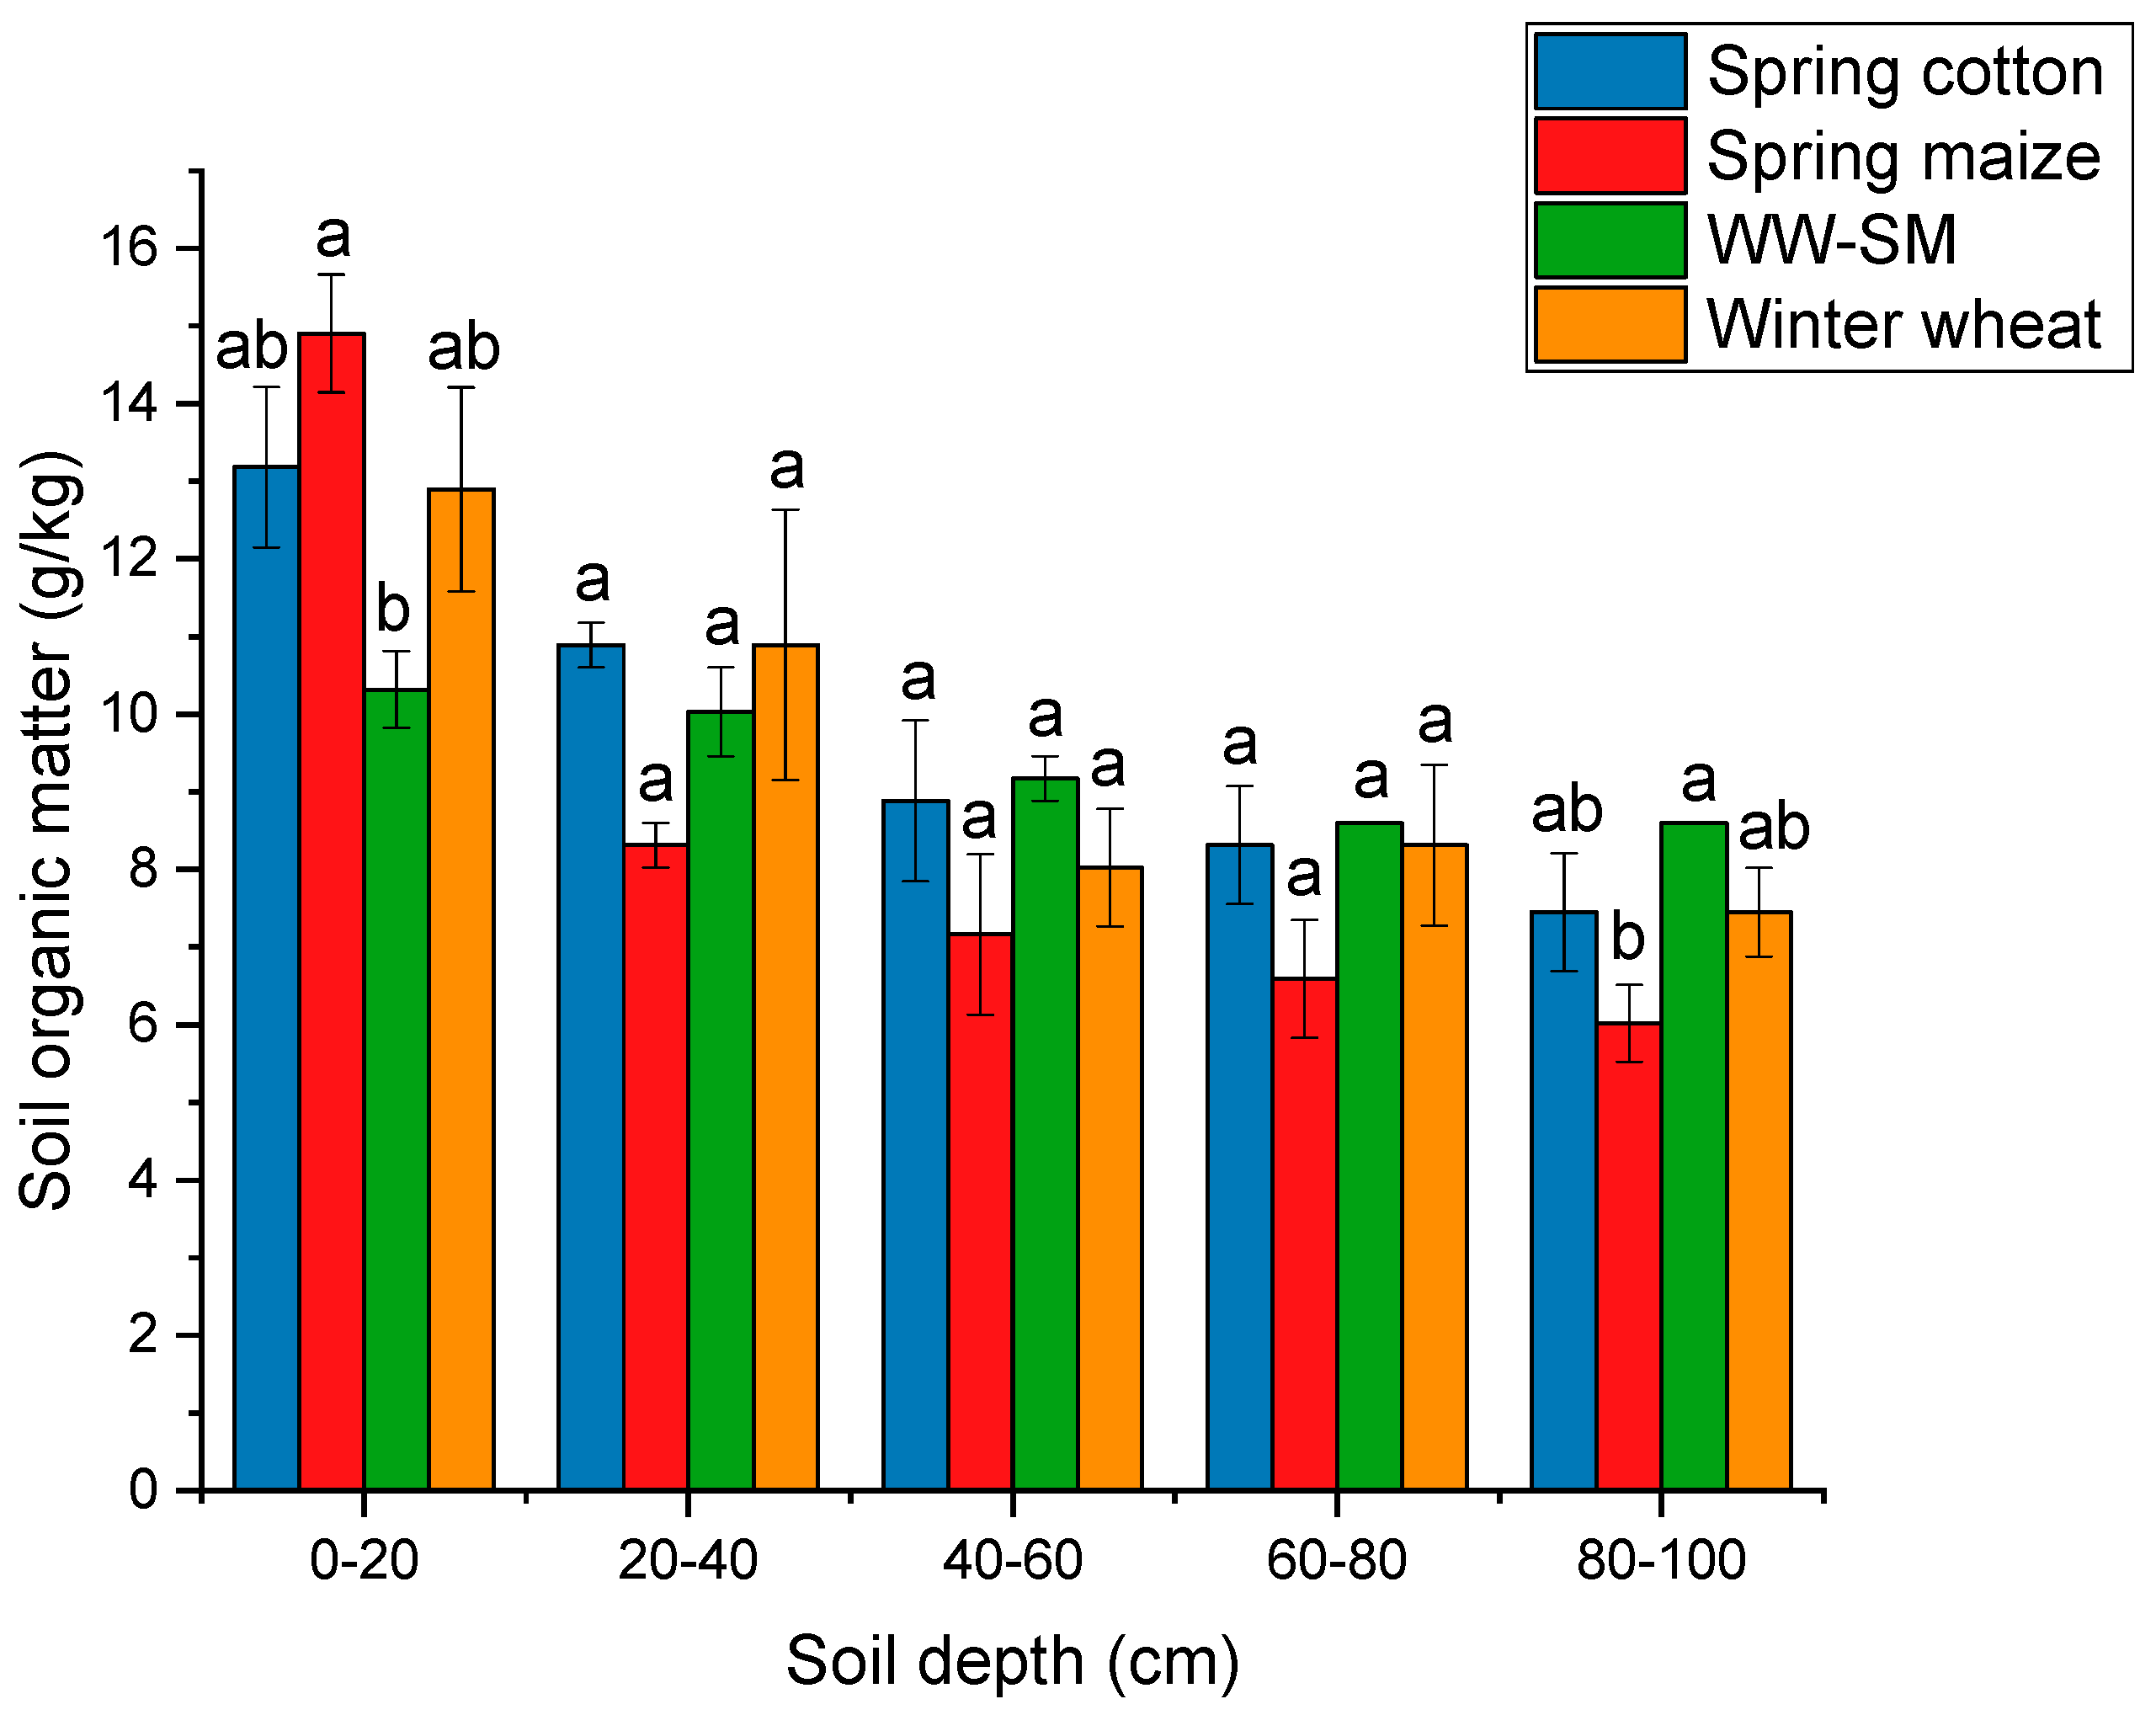
The bulk density of the different crop patterns ranged from 1.16 to 1.34 g/cm3, indicating that the bulk density was suitable for root growth and development since McKenzie et al. [43] reported that bulk densities greater than 1.6 g/cm3 tend to restrict root growth. The effects of different cropping patterns varied in depth, with the 20–40 cm depth having a higher bulk density than the 0–20 cm depth. There were no significant differences between the cropping patterns on soil bulk density; however, it showed an increasing trend. At the 0–20 cm depth, bulk density increased from spring cotton to spring maize, followed by winter wheat, and then WW–SM. At the 20–40 cm depth, bulk density generally increased from winter wheat to spring maize, followed by WW–SM, and then spring cotton (Figure 2).

Figure 2.
Soil bulk density at 0–20 and 20–40 cm depths, as affected by cropping patterns. Cropping patterns under different labels represent spring cotton; spring maize; WW–SM: winter wheat–summer maize; and winter wheat.
Our results were consistent with Huggins et al. [44], who reported no significant differences in bulk density among the cropping patterns regardless of crop types and tillage practices. Lower bulk density at the 0–20 cm depth was probably due to tillage performed at the surface depth [45], and also due to high soil organic matter in all cropping patterns at this depth (Figure 1). High soil organic matter decreases soil bulk density [46]. This was observed in our study, where low bulk density was observed at the 0–20 cm depth in all cropping patterns, while a decline in soil organic matter at the lower depth increased bulk density at the 20–40 cm due to increased compaction and less-dense humus and organic material [47]. At the 0–20 cm depth, spring cotton had numerically higher bulk density than the other cropping patterns. This was probably due to the complete removal of below-ground biomass, which altered the packing arrangement of the soil aggregates [48].
Bulk density in monoculture treatments was numerically higher than that of the WW–SM rotation, with an average of 1.26, 1.25, 1.25, and 1.23 g/cm3 for spring cotton, winter wheat, spring maize, and WW–SM, respectively. Crop rotation is known to decrease soil bulk density and maintain soil sustainability [49]. Wang et al. [50] also observed a decrease in soil bulk density in crop rotations. Our study was inconsistent with that of Nyamadzawo et al. [51], who concluded that bulk density was lower under fallow conditions as compared to the continuous maize-cropping system. Their study reported that fallowing improves soil organic matter in the fallowing phase, and these benefits are quickly lost during the cropping phase. The inconsistency in our results was probably due to the length of the fallow period of crops since the fallowing period was limited to an average of six months, whereas [51] had a fallow phase of up to two years. The benefits obtained from our fallow phase diminished rapidly for the monoculture crops.
3.2. Soil Chemical Properties
3.2.1. Soil Organic Matter
Soil organic matter (SOM) varied with depth with significant differences between the cropping patterns being observed at the 0–20 and 80–100 cm depths, as the organic matter declined with depth (Figure 1).
Spring maize had the highest soil organic matter, followed by spring cotton, winter wheat, and WW–SM had the least in the upper layer. However, spring maize had the least amount of soil organic matter along the soil profile, especially at the 80–100 cm depth, where significant differences were observed. This could have resulted from increased rates of decomposition, especially from a combination of its crop residues, increased water content from summer rains, and increased soil temperature in the summer. Lower SOM in spring maize could also have resulted from high amounts of soluble salts causing a reduction in soil organic matter additions in the soil [52]. Higher organic matter in the upper depth was probably due to increased crop residue combined with surface tillage. This could have caused high SOM in the upper depth. Higher soil organic matter in the WW than in the WW–SM in the upper layer was probably due to the fallow period, where the soil was undisturbed, as previous existing stable soil organic matter was protected [53]. Fallowing also helps soil to restore soil organic carbon, which converts to SOM [54].
Higher soil organic matter was observed in the single-cropping patterns compared to the double-cropping patterns at the 0–20 cm depth; however, with declining depth, the single-cropping patterns’ organic matter declined compared to that of the WW–SM. This was probably due to the fact that the WW–SM cropping pattern increased crop residue from the wheat and maize compared to the monocrops. The double-cropping pattern below-ground biomass was also not removed; hence, it contained more residue. Decomposition rate decreases down the soil profile due to the decreased number of microorganisms [55]. This could explain why soil organic matter declined with depth in our study. Halvorson et al. [56] identified that the fallow period enhances organic matter mineralization through increased soil temperature and water content.
3.2.2. Soil Available Phosphorous and Available Potassium
Soil available phosphorous varied with depth, and significant differences (p < 0.05) between the cropping patterns were observed at all depths. Phosphorous was high at the 0–20 cm depth in all cropping patterns, but it declined with depth (Table 2).
Table 2.
Mean (±SD) soil available phosphorous and potassium at 0–20 cm and 20–40 cm depths, as affected by cropping patterns.
The upper soil surface across all treatments had a higher P compared to the subsurface layer, with an average of 9.62 and 5.61 mg/kg at 0–20 and 20–40 cm depth, respectively. The greater soil phosphorous amount at the 0–20 cm depth was probably a result of increased crop residue returned to the soil. Phosphorous is also known to not leach into soil; hence, its continuous application could lead to build-up over several growing seasons, especially in rain-fed soils [57,58]. Zuber et al. [59] observed similar results where the 0–20 cm depth had greater soil P and K than the soil below. Wright et al. [60] identified nutrient availability to increase with decreasing pH. This was evident in our study, where spring maize, which had the highest soil available phosphorous in the surface layer, had the lowest pH (Table 3).
Table 3.
Mean (±SD) soil pH showing multiple depths from 0 to 100 cm, as affected by cropping patterns.
High soil organic matter at the 0–20 cm depth in all cropping patterns was also probably the reason for high soil P at the same depth than at the lower depths. This was supported by spring maize, which had significantly higher soil organic matter at the 0–20 cm depth and higher soil P at the same depth. At the 20–40 cm depth, lower soil P was probably due to increased crop uptake. Sainju et al. [61] also observed higher Olsen -P at the 0–7.5 cm than at the 7.5–15 cm depth and reported that the immobile nature of P also caused the differences in P concentration. Balemi and Negisho [62] determined that soil P can decline due to its mineralization.
Spring maize and WW–SM had the highest levels of soil P compared to other cropping patterns, and in terms of crop needs, this proved that these cropping patterns have different nutrient needs and take up nutrients in different amounts since all cropping patterns received similar fertilizer applications. The maize crop pattern had higher soil P and K than the wheat crop pattern. This was probably due to the fact that the maize cropping pattern has a low capacity of up-taking nutrients. In terms of different nutrients’ crop-uptake, Engel [63] identified maize as having a lower ability to adapt to root zone temperatures compared to wheat by increasing its biomass allocation towards the roots. Therefore, this causes great susceptibility of maize to nutrient deficiency by causing limited uptake through nutrient transport processes in the soil towards the roots. This means that, when P and K are difficult to be up-taken by the plant, then its concentration would be higher in the soil. Li et al. [64] also reported wheat to have a greater capability of acquiring nutrients compared to maize. The absence of crops in the winter wheat cropping pattern in its fallow period could also have resulted in low levels of P at both depths.
Soil available potassium varied with depth, and significant differences (p < 0.05) were observed between the cropping patterns on soil available potassium (Table 2). Similar to soil phosphorous, the 0–20 cm depth had higher available potassium with an average of 194.36 and 186.74 mg/kg at 0–20 and 20–40 cm. Soil potassium also declined with depth among the cropping patterns, except for the winter wheat pattern. This was probably due to the lack of crops and K fertilization during the fallow period. Soil K decline in all the treatments was consistent with the findings of Kazula et al. [46], where potassium concentrations also declined with depth among the cropping patterns.
Spring cotton had higher soil K at the 0–20 cm depth, probably due to its high exhaustive and sensitive nature, where it requires abundant amounts of K [65,66]. Hence, there was more deposition of K in the upper layer from mining in the lower soil depths [67,68]. Higher soil K amount in WW–SM than in the wheat–fallow cropping pattern was probably due to the WW–SM different crop rotation’s ability to improve nutrient-use efficiency. At the 0–20 cm depth, the significant differences between crops grown and winter wheat indicated that the duration of crops grown has a significant effect on soil K. This occurred because a lower soil K in winter wheat was probably due to increased uptake during its growth season, which takes up to 9 months, while the growth period of maize and cotton is about 4 to 6 months. Non-significant differences between WW–SM and spring maize at the 0–20 cm depth and between spring cotton and winter wheat at the 20–40 cm depth suggested that these cropping patterns had no significant effect on K concentration on these crop types at those depths.
3.2.3. Soil pH
Soil pH ranged from 8.29 to 8.63 across all soil depths and cropping patterns (Table 3). There were no significant differences between the cropping patterns on soil pH.
Soil pH is considered a soil fertility indicator [69], due to its ability to influence the availability of factors that contribute to fertility, such as nutrients and organic matter. The pH for all treatments increased with depth (p = 0.027). There were no significant effects of cropping patterns on soil pH. However, there was a declining trend among the cropping patterns. Low soil pH at the surface depth was probably a result of N fertilization due to the presence of ammonium in the fertilizer. The ammonium was converted to nitrate in the soil through nitrification, causing the release of H+. The nitrate released combined with cations, such as calcium and magnesium, and leached from the topsoil to the subsoil, and as these cations were removed and replaced by H+, soil pH declined [70]. Similar results were observed by Sainju et al. [57] and Schlatter et al. [71], where soil pH was low in the surface layer as compared to the deeper layers in all the treatments. The results from our study were in contrast with Bowman and Halvorson [72], who reported a decrease in pH down the soil profile in different cropping patterns, and they attributed the decline to nitrification of ammoniacal N source over nitrate uptake by crops.
An increase in soil pH is known to result from an increase in soil carbonates and a decline in chloride ions [73]. In our study, the winter wheat crop pattern, which generally had the highest bicarbonate ions and lowest chloride ions, generally had the greatest pH in the surface layer. The general increase of soil pH down the soil profile was probably due to an increase in total salts down the depth [74]. There was also a positive correlation between soil pH and bicarbonate ions (HCO3−) (Table 4).
Table 4.
Significant correlation coefficients (r) between different soil properties at p = 0.05 at the 0–20 cm depth.
3.2.4. Soil Electrical Conductivity
Soil electrical conductivity (EC) ranged from 0.37 to 0.22 dS/m across all soil-depth and cropping patterns. Significant differences were only observed at the 80–100 cm depth for soil EC (Table 5).
Table 5.
Mean (± SD) soil EC showing soil depth from 0 to 100 cm, as affected by cropping patterns.
Othaman et al. [75] reported that soil EC is directly proportional to nutrient concentration and that the higher the EC value, the higher the salt concentration. In this study, electrical conductivity was found in levels that do not affect crop development [11] since EC is a measure of soil salinity. There was a positive correlation between soil EC and soil chloride ions, sulfate ions, and potassium and sodium ions (Table 4). This indicated that an increase or decrease in these soil ions could lead to either an increase or decrease in soil EC. In our study, spring maize generally had the greatest EC and the highest concentration of these ions, followed by spring cotton, WW–SM, and winter wheat in the soil surface layer. Visconti et al. [76] also observed similar results where Na+, Cl−, Ca2+, and SO42− were positively correlated with the electrical conductivity with (r > 0.85).
Soil EC changes drastically with slight changes in soil water-content and is affected by the quality of fertilization and soil drainage properties. Spring cotton and spring maize patterns generally had greater soil EC, probably due to a loss of water through evapotranspiration and increased water uptake by the plants, causing the deposition of ions at the root depth. Significant differences at the 80–100 cm depth were probably due to the leaching of salts caused by summer rains. Nutrient leaching has been identified as diminishing soil fertility and reducing soil pH [77] at the 0–20 cm depth. Significantly high EC in spring cotton at the 80–100 cm depth was probably due to the existence of plastic mulch, which helped conserve water and minimize the rate of evaporation. Therefore, cotton’s deep roots [78] may have contributed significantly to better water infiltration, which was retained at the deeper depths. This, in turn, caused high EC due to the mobilization of ions [78].
3.2.5. Soil Ions and Total Soluble Salts
Total soluble salts, calcium ions, magnesium ions, potassium and sodium ions, chloride ions, bicarbonate ions, and sulfate ions were studied in this experiment. Significant differences were observed in HCO3−, Ca2+, K+, and Na+ (Table 6). Soil SO42−, Ca2+, and Mg2+ ions were high in the upper levels and declined with depth, with spring cotton, spring maize, and WW–SM cropping patterns having the highest levels of ion content while HCO3−, Cl−, K+, and Na+ increased with depth. Soil ions without significant differences were not affected by cropping patterns. Significant differences in total soluble salts were observable at the 80–100 cm depth, with spring maize having the highest. The total salt concentration was numerically greater in the top layer and declined with depth in all cropping patterns except winter wheat.
Table 6.
Mean (±SD) soil calcium, magnesium, potassium and sodium ions, chloride, bicarbonate, sulfate, and total soluble salts, showing soil depth from 0 to 100 cm, as affected by cropping patterns.
Changes in soil ion concentration down a soil profile can result from seasonal moisture fluctuations and evapotranspiration [79]. In this study, total salt concentration was numerically greater in the upper depth and lower in the subsoil. Rengasamy [80] attributed high salt content in the surface depth to high evapotranspiration, which could also have been the reason for high salt content in the surface layer in our study.
Ca2+, Mg2+ and SO42−, and Cl− declined with depth, meaning they were highly concentrated at the top surface. This was probably due to increased levels of evapotranspiration since, when water evaporates, salts are left behind. This took place in all cropping patterns; however, winter wheat generally had the lowest levels of these ion concentrations and total soluble salts. This was probably due to the fact that the crop was not grown in that crop period; hence, there was less evapotranspiration compared to the other cropping patterns [81]. Spring maize had the highest levels of potassium and sodium ions, which could have affected other nutrient properties, such as soil organic matter. The crop pattern also had the highest total soluble salts in the 80–100 cm.
Significant correlations were noted between soil ions and other soil properties (Table 6). There was a negative correlation between calcium ions and bicarbonate ions, sulfate and bicarbonate, and a positive correlation between chloride ions and sulfate ions, and between chloride ions and potassium and sodium ions.
3.3. Soil Enzyme Activities
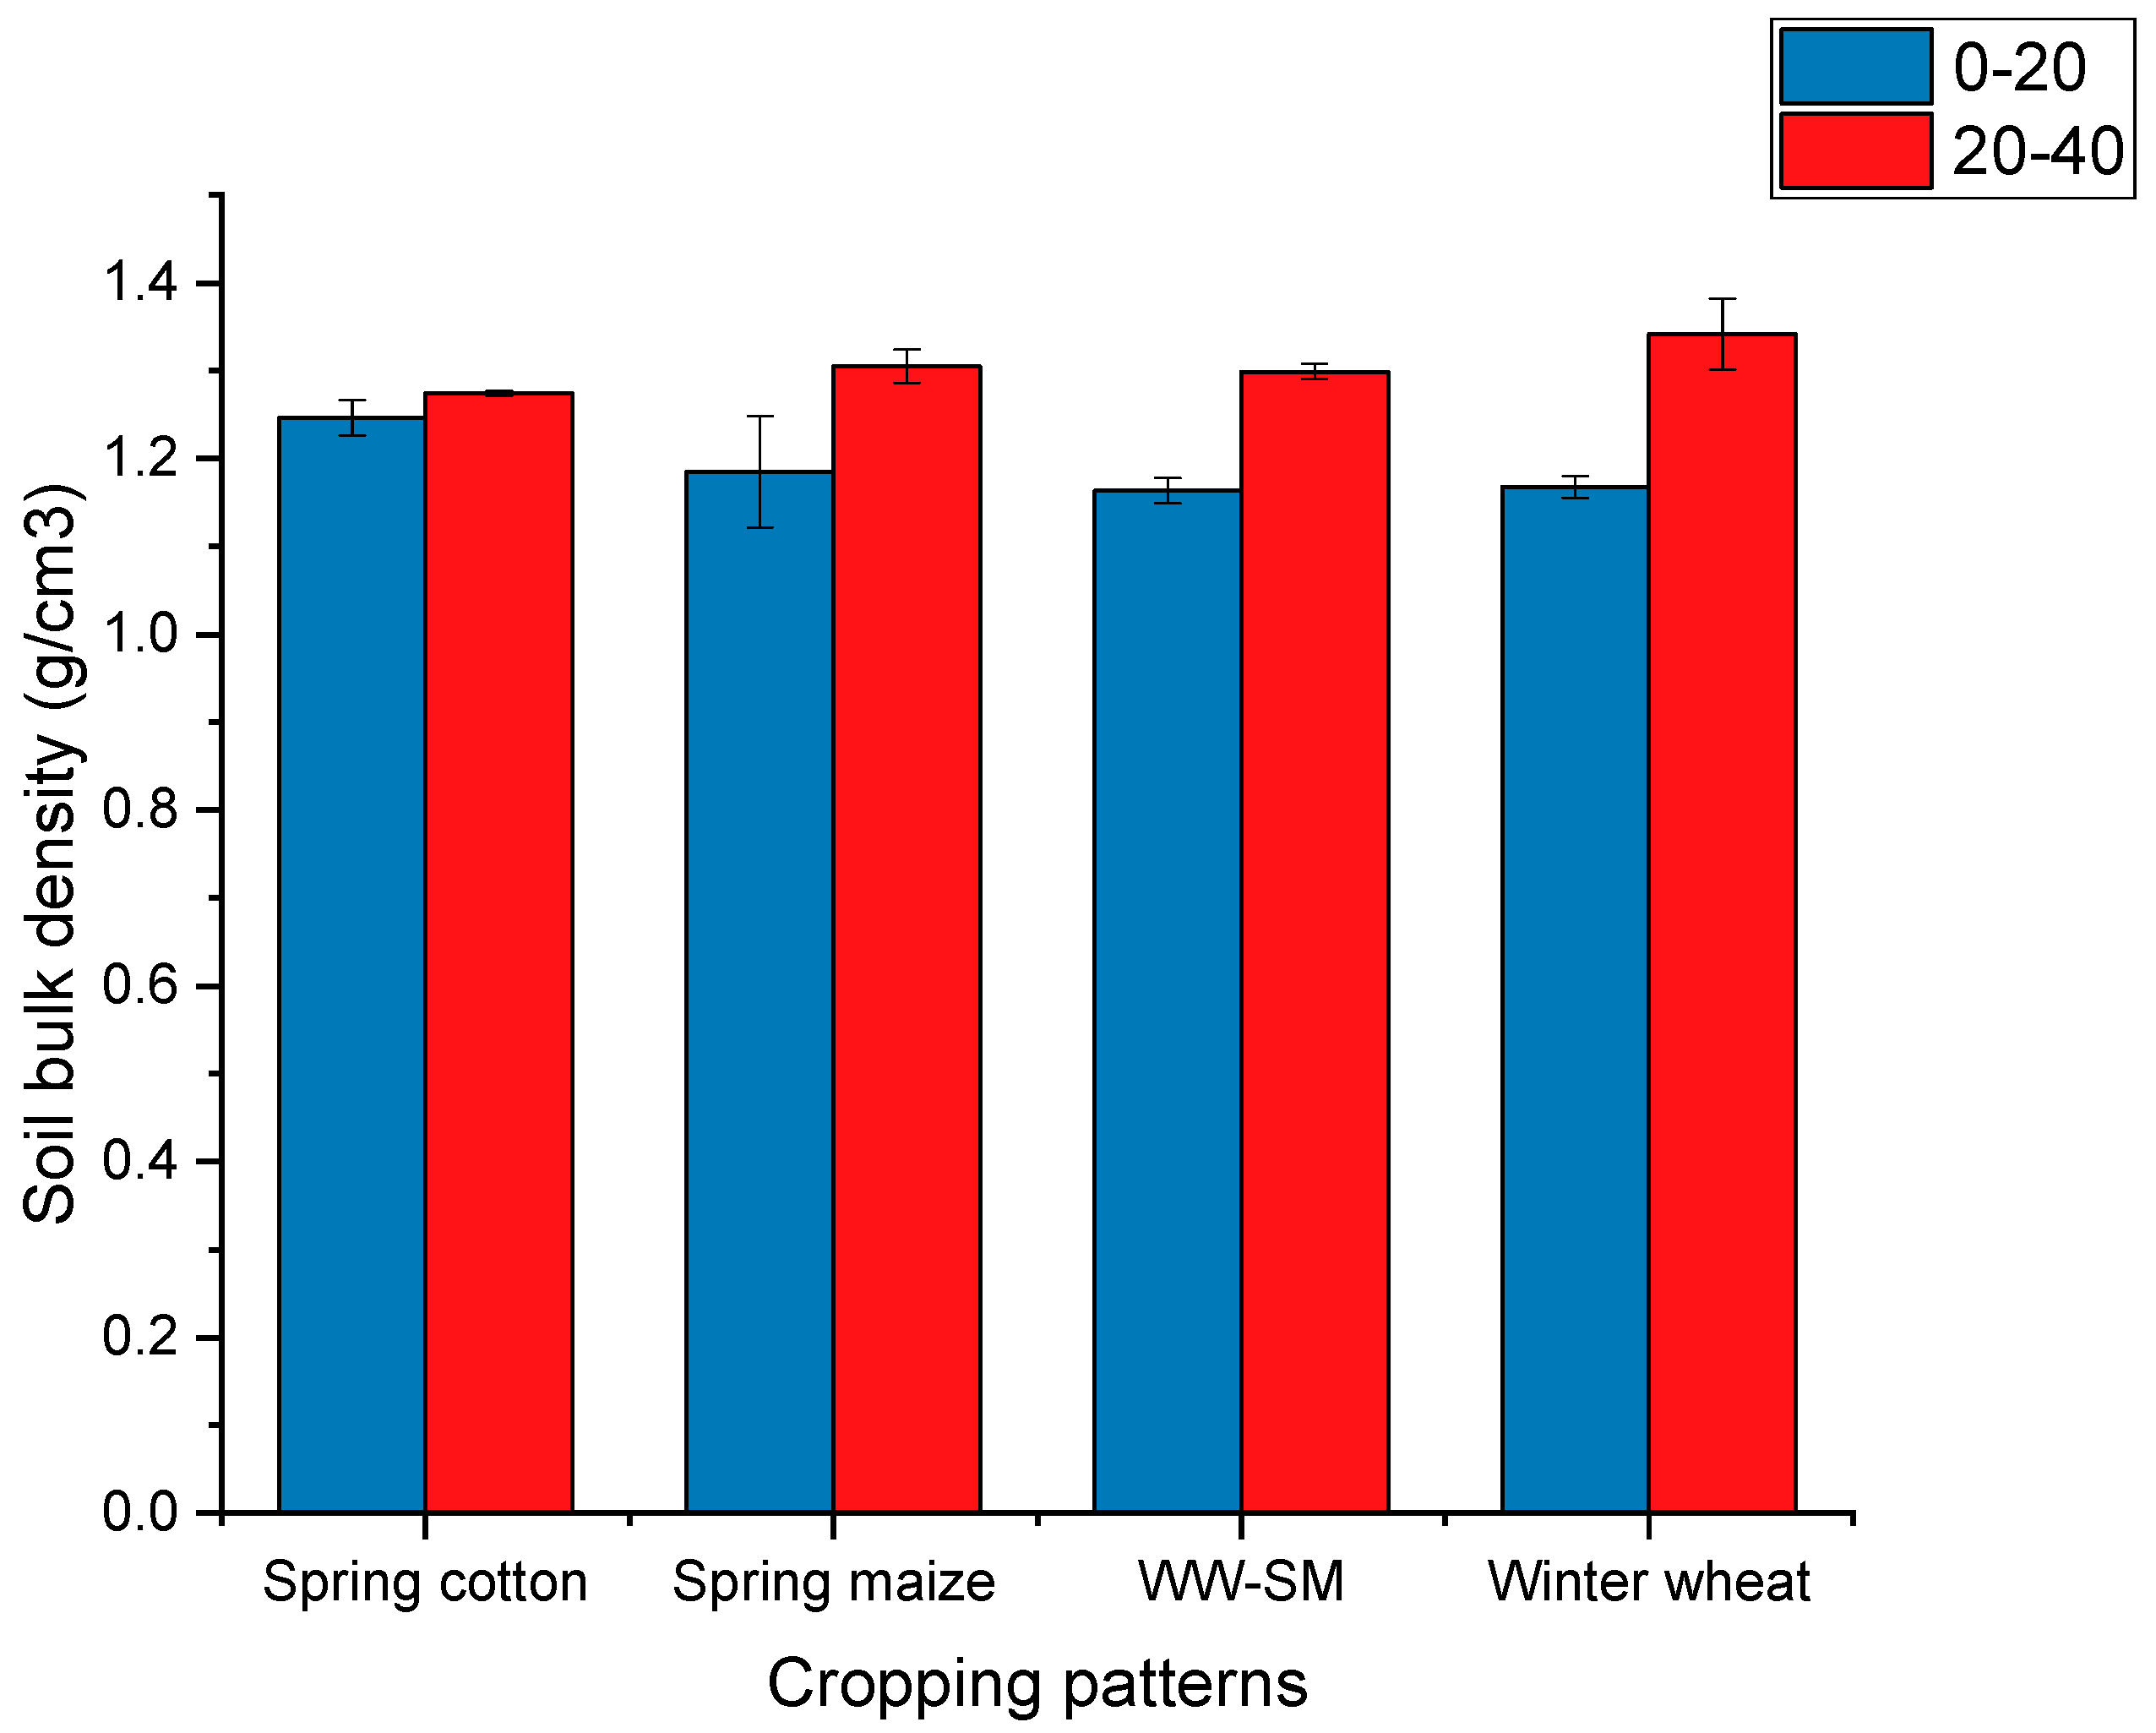
The effects of the cropping patterns on soil enzymatic activities are represented in (Figure 3). In this study, the soil enzyme activities showed no significant changes among all cropping patterns; however, the four studied enzyme activities performed differently under the different cropping patterns. Glucosidase activity was generally greater in WW–SM, followed by winter wheat, spring maize, and spring cotton. Urease activity was also numerically greater in WW–SM and lowest in winter wheat. A similar trend occurred in arylsulfatase, while alkaline phosphatase activity was greater in spring maize, followed by WW–SM, spring cotton, and winter wheat.

Figure 3.
Enzyme activities of (a) Glucosidase; (b) Urease; (c) Alkaline phosphatase; and (d) Arylsulfatase activities at 0–20 cm depth. Different labels represent: spring cotton; spring maize; WW–SM: winter wheat–summer maize; and winter wheat. Different letters on the graph represent significant differences between cropping patterns within depth intervals (p < 0.05).
Different types of cropping patterns may influence soil quality. The single-cropping patterns showed lower enzyme activities than WW–SM, probably due to the lack of surface residue during the fallow period. This reduced the level of microbial activity, as indicated by the lower enzyme activity rates. Williams et al. [82] indicated that reducing the fallow period could help increase soil activity and promote enzyme activity. This was evident in the WW–SM cropping pattern, which had no fallow period and generally had greater enzyme activity than the other cropping patterns. Similar results were observed by Dick [83], who identified crop rotations as increasing soil enzyme activities through larger plant diversity. In this study, enzyme activities were generally greater in the WW–SM cropping pattern, probably due to more below-ground biomass, which helped increase enzyme activity in the soil through soil microbial activity.
Enzyme activity in winter wheat was numerically lower than in the other cropping patterns; this was probably due to the fact that active enzyme activity had decreased after residues decomposed, and by the time soil was collected, enzyme activity had already gotten to a steadier state. Dou et al. [21] identified enzyme activity as peaking off immediately after residue incorporation and decreasing after residue decomposition. This shows that enzyme activity would probably be high in frequently cultivated fields that attain more residues. Spring cotton also had low enzyme activity, probably due to little or no crop residue return in the soil.
In this study, most enzyme activities were found to be higher in a frequently cultivated field compared to a fallow field, and higher in crop-rotated fields than in single-crop patterns. Kumar et al. [84] also found higher enzyme activity in cultivated fields compared to those with a fallow period. Different rates of enzyme activity between spring cotton, spring maize, and winter wheat indicated that crop species and amount of residue return played important roles in controlling microbial activity. There was a correlation between soil alkaline phosphatase and soil EC. Junnarkar et al. [85] also found correlations between alkaline phosphatase and EC.
Most soil properties were not significantly impacted by the cropping patterns. However, there were differences in trends in the cropping patterns. The cropping patterns had similar applications of tillage and fertilizer. Hence, differences taking place in the surface layer were attributed to different fallow periods in the single-cropping patterns and to the different amounts of crop residues returned to the soil. Winter wheat, which had no crops in summer, during which soil evaporation was high, led to reduced salt concentration and lower electrical conductivity in the cropping pattern, especially in the surface layer. It also had the least soil P and K at the 0–20 and 20–40 cm depths.
Crop needs also played an important factor. In spring cotton, this resulted in high soil available K in the surface layer, and due to increased crop uptake, it had the least in the subsoil. WW–SM showed greater trends than the other cropping patterns, probably due to increased crop residue return. From these results, the time of sampling could have greatly affected how the different cropping patterns influenced the soil properties.
Winter wheat showed a low concentration of nutrients, probably because sampling took place at the end of the summer cropping season before the application of fertilizer and after the summer rains. During that period, winter wheat aggregates were restructured, hence generally having greater MWD at the 0–20 cm depth. Winter wheat <0.053 mm aggregate size was also highly significant at the 20–40 cm depth, probably due to translocation of clay and silt to the lower depth and a fallow period which allowed for aggregate formation. High soluble salts could affect decomposition in the deep layers, which can cause a decline in soil organic matter. Spring maize had high soil organic matter at the 0–20 cm depth, probably due to returning residue. However, probably due to higher total soluble salts than other cropping patterns, this could have caused its soil organic matter to decline down the soil profile. An increased rate of decomposition, combined with increased water and temperature, could have attributed to its decline.
Spring cotton’s below- and above-ground crop residues were removed, but its soil organic matter decline was lower than that of the other single-cropping patterns. This shows that the addition of crop residues can enhance soil organic matter, hence promoting soil fertility and productivity. This shows that time of crop growth, sampling time, and residue treatment affected soil properties. However, more research on the long-term impacts of different cropping patterns is required. Sampling after winter crops is also needed to identify how crop patterns influence soil properties during that season. This information would be helpful to identifying which cropping pattern can promote sustainable agriculture and thus allow the implementation of appropriate crop-specific management practices.
4. Conclusions
On the basis that fertilizer and tillage application were the same for all cropping patterns, the long-term impacts of these cropping patterns on soil properties were studied. The results indicated that factors such as evapotranspiration, residue return, and the fallow period had an influence on the effects of cropping patterns, especially in the surface layer. The values of soil nutrients mainly depended on crops that were in season before sampling time. The crop rotation effect of WW–SM showed the potential for increasing soil organic matter, especially down the soil profile. The single-cropping patterns showed the potential for enhancing soil health; however, more management practices need to be adapted.
These findings will be useful for understanding the relationships between soil properties and cropping patterns, and how factors such as evapotranspiration, residue return, crop needs, and the fallow period influence their interactions. The findings also provide valuable information with the intent of applying suitable measurements for agricultural practices and promoting the increase of soil organic matter, hence increasing soil productivity, in the North China Plain to improve crop output.
Author Contributions
Conceptualization, F.N.G. and X.L.; data collection, F.N.G. and K.G.; methodology, K.G. and X.L.; validation, X.L.; formal analysis, F.N.G. and X.D.; writing—original draft preparation, F.N.G.; writing—review and editing, F.N.G., X.D, P.S.M. and X.L.; visualization, X.L.; supervision, X.D. and X.L. All authors have read and agreed to the published version of the manuscript.
Funding
National Key R&D Program of China, 2021YFD1900904 and Key Research and Development Program of Hebei Province (21326411D).
Institutional Review Board Statement
Not applicable.
Informed Consent Statement
Not applicable.
Data Availability Statement
The data presented in this study are available within the article.
Conflicts of Interest
The authors declare no conflict of interest.
References
- Trivedi, P.; Singh, B.P.; Singh, B.K. Chapter 1. Soil Carbon: Introduction, Importance, Status, Threat, and Mitigation; Elsevier Inc.: Amsterdam, The Netherlands, 2018. [Google Scholar] [CrossRef]
- Wang, L.; Zhao, Y.; Al-Kaisi, M.; Yang, J.; Chen, Y.; Sui, P. Effects of Seven Diversified Crop Rotations on Selected Soil Health Indicators and Wheat Productivity. Agronomy 2020, 10, 235. [Google Scholar] [CrossRef] [Green Version]
- Li, S.; Wu, J.; Wang, X.; Ma, L. Economic and Environmental Sustainability of Maize-Wheat Rotation Production When Substituting Mineral Fertilizers with Manure in the North China Plain. J. Clean. Prod. 2020, 271, 122683. [Google Scholar] [CrossRef]
- Li, F.; Li, Z.; Qiao, Y.; Zhu, N.; Du, K.; Leng, P.; Liu, S. Winter Wheat and Summer Maize Roots in Agro-Ecosystems on the North China Plain. The Root Systems in Sustainable Agricultural Intensification, 1st ed.; Wiley: Hoboken, NJ, USA, 2021; pp. 271–288. [Google Scholar] [CrossRef]
- Yang, X.; Chen, Y.; Pacenka, S.; Gao, W.; Zhang, M.; Sui, P.; Steenhuis, T.S. Recharge and Groundwater Use in the North China Plain for Six Irrigated Crops for an Eleven Year Period. PLoS ONE 2014, 10, e0115269. [Google Scholar] [CrossRef] [Green Version]
- Yang, X.; Chen, Y.; Pacenka, S.; Gao, W.; Ma, L.; Wang, G.; Yan, P.; Sui, P.; Steenhuis, T.S. Effect of Diversified Crop Rotations on Groundwater Levels and Crop Water Productivity in the North China Plain. J. Hydrol. 2015, 522, 428–438. [Google Scholar] [CrossRef]
- Gao, B.; Ju, X.; Meng, Q.; Cui, Z.; Christie, P.; Chen, X.; Zhang, F. The Impact of Alternative Cropping Systems on Global Warming Potential, Grain Yield and Groundwater Use. Agric. Ecosyst. Environ. 2015, 203, 46–54. [Google Scholar] [CrossRef]
- Xiao, D.; Shen, Y.; Qi, Y.; Moiwo, J.P.; Min, L.; Zhang, Y.; Guo, Y.; Pei, H. Impact of Alternative Cropping Systems on Groundwater Use and Grain Yields in the North China Plain Region. Agric. Syst. 2017, 153, 109–117. [Google Scholar] [CrossRef]
- Liu, M.; Min, L.; Shen, Y.; Wu, L. Evaluating the Impact of Alternative Cropping Systems on Groundwater Consumption and Nitrate Leaching in the Piedmont Area of the North China Plain. Agronomy 2020, 10, 1635. [Google Scholar] [CrossRef]
- Shi, H.; Wang, X.; Xu, M.; Zhang, H.; Luo, Y. Characteristics of Soil C:N Ratio and Δ13C in Wheat-Maize Cropping System of the North China Plain and Influences of the Yellow River. Sci. Rep. 2017, 7, 16854. [Google Scholar] [CrossRef] [Green Version]
- Liu, X.; Mao, R.; Bai, P.; Luo, C. Reclaiming the Saline Soils of Nanpi County: Turning Knowledge into Practice. Aciar Monogr. Ser. 2014, 84, 366–370. [Google Scholar]
- Sun, B.; Zhou, S.; Zhao, Q. Evaluation of Spatial and Temporal Changes of Soil Quality Based on Geostatistical Analysis in the Hill Region of Subtropical China. Geoderma 2003, 115, 85–99. [Google Scholar] [CrossRef]
- Gajda, A.M.; Czyz, E.A.; Dexter, A.R. Effects of Long-Term Use of Different Farming Systems on Some Physical, Chemical and Microbiological Parameters of Soil Quality. Int. Agrophys. 2016, 30, 165–172. [Google Scholar] [CrossRef]
- Sun, H.; Zhang, X.; Liu, X.; Liu, X.; Ju, Z.; Shao, L. The Long-Term Impact of Irrigation on Selected Soil Properties and Grain Production. J. Soil Water Conserv. 2018, 73, 310–320. [Google Scholar] [CrossRef]
- Mu-Chun, Y.; Ting-Ting, X.; Peng-Hui, S.; Jian-Jun, D. Effects of Different Cropping Patterns of Soybean and Maize Seedlings on Soil Enzyme Activities and MBC and MBN. J. Northeast Agric. Univ. 2012, 19, 42–47. [Google Scholar] [CrossRef]
- Wright, A.L.; Dou, F.; Hons, F.M. Soil Organic C and N Distribution for Wheat Cropping Systems after 20 Years of Conservation Tillage in Central Texas. Agric. Ecosyst. Environ. 2007, 121, 376–382. [Google Scholar] [CrossRef]
- Wright, A.L.; Hons, F.M.; Matocha, J.E. Tillage Impacts on Microbial Biomass and Soil Carbon and Nitrogen Dynamics of Corn and Cotton Rotations. Appl. Soil Ecol. 2005, 29, 85–92. [Google Scholar] [CrossRef]
- Shen, X.; Yang, F.; Xiao, C.; Zhou, Y. Increased Contribution of Root Exudates to Soil Carbon Input during Grassland Degradation; Elsevier Ltd: Amsterdam, The Netherlands, 2020; Volume 146. [Google Scholar] [CrossRef]
- Thorup-Kristensen, K.; Cortasa, M.S.; Loges, R. Winter Wheat Roots Grow Twice as Deep as Spring Wheat Roots, Is This Important for N Uptake and N Leaching Losses? Plant Soil 2009, 322, 101–114. [Google Scholar] [CrossRef]
- Zhi, X.; Han, Y.; Li, Y.; Wang, G.; Feng, L.; Yang, B.; Fan, Z.; Lei, Y.; Du, W.; Mao, S. Root Growth and Spatial Distribution Characteristics for Seedlings Raised in Substrate and Transplanted Cotton. PLoS ONE 2017, 12, e0190032. [Google Scholar] [CrossRef] [Green Version]
- Dou, F.; Wright, A.L.; Mylavarapu, R.S.; Jiang, X.; Matocha, J.E. Soil Enzyme Activities and Organic Matter Composition Affected by 26 Years of Continuous Cropping. Pedosphere 2016, 26, 618–625. [Google Scholar] [CrossRef]
- Mcdaniel, M.D.; Grandy, A.S.; Tiemann, L.K.; Weintraub, M.N. Eleven Years of Crop Diversification Alters Decomposition Dynamics of Litter Mixtures Incubated with Soil. Ecosphere 2016, 7, e01426. [Google Scholar] [CrossRef]
- Lal, R. Soils and Food Sufficiency. A Review. Sustain. Agric. 2009, 29, 113–133. [Google Scholar]
- Wright, A.L.; Hons, F.M.; Lemon, R.G.; McFarland, M.L.; Nichols, R.L. Microbial Activity and Soil C Sequestration for Reduced and Conventional Tillage Cotton. Appl. Soil Ecol. 2008, 38, 168–173. [Google Scholar] [CrossRef]
- Feng, Y.; Motta, A.C.; Reeves, D.W.; Burmester, C.H.; Van Santen, E.; Osborne, J.A. Soil Microbial Communities under Conventional-till and No-till Continuous Cotton Systems. Soil Biol. Biochem. 2003, 35, 1693–1703. [Google Scholar] [CrossRef]
- He, J.; Li, H.; Rasaily, R.G.; Wang, Q.; Cai, G.; Su, Y.; Qiao, X.; Liu, L. Soil Properties and Crop Yields after 11 Years of No Tillage Farming in Wheat-Maize Cropping System in North China Plain. Soil Tillage Res. 2011, 113, 48–54. [Google Scholar] [CrossRef]
- Nichols, K. Soil Quality Demonstrations and Procedures; USDA-ARS-Northern Great Plains Research Laboratory: Mandan, ND, USA, 2011; p. 18.
- Kuo, S. Phosphorus. Methods Soil Analysis. Part 3; Chemical Methods-SSSA Book Series No. 5; Wiley: Hoboken, NJ, USA, 1996; Volume 5, pp. 869–919. [Google Scholar] [CrossRef]
- Jadoon, S.; Aljaff, H.K.; Hamawandy, J.K.; Pashdary, S.S.; Zakhoy, A.S. Assessment of the Available Potassium in the Soil of Baharka District, Kurdistan-Iraq. Pharma Chem. 2015, 7, 1–8. [Google Scholar]
- Nelson, D.; Sommers, L. Methods of Soil Analysis. Part 3. Chemical Methods; Chemical Methods Soil Science Society of America Book Series; Bigham, J.M., Ed.; SSSA: Madison, WI, USA, 1996; pp. 961–1010. [Google Scholar]
- Walkley, A.; Black, I.A. An examination of the Degtjareff method for determining soil organic matter, and a proposed modification of the chromic acid titration method. Soil Sci. 1934, 37, 29–38. [Google Scholar] [CrossRef]
- Thompson, L.M.; Troeh, F.R. Soils and Soil Fertility. AIBS Bull. 1978, 7, 53. [Google Scholar] [CrossRef]
- Tabatabai, M.A. Soil Enzymes. Methods Soil Anal. Part 2 Microbiol. Biochem. Prop. 1994, 5, 775–834. [Google Scholar] [CrossRef]
- Zhou, M.; Liu, C.; Wang, J.; Meng, Q.; Yuan, Y.; Ma, X.; Liu, X.; Zhu, Y.; Ding, G.; Zhang, J.; et al. Soil Aggregates Stability and Storage of Soil Organic Carbon Respond to Cropping Systems on Black Soils of Northeast China. Sci. Rep. 2020, 10, 265. [Google Scholar] [CrossRef]
- Baeva, Y.I.; Kurganova, I.N.; Lopes de Gerenyu, V.O.; Pochikalov, A.V.; Kudeyarov, V.N. Changes in Physical Properties and Carbon Stocks of Gray Forest Soils in the Southern Part of Moscow Region during Postagrogenic Evolution. Eurasian Soil Sci. 2017, 50, 327–334. [Google Scholar] [CrossRef]
- Burdukovskii, M.; Kiseleva, I.; Perepelkina, P.; Kosheleva, Y. Impact of Different Fallow Durations on Soil Aggregate Structure and Humus Status Parameters. Soil Water Res. 2020, 15, 1–8. [Google Scholar] [CrossRef] [Green Version]
- Warrington, D.N.; Goldstein, D.; Levy, G.J. Clay Translocation within the Soil Profile as Affected by Intensive Irrigation with Treated Wastewater. Soil Sci. 2007, 172, 692–700. [Google Scholar] [CrossRef]
- Liu, M.; Han, G.; Zhang, Q. Effects of Soil Aggregate Stability on Soil Organic Carbon and Nitrogen under Land Use Change in an Erodible Region in Southwest China. Int. J. Environ. Res. Public Health 2019, 16, 3809. [Google Scholar] [CrossRef] [PubMed] [Green Version]
- Bartlová, J.; Badalíková, B.; Pospíšilová, L.; Pokorný, E.; Šarapatka, B. Water Stability of Soil Aggregates in Different Systems of Tillage. Soil Water Res. 2015, 10, 147–154. [Google Scholar] [CrossRef] [Green Version]
- Haynes, R.J.; Beare, M.H. Influence of Six Crop Species on Aggregate Stability and Some Labile Organic Matter Fractions. Soil Biol. Biochem. 1997, 29, 1647–1653. [Google Scholar] [CrossRef]
- Zhang, X.; Pei, D.; Chen, S.; Sun, H.; Yang, Y. Performance of Double-Cropped Winter Wheat-Summer Maize under Minimum Irrigation in the North China Plain. Agron. J. 2006, 98, 1620–1626. [Google Scholar] [CrossRef]
- Gold, M.V. Double Cropping and Interplanting: January 1991–February 1994; National Agricultural Library: Baltimore, MD, USA, 1994.
- McKenzie, N.; Jacquier, D.; Isbell, R.; Brown, K. Australian Soils and Landscapes. [Electronic Resource]: An Illustrated Compendium; CSIRO Publishing: Clayton, Australia, 2004. [Google Scholar]
- Huggins, D.R.; Allmaras, R.R.; Clapp, C.E.; Lamb, J.A.; Randall, G.W. Corn-Soybean Sequence and Tillage Effects on Soil Carbon Dynamics and Storage. Soil Sci. Soc. Am. J. 2007, 71, 145–154. [Google Scholar] [CrossRef] [Green Version]
- Ordoñez-Morales, K.D.; Cadena-Zapata, M.; Zermeño-González, A.; Campos-Magaña, S. Effect of Tillage Systems on Physical Properties of a Clay Loam Soil under Oats. Agriculture 2019, 9, 62. [Google Scholar] [CrossRef] [Green Version]
- Kazula, M.J.; Lauer, J.G.; Arriaga, F.J. Crop Rotation Effect on Selected Physical and Chemical Properties of Wisconsin Soils. J. Soil Water Conserv. 2017, 72, 553–563. [Google Scholar] [CrossRef] [Green Version]
- Blanco-Canqui, H.; Lal, R. Mechanisms of Carbon Sequestration in Soil Aggregates. CRC Crit. Rev. Plant Sci. 2004, 23, 481–504. [Google Scholar] [CrossRef]
- Bauer, A. Influence of Soil Organic Matter on Bulk Density and Available Water Capacity of Soils. Int. J. Chem. Stud. 1974, 7, 44–51. [Google Scholar]
- Ouda, S.; Zohry, A.; Noreldin, T. Crop Rotation Maintains Soil Sustainability. In Crop Rotation; Springer: Berlin, Germany, 2018. [Google Scholar] [CrossRef]
- Wang, H.; Sheng, Y.; Jiang, W.; Pan, F.; Wang, M.; Chen, X.; Shen, X.; Yin, C.; Mao, Z. The Effects of Crop Rotation Combinations on the Soil Quality of Old Apple Orchard. Hortic. Plant J. 2022, 8, 1–10. [Google Scholar] [CrossRef]
- Nyamadzawo, G.; Chikowo, R.; Nyamugafata, P.; Nyamangara, J.; Giller, K.E. Soil Organic Carbon Dynamics of Improved Fallow-Maize Rotation Systems under Conventional and No-Tillage in Central Zimbabwe. Nutr. Cycl. Agroecosyst. 2008, 81, 85–93. [Google Scholar] [CrossRef]
- Mokolobate, M.S.; Haynes, R.J. Increases in PH and Soluble Salts Influence the Effect That Additions of Organic Residues Have on Concentrations of Exchangeable and Soil Solution Aluminium. Eur. J. Soil Sci. 2002, 53, 481–489. [Google Scholar] [CrossRef]
- Balesdent, J.; Chenu, C.; Balabane, M. Relationship of Soil Organic Matter Dynamics to Physical Protection and Tillage. Soil Tillage Res. 2000, 53, 215–230. [Google Scholar] [CrossRef]
- Aguilera, J.; Motavalli, P.; Valdivia, C.; Gonzales, M.A. Impacts of cultivation and fallow length on soil carbon and nitrogen availability in the Bolivian andean highland region. Mt. Res. Dev. 2013, 4, 391–403. [Google Scholar] [CrossRef]
- Magdoff, F.; Weil, R. Soil Organic Matter Management Strategies; CRC Press LLCL: Boca Raton, FL, USA, 2004. [Google Scholar] [CrossRef]
- Halvorson, A.D.; Wienhold, B.J.; Black, A.L. Tillage, Nitrogen, and Cropping System Effects on Soil Carbon Sequestration. Soil Sci. Soc. Am. J. 2002, 66, 906–912. [Google Scholar] [CrossRef]
- Diacono, M.; Montemurro, F. Long-Term Effects of Organic Amendments on Soil Fertility. Sustain. Agric. 2011, 2, 761–786. [Google Scholar] [CrossRef]
- Hue, N.V.; Silva, J.A. Organic Soil Amendments for Sustainable Agriculture: Organic Sources of Nitrogen, Phosphorus, and Potassium. In Plant Nutrient Management in Hawaii’s Soils, Approaches for Tropical and Subtropical Agriculture, 1st ed.; University of Hawaii: Honolulu, HI, USA, 2000; pp. 133–144. [Google Scholar]
- Zuber, S.M.; Behnke, G.D.; Nafziger, E.D.; Villamil, M.B. Crop Rotation and Tillage Effects on Soil Physical and Chemical Properties in Illinois. Agron. J. 2015, 107, 971–978. [Google Scholar] [CrossRef] [Green Version]
- Wright, A.L.; Hanlon, E.A.; Sui, D.; Rice, R. Soil PH Effects on Nutrient Availability in the Everglades Agricultural Area 1. EDIS 2009, Volume 2009, 1–5. [Google Scholar] [CrossRef]
- Sainju, U.M.; Allen, B.L.; Caesar-TonThat, T.; Lenssen, A.W. Dryland Soil Chemical Properties and Crop Yields Affected by Long-Term Tillage and Cropping Sequence. Springerplus 2015, 4, 1–14. [Google Scholar] [CrossRef] [Green Version]
- Balemi, T.; Negisho, K. Management of Soil Phosphorus and Plant Adaptation Mechanisms to Phosphorus Stress for Sustainable Crop Production: A Review. J. Soil Sci. Plant Nutr. 2012, 12, 547–561. [Google Scholar] [CrossRef] [Green Version]
- Engels, C. Differences between Maize and Wheat in Growth-Related Nutrient Demand and Uptake of Potassium and Phosphorus at Suboptimal Root Zone Temperatures. Plant Soil 1993, 150, 129–138. [Google Scholar] [CrossRef]
- Li, L.; Sun, J.; Zhang, F.; Li, X.; Yang, S.; Rengel, Z. Wheat/Maize or Wheat/Soybean Strip Intercropping I. Yield Advantage and Interspecific Interactions on Nutrients. F. Crop. Res. 2001, 71, 123–137. [Google Scholar] [CrossRef]
- Oosterhuis, D.M. Potassium Management of Cotton. In Potassium for Sustainable Crop Production; Pasricha, N.S., Bansal, S.K., Eds.; International Potash Institute: Basel, Switzerland, 2002; pp. 321–346. [Google Scholar]
- Shahzad, A.N.; Rizwan, M.; Asghar, M.G.; Qureshi, M.K.; Bukhari, S.A.H.; Kiran, A.; Wakeel, A. Early Maturing Bt Cotton Requires More Potassium Fertilizer under Water Deficiency to Augment Seed-Cotton Yield but Not Lint Quality. Sci. Rep. 2019, 9, 1–10. [Google Scholar] [CrossRef]
- Abaye, A.O. Potassium Fertilization of Cotton. Virginia Tech. Coop. Ext. 2009, Volume 418-025, 1–4. Available online: https://vtechworks.lib.vt.edu/bitstream/handle/10919/55782/418-025.pdf?sequence=1&isAllowed=y (accessed on 4 January 2022).
- Wakeel, A.; Hafeez-ur-Rehman; Magen, H. Potash Use for Sustainable Crop Production in Pakistan: A Review. Int. J. Agric. Biol. 2017, 19, 381–390. [Google Scholar] [CrossRef]
- Mairura, F.S.; Mugendi, D.N.; Mwanje, J.I.; Ramisch, J.J.; Mbugua, P.K.; Chianu, J.N. Integrating Scientific and Farmers’ Evaluation of Soil Quality Indicators in Central Kenya. Geoderma 2007, 139, 134–143. [Google Scholar] [CrossRef]
- Cui, H.; Luo, Y.; Chen, J.; Jin, M.; Li, Y.; Wang, Z. Straw Return Strategies to Improve Soil Properties and Crop Productivity in a Winter Wheat-Summer Maize Cropping System. Eur. J. Agron. 2022, 133, 126436. [Google Scholar] [CrossRef]
- Schlatter, D.C.; Kahl, K.; Carlson, B.; Huggins, D.R.; Paulitz, T. Soil Acidification Modifies Soil Depth-Microbiome Relationships in a No-till Wheat Cropping System. Soil Biol. Biochem. 2020, 149, 107939. [Google Scholar] [CrossRef]
- Bowman, R.A.; Halvorson, A.D. Soil Chemical Changes after Nine Years of Differential n Fertilization in a No-till Dryland Wheat-Corn-Fallow Rotation. Soil Sci. 1998, 163, 241–247. [Google Scholar] [CrossRef]
- Rengel, Z. Availability of Mn, Zn and Fe in the Rhizosphere. J. Soil Sci. Plant Nutr. 2015, 15, 397–409. [Google Scholar] [CrossRef] [Green Version]
- Yadav, J.S.P.; Massoud, F.I.; Abrol, I.P. Salt-Affected Soils and Their Management; Fao Soils Bull. 39; FAO: Rome, Italy, 1988; p. 131. [Google Scholar]
- Othaman, N.N.C.; Isa, M.N.M.; Ismail, R.C.; Ahmad, M.I.; Hui, C.K. Factors That Affect Soil Electrical Conductivity (EC) Based System for Smart Farming Application; AIP Publishing LLC: Melville, NY, USA, 2020; Volume 2203. [Google Scholar] [CrossRef]
- Visconti, F.; de Paz, J.M.; Rubio, J.L. What Information Does the Electrical Conductivity of Soil Water Extracts of 1 to 5 Ratio (w/v) Provide for Soil Salinity Assessment of Agricultural Irrigated Lands? Geoderma 2010, 154, 387–397. [Google Scholar] [CrossRef]
- Kuo, Y.L.; Lee, C.H.; Jien, S.H. Reduction of Nutrient Leaching Potential in Coarse-Textured Soil by Using Biochar. Water 2020, 12, 12. [Google Scholar] [CrossRef]
- Meshram, J.H.; Mahajan, S.S.; Nagrale, D.; Gokte-Narkhedkar, N.; Kumbhalkar, H. Understanding Root Biology for Enhancing Cotton Production. In Plant Roots; IntechOpen: London, UK, 2021; p. 13. [Google Scholar]
- Rengasamy, P.; Chittleborough, D.; Helyar, K. Root-Zone Constraints and Plant-Based Solutions for Dryland Salinity. Plant Soil 2020, 257, 249–260. [Google Scholar]
- Rengasamy, P. World Salinization with Emphasis on Australia. J. Exp. Bot. 2006, 57, 1017–1023. [Google Scholar] [CrossRef] [Green Version]
- Raats, P.A.C. Distribution of Salts in the Root Zone. J. Hydrol. 1975, 27, 237–248. [Google Scholar] [CrossRef]
- Williams, A.; Kay, P.; Stirling, G.; Weng, X.; Bell, L. Impacts of Reducing Fallow Periods on Indicators of Soil Function in Subtropical Dryland Farming Systems. Agric. Ecosyst. Environ. 2016, 324, 107727. [Google Scholar] [CrossRef]
- Dick, W.A. Influence of Long-Term Tillage and Crop Rotation Combinations on Soil Enzyme Activities. Soil Sci. Soc. Am. J. 1984, 48, 569–574. [Google Scholar] [CrossRef]
- Kumar, V.; Singh, S.K.; Singh, P.; Tiwari, S.; Nand, M.M.; Chiranjeeb, K.; Majhi, M. Effects of Cropping Systems on Soil Properties and Enzymatic Activities in Calcareous Soil. Int. J. Curr. Microbiol. Appl. Sci. 2020, 9, 1255–1262. [Google Scholar] [CrossRef]
- Junnarkar, N.B.; Sherasiya, M.; Duggirala, S.M.; Duggirala, N.; Nishant, J. Interrelationship between Alkaline Phosphatase Activity and Soil Characteristics. Biosci. Guard. 2011, 1, 473–480. [Google Scholar]
Publisher’s Note: MDPI stays neutral with regard to jurisdictional claims in published maps and institutional affiliations. |
© 2022 by the authors. Licensee MDPI, Basel, Switzerland. This article is an open access article distributed under the terms and conditions of the Creative Commons Attribution (CC BY) license (https://creativecommons.org/licenses/by/4.0/).