Article

Characteristics of a Benchmark Loess–Paleosol Profile in Northeast China

1
College of Land and Environment, Shenyang Agricultural University, Shenyang 110866, China
2
China National Engineering Research Center for Efficient Utilization of Soil and Fertilizer Resources, Shenyang 110866, China
3
Key Laboratory of Arable Land Conservation in Northeast China, Ministry of Agriculture and Rural Affairs, P. R., Shenyang 110866, China
4
Dale Bumpers Small Farms Research Center, United States Department of Agriculture, Booneville, AR 72927, USA
*
Author to whom correspondence should be addressed.
Agronomy 2022, 12(6), 1376; https://doi.org/10.3390/agronomy12061376
Submission received: 26 April 2022 / Revised: 31 May 2022 / Accepted: 3 June 2022 / Published: 7 June 2022
(This article belongs to the Special Issue Soil Sustainability in the Anthropocene)

Abstract

:
The Chaoyang profile represents a rare multi-period, continuous and complete sequence of aeolian paleo-deposits with a stable sedimentary origin and multi-stage paleoclimatic cycles. Benchmark profiles including soil types at different pedogenic stages can be used for the recognition and classification of paleosols and paleoclimate reconstruction. The loess–paleosol sequence benchmark profile (LBP) is also helpful in comparing the results of paleoenvironment reconstruction from different ecological regions. In this study, a loess–paleosol profile derived from thick loess in Chaoyang city of Liaoning province, Northeast China, was investigated as a well-preserved LBP that included various paleosol types. To determine the nature and origin of the Chaoyang profile, the geographic, stratigraphic and morphological characteristics were described in the field. Bulk samples from 42 horizons were collected for chemical and physical analysis, and sub-sampling of 946 samples at 2 cm intervals from the surface to the bottom were taken to measure grain size distributions and magnetic susceptibility. Results showed that the 19.85 m thick loess–paleosol profile had been continuously deposited since 423 ka BP. The upper part (0–195 cm), or UPP, was predominantly of aeolian loess deposition origin but was mixed with water-reworked materials from a nearby secondary loess source. The middle part (195–228 cm), or MIP, was also indirectly affected by the water-reworking process through the leaching of materials from the overlying UPP. The lower part (228–1985 cm), or LOP, was characterized by four reddish stratigraphic layers interbedded with five yellowish ones, indicating several types of paleosols developed under different ecological environments. The multi-stage paleoclimatic cycles as evidenced by morphological and physical characteristics as well as age dating and magnetic susceptibility correlated well with the Lingtai section and LR04 benthic δ18O. Because of these attributes, the Chaoyang profile can be deemed as a benchmark loess–paleosol profile for the recognition and classification of paleosols and paleoclimate reconstruction in Northeast China. The differences in morphological and physical properties between paleosols and loess suggest different soil fertility and agronomic properties and need further studies to assess their functionality with climate fluctuation.

1. Introduction

The thick loess–paleosol sequence that is widely distributed in North China formed over a long period from windblown dust depositions. Due to changes in climate and vegetation at different timescales, soils have been superimposed, as shown by different colors indicative of loess–paleosol sequences [1,2,3,4,5,6,7,8]. The buried loess layers could be included in the paleosol category and can be differentiated from the paleosol due to their poor pedogenic development [8]. As a result of erosion, deep buried loess and paleosols at different pedogenic stages that evidently developed in different climatic zones were revealed at the surface [9,10] and showed a variety of soil types [11] within a small area. Such composite paleosols are common in many ancient sedimentary sequences [12]. Distinct reddish paleosols interbedded with yellowish loess in suites of sediments could be observed. These present challenges for the recognition [13,14], classification and mapping of paleosols. Therefore, it is necessary to establish benchmark profiles in different ecological areas, in order to compare local soils with benchmark profiles for the recognition and classification of paleosols. In our study, we referred to the geology concept of a standard stratigraphic section [15] and explored the section to establish a benchmark loess–paleosol profile. Additionally, benchmark profiles can serve as a baseline to quantify surficial paleosol evolution under the influence of the modern climate and human activities. The properties of loess-derived soils at different stages of weathering are also linked to agronomic functions and values that directly affect their management [15,16,17,18,19].
The loess in Northeast China is mainly distributed in the hilly area of western Liaoning, Songliao Plain and Liaodong Peninsula [20,21]. With changes in landforms and climatic conditions, there are obvious differences in loess lithology and thickness between different places [21]. During the Quaternary period, the conditions for sediment deposition and soil formation in the Liaodong region were less favorable. This was due to strong denudation from the long-term tectonic rise [22]. Even the small amounts of sediments that appeared on local sites were later eroded by denudation [23,24]. Since the beginning of the Quaternary, the Lower Songliao Plain has been constantly receiving water deposits as widespread lacustrine unconsolidated sediments [25], resulting in water-reworked soils. Therefore, only loess strata in the hilly region of western Liaoning could be representative of the Northeast, and mainly distributed in Chifeng, Tongliao, Fuxin and Chaoyang city [21]. In these areas, loess covered the hills and valleys, and its strata have been exposed. The lithology of loess strata varies greatly in different geomorphological parts, so finding complete and continuous natural profiles was difficult. After many field investigations, a complete and continuous Chaoyang profile in Chaoyang city was found to be the most representative profile. It is desirable as a potential benchmark loess–paleosol profile for research on the paleoenvironment and surrounding surficial soil evolution in Northeast China. The well-preserved stratigraphic profiles include various paleosol types. Worldwide, paleosols currently occupy different climatic conditions and like in the past continue to be modified by anthropogenic activities in addition to climate fluctuations [15,16,17,18,19]. These factors make the study of paleosols important for understanding the linkages between past climates and soil development and how the current climate will likely affect soils and their functions for supporting food production and other ecological services.
The objective of this study was to address the loess–paleosol benchmark profile (LBP) in Northeast China, where such Quaternary paleosols are common. A benchmark loess–paleosol profile needed to have the following characteristics: be of a homogeneous source; be representative, complete and continuously deposited; and record multiple paleoclimate cycles [15,23,26]. A unique feature of this study is the combination of soil morphological features with analysis of soil physical properties, trace elemental composition, age dating techniques, composition of rare earth elements and magnetic susceptibility. The multiple methods used in this study thus provide a complete picture of the paleosol history from pedogenesis and land use perspectives.

2. Materials and Methods

2.1. Study Area Description

Chaoyang is located in the Liaoning province in Northeast China (Figure 1). The area is within the North Temperate Zone and has a continental monsoon climate. It has a mean annual temperature of 9 °C and a mean annual precipitation of 450–500 mm [22]. The underlying geology of the region consists of metamorphic schist, marble and phyllite along the Daling River; Paleozoic sedimentary rocks of Cambrian and Ordovician limestone mainly in the middle and lower parts of the mountain; and metamorphic rocks on the mountaintop [22]. However, the Chaoyang profile originated from windblown dust and has no pedogenic relationship with the underlying basal geology.
The Chaoyang profile (41°33′9.6″ N, 120°30′20.8″ E) is located in Chaoyang city in the hilly region of western Liaoning. It is within a well-defined closed basin in the Fenghuangshan area at the midpoint of Song Ling Ridge. Located in the upper part of the closed basin, the site is affected very little by local water flow due to a small catchment contributing area [22] (Figure 1). The dominant land use type is forest with dwarf shrubs. As a result, a relatively complete and representative set of mineral windblown dust deposits was preserved at this location.

2.2. Sampling Strategies

Profile morphological characteristics were described according to the Field Book for Describing and Sampling Soils, Version 3.0 [27]. Bulk samples from 42 horizons were collected for chemical and physical analysis, and sub-sampling of 946 samples at 2 cm intervals from the surface to the bottom was conducted to determine grain size distributions as well as magnetic susceptibility. The layer transition boundaries were sampled for age dating, resulting in 10 samples. Natural clods were sampled from each horizon for bulk density determinations. Intact oriented core samples about 15 cm long were collected from selected horizons for thin sections.

2.3. Laboratory Methods

The clod method was used for soil bulk density [28], while particle-size analysis was performed using a CIS-100 laser diffraction particle size analyzer based on the procedure in [29]. The X-ray fluorescence and major and trace elemental composition were determined based on the methodologies given in [30]. Samples were dated for age determination and modeling based on optically stimulated luminescence and electron spin resonance [31]. Rare earth elements were determined using VISTA-MPX ICP-AES (Varian, Palo Alto, CA, USA), while a Bartington susceptibility meter (MS2) equipped with an MS2F probe (Bartington, Oxford, England) was used to measure magnetic susceptibility. Detailed descriptions for all laboratory methods can be found in the corresponding references.
Munsell soil charts were used to determine soil color for each horizon. The Munsell color was then converted to the redness rating (RR) using the calculation formula of RR = (10-H) × C/V [32]. RR represents the redness rating value; C and V represent the numerical values of the Munsell chroma and value, respectively; H is hue, the value preceding YR in the Munsell hue notation. Hue ratings of 10YR, 7.5YR, 5YR, 2.5YR and 10R were numerically represented as 10, 7.5, 5, 2.5 and 0, respectively.

3. Results and Discussion

3.1. The Morphological Characteristics of the Chaoyang Profile

The morphological characteristics of the Chaoyang profile are described in Table 1. The profile was 19.85 m deep. No evidence of human influence or accelerated erosion was found in the field. The first top layer of the Chaoyang profile was S0, the brown zonal soil layer (Cinnamon soil, classified as Haplustalfs according to U.S. Soil Taxonomy [33]). Underlying S0, four reddish stratigraphic layers (S1–S4) were found interbedded with five yellowish stratigraphic layers (L1–L5) (Figure 2). The separating boundaries between adjacent layers were clear.
A gravel horizon of sub-rounded coarse limestone was observed at the bottom of S0, marking the boundary with the underlying L1 horizon. This indicated a substantial change in environmental conditions that led to the development of the L1 horizon. The thick L4 layer was characterized by “red-pack-yellow” structural colors in its upper part and light yellow and orange colors with vertical joints and large pores in its lower part. Few clay-lined pores and common clay and Fe-Mn coatings were also observed in the top and bottom of horizon L4, but few clay-lined pores and Fe-Mn coatings were observed for the remaining horizons. The L2 and L3 layers were thinner compared to the L4 layer and had more clay and Fe-Mn coatings, indicating stronger pedogenesis. The L5 layer, at the bottom of the profile, had no obvious pedogenic and morphological characteristics and was visually uniform. In contrast to the loess layers (L1–L5), the paleosol layers (S1–S4) were more developed and showed strongly developed structure and rich Fe-Mn and clay coatings along structural ped faces and the inner wall of pores. Like loess layers, the paleosol layers varied in thickness, with S1 and S4 being thicker than S2 and S3.
In the UPP, the soil texture gradually transitioned from loam on the surface to silt loam (S0) to sandy loam towards the bottom (L1) (Figure 2). However, the texture for the MIP (S1-1, 195–228 cm) changed to silt loam—like S0—which seemed to indicate water-reworking during the formation of S0 and L1. These textural changes indicated a complex formation process of the UPP, especially at the L1–S1-1 boundary transition, as also evidenced by the color changes. The dull orange-brown color observed in S0 transitioned to the pale yellow-orange color in L1, followed by an abrupt color alternation from 10YR to 2.5YR at 228 cm and then to 5YR in the LOP. The uniform silt in the LOP (228–1985 cm) was associated with bright red-brown to orange colors (2.5YR). There were also greater amounts of clay and Fe-Mn coatings in the Bt horizons, especially in the paleosol layers. A maximum CaCO3 content of 7.51% was detected in L1. Some CaCO3 had leached from L1 and been deposited in underlying MIP as pseudomycelium and CaCO3 powder accumulations along structural ped faces (Figure 2).

3.2. The Sedimentary Time Characteristics of the Chaoyang Profile

Ten dating samples at the boundaries of adjacent layers in the Chaoyang profile were used to characterize the sediment age. The age for the sample at 108 cm depth (S0 to L1 boundary) was determined by optically stimulated luminescence dating, and electron spin resonance dating was used for the remaining samples. The time span of the profile ranged from 0 to 423 ka BP. The S0 and L1 layers were deposited during the last ice age to the Holocene period. The S1 formation stage corresponded to the last interglacial period. The layers L2 to L5 formed during the second glacial–interglacial period in the mid-Pleistocene. A susceptibility age model [31] was used to address the chronology of the Chaoyang profile (Figure 3). According to the dating data, the Chaoyang profile had been continuously deposited, including various soil types exposed at the surface.

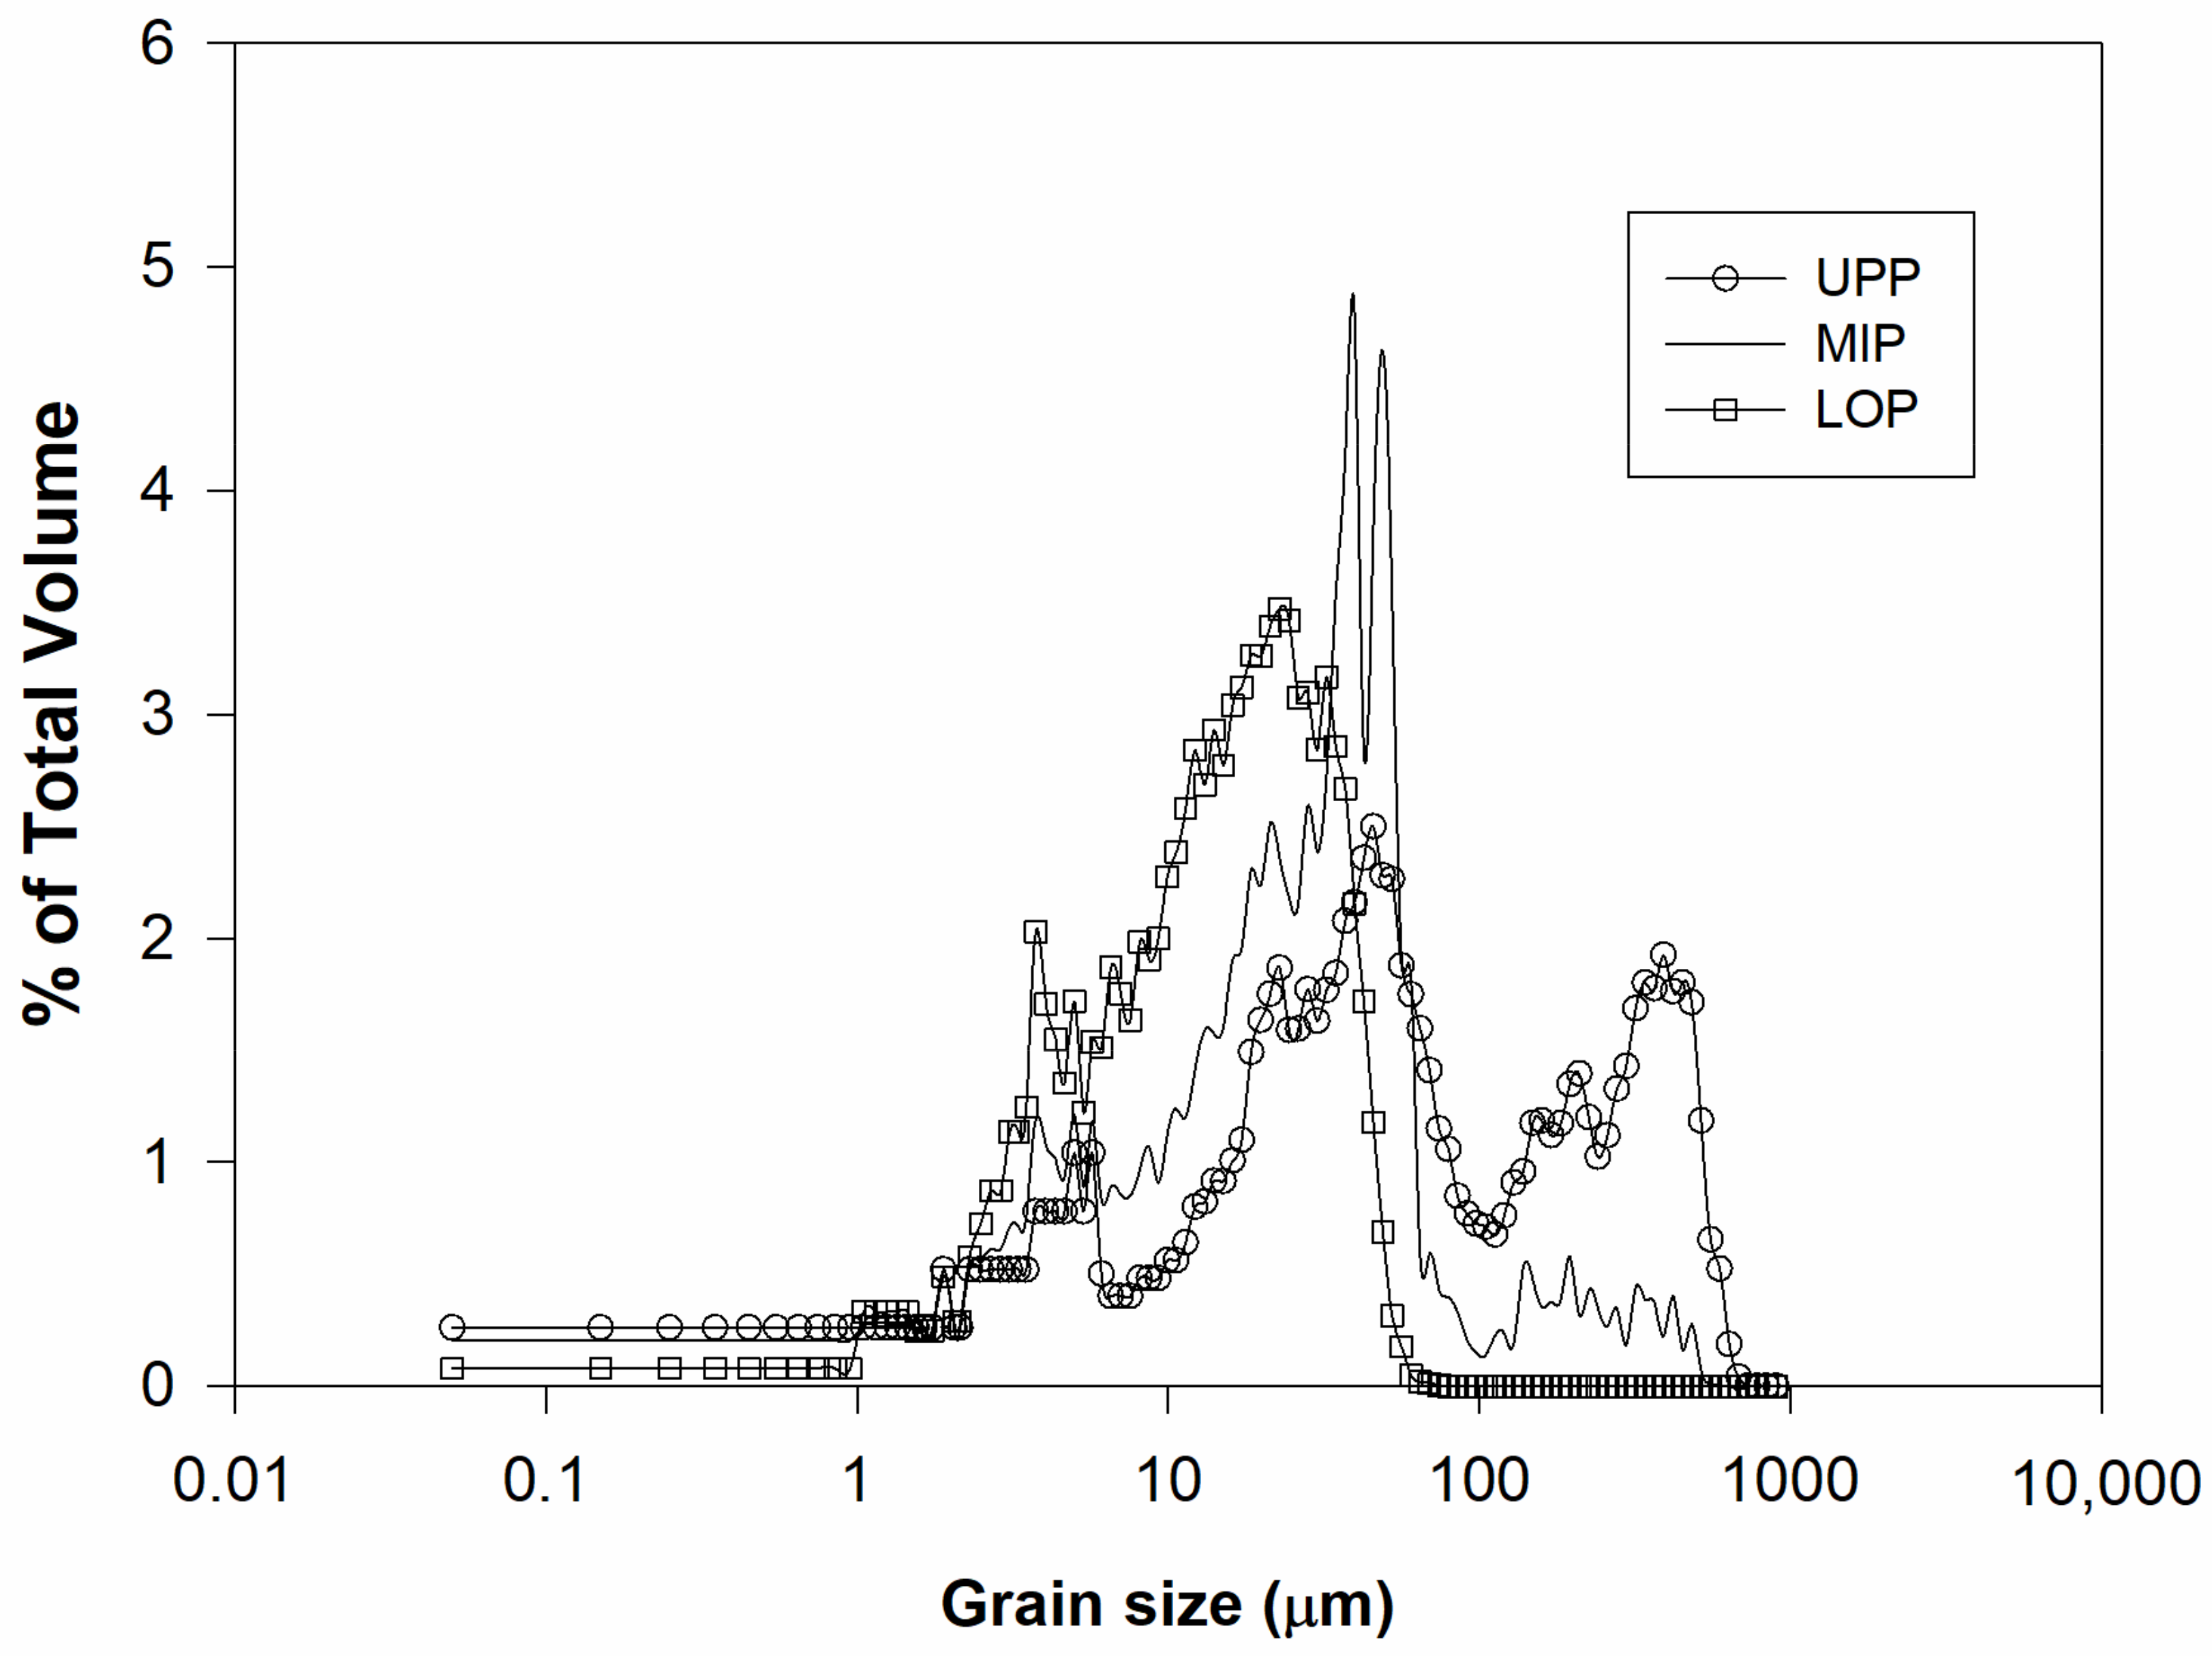
3.3. The Grain Size Distribution Characteristics of the Chaoyang Profile

There was a significant and abrupt change at 195 cm (L1–S1-1 boundary) that divided the Chaoyang profile into three parts, namely the UPP followed by the MIP transition and the LOP. Overall, the UPP consisted of 75% aeolian loess and 25% water-reworked materials that were primarily of aeolian origin and experienced secondary water rework. Silt-sized grains ranging from 40 to 70% dominated the UPP grain composition, followed by 25–50% silt-sized grains ranging from 10 to 50 μm of aeolian deposition (Figure 4). The sand fraction was also high and variable (22–64%), and the remaining clay fraction varied from 2 to 9%. A large mean grain size of 45–185 μm was detected in the UPP. The larger grain composition in the UPP beyond the typical aeolian loess grain range of 10–50 μm [34,35] showed the presence of factors with a greater carrying capacity for particles, which considerably contributed to the UPP formation.
This supported the idea that UPP had been reworked by water flow in varied intensities as shown by the vertical sand fraction distribution with depth for the UPP. Combined with the standard deviation of the grain size distribution (2.1–2.7) indicative of uniformity of grain size, it appears that UPP experienced poor sorting and that the Chaoyang profile location was likely near a secondary sedimentary source. Thus, the UPP could be predominantly aeolian loess deposition mixed with limited secondary loess deposition from water-reworked materials of a nearby source.
Furthermore, the UPP was poorly sorted for a wide grain size range (0.1–683.5 μm) and showed multi-modal domains of 2–6 μm, 20–70 μm and 120–555 μm in the grain size distribution frequency curve (Figure 5) indicating a complex formation process. The coarse particle domain of 20–70 μm for typical aeolian loess [36], which accounted for 45% of the accumulative total volume, had the greatest peak domain and represents easily wind-suspended fractions subject to short-distance transport [37]. The secondary peak domain of 120–555 μm, which accounted for 20% of the accumulative total volume beyond the aeolian loess domain, was indicative of a siltation process which is typical for 200–400 μm [38]. The third peak domain of 2–6 μm, which accounted for 30% of the accumulative total volume, was the fine grain domain of aeolian loess and could have been transported by wind for long distances [37,38].
The transitional MIP layer with an abrupt change in grain size composition received potential influences from the overlying layer, especially from the S0–L1 transition boundary according to the morphological characteristics (Figure 2) and grain composition (Figure 5).
An extremely low sand content with negligible >63 μm coarse sand in the LOP was detected (Figure 4 and Figure 5). Silt-sized grains (10–50 μm), typical of aeolian grains, predominated the LOP composition and accounted for 43–86% of the total fractions. The clay content of the LOP varied from 1 to 8%. The mean grain size of the LOP for 10–30 μm was similar to that of the typical loess Lingtai profile for 13–27 μm on the China Loess Plateau [39,40]. The small standard deviation range (1.1–1.6) for the mean grain size indicated small variations and poor sorting. In addition, water could not have maintained consistent sorting for several hundred thousand years [38,41]. Therefore, the small variation in mean grain size and standard deviation with depth supported the theory that wind was the main soil accumulation factor. Furthermore, the LOP materials had two modal domains of 10–50 μm and 2–6 μm in the grain size distribution frequency curve (Figure 5). The greatest peak domains of 10–50 μm accounted for 60–70% of the total volume and 99.41% in the clay-free basis, indicating an origin of aeolian loess. The secondary peak domain of 2–6 μm, which accounted for 15–25%, was likely transported by wind from a long-distance source. Large silt fractions and a lack of coarse fragments supported the idea that the LOP loess is of aeolian origin. The data suggested that the LOP formed in a relatively stable sedimentary environment for aeolian sediment deposition and is a potential profile for research on paleoclimatic evolution. In addition, cyclic changes in grain size parameters with depth suggested multiple cycle climatic changes in the Chaoyang profile.

3.4. Rare Earth Element Characteristics of the Chaoyang Profile

Rare earth elements are a special group of geochemical elements with similar chemical properties. They are mainly transported and deposited in a granular manner and experience little change in composition from weathering, transportation, deposition and diagenesis. They generally capture source rock information and could be important tracers. The rare earth element distribution patterns of layers in the Chaoyang profile were similar to each other. Curve slope distribution patterns were negative and steep from La to Eu, while the Eu–Lu curve was relatively smooth (Figure 6), supporting the idea that layers in the Chaoyang profile were derived mainly from the same source.

3.5. The Continuity Sedimentary Characteristics of the Chaoyang Profile

From the age dating data (Figure 3), no missing layers were identified for the profile, indicating a sedimentary continuity in the Chaoyang profile on the glacial–interglacial cycle scale. The presence of non-uniform buried soil layers, denudation surfaces (nonconformities) and other genetic sediment interlayers have been identified as three main markers for determining sediment discontinuity [44]. No such markers were detected in the Chaoyang profile. The yellowish loess layers were interbedded regularly with reddish paleosol layers, indicating a synchrony of loess deposition with pedogenic processes [8]. The formation of a paleosol or loess was constrained by climatic change and the relative rates of pedogenesis and deposition. During the period with a warm and humid climate, the pedogenic rate was greater than the rate of loess deposition. The soil formation processes were dominant, resulting in redder soil colors. During the period with a cold and dry climate, the soil color was predominantly yellow. The differences in soil color due to climate can be seen even today when soils of subtropical areas are compared with those of mid-latitudes with a cooler climate [33].
Although there were differences in morphological characteristics, the discontinuity of the deposition sequence could not be determined. The grain size distribution with depth showed that the UPP had a larger grain size influenced by water-reworked secondary loess, while the LOP had a finer grain size typical of aeolian loess. Furthermore, variation coefficients of clay-free grains in the LOP were significantly different from those in the UPP, especially for the clay-free mean silt content (Table 1), indicating discontinuities in parent materials. Each horizon in the LOP had a significantly lower variation coefficient of clay-free silt compared to the UPP and MIP, indicating a uniform source of parent material and a more stable depositional environment for the LOP.

3.6. The Redness Rating Value Characteristics of the Chaoyang Profile

The yellowish loess was found interbedded with reddish paleosol layers in the Chaoyang profile (Figure 2). The color difference between the loess and the paleosol was the first visible morphological characteristic in the profile related to pedogenesis under paleoclimates. Quantified color, as redness rating values, of the Chaoyang profile showed multiple cyclic changes with depth. Paleosols appeared as peaks and loess as troughs in the redness rating curve (Figure 7a). This reflected sedimentary cycles in the Chaoyang profile indicative of paleoclimatic cycles. In other words, the sedimentary cycles of the Chaoyang profile recorded multi-cycle changes in the paleoclimate.

3.7. The Magnetic Susceptibility Characteristics of the Chaoyang Profile

Magnetic susceptibility has been widely used in reconstructing paleoclimatic monsoon evolution [8,45,46]. The warm–wet southeast wind under the East Asian summer monsoon would bring abundant precipitation and heat to promote precipitation-driven pedogenesis in loess depositions, leading to signals in magnetic susceptibility [15,46]. An increased magnetic susceptibility value indicates a strengthened pedogenesis [47,48] and an increased amount of iron [49,50]. The changes in magnetic susceptibility with depth (Figure 7b) were in sync with the changes in redness (Figure 7a) indicative of multiple paleoclimate cycles and various loess–paleosol sequences.
The multiple paleoclimate cycles recorded in the Chaoyang profile were well correlated to the benchmark profile of the Lingtai section from the China Loess Plateau and LR04 benthic δ18O [51] (Figure 8). This supported the Chaoyang profile being a benchmark paleosol profile in Northeast China.
The Chaoyang profile can thus be considered as a benchmark profile in Northeast China. Further research may be needed to compare the benchmark Chaoyang profile with surrounding surficial soils for the recognition and classification of paleosols. The benchmark profile can also be a reference for quantifying surficial paleosol evolution under the influence of modern climate and human activities.
The combination of multiple indicators from morphological and physical properties to age dating, magnetic susceptibility and rare earth elemental analyses provided a picture of the soil development of the Chaoyang profile. We summarize this systematic approach as a guide for analyzing paleosol profiles (Figure 9); however, further studies are needed to link the different soil development stages with agriculture and environmental functions.

4. Conclusions

The 19.85 m deep Chaoyang profile was mainly derived from aeolian loess and has been deposited continuously since 423 ka BP. The upper part (0–195 cm) UPP has resulted from predominantly aeolian loess deposition but was influenced by water-reworked materials from a nearby secondary loess source. The transitional shift (195–228 cm) MIP has also been affected by the water-reworking process. The lower part (228–1985 cm) LOP is a rare multi-period, continuous and complete sequence of aeolian paleo-deposits with a stable sedimentary origin and multi-stage paleoclimatic cycles. The multi-stage paleoclimatic cycles were well correlated with those in the Lingtai section and LR04 benthic δ18O. The Chaoyang profile can be a benchmark loess–paleosol profile for the recognition and classification of paleosols and reconstruction of paleoclimates in Northeast China. The linkages between morphological and physical properties as well as age dating, magnetic susceptibility and rare earth elemental analyses can be used to distinguish between paleosols and loess and could also be used to assess soil fertility and agronomic properties.

Author Contributions

Conceptualization, Z.-X.S. and Q.-B.W.; methodology, Y.-Y.J., Z.-X.S., Q.-B.W. and P.R.O.; software, Z.-X.S., Y.-Y.J. and Z.-D.J.; validation, Z.-X.S., Q.-B.W., P.R.O. and Z.L.; formal analysis, Z.-X.S., Y.-Y.J., Z.-D.J. and Z.L.; investigation, Q.-B.W. and Z.-X.S.; resources, Z.-X.S. and Q.-B.W.; data curation, Z.-X.S.; writing—original draft preparation, Z.-X.S. and Y.-Y.J.; writing—review and editing, Z.-X.S., Q.-B.W., Z.L. and P.R.O.; visualization, Z.-X.S. and Q.-B.W.; supervision, Z.-X.S. and Q.-B.W.; project administration, Z.-X.S. and Q.-B.W.; funding acquisition, Z.-X.S. and Q.-B.W. All authors have read and agreed to the published version of the manuscript.

Funding

This research was funded by grants from the National Natural Science Foundation of China (No. 41807002 and No. 41771245), Special Foundation for National Science and Technology Basic Research Program of China (2021FY100405), Scientific Research Fund of Liaoning Provincial Education Department (LSNQN202007), Postdoctoral Research Foundation of China (No. 2018M640531) and Department of Science and Technology of Liaoning Province (Liaoning Province Doctoral Startup Fund: No. 20170520407).

Acknowledgments

The authors sincerely thank all the students and staff who provided input to this study. Thanks also go to the National Natural Science Foundation of China (No. 41807002 and No. 41771245), Special Foundation for National Science and Technology Basic Research Program of China (2021FY100405), Scientific Research Fund of Liaoning Provincial Education Department (LSNQN202007), Postdoctoral Research Foundation of China (No. 2018M640531) and Department of Science and Technology of Liaoning Province (Liaoning Province Doctoral Startup Fund: No. 20170520407) for their support for this project. Z.L. is a member of the research consortium GLADSOILMAP supported by the Loire Valley Institute for Advanced Research Studies (France).

Conflicts of Interest

The authors declare no conflict of interest. The funders had no role in the design of the study; in the collection, analyses or interpretation of data; in the writing of the manuscript; or in the decision to publish the results.

References

  1. Harlan, P.; Franzmeier, D. Soil Formation on Loess in Southwestern Indiana: I. Loess Stratigraphy and Soil Morphology. Soil Sci. Soc. Am. J. 1977, 41, 93–98. [Google Scholar] [CrossRef]
  2. Hutcheson, T.B.; Bailey, H.H. Effect of Underlying Residua on Chemical and Mineralogical Properties of Soils Developed in a Uniform Loess Overlay. Soil Sci. Soc. Am. Proc. 1965, 29, 427–432. [Google Scholar] [CrossRef]
  3. Karathanasis, A.D.; Golrick, P.A.; Barnhisel, R.I. Soil Formation on Loess/Sandstone Toposequences in West-Central Kentucky: Ii Mineralogical Relationships. Soil Sci. 1991, 152, 151–161. [Google Scholar] [CrossRef]
  4. Mausbach, J.J.; Wingard, R.C.; Gamble, E.E. Modification of Buried Soils by Post Burial Pedogenesis, Southern Indiana. Soil Sci. Soc. Am. J. 1982, 46, 364–369. [Google Scholar] [CrossRef]
  5. Ransom, M.D.; Smeck, N.E.; Bigham, J.M. Stratigraphy and Genesis of Polygenetic Soils on the Illinoian till Plain of Southwestern Ohio. Soil Sci. Soc. Am. J. 1987, 51, 135–141. [Google Scholar] [CrossRef]
  6. Rutledge, E.; Holowaychuk, N.; Hall, G.; Wilding, L. Loess in Ohio in Relation to Several Possible Source Areas: I. Physical and Chemical Properties. Soil Sci. Soc. Am. J. 1975, 39, 1125–1132. [Google Scholar] [CrossRef]
  7. Steinhardt, G.C.; Franzmeier, D. Chemical and Mineralogical Properties of the Fragipans of the Cincinnati Catena. Soil Sci. Soc. Am. J. 1979, 43, 1008–1013. [Google Scholar] [CrossRef]
  8. Sun, Z.X.; Owens, P.R.; Han, C.L.; Chen, H.; Wang, X.L.; Wang, Q.B. A Quantitative Reconstruction of a Loess–Paleosol Sequence Focused on Paleosol Genesis: An Example from a Section at Chaoyang, China. Geoderma 2016, 266, 25–39. [Google Scholar] [CrossRef]
  9. Schaetzl, R.J.; Anderson, S. Soils: Genesis and Geomorphology; Cambridge University Press: New York, NY, USA, 2005. [Google Scholar]
  10. Schaetzl, R.J.; Sorenson, C.J. The Concept of “Buried” versus “Isolated” Paleosols: Examples from Northeastern Kansas. Soil Sci. 1987, 143, 426–435. [Google Scholar] [CrossRef]
  11. Ruellan, A. The History of Soils: Some Problems of Definition and Interpretation. In Paleopedology; Yaalon, D.H., Ed.; Israel Universities Press: Jerusalem, Israel, 1971; pp. 3–13. [Google Scholar]
  12. Wright, V.P. Paleosols: Their Recognition and Interpretation. In Blackwell Scientific Publications; Oxford: Blackwell, UK, 1986. [Google Scholar]
  13. Mark, S.K. Identification of Multiple Loess Units within Modern Soils of Clay County, Nebraska. Geoderma 1995, 65, 45–47. [Google Scholar]
  14. Valentine, K.W.G.; Dalrymple, J.B. Quaternary Buried Paleosols: A Critical Review. Quat. Res. 1976, 6, 209–222. [Google Scholar] [CrossRef]
  15. Liu, T.S. Loess and the Environment; China Ocean Press: Beijing, China, 1985. [Google Scholar]
  16. Alway, F.J.; Mcdole, G.R. The Loess Soils of the Nebraska Portion of the Transition Region: I. Hygroscopicity, Nitrogen and Organic Carbon. Soil Sci. 1916, 1, 197–238. [Google Scholar] [CrossRef] [Green Version]
  17. Catt, J.A. Loess—Its Formation, Transport and Economic Significance. In Physical and Chemical Weathering in Geochemical Cycles; Springer: Dordrecht, The Netherlands, 1988; pp. 113–142. [Google Scholar]
  18. Catt, J.A. The Agricultural Importance of Loess. Earth Sci. Rev. 2001, 54, 213–229. [Google Scholar] [CrossRef]
  19. Jiang, Y.J.; Li, S.J.; Chen, W.; Cai, D.S.; Liu, Y. The Evolution of Crop Cultivation and Paleoenvironment in the Longji Terraces, Southern China: Organic Geochemical Evidence from Paleosols. J. Environ. Manag. 2017, 202, 524–531. [Google Scholar] [CrossRef] [PubMed]
  20. Li, Y.; Shi, W.; Aydin, A.; Beroya-Eitner, M.A.; Gao, G. Loess Genesis and Worldwide Distribution. Earth-Sci. Rev. 2020, 201, 102947. [Google Scholar] [CrossRef]
  21. Zeng, L.; Lu, H.Y.; Yi, S.W.; Xu, Z.W.; Qiu, Z.M.; Yang, Z.Y.; Li, Y.X. Magneto-stratigraphy of loess in northeastern China and paleoclimatic changes. Chin. Sci. Bull. 2011, 56, 2267–2275. (In Chinese) [Google Scholar]
  22. Hydrogeology Brigade of Liaoning Geology Bureau. The Quaternary of Liaoning Province; Geology Press: Beijing, China, 1983. [Google Scholar]
  23. Jia, W.J. Soil in Liaoning; Liaoning Science and Technology Press: Shenyang, China, 1992. [Google Scholar]
  24. Wang, X.; Dong, Z.; Zhang, J.; Liu, L. Modern Dust Storms in China: An Overview. J. Arid Environ. 2004, 58, 559–574. [Google Scholar] [CrossRef]
  25. Fu, W.X. The Evolution of Liaodong Bay Coastal Sedimentary Characteristics and Sedimentary Environment of Quaternary. Acta Sedimentol. Sin. 1989, 7, 127–134. [Google Scholar]
  26. Wang, W.L. Stratigraphic Sequence of the Yixian Formation of Yixian-Beipiao Region, Liaoning—A Study and Establishment of Stratotype of the Yixian Stage. J. Stratigr. 2003, 27, 227–232. [Google Scholar]
  27. Schoeneberger, P.J.; Wysocki, D.A.; Benham, E.C. Soil-Survey-Staff. Field Book for Describing and Sampling Soils; Version 3.0; Natural Soil Survey Center: Lincoln, NE, USA, 2012. [Google Scholar]
  28. Brasher, B.R.; Franzmeier, D.P.; Valassis, V.; Davidson, S.E. Use of Saran Resin to Coat Natural Soil Clods for Bulk Density and Water Retention Measure-Ments. Soil Sci. 1966, 101, 108. [Google Scholar] [CrossRef]
  29. Lu, H.Y.; An, Z.S. An Experimental Study on the Effect of Pretreatment Methods for the Particle Size Determi-Nation of Loess Sediment. Chin. Sci. Bull. 1997, 42, 2535–2538. [Google Scholar]
  30. Cesareo, R. X-Ray Fluorescence Spectrometry. Wiley Online Library: Online, 2010; (accessed on 4 June 2019). [Google Scholar] [CrossRef]
  31. Kukla, G.; An, Z.S. Loess Stratigraphy in Central China. Palaeogeogr. Palaeocl. 1989, 72, 203–225. [Google Scholar] [CrossRef]
  32. Torrent, J.; Schwertmann, U.; Schulze, D.G. Iron Oxide Mineralogy of Some Soils of Two River Terrace Sequences in Spain. Geoderma 1980, 23, 191–208. [Google Scholar] [CrossRef]
  33. Soil Survey Staff. Keys to Soil Taxonomy, 12th ed.; USDA, Natural Resources Conservation Service United States Goverment Print. Office: Washington, DC, USA, 2014. [Google Scholar]
  34. Lu, H.Y.; An, Z.S. Paleoclimatic Significance of Grain Size of Loess-Paleosol Sequences of Central China. Sci. China Ser. D Earth Sci. 1998, 41, 626–631. [Google Scholar] [CrossRef]
  35. Zhao, J.H.; Lu, H.Y.; Mei, F.M.; Zhang, X.Y.; Li, Y.; Fan, L.J. Simulation of Grain Size Distribution of Xining Loess Accumulation. Arid. Land Geogr. 2008, 31, 31–37. [Google Scholar]
  36. Sun, D.H.; Lu, H.Y.; Rea, D.; Sun, Y.B. Bi-Mode Grain-Size Distribution of Chinese Loess and Its Paleoclimate Implication. Acta Sedimentol. Sin. 2000, 18, 327–335. [Google Scholar]
  37. Pye, K. Aeolian Dust and Dust Deposits; Academic Press: London, UK, 1987. [Google Scholar]
  38. Sun, D.H.; Bloemendal, J.; Rea, D.K.; Vandenberghe, J.; Jiang, F.C.; An, Z.S.; Su, R.X. Grain-Size Distribution Function of Polymodal Sediments in Hydraulic and Aeolian Environments, and Numerical Partitioning of the Sedimentary Components. Sediment. Geol. 2002, 152, 263–277. [Google Scholar] [CrossRef]
  39. Sun, Y.; An, Z.; Clemens, S.C.; Bloemendal, J.; Vandenberghe, J. Seven Million Years of Wind and Precipitation Variability on the Chinese Loess Plateau. Earth Planet. Sc. Lett. 2010, 297, 525–535. [Google Scholar] [CrossRef]
  40. Sun, Y.B.; Lu, H.Y.; An, Z.S. Grain Size of Loess, Palaeosol and Red Clay Deposits on the Chinese Loess Plateau: Significance for Understanding Pedogenic Alteration and Palaeomonsoon Evolution. Palaeogeogr. Palaeocl. 2006, 241, 129–138. [Google Scholar] [CrossRef]
  41. Chen, H.; Wang, Q.B.; Han, C.L.; Wu, D.L. Grain-Size Distribution and Material Origin of a Paleosol Sequence at Fenghuang Mountain, Chaoyang, Liaoning Province. Earth Environ. 2009, 37, 243–248. [Google Scholar]
  42. Korotev, R.L. A Self-Consistent Compilation of Elemental Concentration Data for 93 Geochemical Reference Samples. Geostandard. Newslett. 1996, 20, 217–245. [Google Scholar] [CrossRef]
  43. Anders, E.; Grevesse, N. Abundances of the Elements: Meteoritic and Solar. Geochim. Et Cosmochim. Acta 1989, 53, 197–214. [Google Scholar] [CrossRef]
  44. Liu, D.S. Loess Accumulation in China; Science Press: Beijing, China, 1965. [Google Scholar]
  45. An, Z.S. The History and Variability of the East Asian Paleomonsoon Climate. Quat. Sci. Rev. 2000, 19, 171–187. [Google Scholar] [CrossRef]
  46. An, Z.S.; Kukla, G.J.; Porter, S.C.; Xiao, J.L. Magnetic Susceptibility Evidence of Monsoon Variation on the Loess Plateau of Central China during the Last 130,000 Years. Quat. Res. 1991, 36, 29–36. [Google Scholar] [CrossRef]
  47. An, Z.S.; Liu, D.S.; Lu, Y.C.; Porter, S.C.; Kukla, G.; Wu, X.H.; Hua, Y.M. The Long-Term Paleomonsoon Variation Recorded by the Loess-Paleosol Sequence in Central China. Quat. Int. 1990, 7–8, 91–95. [Google Scholar]
  48. Guo, Z.T.; Biscaye, P.E.; Wei, L.Y.; Chen, X.H.; Peng, S.Z.; Liu, T.S. Summer Monsoon Variations over the Last 1.2 Ma from the Weathering of Loess-Soil Sequenc-ES in China. Geophys. Res. Lett. 2000, 27, 1751–1754. [Google Scholar] [CrossRef]
  49. Guo, Z.T.; Liu, T.S.; Guiot, J.; Wu, N.; Lü, H.; Han, J.; Liu, J.; Gu, Z. High Frequency Pulses of East Asian Monsoon Climate in the Last Two Glaciations: Link with the North Atlantic. Clim. Dynam. 1996, 12, 701–709. [Google Scholar] [CrossRef]
  50. Hu, X.F.; Wei, J.; Xu, L.F.; Zhang, G.L.; Zhang, W.G. Magnetic Susceptibility of the Quaternary Red Clay in Subtropical China and Its Paleoenvironmental Implications. Palaeogeogr. Palaeocl. 2009, 279, 216–232. [Google Scholar] [CrossRef]
  51. Lisiecki, L.E.; Raymo, M.E. A Pliocene-Pleistocene Stack of 57 Globally Distributed Benthic δ18O Records. Paleoceanography 2005, 20, 1–16. [Google Scholar] [CrossRef] [Green Version]
Figure 1. (A) A schematic map presenting the location of the Chaoyang loess–paleosol profile. The inset map shows the location of Chaoyang in China. The schematic map was plotted based on the base map of the World Topographic Map (2016) using Arc GIS 10.2.2. (B) An associated landscape photo of the Chaoyang loess–paleosol profile. (C) A photo of the Chaoyang loess–paleosol profile.
Agronomy 12 01376 g001
Figure 2. A schematic of the stratigraphy with corresponding time constraints and the schematic profile descriptions of the Chaoyang profile. L indicates loess and S indicates paleosol. Note: S0 represents modern soil. The upper part (0–195 cm), the middle part (195–228 cm) and the lower part (228–1985 cm) of the observed profile are abbreviated as UPP, MIP and LOP, respectively.
Agronomy 12 01376 g002
Figure 3. A diagram showing the age–depth relationship of the Chaoyang section, based on the age model [31].
Agronomy 12 01376 g003
Figure 4. Grain size parameters with soil depth in the Chaoyang profile.
Agronomy 12 01376 g004
Figure 5. Grain size distribution frequency curves for the UPP, MIP and LOP from the Chaoyang profile.
Agronomy 12 01376 g005
Figure 6. Rare earth element distribution of the Chaoyang profile. The chondrite data are cited from papers [42,43].
Agronomy 12 01376 g006
Figure 7. Changes in the redness rating (RR) (a) and the magnetic susceptibility values (b) with depth in the Chaoyang profile.
Agronomy 12 01376 g007
Figure 8. Correlation of the Chaoyang profile with the Lingtai section [39] and LR04 benthic δ18O [51].
Agronomy 12 01376 g008
Figure 9. Flow chart for distinguishing between paleosols that have undergone some degree of pedogenesis and loess deposits with less pedogenesis for the Chaoyang profile.
Agronomy 12 01376 g009
Table 1. Variation coefficients of clay-free SI, CSI, MSI and CSI/MSI in the Chaoyang profile.
SequenceClay-Free SI a %Clay-Free CSI b %Clay-Free MSI c %Clay-Free CSI/MSI
MeanSD dCV e %MeanSDCV %MeanSDCV %MeanSDCV %
UPP51.648.7116.8726.573.3712.6810.432.3122.152.610.3814.57
MIP81.2413.5416.6642.4710.0923.7617.784.4124.812.450.5622.71
LOP99.412.342.3534.949.9728.5430.005.3017.661.250.5745.86
S0-L594.4114.8415.7234.259.9128.9227.877.8328.091.410.7049.93
a SI = 50 − 2 μm particles, b CSI = 50 − 20 μm silt separate, c MSI = 20 − 10 μm silt separate, d SD = standard deviation, e CV = coefficient of variation.
Publisher’s Note: MDPI stays neutral with regard to jurisdictional claims in published maps and institutional affiliations.

