Article

Comparative Study on the Physio-Biochemical Responses of Spring and Winter Barley Genotypes under Vernalized and Greenhouse Conditions

1
Key Laboratory of Crop Germplasm Resource, Department of Agronomy, College of Agriculture and Biotechnology, Zhejiang University, Hangzhou 310058, China
2
State Key Laboratory of Subtropical Silviculture, College of Forestry and Biotechnology, Zhejiang A & F University, Hangzhou 311300, China
3
Hubei Collaborative Innovation Center for Grain Industry, College of Agriculture, Yangtze University, Jingzhou 434022, China
*
Author to whom correspondence should be addressed.
Agronomy 2022, 12(2), 339; https://doi.org/10.3390/agronomy12020339
Submission received: 14 December 2021 / Revised: 3 January 2022 / Accepted: 19 January 2022 / Published: 29 January 2022

Abstract

:
In barley (Hordeum vulgare L.) breeding, heading date is one of the most important agricultural traits that is essential for the completion of its life cycle. Certain endogenous and environmental factors regulate floral transition, morphing the complex genetic mechanism of the heading phase, which could serve as a premise of orchestration for improved yields. To elaborate the network of genetic and environmental signals, a hydroponic experiment was carried out using two spring (i.e., DM65 and DM70) and two winter barley genotypes (i.e., DM269 and DM385). Our results confirmed that the vernalized environment produced a substantial reduction in plant height, biomass and photosynthetic activity compared with the control plants. A noticeable increase in oxidative stress was exhibited by DM65 and DM70 plants compared with their respective controls at 20 °C, while no significant difference was observed for any genotype grown in the greenhouse (25 °C). Simultaneously, increased antioxidant enzyme activity in winter barley genotypes showed a defensive mechanism under vernalized conditions (4 °C). Furthermore, the expression of key regulatory flowering genes revealed that the vernalization gene (HvVRN1) is the key regulator of floral induction after cold exposure, whereas Photoperiod Response Locus 1 (HvPpd-H1) had significantly higher expression under greenhouse conditions, along with Phytochrome C (HvPHY-C), validating their involvement as upstream heading time regulators. These findings contribute to enriching the study of environmental signals that substantially modulate the complex mechanism of barley heading date.

1. Introduction

Over the coming decades, the predicted future climate changes brought on by anthropogenic modifications of the environment will pose many challenges to agriculture [1]. Among the world’s most important cereal crops, barley ranks fourth in quantity produced and provides food and beverages for humans, as well as feed for animals [2]. It is estimated that barley yield may decrease by up to 20%, depending on climatic projections, because temperature extremes will harm its reproductive stages, and the maximal grain production depends significantly on the optimum time to heading under different climatic conditions [3]. Variations in the requirements of vernalization and photoperiod provide the basis for adaptation and plasticity in many plant species to control floral growth [1,3]. In barley, the VRN1, Ppd-H1, and Phy-C genes play a complex role in environmental sensing and interactions. The VRN1 gene in barley is the primary regulator of vernalization, whereas the Ppd-H1 and Phy-C genes control floral induction and circadian rhythms during the photoperiod [1]. Synchronization between vernalization and the photoperiod converges to modulate the transition of the vegetative to reproductive phase. During the reproductive transition, vernalization and photoperiod genes influence developmental processes such as tiller formation, floral organ initiation, and spikelet number [4]. The VRN1 gene, which translates MADS-box transcription factor, is found on chromosome 5H of barley and is related to the Arabidopsis APETAL1/FRUITFUL genes, which are involved in development of the floral meristem [5]. Upregulation of VRN1 in genotypes that are susceptible to vernalization is proportional to the period of cold exposure. VRN1 is a homolog of the Arabidopsis FT gene, which stimulates flowering by upregulating VRN3 to initiate flowering [6]. Natural allelic variation at the VRN1 locus is primarily responsible for the differences in heading date between winter and spring barley. The winter growth habit is associated with the recessive allele, while the spring growth habit is conferred by a single dominant VRN1 gene. In temperate regions, recessive VRN1 genes are preferred over dominant ones in spring barley because the vernalization response is thought to enable plants to evolve and mature more slowly in productive environmental conditions. Early flowering-associated mutations in the promoter regions, retrotransposon insertions, and major deletions in Intron 1 have been observed in the dominant genotypes of VRN1 [3,6,7]. Ectopic expression of VRN1 is linked to promoter mutations or deletions in the 2.8 kb region downstream from the first exon [7]. In order to induce floral competency, genotypes that bear these mutations require no vernalization and thus undergo accelerated flowering. While these mutations cause flowering to occur quickly in spring wheat, it has also been known that the typical allelic variation of the recessive VRN1 genes affects the duration of vernalization requirements [8,9]. The variation in the winter requirements of barley vernalization is caused by genetic variations such as transcript synthesis and coding sequence mutations.
Another factor that modulates flowering and growth is photoperiodism. Putatively regulating photoperiodism, the Ppd-H1 gene is located on chromosome 2H [10], mainly displaying expression during the day, and is orthologous to the family of the Arabidopsis PRR genes that control the circadian clock cycle [11,12,13]. Ppd-H1 interacts with the vernalized pathway through CO, a core component of the photoperiod pathway by direct or indirect activation of VRN3 [14]. Photoperiod sensitivity is a significant factor affecting the time of flowering. Sensitivity to photoperiod puts wheat and barley in two classes, i.e., sensitive and insensitive types. Insensitive photoperiod genotypes (carrying alleles designated with the suffix “a”) will flower regardless of daylength, whereas responsive photoperiod genotypes (carrying alleles designated with the suffix “b”) will react strongly to increasing daylength [12]. Furthermore, photoperiodic variations are derived from mutations such as retro-transposon insertions, deletions in the regulatory sites, gene truncation, and gene dosing [11]. This variation in the photoperiod response is useful for adapting phenological growth for various growing environmental conditions. On one hand, insensitivity to photoperiods can be beneficial, allowing plants to mature quickly and fill grain before the temperatures of summer get too high. On the other hand, photoperiod sensitivity enables plants to delay maturity in order to increase the growth of leaves and spikelets, and tillering [15]. When the days are short, photoperiod sensitivity prevents flowering out of sync during the fall. The value of delaying flowering for plant growth has been shown to increase yield in cultivation at higher latitudes.
Recent studies have demonstrated that the light-sensing photoreceptor PhyC gene plays a significant role in flowering. The PhyC gene is present on chromosome 5H as a single-copy gene and co-segregates with the VRN1 loci [16]. It is a part of the phytochrome photoreceptors that control photo-morphogenesis by sensing red and far-red light [17]. When plants experience variations in the ratio of red to far-red light, their growth behavior can change to either slow down or speed up flowering [18]. The PhyC gene is intricately linked to the photoperiod pathway as an upstream regulator, regulating the floral integrator CO of circadian light-dependent entrainment [1,19,20,21,22]. Photoperiod-regulated genes showed significantly reduced expression in plants with a loss of PhyC function [23]. However, Phy-C plays a functional role and has no direct interaction with the VRN1 genes in controlling light activation of photoperiod response genes [1,20,24]. Another possible node in the flowering pathway that could be regulated in combination with the photoperiod genes to adjust heading date is the PHY-C gene. The global rise in temperatures and unpredictable climate change could have an effect on many barley-growing regions, and it is important to recognize gene variants that allow plants to adapt to future climate change. This study was designed to explore the comparative responses of barley genotypes differing in their growth habits (winter and spring genotypes) to cold exposure, greenhouse conditions, and a combination of both, as well as to document the expressional variations of the VRN1, Ppd-H1, and PHY-C genes. Developing cultivars which are adaptable to the changing environment and the identification of novel gene variants that can modulate heading date are paramount and can provide plant breeders with valuable genetic tools.

2. Materials and Methods

2.1. Experimental Material and Growth Conditions

Barley genotypes with early-maturing (i.e., DM65 and DM70 Spring) and late-maturing (i.e., DM269 and DM385 Winter) growth habits were used in this study. Two hundred seeds of each genotype (50 for each growth condition) were surface-sterilized with 2% H2O2 for 30 min, rinsed thoroughly with distilled water, and then sown in the controlled environment and grown for 4 weeks. In the vernalized growth environment, seedlings of all genotypes were vernalized at 4 °C with a daylength of 14 h, whereas, for the greenhouse growth environment, the day/night temperature was maintained at ~25/19 °C with a daylength of 14 h. Additionally, the control plants of each genotype were grown under conditions of ~20/16 °C as the day/night temperatures with a daylength of 16 h. For the combined V+GH treatment, 14-day-old seedlings exposed to cold temperatures were moved to greenhouse conditions for another 14 days. The experiment was laid out as a completely randomized design with three replicates.

2.2. Analysis of Morphological and Photosynthetic Parameters

After 4 weeks of exposure and prior to harvesting, photosynthetic parameters including the net photosynthetic rate (Pn), transpiration rate (Tr), and stomatal conductance (Gs) were determined in fully established upper leaves using an IRGA-based photosynthetic system (Li-6400 system, Li-COR, Lincoln, NE, USA). A built-in light-emitting diode source with a flow rate of 400 μmol s−1, a relative humidity between 50–70%, and a CO2 concentration of 400 μmol mol−1 was used to calculate the photosynthetic parameters at a photon flux density of 1000 μmol m−2 s−1. Both vernalized and greenhouse plants were used to determine root length, shoot height, and root and shoot fresh and dry weights. Fresh root and leaf samples were immediately frozen in liquid nitrogen and stored at −80 °C for further analyses. The remainder were dried for 3 h at 105 °C and then for another 24 h at 80 ± 1.5 °C to a constant dry weight for the measurement of dry biomass.

2.3. Detection of Antioxidant Activity and Lipid Peroxidation Assay

Leaf tissue samples weighing about 0.5 g were thoroughly homogenized in 1500 µL of 50 mM saline phosphate buffer (PBS; pH 7.8) and centrifuged at 12,000 rpm for 20 min at 4 °C for enzyme activity analysis. As previously described by [25], the superoxide dismutase assay was carried out by inhibiting the photochemical reduction of NBT by mixing the enzyme extract in a microplate with a reaction solution prepared using a 50 mM phosphate buffer, 75 mM NBT, 20 mM riboflavin, 100 mM Na2-EDTA, and 130 mM methionine. The amount of extract that inhibited the photoreduction of NBT by 50% was described as one unit of enzyme. SOD activity was measured spectrophotometrically at 560 nm in comparison with a blank reagent, and the following formula was used for calculations:
SOD   activity   = Ack     Ae ×   V   ÷   0.5   ×   Ack   ×   W   ×   Vt
where, Ae is the OD value on the spectrophotometer, Ack is the OD value for the control tube under light conditions (at 4000 Lux for 20 min), V is the total volume of the buffer solution used to extract the enzyme, W is the fresh weight of the sample, and Vt is the amount of enzyme extract used in the reaction solution to test SOD.
Subsequently, peroxidase activity (POD) was determined by calculating the increase in guaiacol oxidation absorbance at a wavelength of 470 nm. The reaction mix included a buffer of 50 mM (pH 7.8), 1.5 mM g−1 guaiacol, 300 mM H2O2, and the sample tissue extract. POD activity was calculated using the following formula:
POD   activity   mM   ÷   g   FW   =   A   ×   V   ÷   a   ÷   E   ×   W
where, A is the OD value on the spectrophotometer, E is the activity constant (26.6 mM cm−1), V is the total volume of the buffer solution used to extract the enzyme, W is the weight of the sample, and A is the amount of enzyme extract used in the reaction solution.
MDA content was calculated as the expression of lipid peroxidation using the method of [26]. Briefly, tissue samples weighing 0.5 g were homogenized in 1500 µL of TCA containing 5% (w/v) and centrifuged at 12,000× g for 20 min at 4 °C. After hat, 200 µL of supernatant was combined with 800 µL of TBA reagent, which was then incubated at 95 °C for 15 min before being rapidly cooled in ice to stop the reaction, followed by centrifugation at 4800 rpm for 10 min. At wavelengths of 532 and 600 nm, the absorbance was measured on a fresh weight basis. The extinction coefficient of 155 mM−1 cm−1 was used to measure the MDA concentration. The experimental values were determined against the MDA standard curve.
MDA   contents     =   OD 532   OD 600 ×   A   ×   V   ÷   a   ×   E   ×   W
where A is the total RS + EE used, V is the total volume of the buffer solution used to extract the enzyme, W is the fresh weight of the sample, A is the amount of enzyme extract used in the reaction solution, and E is the activity constant for MDA (1.55 × 10⁻¹)

2.4. Gene Expression Analysis

To validate the possible mechanisms responsible for the observed changes in heading date under different environmental conditions, expression analysis of major candidate genes that control the heading time of barley under different environmental conditions was performed. Leaf samples were collected from the second leaf stage till heading from the different environmental conditions in three biological replicates, freeze-dried, milled, and then pooled together for RNA extraction, which was performed using the MiniBEST Plant RNA Extraction Kit (catalog # 9767; TaKaRa, Tokyo, Japan). All the procedures, from extraction to purification, were carried out according to the manufacturer’s recommendations. For qualitative and quantitative checks of the acquired RNA, electrophoresis with 2% agarose gel and a Titertek-Berthold nanospectrometer (Pforzheim, Germany), were used, respectively. For the synthesis of cDNA, the Prime Script RT reagent Kit (catalog # RR037A; TaKaRa, Tokyo, Japan) was used, following the instructions of the manufacturer. Quantitative assays were carried out in triplicate using SYBR Green Master mix (catalog # 4309155; Takara, Tokyo, Japan) in a 20 µL reaction volume in a Roche Light Cycler® 480 (Roche, Basel, Switzerland). Site-specific primers were designed to amplify Hordeum vulgare L. homologs obtained by searching the NCBI database for candidate genes (Table 1). Actin (GenBank ID: AY145451) was used as a reference gene and the quantitative relative expression of the genes of interest was determined according to [27] following the 2^ (−ΔΔCT) equation.

2.5. Statistical Analysis

The experiment was laid out as a completely randomized design, and the data were statistically evaluated using analysis of variance (ANOVA) with Statistics 8.1 (Software AG, Darmstadt, Germany). Mean values were compared using the least significant difference (LSD) test at p < 0.05. MS Excel 2016 was used to draw the graphs, whereas for making the heatmaps, TBtools (V. 0.665) was used [28].

3. Results

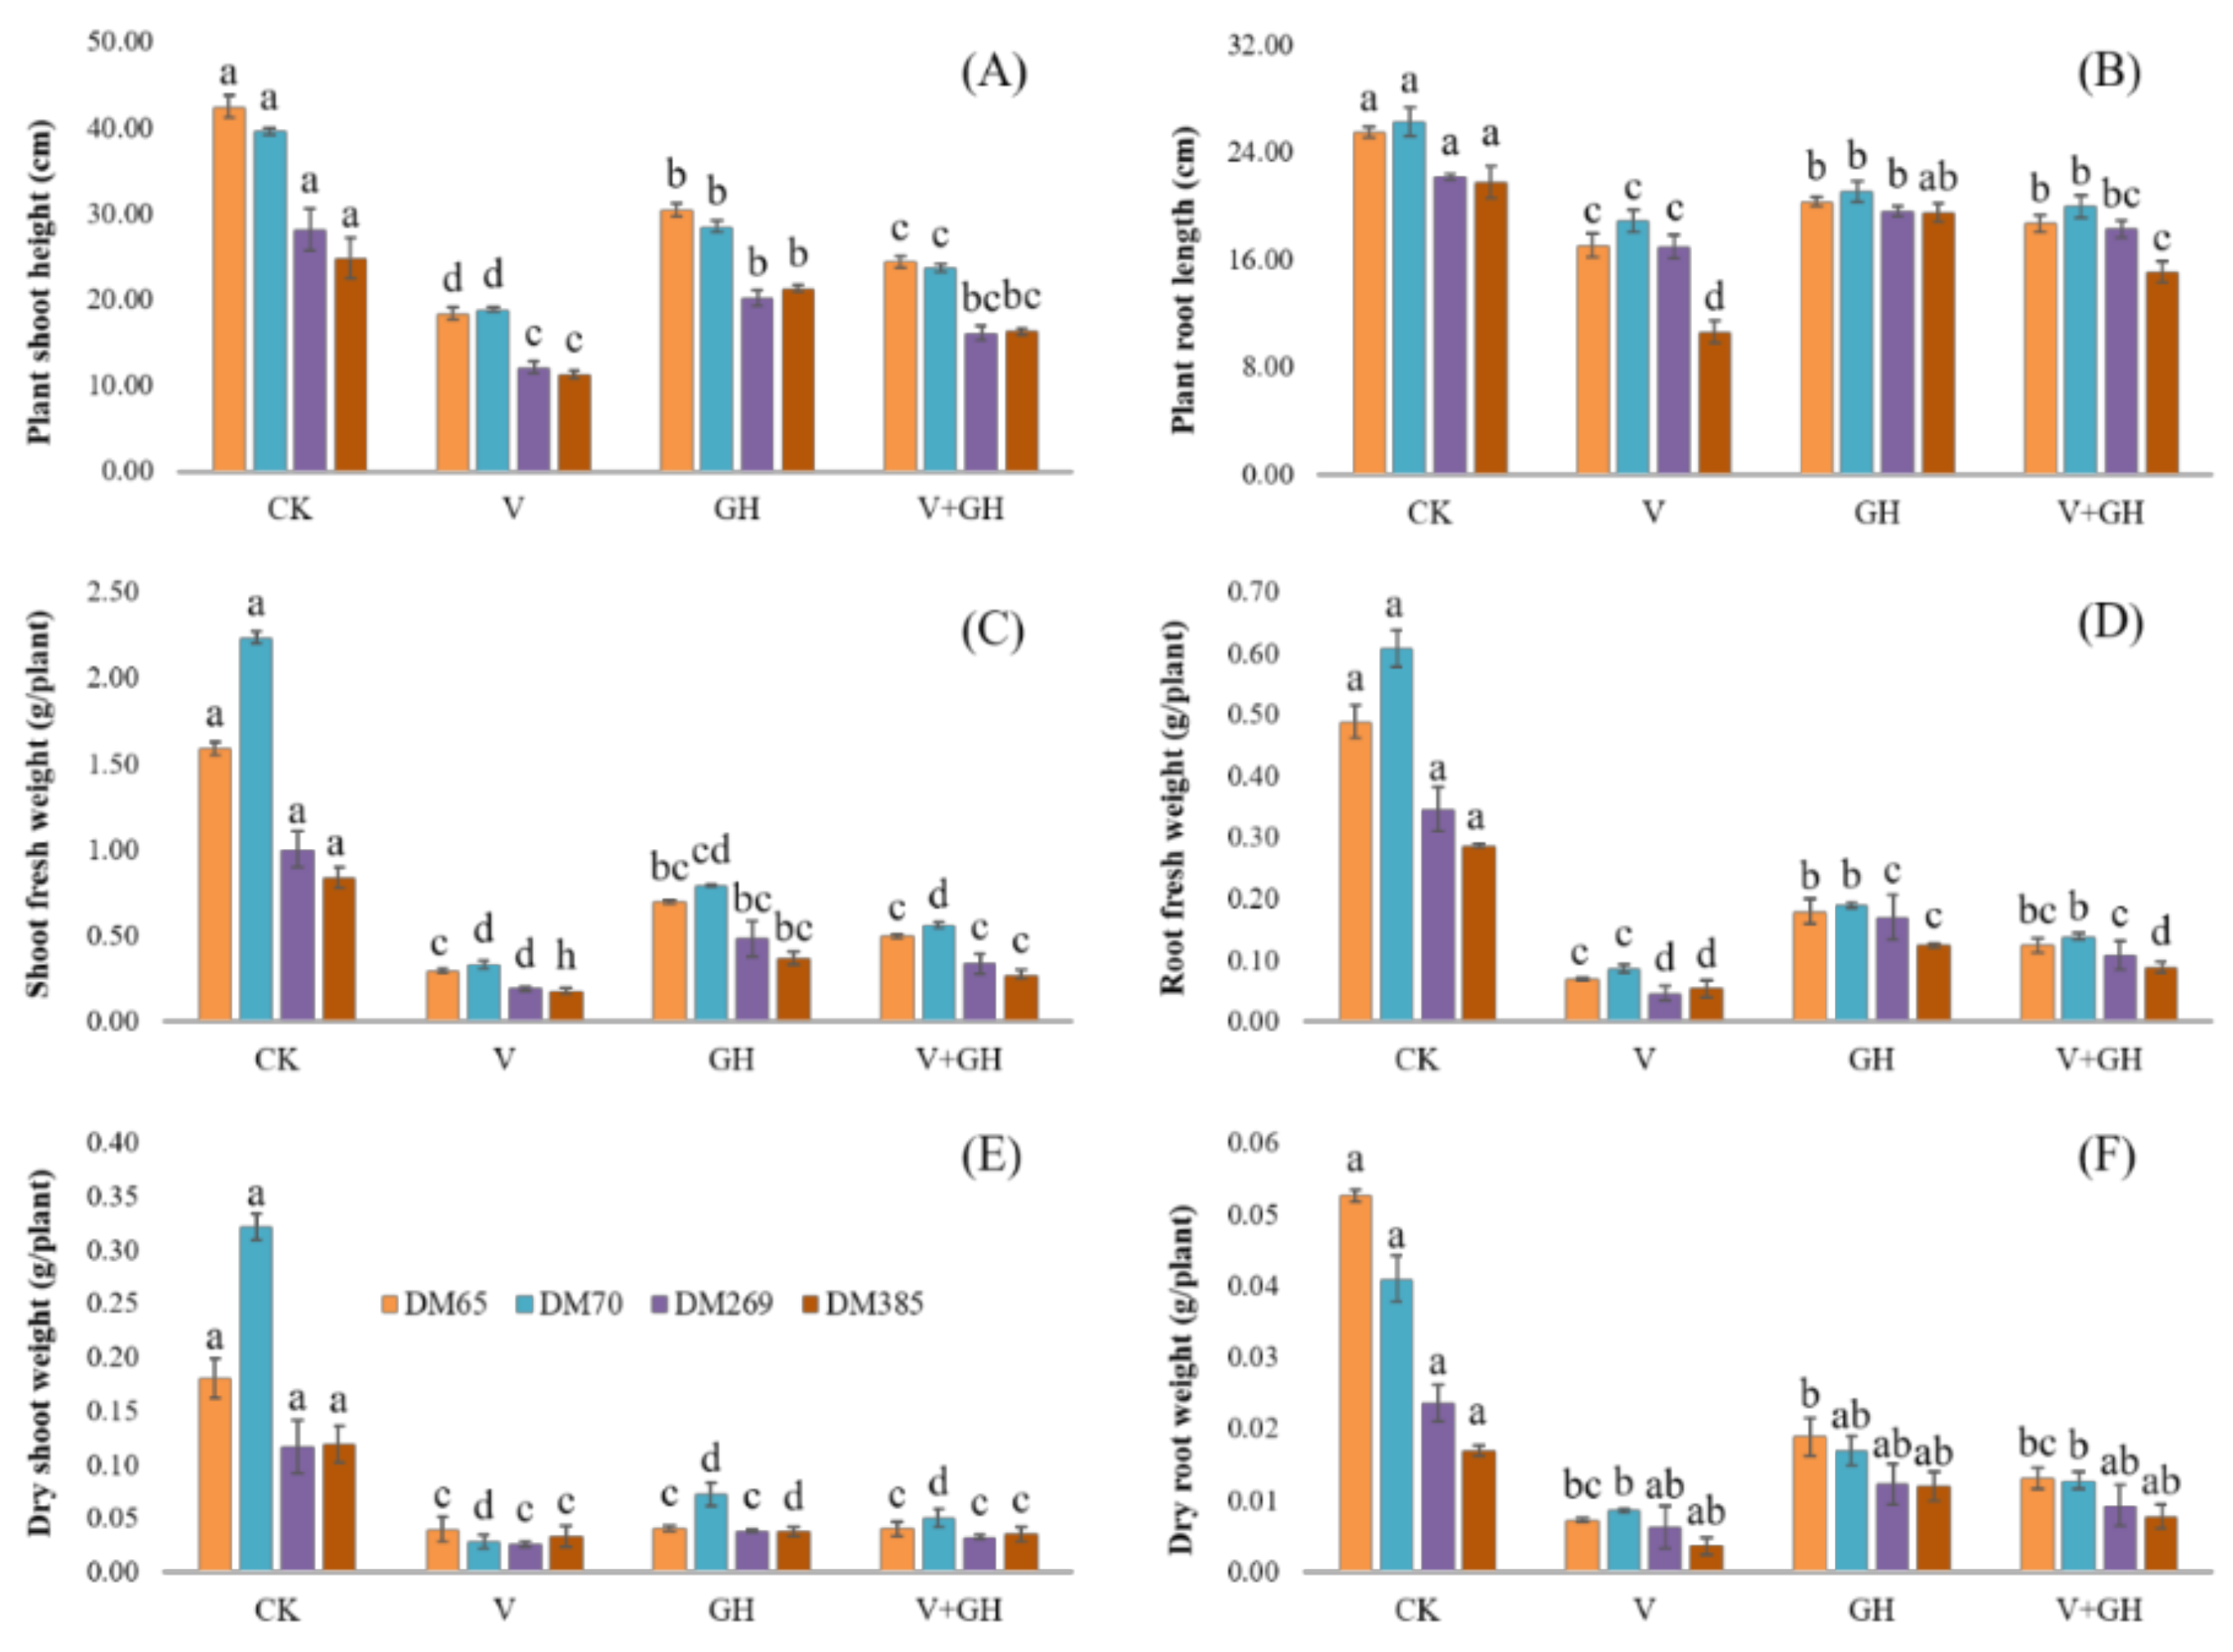
3.1. Plant Growth Attributes

The reduction in plant growth under the treatments of vernalization, greenhouse, and moving to the greenhouse after vernalization compared with their respective controls is presented in Figure 1. Here, the reduction was much higher in DM269 and DM385, with shoots being more impaired than roots; under vernalized conditions in particular, a reduction of 40% and 51% was observed in DM269 and DM385, respectively. However, the same genotypes exhibited a lower percentage of reduction in the greenhouse compared with the other two genotypes. As expected, plant biomass was significantly reduced in both environments compared with the control. The vernalized environment showed a greater reduction in winter barley compared with the spring type, even when plants were moved to the greenhouse.

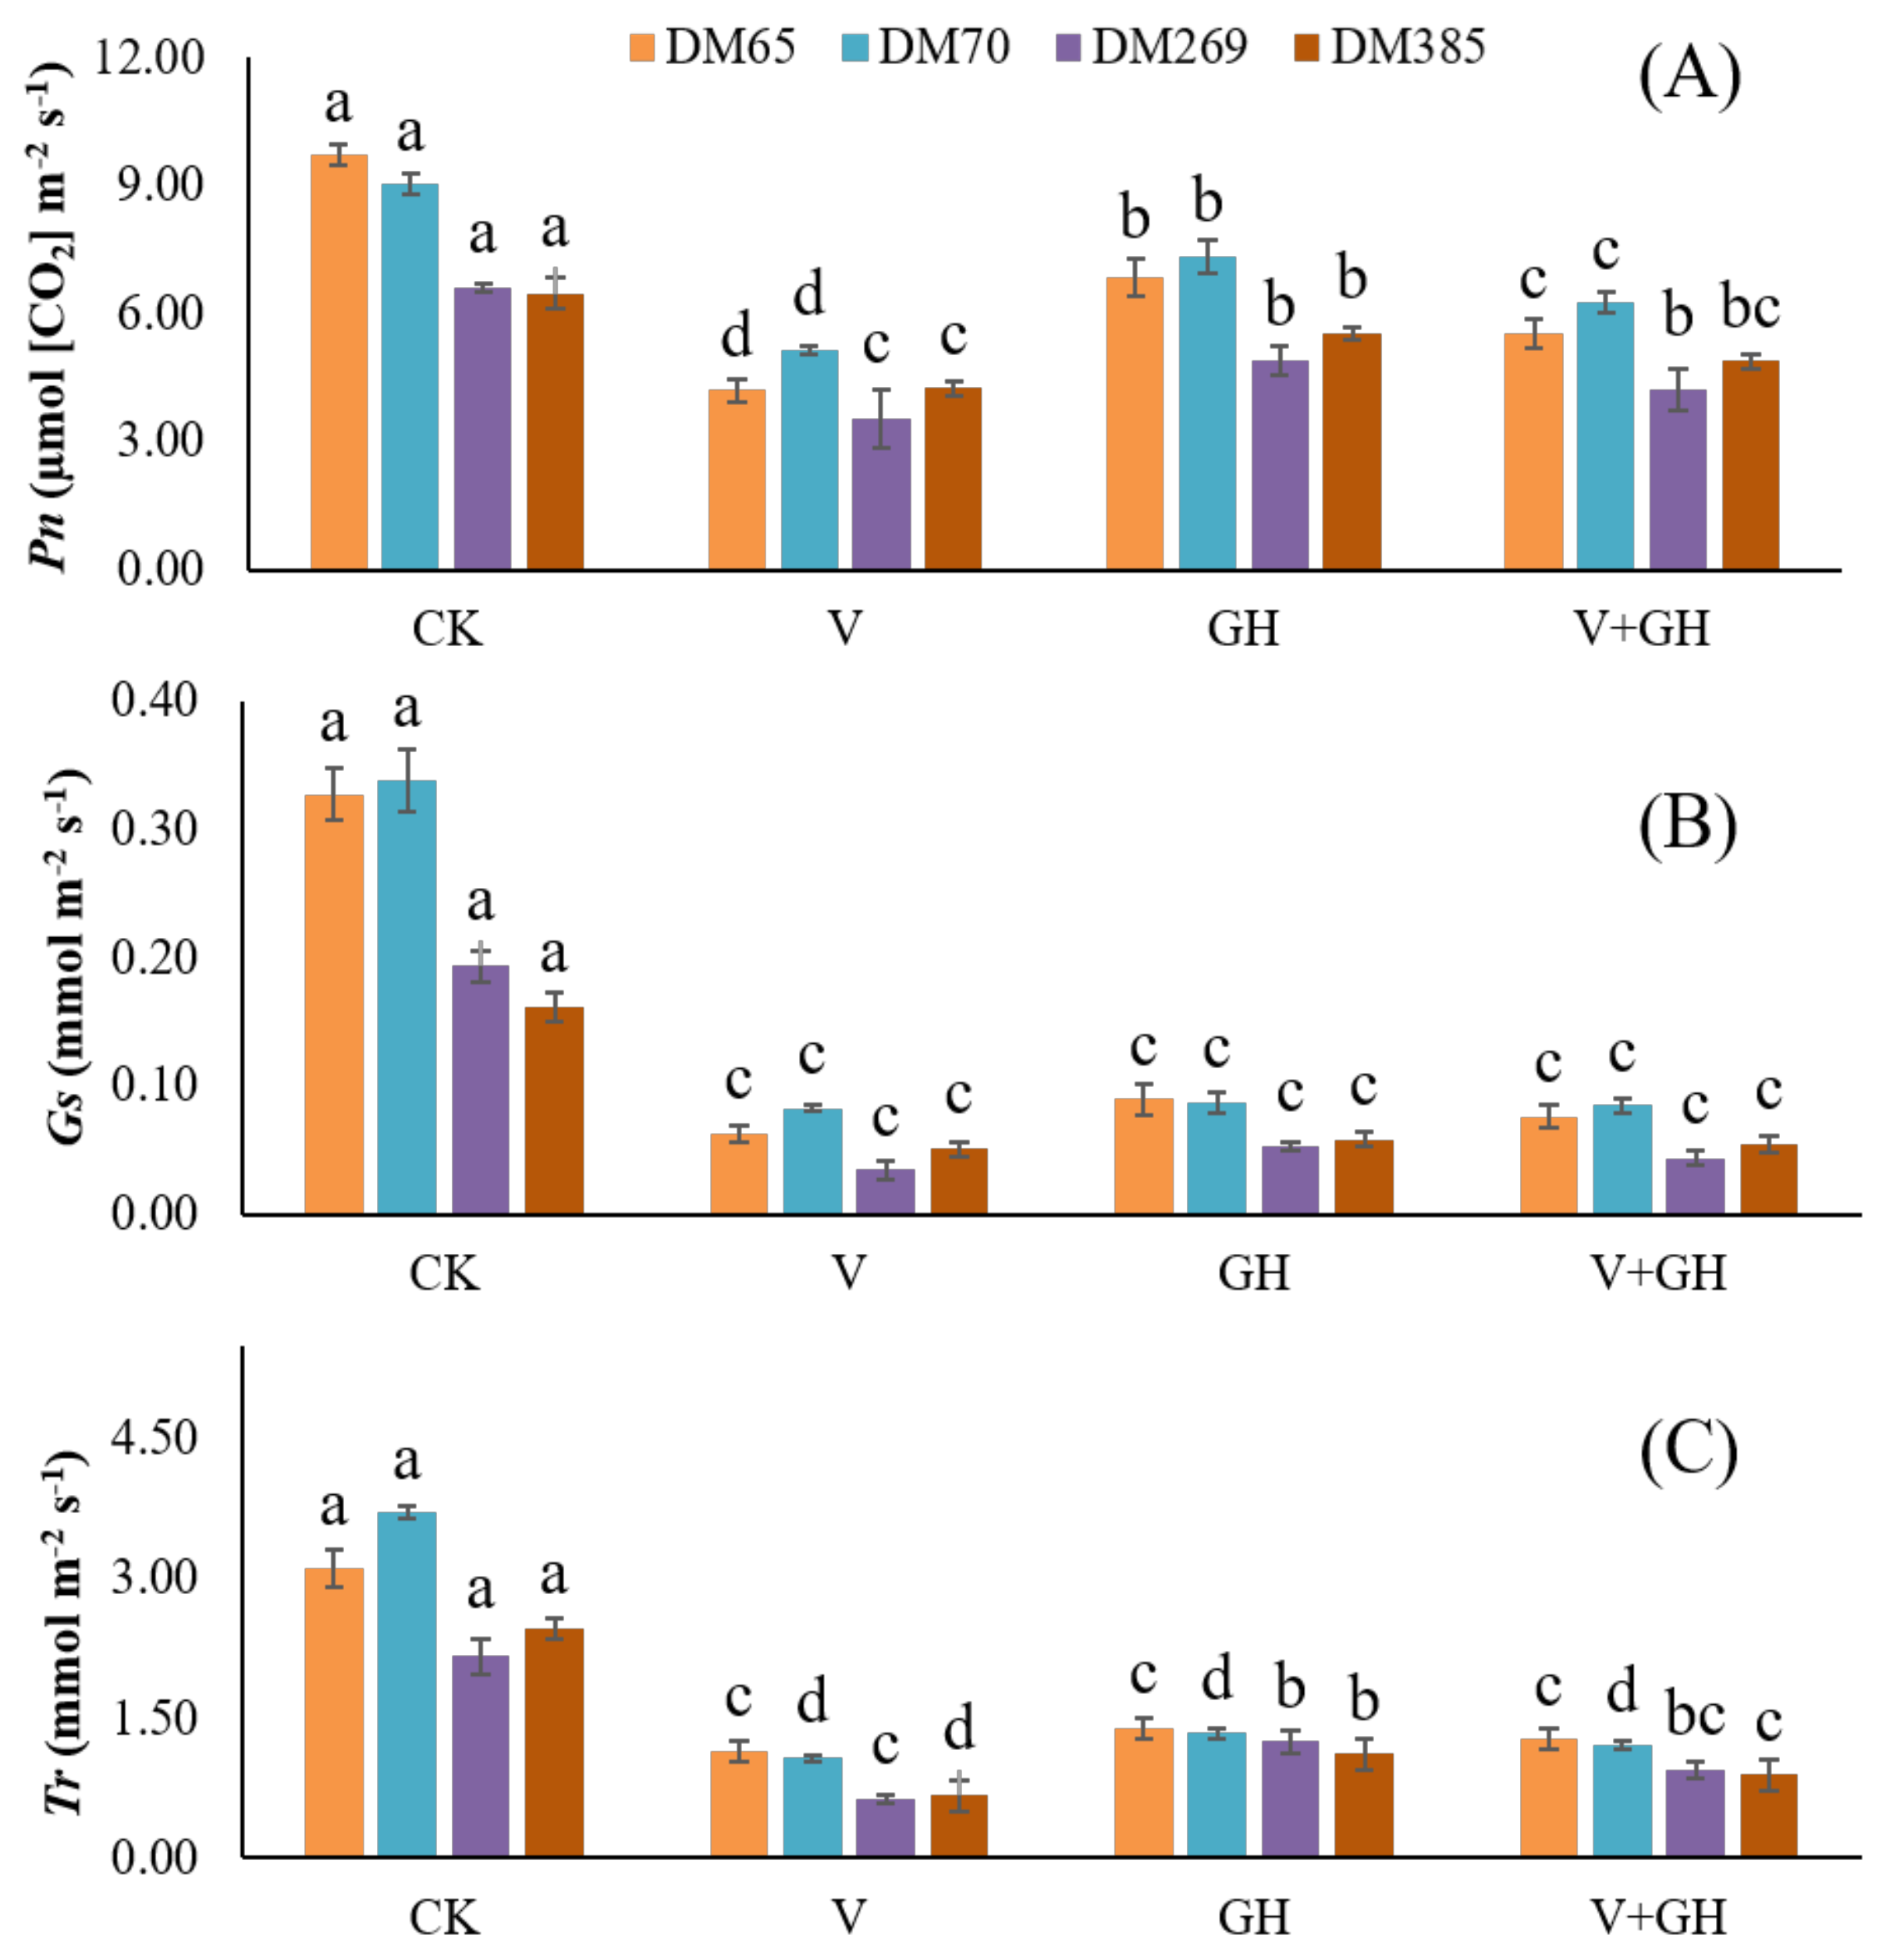
3.2. Photosynthetic Parameters

To investigate the effect of vernalization or greenhouse conditions on the photosynthetic systems in different barley genotypes, Pn, Gs, and Tr were tested in four barley genotypes. As shown in Figure 2A, Pn decreased in DM269 and DM385 under vernalization more so than in the greenhouse or when moved to the greenhouse post-vernalization, whereas DM65 and DM70 showed an increased Pn compared with both late-maturing genotypes. On the other hand, levels of Gs and Tr were inhibited by vernalization or low temperatures in all genotypes (Figure 2B,C). With exposure to vernalization and the greenhouse, Gs and Tr levels decreased by more than half compared with their respective controls.

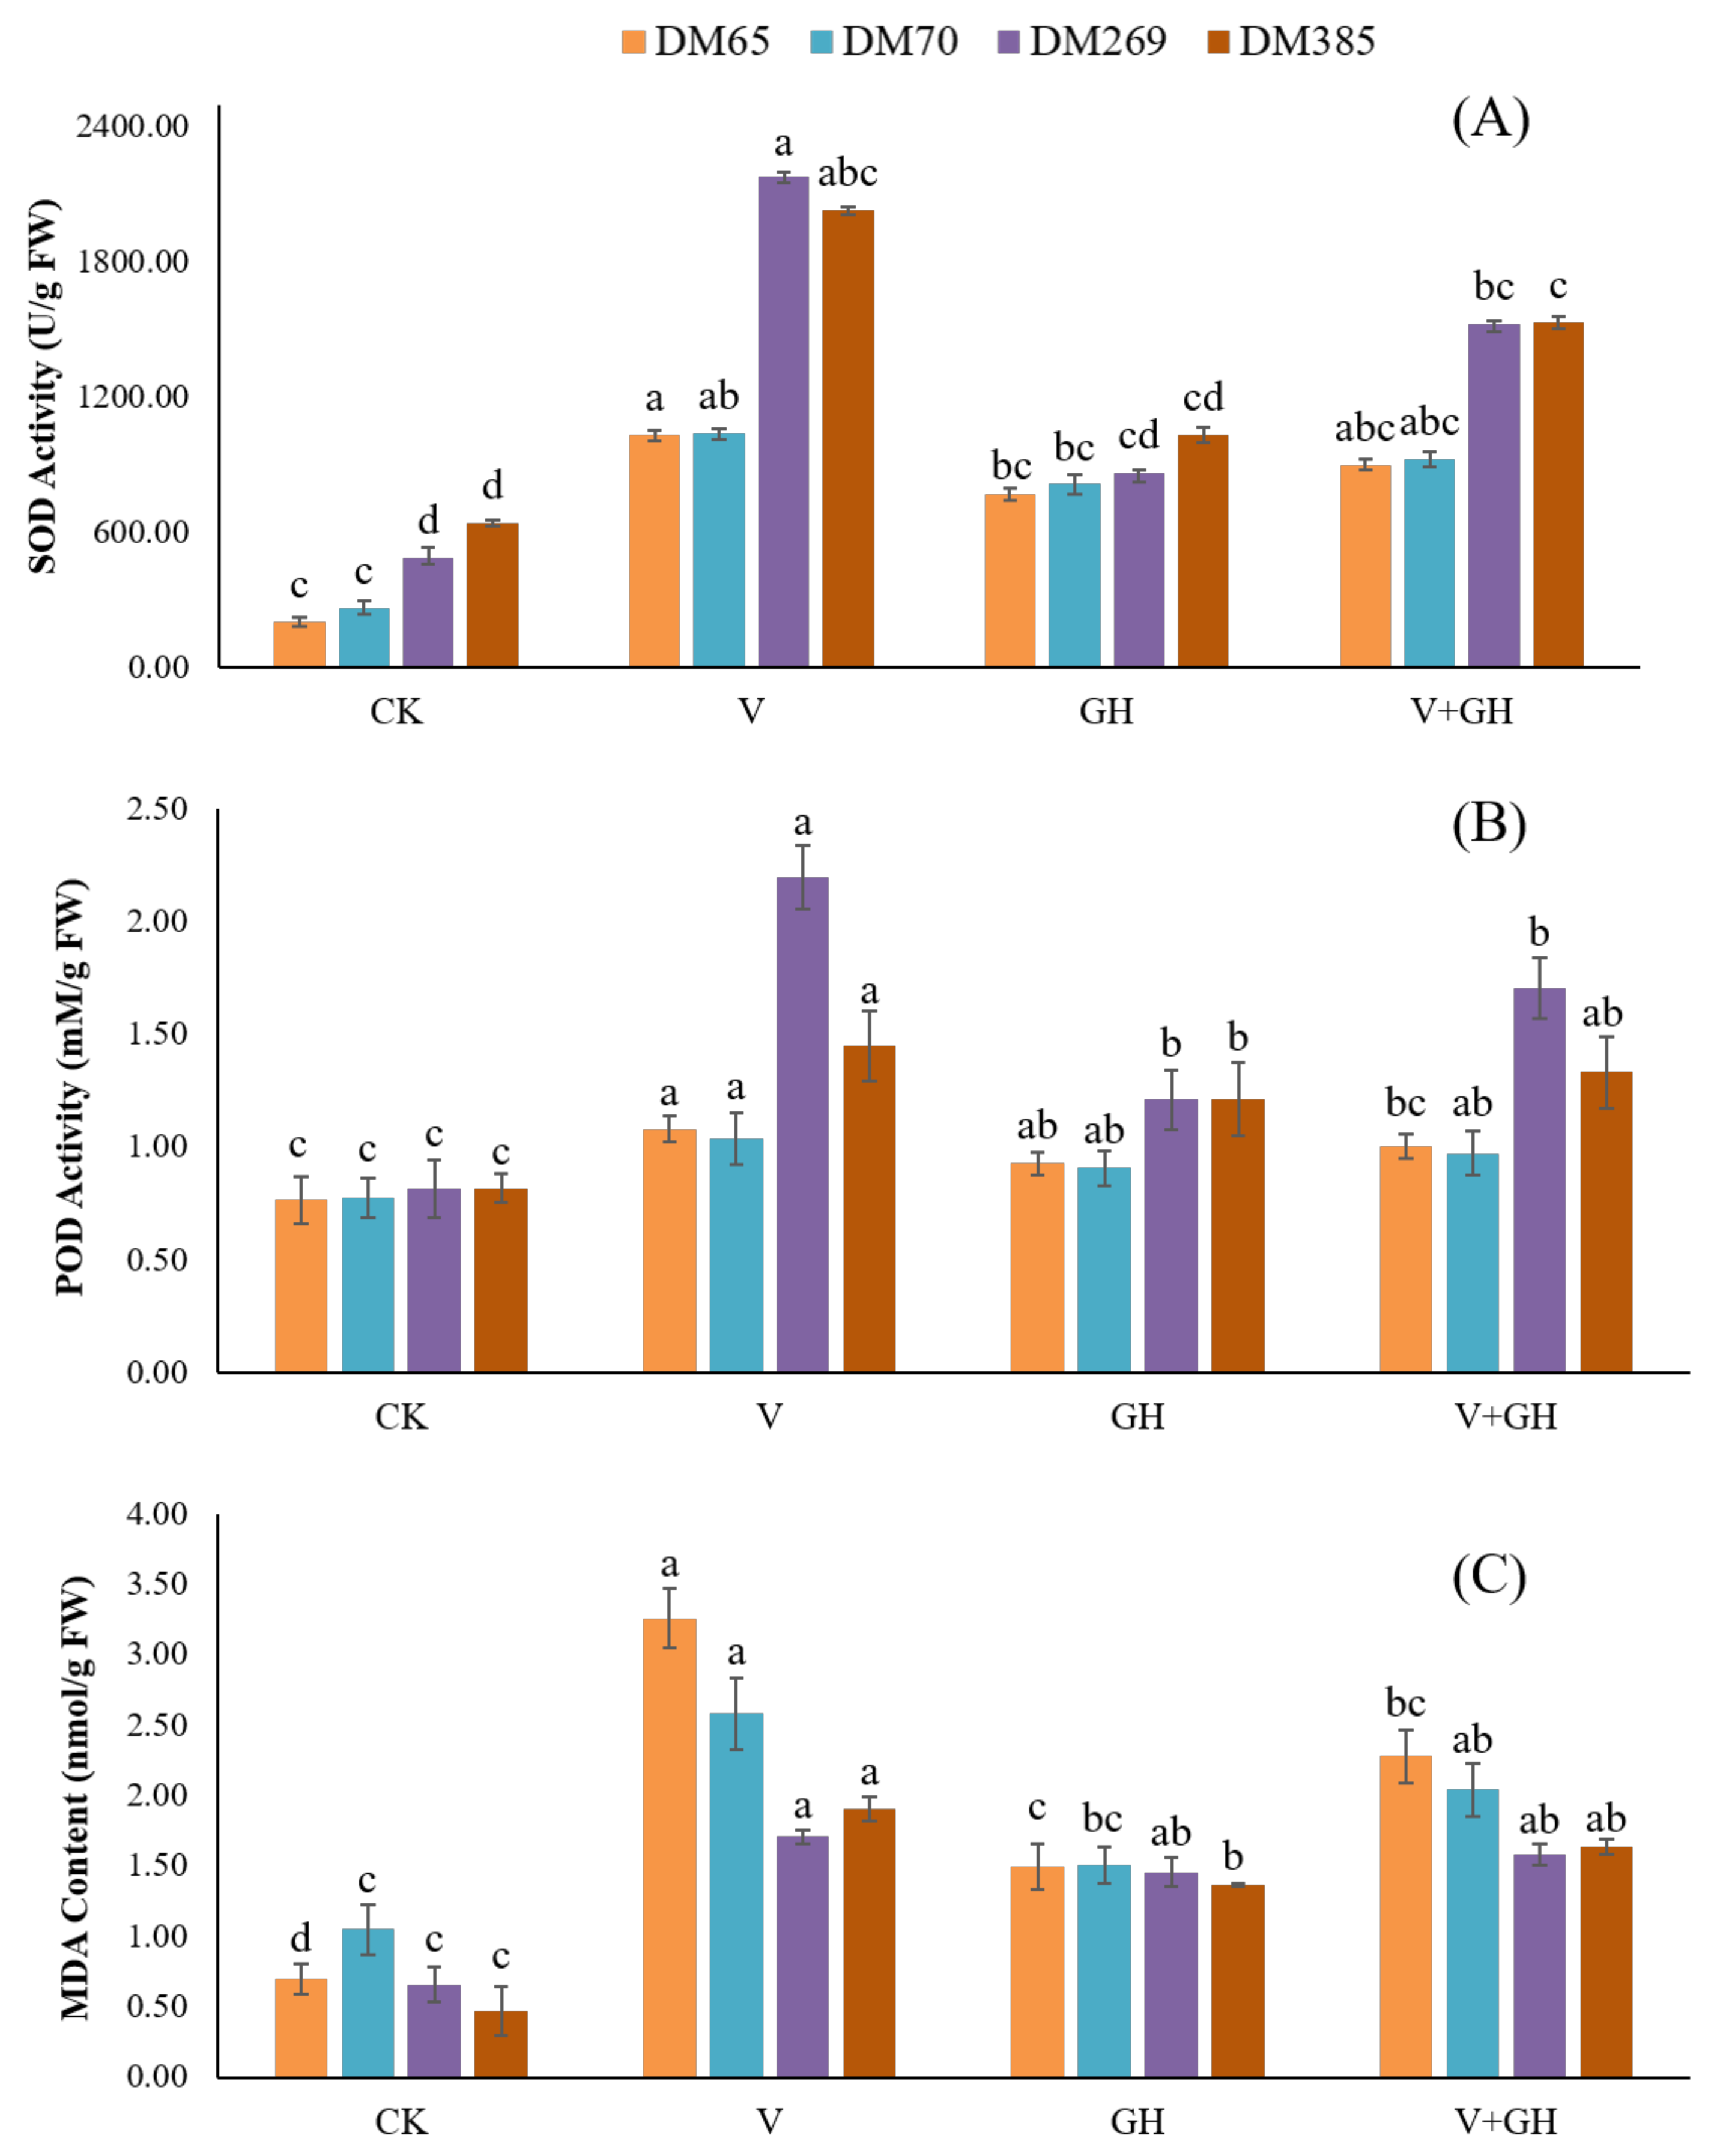
3.3. Membrane Lipid Peroxidation and Antioxidant Enzyme Activity

Measurements of vernalized plants showed an increase in MDA concentrations for spring barley genotypes compared with the winter barley genotypes, where the maximum rate of increase was observed in DM65 (Figure 3). Under greenhouse conditions, MDA concentration remained constant in DM65, DM70, and DM269, but decreased slightly in the winter barley genotype DM385. There was no significant difference in the MDA concentration in the greenhouse among all the genotypes. To ascertain the relationships among physiological traits of barley genotypes, we determined the SOD and POD activity in the vernalized and greenhouse environments. Superoxide dismutase activity in all tested winter genotypes was relatively higher during vernalization. A gradual increase in antioxidant enzymes was observed in all the genotypes when grown in the greenhouse. As expected, an early shift to the reproductive stage in the spring barley genotypes DM65 and DM70 was led by the lower activity of or reduction in SOD even in the vernalized environment. In the case of peroxidase activity, a similar trend to SOD was found under vernalized conditions. Peroxidase antioxidant enzyme activity was elevated in the vernalization environment. Greenhouse conditions, on the contrary, drastically reduced the activity of POD activity compared with the respective vernalized counterparts. Subsequently, exposure to the greenhouse post-vernalization displayed an intermediate pattern for both SOD and POD activities. Altogether, the winter type barley genotypes had higher enzymatic activities than the ones with a spring growth habit.

3.4. Expression of Candidate Genes in Different Environments

The relative expression of three candidate genes mainly regulating the heading mechanism was calculated, and a noticeable difference among the four genotypes was observed in different environments (Figure 4). At the second-leaf stage, vernalization caused a significant increase in the expression level of HvVRN1 and HvPHY-C in all the genotypes, except HvPpd-H1, which showed lower expression than the control. On the other hand, greenhouse conditions reduced the expression of HvVRN1 and HvPHY-C in DM269 and DM385, but significantly increased the expression of HvPpd-H1 in DM65. Except for DM385, all genotypes showed increased HvVRN1 expression under vernalized conditions when the third-leaf stage was reached. Simultaneously, HvPHY-C had significantly higher expression, while HvPpd-H1 had significantly lower expression in all genotypes. HvVRN1 and HvPHY-C were found to have no or low expression in DM269 and DM385, respectively. In DM65, however, there was an increased level of HvPpd-H1 expression. HvVRN1 expression was found to be lower in the winter genotype DM385 under vernalization at the fourth-leaf stage.
Simultaneously, the expression of HvPHY-C increased markedly in all genotypes, whereas only DM65 showed an increase in HvPpd-H1 expression levels under vernalization. Greenhouse conditions induced HvVRN1 and HvPHY-C expression in all barley genotypes; however, HvPpd-H1 expression decreased in DM70 and DM269 compared with the other two genotypes. When the plants were transferred to the greenhouse, HvVRN1 and HvPHY-C were expressed positively in all barley genotypes, but DM65 showed negative expression for HvPpd-H1. With the exception of HvPpd-H1, which had lower expression in DM70 and DM269 under greenhouse conditions, all three genes showed a substantial increase in their expression level at the fifth-leaf stage, regardless of the barley genotype or environmental conditions. All three genes were found to have significantly higher expression at the sixth-leaf stage in all genotypes and environmental conditions, with the exception of HvVRN1 and HvPpd-H1, which both showed a significant decrease in their expression levels under vernalization and in the greenhouse in winter barley genotypes, respectively. Except for HvPpd-H1, which showed lower levels of expression in the greenhouse (DM385) and when plants were shifted to the greenhouse (DM269), all genes had noticeably increased expression in all genotypes and environmental conditions at the seventh-leaf stage.
The results for the eighth-leaf stage showed the same increasing pattern of relative gene expression, but only the HvPpd-H1 gene showed a lower level of expression in DM385 under greenhouse conditions. HvVRN1 was upregulated in DM269 and DM385 at the ninth-leaf stage in both the greenhouse and shifting environments. When DM385 was exposed to vernalization then shifted to the greenhouse environment, the expression levels of HvPHY-C and HvPpd-H1 decreased significantly. All three genes showed a significant increase in expression level at the tenth-leaf stage, regardless of the barley genotype or environmental conditions, with the exception of HvPpd-H1, which had lower expression in DM269 when transferred to the greenhouse environment.

4. Discussion

Diverse morpho-physiological characteristics of different crop plants have been affected by different abiotic environmental factors. These effects arise from changes in the different physiochemical processes, which influence vital photosynthetic processes [29,30]. This research examined four barley genotypes under vernalized and non-vernalized environmental conditions for the physio-biochemical and genetic mechanisms controlling barley heading date. Under vernalization and greenhouse conditions, plant growth parameters, malondialdehyde content, and superoxide dismutase and peroxidase activity differed. Our findings showed that in comparison with vernalized plants, the biomass of greenhouse grown plants increased substantially. Reportedly, temperature differences tend to reduce plant height, total biomass, and the number of tillers in cereals [31]. Further evidence involves the study on common bean (Phaseolus vulgaris) conducted by [32], which demonstrated the likely effects of environmental conditions on morpho-physiological characteristics, such as shoot and root development and plant height. Previous studies indicated that the overall phenological cycle could be decreased as a result of high and low temperatures, ultimately decreasing the life cycle. According to several studies, a temperature deviation of 1–2 degrees Celsius from the optimum requirement may cause phenological disturbances in plants [33,34]. To defend cells during biological evolution and from the toxicity of free radicals, plants used different mechanisms, such as enzymatic resistance [35]. With the onset of vernalized conditions, the MDA content of spring barley genotypes increased, implying that spring genotypes performed poorly in response to vernalized or low-temperature conditions. The degree of MDA was related to the activity of SOD, which played a major role in scavenging ROS as a major antioxidant enzyme [36]. High levels of SOD activity increase the plant’s antioxidant efficiency to reduce the level of membrane lipid peroxidation [37,38].
In this study, SOD activity decreased under greenhouse cultivation but increased under vernalization in the winter barley genotypes DM269 and DM385. The ability of antioxidant enzymes to maintain and restore the activity reduced during chilling temperatures relatively quickly after plants were transferred to warm conditions was reported to achieve low temperature resistance [39]. The highest degree of SOD activity during vernalization was displayed by DM269, suggesting that it has greater tolerance than other genotypes. Moreover, SOD activity was higher during the winter, and MDA levels were lower in winter barley genotypes than in spring barley genotypes. This can be used to determine winter barley genotypes’ resistance to low temperatures [40]. Peroxidase activity increased in the winter genotypes under greenhouse conditions, as expected, compared with their control counterparts. According to recent studies, warm environmental conditions hinder the activities of SOD and POD. Furthermore, when subjected to a long period of low or vernalizing temperatures, the foliage of pepper (Capsicum annuum) seedlings showed increased POD activity [36,39]. This implies that lower levels of SOD may follow POD activity in correlation with environmental conditions and the reproductive phase transition. Our findings showed that phenological production interacts with the temperature, which affects the rate of antioxidant activity, in line with the study of [41]. Vernalization not only induces chilling tolerance in winter barley but also prompts an increased tolerance to low-temperature-instigated photoinhibition [42]. Our results showed that Pn had varying genotype-dependent responses, while Gs and Tr were inhibited by vernalization. In winter barley genotypes, Pn did not decline with vernalization, showing good tolerance of low temperatures, which was consistent with the survival rate. Delucia [43] reported a reduction in the photosynthetic rate along with Gs after 7 days at 0.7 °C in Engelmann spruce (Picea engelmannii) seedlings, which further validates the results acquired in this study. Similarly, Pn, Gs, and Tr declined in winter wheat varieties when compared against the control [44]. Hence, Gs and Tr may be associated with low temperatures or vernalization. As barley is a C3 plant, the photosynthetic capacity and stomatal conductance of barley are greatly influenced by greenhouse conditions, which could be attributed to stomatal closure.
The heading stage of barley is mainly regulated by vernalization and photoperiod pathway genes [45]. Exploring the effects of different temperatures on the expression levels of candidate genes in barley betokens the considerable impact of environmental signals in their regulation. Moreover, the acquired data showed that vernalization had a strong effect on the expression of HvVRN1 that was dependent on the genetic background of the genotypes. With autumn sowing, HvVRN1 and HvPHY-C were significantly expressed, affirming that HvVRN1 was the major gene controlling heading date. Correspondingly, Hemming et al. [46] observed an increase in HvVRN1 expression when barley plants were exposed to vernalization, usually in winter cultivars while shifting towards the reproductive stage. the upregulation of VRN1 in genotypes that are susceptible to vernalization is proportional to the period of cold exposure. Yan et al. [6] reported that VRN1 promoted flowering in barley by upregulating VRN3, which is a homolog of the Arabidopsis Flowering Locus T gene. The results also showed that HvPHY-C was highly expressed under field conditions and had a strong effect on photoperiod under vernalization conditions. Recent studies reported that the HvVRN1 locus is tightly linked with HvPHY-C, and both are located on chromosome 5H, plausibly interacting with each other while controlling the heading stage in barley [20]. Thus, the cooperation between these two genes needs to be further investigated by subsequent transgenic studies [14].
In the current study, expression analysis showed that winter genotypes required a longer time for heading compared with the spring types (Figure 4). With spring sowing, we identified the photoperiod gene HvPpd-H1, which is located on chromosome 2H, participates in controlling the heading date in barley [47]. RT-qPCR analysis showed that HvPpd-H1 and HvVRN1 were the main genes controlling the heading stage in barley. Plants use the photoperiod to regulate heading or flowering time as an environmental signal [48]. Our study showed that HvPpd-H1 is the major gene controlling the heading date in spring barley. Winter barley requires vernalization and shows a strong response of heading in response to photoperiod. On the other hand, spring barley has no vernalization requirements, showing weak or strong response to photoperiod depending on whether they had been selected for long or short growing seasons, respectively. Winter types are insensitive to vernalization and produce flowers later due to a prolonged exposure to cold. In general, plants tend to utilize vernalization at three growth phases: germination, the vegetative stage, or seed formation in mature plants [49]. Photoperiod genes play a key role in modulating cold temperatures, and are mainly generated when plants are exposed to high temperatures or experience prolonged exposure to a particular daylength [50]. A better understanding of HvPpd-H1 will provide a greater understanding of the ways in which barley heading is regulated by environmental cues, allowing plant breeders to tailor crops to specific environmental conditions and to adjust varieties to new conditions arising from climate change [15,51].

5. Conclusions

One of the main limitations for increasing barley production under extreme environmental conditions is an absence of elite varieties with an appropriate adaptive phenology. Addressing this limitation is difficult because novel genetic diversity has not yet been explored to identify valuable germplasm for heading date. Furthermore, the limited flowering time loci which are known and are present in domesticated germplasm are not well-characterized, which restricts their effective use and exploitation of their full potential. the current study supported the proposal that overall growth and photosynthesis were substantially reduced upon exposure to a vernalized environment compared with their control counterparts. A marked increase in lipid peroxidation at 4 °C was recorded in the DM65 and DM70 genotypes compared with their respective controls at 20 °C, while no significant difference was observed for any genotype grown in the greenhouse (25 °C). Simultaneously increased superoxide dismutase and peroxidase activities in winter barley genotypes portrayed a defensive mechanism under vernalized conditions. The main genes controlling the heading date of barley under the studied environmental conditions were HvVRN1 and HvPHY-C, while HvPpd-H1 was the key gene controlling the heading date under greenhouse conditions. Investigations conducted so far clearly show that heading date is a key developmental stage for improving yield and adaptation to the ever-fluctuating environmental cues.

Author Contributions

Conceptualization, supervision, and funding acquisition, I.H.S.; methodology, A.R., Q.F. and M.A.; formal analysis, A.R. and M.A.; writing—original draft preparation, A.R. and M.F.A.; writing—review and editing, I.H.S., Z.H. and F.Z. All authors have read and agreed to the published version of the manuscript.

Funding

This research work was financially supported by the Sino-Pakistan Project NSFC (Grant No. 31961143008), the National Natural Science Foundation of China, the International (Regional) Cooperation and Exchange Program, the Research Fund for International Young Scientists (Grant No. 31750110462), and the Jiangsu Collaborative Innovation Center for Modern Crop Production (JCIC-MCP), China.

Institutional Review Board Statement

Not applicable.

Informed Consent Statement

Not applicable.

Data Availability Statement

Not applicable.

Conflicts of Interest

The authors declare that they have no known competing financial interest or personal relationships that could have appeared to influence the work reported in this article.

Ethics Statement

This article does not contain any studies with human participants or animals per-formed by any of the authors.

References

  1. Chen, A.; Li, C.; Hu, W.; Lau, M.Y.; Lin, H.; Rockwell, N.C.; Martin, S.S.; Jernstedt, J.A.; Lagarias, J.C.; Dubcovsky, J. PHYTOCHROME C plays a major role in the acceleration of wheat flowering under long-day photoperiod. Proc. Natl. Acad. Sci. USA 2014, 111, 10037–10044. [Google Scholar] [CrossRef] [PubMed] [Green Version]
  2. Sehar, S.; Adil, M.F.; Zeeshan, M.; Holford, P.; Cao, F.; Wu, F.; Wang, Y. Mechanistic insights into potassium-conferred drought stress tolerance in cultivated and tibetan wild barley: Differential osmoregulation, nutrient retention, secondary metabolism and antioxidative defense capacity. Int. J. Mol. Sci. 2021, 22, 13100. [Google Scholar] [CrossRef]
  3. Shcherban, A.; Khlestkina, E.; Efremova, T.; Salina, E. The effect of two differentially expressed wheat VRN-B1 alleles on the heading time is associated with structural variation in the first intron. Genetica 2013, 141, 133–141. [Google Scholar] [CrossRef]
  4. Acevedo, E.; Silva, P.; Silva, H. Wheat growth and physiology. Bread Wheat Improv. Prod. 2002, 30, 39–70. [Google Scholar]
  5. Wigge, P.A.; Kim, M.C.; Jaeger, K.E.; Busch, W.; Schmid, M.; Lohmann, J.U.; Weigel, D. Integration of spatial and temporal information during floral induction in Arabidopsis. Science 2005, 309, 1056–1059. [Google Scholar] [CrossRef] [PubMed]
  6. Yan, L.; Fu, D.; Li, C.; Blechl, A.; Tranquilli, G.; Bonafede, M.; Sanchez, A.; Valarik, M.; Yasuda, S.; Dubcovsky, J. The wheat and barley vernalization gene VRN3 is an orthologue of FT. Proc. Natl. Acad. Sci. USA 2006, 103, 19581–19586. [Google Scholar] [CrossRef] [Green Version]
  7. Fu, D.; Szűcs, P.; Yan, L.; Helguera, M.; Skinner, J.S.; Von Zitzewitz, J.; Hayes, P.M.; Dubcovsky, J. Large deletions within the first intron in VRN-1 are associated with spring growth habit in barley and wheat. Mol. Genet. Genom. 2005, 273, 54–65. [Google Scholar] [CrossRef] [Green Version]
  8. Díaz, A.; Zikhali, M.; Turner, A.S.; Isaac, P.; Laurie, D.A. Copy number variation affecting the Photoperiod-B1 and Vernalization-A1 genes is associated with altered flowering time in wheat (Triticum aestivum). PLoS ONE 2012, 7, e33234. [Google Scholar] [CrossRef] [Green Version]
  9. Guedira, M.; Maloney, P.; Xiong, M.; Petersen, S.; Murphy, J.P.; Marshall, D.; Johnson, J.; Harrison, S.; Brown-Guedira, G. Vernalization duration requirement in soft winter wheat is associated with variation at the VRN-B1 locus. Crop Sci. 2014, 54, 1960–1971. [Google Scholar] [CrossRef]
  10. Snape, J.; Butterworth, K.; Whitechurch, E.; Worland, A. Waiting for fine times: Genetics of flowering time in wheat. In Wheat in a Global Environment; Springer: Berlin/Heidelberg, Germany, 2001; pp. 67–74. [Google Scholar]
  11. Turner, A.; Beales, J.; Faure, S.; Dunford, R.P.; Laurie, D.A. The pseudo-response regulator Ppd-H1 provides adaptation to photoperiod in barley. Science 2005, 310, 1031–1034. [Google Scholar] [CrossRef]
  12. Beales, J.; Turner, A.; Griffiths, S.; Snape, J.W.; Laurie, D.A. A pseudo-response regulator is misexpressed in the photoperiod insensitive Ppd-D1a mutant of wheat (Triticum aestivum L.). Theor. Appl. Genet. 2007, 115, 721–733. [Google Scholar] [CrossRef] [PubMed]
  13. Shaw, L.M.; Turner, A.S.; Laurie, D.A. The impact of photoperiod insensitive Ppd1a mutations on the photoperiod pathway across the three genomes of hexaploid wheat (Triticum aestivum). Plant J. 2012, 71, 71–84. [Google Scholar] [CrossRef]
  14. Alqudah, A.M.; Sharma, R.; Pasam, R.K.; Graner, A.; Kilian, B.; Schnurbusch, T. Genetic dissection of photoperiod response based on GWAS of pre-anthesis phase duration in spring barley. PLoS ONE 2014, 9, e113120. [Google Scholar] [CrossRef] [Green Version]
  15. Dyck, J.; Matus-Cádiz, M.; Hucl, P.; Talbert, L.; Hunt, T.; Dubuc, J.; Nass, H.; Clayton, G.; Dobb, J.; Quick, J. Agronomic performance of hard red spring wheat isolines sensitive and insensitive to photoperiod. Crop Sci. 2004, 44, 1976–1981. [Google Scholar] [CrossRef]
  16. Woods, D.P.; Ream, T.S.; Minevich, G.; Hobert, O.; Amasino, R.M. PHYTOCHROME C is an essential light receptor for photoperiodic flowering in the temperate grass, Brachypodium distachyon. Genetics 2014, 198, 397–408. [Google Scholar] [CrossRef] [PubMed] [Green Version]
  17. Möglich, A.; Yang, X.; Ayers, R.A.; Moffat, K. Structure and function of plant photoreceptors. Annu. Rev. Plant Biol. 2010, 61, 21–47. [Google Scholar] [CrossRef] [Green Version]
  18. Ruberti, I.; Sessa, G.; Ciolfi, A.; Possenti, M.; Carabelli, M.; Morelli, G. Plant adaptation to dynamically changing environment: The shade avoidance response. Biotechnol. Adv. 2012, 30, 1047–1058. [Google Scholar] [CrossRef]
  19. McClung, C.R. Plant circadian rhythms. Plant Cell 2006, 18, 792–803. [Google Scholar] [CrossRef] [PubMed] [Green Version]
  20. Pankin, A.; Campoli, C.; Dong, X.; Kilian, B.; Sharma, R.; Himmelbach, A.; Saini, R.; Davis, S.J.; Stein, N.; Schneeberger, K. Mapping-by-sequencing identifies HvPHYTOCHROME C as a candidate gene for the early maturity 5 locus modulating the circadian clock and photoperiodic flowering in barley. Genetics 2014, 198, 383–396. [Google Scholar] [CrossRef] [Green Version]
  21. Somers, D.E.; Devlin, P.F.; Kay, S.A. Phytochromes and cryptochromes in the entrainment of the Arabidopsis circadian clock. Science 1998, 282, 1488–1490. [Google Scholar] [CrossRef] [Green Version]
  22. Suárez-López, P.; Wheatley, K.; Robson, F.; Onouchi, H.; Valverde, F.; Coupland, G. CONSTANS mediates between the circadian clock and the control of flowering in Arabidopsis. Nature 2001, 410, 1116–1120. [Google Scholar] [CrossRef]
  23. Trevaskis, B.; Hemming, M.N.; Dennis, E.S.; Peacock, W.J. The molecular basis of vernalization-induced flowering in cereals. Trends Plant Sci. 2007, 12, 352–357. [Google Scholar] [CrossRef] [PubMed]
  24. Szűcs, P.; Karsai, I.; Von Zitzewitz, J.; Mészáros, K.; Cooper, L.; Gu, Y.; Chen, T.; Hayes, P.; Skinner, J. Positional relationships between photoperiod response QTL and photoreceptor and vernalization genes in barley. Theor. Appl. Genet. 2006, 112, 1277–1285. [Google Scholar] [CrossRef] [PubMed]
  25. Wu, F.B.; Zhang, G.P.; Dominy, P. Four barley genotypes respond differently to cadmium: Lipid peroxidation and activities of antioxidant capacity. Environ. Exp. Bot. 2003, 50, 67–78. [Google Scholar] [CrossRef]
  26. Zhang, H.Y.; Jiang, Y.N.; He, Z.Y.; Ma, M. Cadmium accumulation and oxidative stress burst in garlic (Allium sativum). J. Plant Physiol. 2005, 162, 977–984. [Google Scholar] [CrossRef] [PubMed]
  27. Schmittgen, T.D.; Livak, K.J. Analyzing real-time PCR data by the comparative C T method. Nat. Protoc. 2008, 3, 1101. [Google Scholar] [CrossRef] [PubMed]
  28. Chen, C.; Chen, H.; Zhang, Y.; Thomas, H.R.; Frank, M.H.; He, Y.; Xia, R. TBtools: An integrative toolkit developed for interactive analyses of big biological data. Mol. Plant. 2020, 13, 1194–1202. [Google Scholar] [CrossRef]
  29. Hotta, Y.; Tanaka, T.; Takaoka, H.; Takeuchi, Y.; Konnai, M. New physiological effects of 5-aminolevulinic acid in plants: The increase of photosynthesis, chlorophyll content, and plant growth. Biosci. Biotechnol. Biochem. 1997, 61, 2025–2028. [Google Scholar] [CrossRef]
  30. Adil, M.F.; Sehar, S.; Han, Z.; Lwalaba, L.J.; Jillani, G.; Zeng, F.; Chen, Z.; Shamsi, I.H. Zinc alleviates cadmium toxicity by modulating photosynthesis, ROS homeostasis, and cation flux kinetics in rice. Environ. Pollut. 2020, 265 Pt B, 115979. [Google Scholar] [CrossRef]
  31. Mitra, R.; Bhatia, C.R. Bioenergetic cost of heat tolerance in wheat crop. Curr. Sci. 2008, 54, 1049–1053. [Google Scholar]
  32. Koini, M.A.; Alvey, L.; Allen, T.; Tilley, C.A.; Harberd, N.P.; Whitelam, G.C.; Franklin, K.A. High temperature-mediated adaptations in plant architecture require the bHLH transcription factor PIF4. Curr. Biol. 2009, 19, 408–413. [Google Scholar] [CrossRef] [Green Version]
  33. Quint, M.; Delker, C.; Franklin, K.A.; Wigge, P.A.; Halliday, K.J.; Zanten, M.V. Molecular and genetic control of plant thermomorphogenesis. Nat. Plants 2016, 2, 15190. [Google Scholar] [CrossRef] [PubMed] [Green Version]
  34. Nahar, N.; Sultana, R.; Gurley, E.S.; Hossain, M.J.; Luby, S.P. Date palm sap collection: Exploring opportunities to prevent Nipah transmission. EcoHealth 2010, 7, 196–203. [Google Scholar] [CrossRef] [PubMed]
  35. Verma, S.; Mishra, S.N. Putrescine alleviation of growth in salt stressed Brassica juncea by inducing antioxidative defense system. J. Plant Physiol. 2005, 162, 669–677. [Google Scholar] [CrossRef] [PubMed]
  36. Kolupaev, Y.; Ryabchun, N.; Vayner, A.; Yastreb, T.; Oboznyi, A. Antioxidant enzyme activity and osmolyte content in winter cereal seedlings under hardening and cryostress. Russ. J. Plant Physiol. 2015, 62, 499–506. [Google Scholar] [CrossRef]
  37. Baek, K.H.; Skinner, D.Z. Production of reactive oxygen species by freezing stress and the protective roles of antioxidant enzymes in plants. J. Agric. Chem. Environ. 2012, 1, 34–40. [Google Scholar] [CrossRef]
  38. Baek, K.H.; Skinner, D.Z. Differential expression of manganese superoxide dismutase sequence variants in near isogenic lines of wheat during cold acclimation. Plant Cell Rep. 2006, 25, 223–230. [Google Scholar] [CrossRef]
  39. Lukatkin, A.S. Contribution of oxidative stress to the development of cold-induced damage to leaves of chilling-sensitive plants: 1. Reactive oxygen species formation during plant chilling. Russ. J. Plant Physiol. 2002, 49, 622–627. [Google Scholar] [CrossRef]
  40. Dai, F.; Huang, Y.; Zhou, M.; Zhang, G.P. The influence of cold acclimation on antioxidative enzymes and antioxidants in sensitive and tolerant barley cultivars. Biol. Plant. 2009, 53, 257–262. [Google Scholar] [CrossRef]
  41. Janmohammadi, M.; Enayati, V.; Sabaghnia, N. Impact of cold acclimation, de-acclimation and re-acclimation on carbohydrate content and antioxidant enzyme activities in spring and winter wheat. Icel. Agric. Sci. 2021, 25, 3–11. [Google Scholar]
  42. Oquist, G.; Hurry, V.M.; Huner, N.P.A. Low-temperature effects on photosynthesis and correlation with freezing tolerance in spring and winter cultivars of wheat and rye. Plant Physiol. 1993, 101, 245–250. [Google Scholar] [CrossRef] [Green Version]
  43. Delucia, E.H. The effect of freezing nights on photosynthesis, stomatal conductance, and internal CO2 concentration in seedlings of Engelmann spruce (Picea engelmannii Parry). Plant Cell Environ. 1987, 10, 333–338. [Google Scholar] [CrossRef]
  44. Zhu, X.G.; Long, S.P.; Ort, D.R. Improving photosynthetic efficiency for greater yield. Annu. Rev. Plant Biol. 2010, 61, 235–261. [Google Scholar] [CrossRef] [Green Version]
  45. Nishida, H.; Yoshida, T.; Kawakami, K.; Fujita, M.; Long, B.; Akashi, Y.; Laurie, D.A.; Kato, K. Structural variation in the 5′ upstream region of photoperiod-insensitive alleles Ppd-A1a and Ppd-B1a identified in hexaploid wheat (Triticum aestivum L.), and their effect on heading time. Mol. Breed. 2013, 31, 27–37. [Google Scholar] [CrossRef]
  46. Hemming, M.N.; Fieg, S.; Peacock, W.J.; Dennis, E.S.; Trevaskis, B. Regions associated with repression of the barley (Hordeum vulgare) VERNALIZATION1 gene are not required for cold induction. Mol. Genet. Genom. 2009, 282, 107–117. [Google Scholar] [CrossRef]
  47. Wilhelm, E.P.; Turner, A.S.; Laurie, D.A. Photoperiod insensitive Ppd-A1a mutations in tetraploid wheat (Triticum durum Desf.). Theor. Appl. Genet. 2009, 118, 285–294. [Google Scholar] [CrossRef] [PubMed]
  48. Adrian, J.; Farrona, S.; Reimer, J.J.; Albani, M.C.; Coupland, G.; Turck, F. cis-Regulatory elements and chromatin state coordinately control temporal and spatial expression of FLOWERING LOCUS T in Arabidopsis. Plant Cell 2010, 22, 1425–1440. [Google Scholar] [CrossRef] [PubMed] [Green Version]
  49. Flood, R.G.; Halloran, G. Genetics and physiology of vernalization response in wheat. In Advances in Agronomy; Elsevier: Amsterdam, The Netherlands, 1986; pp. 87–125. [Google Scholar]
  50. D’Ottone Di Lorenzo, F. Calibración y Validación del Modelo CropSyst para un Cultivar de Trigo para las Condiciones de Producción del Litoral-Oeste de Uruguay. Diploma Thesis, Universidad de la República, Montevideo, Uruguay, 2011. [Google Scholar]
  51. Thomas, B.; Vince-Prue, D. Photoperiodism in Plants; Academic Press: New York, NY, USA, 1997; pp. 1–26. [Google Scholar]
Figure 1. Effect of different environments on the growth parameters of four barley genotypes (n = 5). (A) Shoot height, (B) root length, (C) shoot fresh weight, (D) root fresh weight, (E) shoot dry weight, and (F) root dry weight. Vertical bars correspond to means ± SE. Different letters indicate statistically significant difference at p ≤ 0.05 within the genotypes and among the treatments. Legends: control (CK), vernalization (V), greenhouse (GH), and moved from vernalization to the greenhouse (V + GH).
Agronomy 12 00339 g001
Figure 2. Effects of vernalized and greenhouse environments on the physiology of four barely genotypes (n = 5). (A) Net photosynthesis rate (Pn), (B) stomatal conductance (Gs), and (C) transpiration rate (Tr). Legends: control (CK), vernalization (V), greenhouse (GH), and moved from vernalization to the greenhouse (V + GH). Vertical bars correspond to means ± SE. Different letters indicate a significant difference at p ≤ 0.05 within the genotypes and among the treatments.
Agronomy 12 00339 g002
Figure 3. Effect of vernalized and greenhouse environments on the ROS scavenging enzymatic activities of four barely genotypes (n = 5). (A) Superoxide dismutase activity, (B) peroxidase activity, and (C) malondialdehyde content. Legends: control (CK), vernalization (V), greenhouse (GH), and moved from vernalization to the greenhouse (V + GH). Vertical bars correspond to means ± SE. Different letters indicate significant differences at p ≤ 0.05 within the genotypes and among the treatments.
Agronomy 12 00339 g003
Figure 4. Heat map representing the relative expression of candidate genes involved in barley heading date (n = 5). (A) HvPPD-H1, (B) HvPHY-C, and (C) HvVRN1. Legends: control (CK), vernalization (V), greenhouse (GH), and moved to the greenhouse post-vernalization (V + GH). The gene expression intensity spanned from low (blue) to high (red). The expression values have been calculated as fold changes.
Agronomy 12 00339 g004
Table 1. List of primer sequences used in this study.
Gene NameGenBank IDPrimer Pair Sequence (5′ to 3′)Length (bp)PCR Product (bp)
HvActinAY145451AGGCCCCTTTGAACCCAAAA2088
ATAGCGACGTACATGGCAGG20
HvVRN1AY750995.1CTTCACCAACAACTTGGGCG20124
CGTGGTGCTGGTGACAGTAT20
HvPHY-CABB13327.1AGCCAGAAGCTCGTGAAGAC20143
TTCGACCACTTGCTCGTC18
HvPpd-H1ACL78688.1TGAAGGTCATGCTGCCAACT20149
GCTCCCGTTTCATGTGCATC20
Publisher’s Note: MDPI stays neutral with regard to jurisdictional claims in published maps and institutional affiliations.

