Article

An Integrated Yield-Based Methodology for Improving Soil Nutrient Management at a Regional Scale

1
Key Laboratory of Soil Environment and Pollution Remediation, Institute of Soil Science, Chinese Academy of Sciences, Nanjing 210008, China
2
State Key Laboratory of Soil and Sustainable Agriculture, Institute of Soil Science, Chinese Academy of Sciences, Nanjing 210008, China
*
Author to whom correspondence should be addressed.
Agronomy 2022, 12(2), 298; https://doi.org/10.3390/agronomy12020298
Submission received: 9 December 2021 / Revised: 3 January 2022 / Accepted: 5 January 2022 / Published: 25 January 2022
(This article belongs to the Special Issue Soil Sustainability in the Anthropocene)

Abstract

:
The relationships between crop yield and its selected related impact factors has often been explored using ordinary least squares regression (OLSR). However, this model is non-spatial and non-robust. This study first used stepwise regression to identify the main factors affecting winter wheat yield from twelve potential related factors in Yucheng County, China. Next, robust geographically weighted regression (RGWR) was used to explore the spatially non-stationary relationships between wheat yield and its main impact factors. Then, its modeling effect was compared with that of GWR and OLSR. Last, robust geostatistical analysis was conducted for spatial soil management measures in low-yield areas. Results showed that: (i) three main impact factors on wheat yield were identified by stepwise regression, namely soil organic matter, soil total phosphorus, and pH; (ii) the spatially non-stationary effects of the main impact factors on wheat yield were revealed by RGWR but were ignored by OLSR; (iii) RGWR obtained the best modeling effect (RI = 52.31%); (iv) robust geostatistics obtains a better spatial prediction effect and the low-yield areas are mainly located in the northeast and the middle east of the study area. Therefore, the integrated yield-based methodology effectively improves soil nutrient management at a regional scale.

1. Introduction

With a growing human population [1], global food demand will double by 2050 [2]. In China, 30% to 50% more food will be needed to meet the country’s demands in the next two to three decades [3]. Therefore, the Chinese Government has taken drastic steps to increase food production to feed its 1.3 billion people [4]. Wheat is a staple food in China, and increasing wheat yield per unit area is crucial to ensuring the country’s food supply.
Wheat yield may be influenced by many factors, such as soil physical and chemical properties, climate, irrigation, tillage, and so on [5,6,7,8,9,10,11,12]. Since the influence degree of environmental factors in each agricultural area is not identical, the main limiting factors for crop yield are usually different. For example, in an agricultural areas rich in a certain soil nutrient, this nutrient is often not the key limiting factor for crop growth and development. However, in the areas with severe deficiency of this nutrient, the application of this fertilizer can often significantly increase crop yield. Therefore, it is crucial to determine the main impact factors on wheat yields. Stepwise regression could choose explanatory variables using an automatic procedure [13]. A variable is added to or subtracted from the explanatory variable set based on some prespecified criterion in each step. Stepwise regression is a potential tool for identifying the main impact factors on wheat yield in this study.
In previous studies, global regression techniques, such as ordinary least squares regression (OLSR), were usually used to explore the relationships between crop yield and its related impact factors [14,15,16]. However, these models are non-spatial; that is to say, spatial coordinates were not considered in regression coefficient estimation, and thus only constant regression coefficients could be obtained. However, the strength or concentration of soil physicochemical properties varies with spatial position, so their effects on crop yield are not constant. Therefore, global relationships obtained by the non-spatial models (e.g., OLSR) may deviate considerably from those observed locally, providing only an average impression of the relationships over an entire region [17,18].
Geographically weighted regression (GWR) is a spatially local regression technology [19]. This model takes the spatial coordinates into the coefficient estimation, permitting the coefficients to vary with spatial position. However, the locally linear estimation of GWR also causes this technology to be sensitive to outliers [20,21]. With the strengthening of human activities, spatial outliers commonly exist in the geochemical data sets measured at a regional scale. These outliers may further affect the performance of OLSR and basic GWR for exploring the relationships between wheat yield and its main impact factors [20,21,22,23]. In recent years, a robust local regression model, robust geographically weighted regression (RGWR), has emerged [24]. In theory, RGWR may be an effective tool for exploring the spatially non-stationary influences of main impact factors on wheat yield at a regional scale.
In addition, determining the spatial distribution pattern of wheat yield is a prerequisite for precisely managing the soil nutrients in low-yield areas. Geostatistical models can greatly minimize the estimation errors and investigation costs [25,26]. However, the traditionally-used Matheron variogram is sensitive to outliers, which may further affect the spatial prediction accuracy of wheat yield. Therefore, it is necessary to establish robust statistics in the spatial prediction of environmental factors in the area with high-intensity human influence.
The main objectives of this study are to: (i) identify the main impact factors on winter wheat yield in Yucheng County, China, using stepwise regression; (ii) establish RGWR for exploring spatially non-stationary relationships between wheat yield and its related main impact factors; (iii) compare the performance of RGWR, GWR, and OLSR in modeling the relationships; (iv) conduct robust geostatistical analysis and further suggest some spatially precise soil management measures in the low-yield areas of the county.

2. Materials and Methods

2.1. Study Area and Data

Yucheng County (116°22′~116°45′ E, 36°40′~37°12′ N) is located in the northwest of Shandong Province, with an area of 990 km2 (Figure 1). This county belongs to the North China Plain and has a better irrigation and drainage system. The cultivated land covers 683 km2, accounting for 69% of the total land area in the county [27]. The annual average temperature and precipitation are 13.1 °C and 593.2 mm, respectively. The Yellow River runs through the county. Winter wheat (Triticum aestivum L.) is one of the most important crops in the County. Climate, topography, and agronomic measures for winter wheat are similar across the county. Main soil subgroups in this county are Calcaric-Endorusti-Ustic Cambosols (Fluvisols), Calaric-Ochri-Aquic Cambosols (Fluvic Cambisols), Parasalic-Ochric-Aquic Cambosols (Calcaric Fluvisols) and Typic-Aqui-Orthic Halosols (Calcaric-Fluvic Cambisols) [28,29].

2.2. Determination of the Main Limiting Factors

In this study area, the main limiting factors on winter wheat yield were identified using stepwise regression from twelve potential related soil factors, namely soil pH, cation exchange capacity (CEC), soil organic matter (SOM), total nitrogen (TN), total phosphorus (TP), total potassium (TK), available boron, copper, iron, zinc, molybdenum, and manganese.

2.3. Soil Sampling and Chemical Analysis

Ninety-nine pairs of wheat grains and surface soils (0~20 cm depth) were collected in June 2012 (Figure 1). The wheat genotype in the study area was mainly the Ji-Mai-22. The sampling locations were randomly arranged throughout the study area, and their coordinate information was recorded using a handheld GPS receiver (MAP60CSX, Garmin Ltd., Lenexa, KS, USA). The wheat and the corresponding surface soil were collected from the same location. Each sample comprised four subsamples within a distance of 10 m surrounding a specific sampling location. For wheat sampling, one square meter of wheat was collected at each subsample location and was sent to the lab for drying, threshing, weighing, and finally calculating the wheat yield.
All soil samples were air-dried at room temperature (20~22 °C). After removing stones and other debris, soil samples were sieved into soil particles less than 2 mm. A portion of each soil sample (about 50 g) was then ground to pass through a sieve of 1/100 mm meshes. Standard methods were adopted to measure the following 12 soil properties: pH (glass pH electrodes method), CEC (ammonium acetate method), SOM (potassium dichromate-wet combustion method), TN (Kjeldahl method with H2SO4 + H2O2 digestion), TP (acid digestion and colorimetry method), TK (acid digestion and atomic absorption spectroscopy method), available boron (hot water extraction and colorimetry method), and available copper, iron, zinc, molybdenum, and manganese (diethylentriaminepentaacetic acid and atomic absorption spectroscopy method) [30]. Quality control was based on the certified samples (GBW 07413) and analysis duplicates.

2.4. Robust Geostatistics

Kriging is expressed as the weighted sums of the adjacent sample points by taking into account the spatial dependence of the sample data. Variogram describes the spatial correlation structure of a continuous variable. In the kriging system, variogram is calculated as [31]:
γ i , i ( h ) = 1 2 E { [ z i ( u ) z i ( u + h ) ] 2 } ,
where E { · } is the expectation value of the sample data in brackets; z i ( u ) is the target variable z i at location u; h is the separation distance vector. Matheron’s estimator is the most widely used estimator for the variogram [32]. However, this estimator is sensitive to outliers [33,34,35]. In this study, three robust variogram estimators were first used, namely the Cressie-Hawkins estimator [33], Dowd’s estimator [36], and Genton’s estimator [37]. Then, standardized square prediction error (SSPE) at each sampling site were calculated [38]:
S S P E ( u ) = { z * ( u ) z ( u ) } 2 σ 2 ( u ) ,
where z * ( u ) and σ 2 ( u ) are kriging estimate and kriging variance, respectively, at location u. The expectation of the median value of SSPE is 0.455. The optimal variogram estimator corresponds to the one with the median value of SSPE closest to 0.455 [38]. In this study, the robust ordinary kriging z R O K * ( u ) is written:
z R O K * ( u ) = α = 1 n λ α ( u ) z ( u α ) ,
subject to:
α = 1 n λ α ( u ) = 1 ,
where λ α is the weight of the αth sample in the search radius used for kriging calculation. For detailed descriptions of ROK, please refer to the related literature [38].

2.5. Robust Geographically Weighted Regression

Traditional global regression techniques, such as ordinary least squares regression (OLSR), assume that the relationships between the dependent variable (i.e., wheat yield) and its explanatory variables (i.e., main related soil factors) are constant throughout the study area. OLSR model is expressed as [20]:
y = β 0 + i = 1 p β i x i + ε ,
where y , x i , and ε represent the wheat yield, the ith related soil factor, and the Gaussian error term, respectively; β 0 and β i represent the model intercept and the regression coefficient for the ith related soil factor x i , respectively; and p is the number of the main related soil factors in the OLSR model. This type of regression model is non-spatial; that is to say, spatial coordinates are not considered in estimating regression parameters.
Geographically weighted regression (GWR) takes the spatial locations of samples into the estimation of regression coefficients, permitting the coefficients to vary spatially. The GWR model is expressed as [20,39]:
y ( μ , v ) = β 0 ( μ , v ) + i = 1 p β i ( μ , v ) x i ( μ , v ) + ε ( μ , ν ) ,
where y ( μ , v ) , x i ( μ , v ) , and ε ( μ , ν ) represent wheat yield, the ith main soil factor, and the Gaussian error term, respectively, at the location ( μ , ν ) ; β 0 ( μ , v ) and β i ( μ , v ) represent the intercept and the local regression coefficient for the ith main soil factor, respectively, at the location ( μ , ν ) . The vector of estimated regression coefficients at the location ( μ , ν ) is calculated by:
β ^ ( μ , v ) = [ X T W ( μ , v ) X ] 1 X T W ( μ , v ) Y ,
where X is an [m × (p + 1)] data matrix of main related soil factors with p being the number of the main related soil factors and m being the number of observed data at the regression point ( μ , ν ) ; Y is an (m × 1) data vector of the wheat yield; W ( u , v ) is an (m × m) local weights diagonal matrix which is calculated from a kernel function that places more weights on samples spatially closer to the calibration location [20]. As the sample density varies with spatial position, the adaptive bi-square kernel function was adopted for weight estimation. The optimal adaptive bandwidth was determined based on the corrected Akaike information criterion (AICc) [20]. Thirty-five surrounding points (i.e., optimal adaptive bandwidth) were finally used to calibrate the basic GWR model at each location.
Since outliers are widely present in geochemical datasets, robust geographically weighted regression (RGWR) borrowed from the robust multiple linear regression paradigm was used to reduce the influences of outliers on the estimation of local regression coefficients. This technology is to refit a basic GWR with a filtered dataset by removing sample data with large externally studentized residuals of an initial GWR fit [20,21]. Details about the RGWR model were described in Fotheringham et al. [20] and Harris et al. [21].

2.6. Model Validation

In order to evaluate the modeling effects of the regression models (i.e., RGWR, GWR, and OLSR), the regression residuals (n = 99) were analyzed. Traditionally, two indices are often used to evaluate modeling effects based on predicted and measured values, namely mean absolute error (MAE) and root-mean-square error (RMSE). The two indices can be calculated using the following equations:
M A E = 1 n i = 1 n | z i z i * |
R M S E = 1 n i = 1 n ( z i z i * ) 2 ,
where n is the number of validation points; z i and z i * are the measured and predicted wheat yield, respectively, at the ith validation site. Lower MAE and RMSE values indicate higher prediction accuracy.
However, the above indices are susceptible to outliers. High outliers usually make MAE and RMSE overestimated, which in turn affects the assessment results. In order to weaken the influence of outliers on model validation, this study used the median rather than the mean in the validation indices. When MAE and RMSE are calculated using the idea of the median, both indices are transformed into median absolute error (MAE*):
M A E * = M e d i a n { | z i z i * | | 1 i 99 } .
The relative improvement (RI) of one model over the other is calculated using [40]:
R I = M A E R * M A E E * M A E R * ,
where M A E R * and M A E E * are the M A E * of the reference and evaluated models, respectively.
In this study, OLSR, GWR, and RGWR were performed on the “GWmodel” packages [20] in R 3.3.3 software (R Development Core Team); robust variograms were fitted on the “Georob” package [41] in R 3.3.3 software (R Development Core Team); ArcGIS (version 10.0) was used for producing maps.

3. Results

3.1. Wheat Yield and Its Main Impact Factor

Stepwise regression analysis was used to identify the main impact factors on wheat yield in Yucheng County. Three optimal explanatory variables (i.e., SOM, TP, and pH) were identified from the 12 soil properties (i.e., SOM, pH, CEC, TN, TP, TK, and available boron, copper, iron, zinc, molybdenum and manganese). The stepwise regression model is given as follows:
Y Y i e l d = 11.939 + 0.065 × X S O M + 0.572 × X T P 0.839 × X p H   ( R 2 = 0.58 ) .
In this model, the spatial coordinate was not considered [42]. The relationships derived from the global model provided only average influences on wheat yield over the entire region.
Descriptive statistics of sample data for wheat yield and its three main impact factors (i.e., SOM, soil TP, and soil pH) are listed in Table 1. The soil samples in the whole study area are alkaline. The mean of soil pH is 8.56 in the study area. Such an alkaline soil environment may weaken the transformation ability of soil nutrients from fixed forms to available forms directly or indirectly [43,44]. The coefficients of variation (CVs) of soil SOM, TP, and wheat yield range from 15.12–38.49%, showing moderate variability for these indicators [45].

3.2. Global Influences of the Main Related Factors on Wheat Yield

Pearson’s correlation coefficients (r) between wheat yield and its main related factors are shown in Table 2. Wheat yield is negatively correlated with soil pH (r = −0.56) and positively correlated with SOM (r = 0.71) and TP (r = 0.62). The correlation between the three indicators (i.e., SOM, TP, and pH) is weak (Table 2). Therefore, SOM, TP, and soil pH all strongly influence wheat yield. However, since the traditional correlation analysis does not consider spatial coordinates, the above results can only reflect the global rather than local effects.

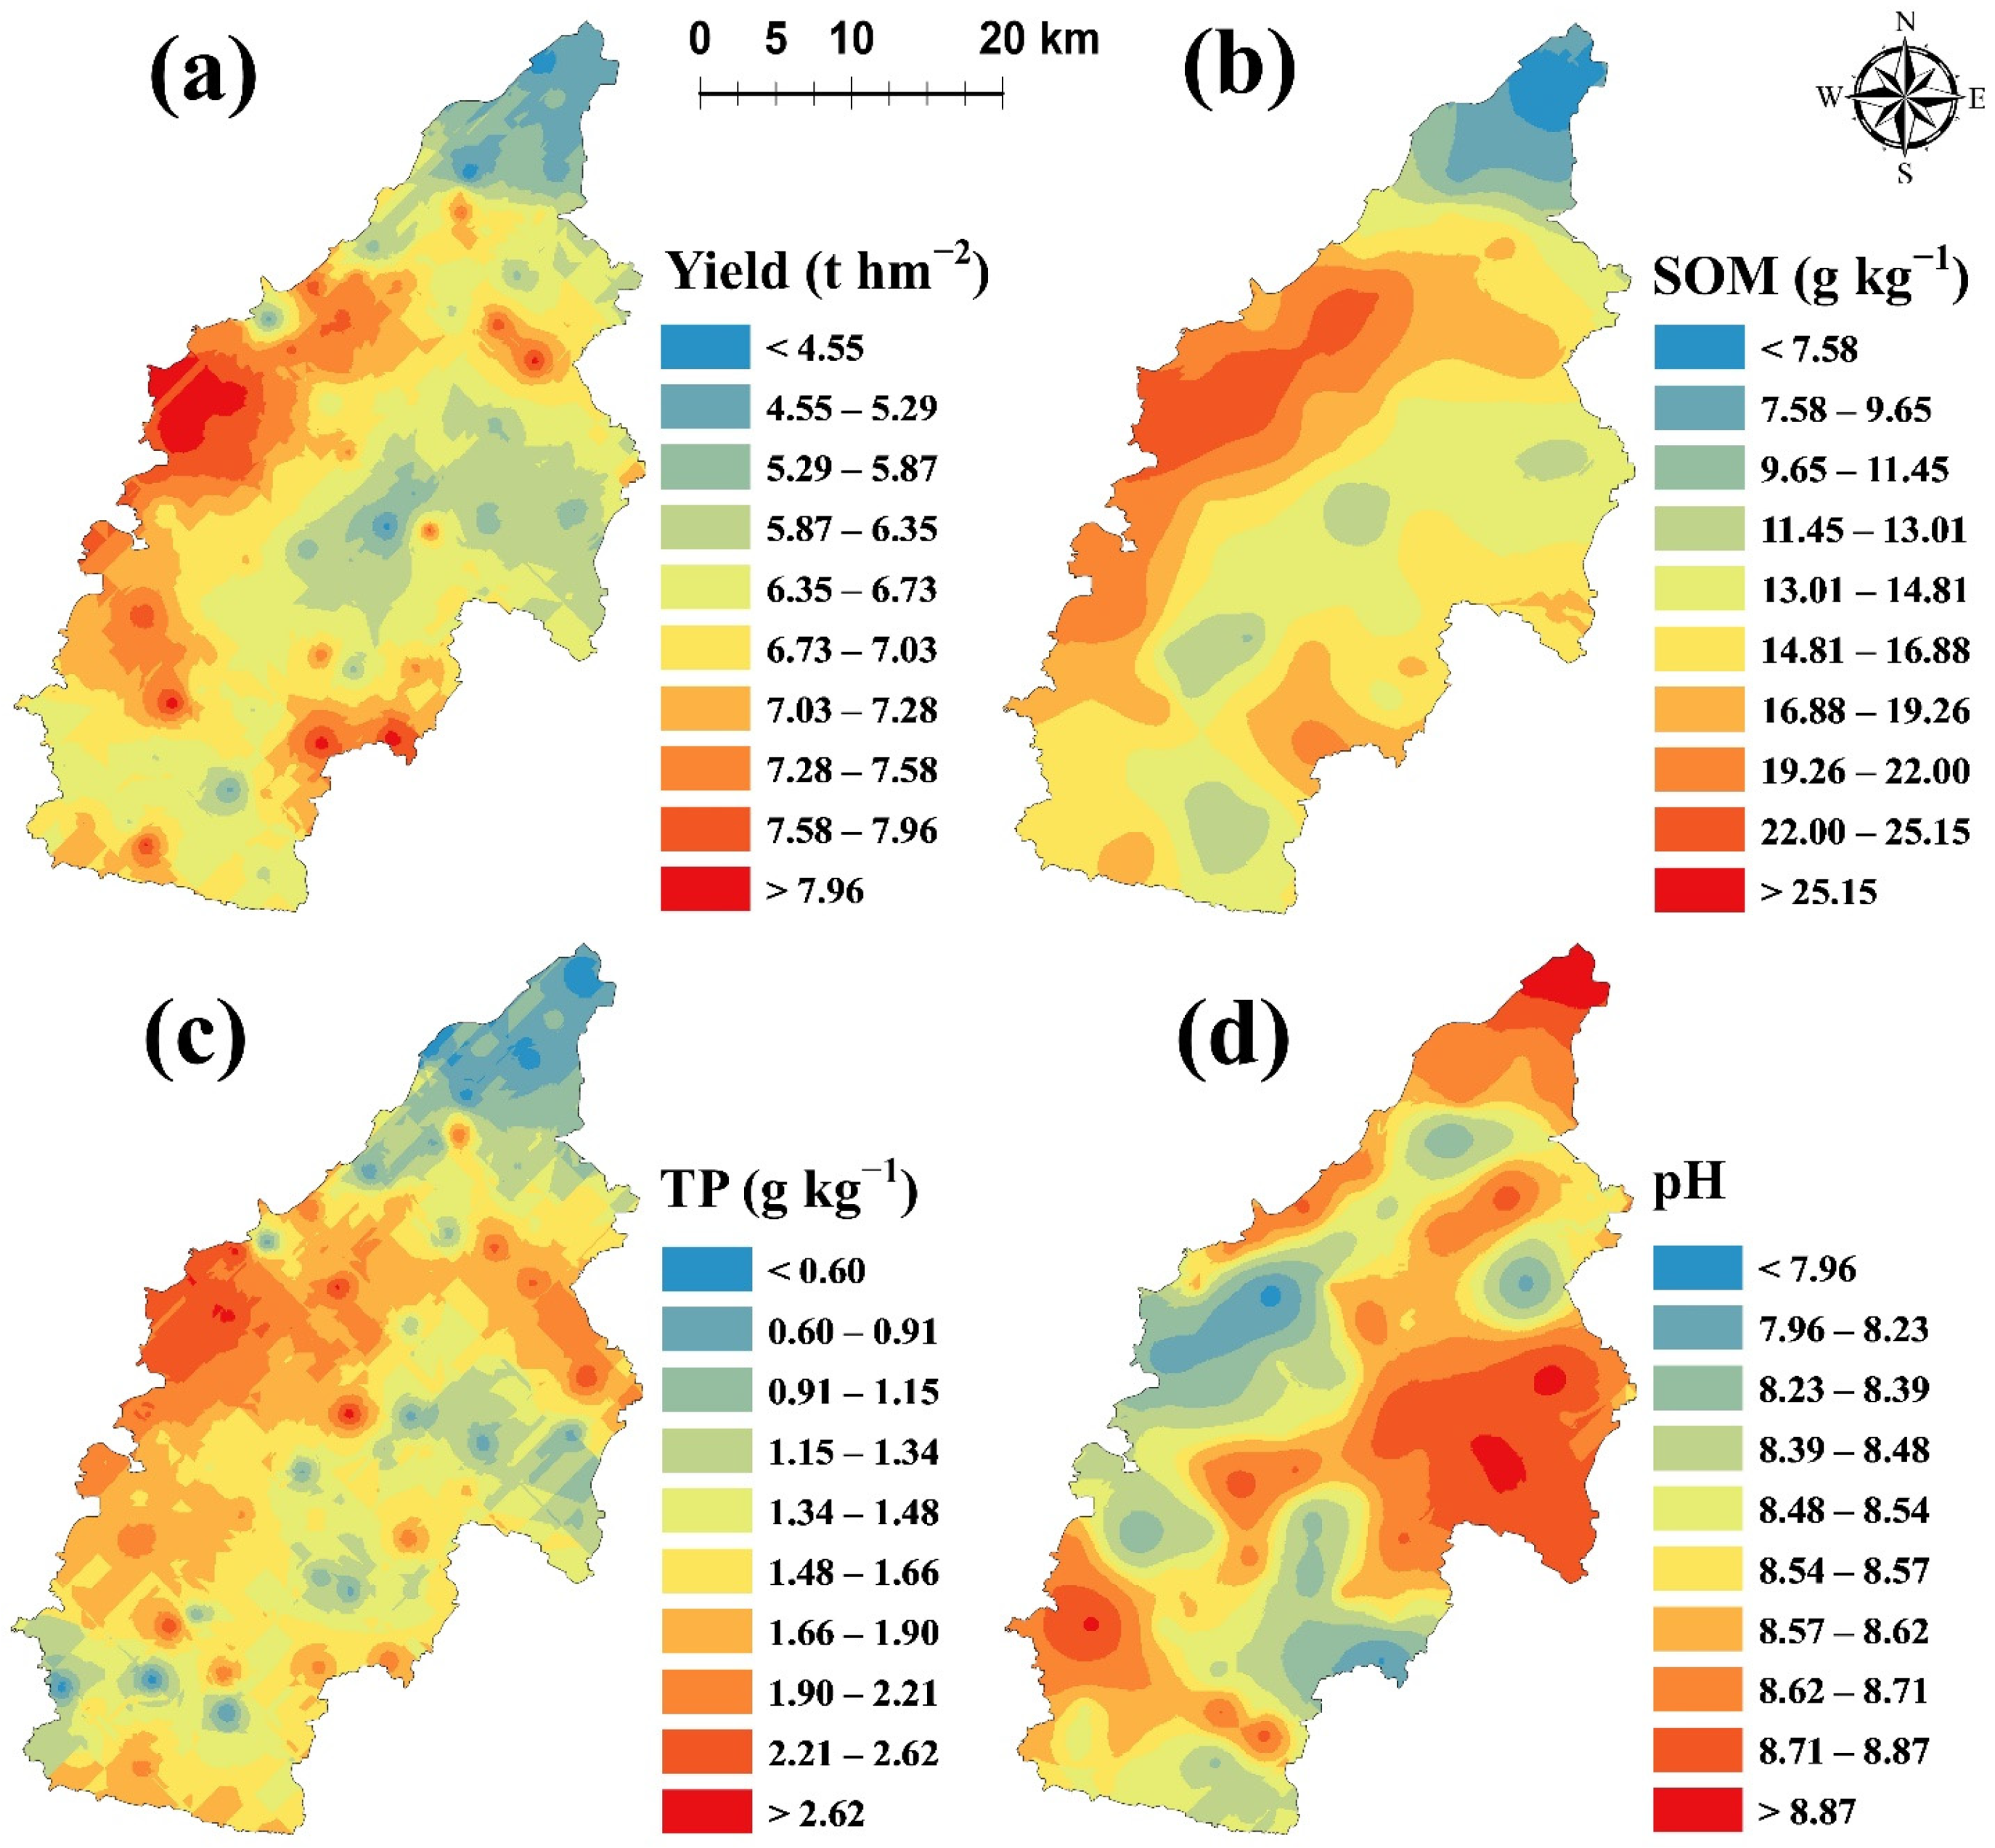
3.3. Robust Geostatistical Analysis of Wheat Yield and the Main Related Factors

The medians of the SSPE obtained by leave-one-out cross-validation are presented in Table 3. The medians of SSPE corresponding to the traditional Matheron estimator deviated the farthest from 0.455. The main reason is that the traditional Matheron estimator is sensitive to outliers. The optimal estimators were the Dowd estimator for wheat yield and SOM and Genton estimators for soil TP and pH. Therefore, the above robust estimators rather than the traditionally-used Matheron estimator were adopted in this study.
There was no apparent anisotropy for wheat yield, SOM, soil TP and pH. Therefore, all robust variograms were fitted omnidirectionally. Parameters of the optimal robust variogram are shown in Table 4. Except that the experimental variogram corresponding to wheat yield is fitted by the spherical model, the experimental variograms corresponding to the others are fitted by the exponential model. The nugget/sill ratios range from 19.79% to 31.58%, showing moderate spatial self-dependency for all four indicators [41].
The spatial distribution maps of wheat yield and its main impact factors generated by ROK are presented in Figure 2. High-yield areas are mainly concentrated in the west and southeast of the study area, and low-yield areas are mainly located in the northeast of the study area. It can be seen from Figure 2 that multiple factors jointly affected the wheat yield in the study area. The low-yield areas in the northeast also have lower SOM, TP, and stronger soil alkalinity; high-yield areas in the west also have higher SOM, TP, and weaker soil alkalinity. However, only a qualitative effect of these soil factors on wheat yield can be obtained from Figure 2. Therefore, it is necessary to explore further the spatially non-stationary influences of main related factors on winter wheat yield.

3.4. Model Validation for RGWR

Validation indices for OLSR, GWR and RGWR are shown in Table 5. RGWR produced the best modeling effect (MAE* = 0.5), and OLSR produced the worst modeling effect (MAE* = 1.04). Relative improvement accuracy over OLSR was 52.31% for RGWR and 34.1% for GWR. Therefore, RGWR performed better than GWR and OLSR for modeling the relationships between wheat yield and its related impact factors (i.e., SOM, soil TP, and soil pH). Therefore, RGWR could effectively reveal the spatially non-stationary influences of main related factors on winter wheat yield in this study.

3.5. Spatially Non-Stationary Relationships between Wheat Yield and Its Main Impact Factors

Local regression coefficients (i.e., intercepts, slopes) generated by RGWR analysis of wheat yield against its main impact factors are presented in Figure 3. The spatially non-stationary relationship maps of wheat yield vs. its main impact factors could be used to explain the local causes of low wheat yield in the study area. The relationships between wheat yield and its three related soil factors were spatially non-stationary (Figure 3); that is to say, the regression coefficients vary with spatial position. Their corresponding local regression coefficients explain the influences of SOM, soil TP, and soil pH on wheat yield. In general, positive regression coefficients represent the positive influence on wheat yield, and negative regression coefficients represent the negative influence on wheat yield. Therefore, the measures such as reducing soil alkalinity and increasing soil SOM and TP levels should be conducted for increasing wheat yield in this county. The influence strength of the related impact factors on wheat yield varies with spatial location. The areas with the strongest impact were mainly located in the southeast, east, and west of the study area. The results are crucial information for improving soil nutrient management.

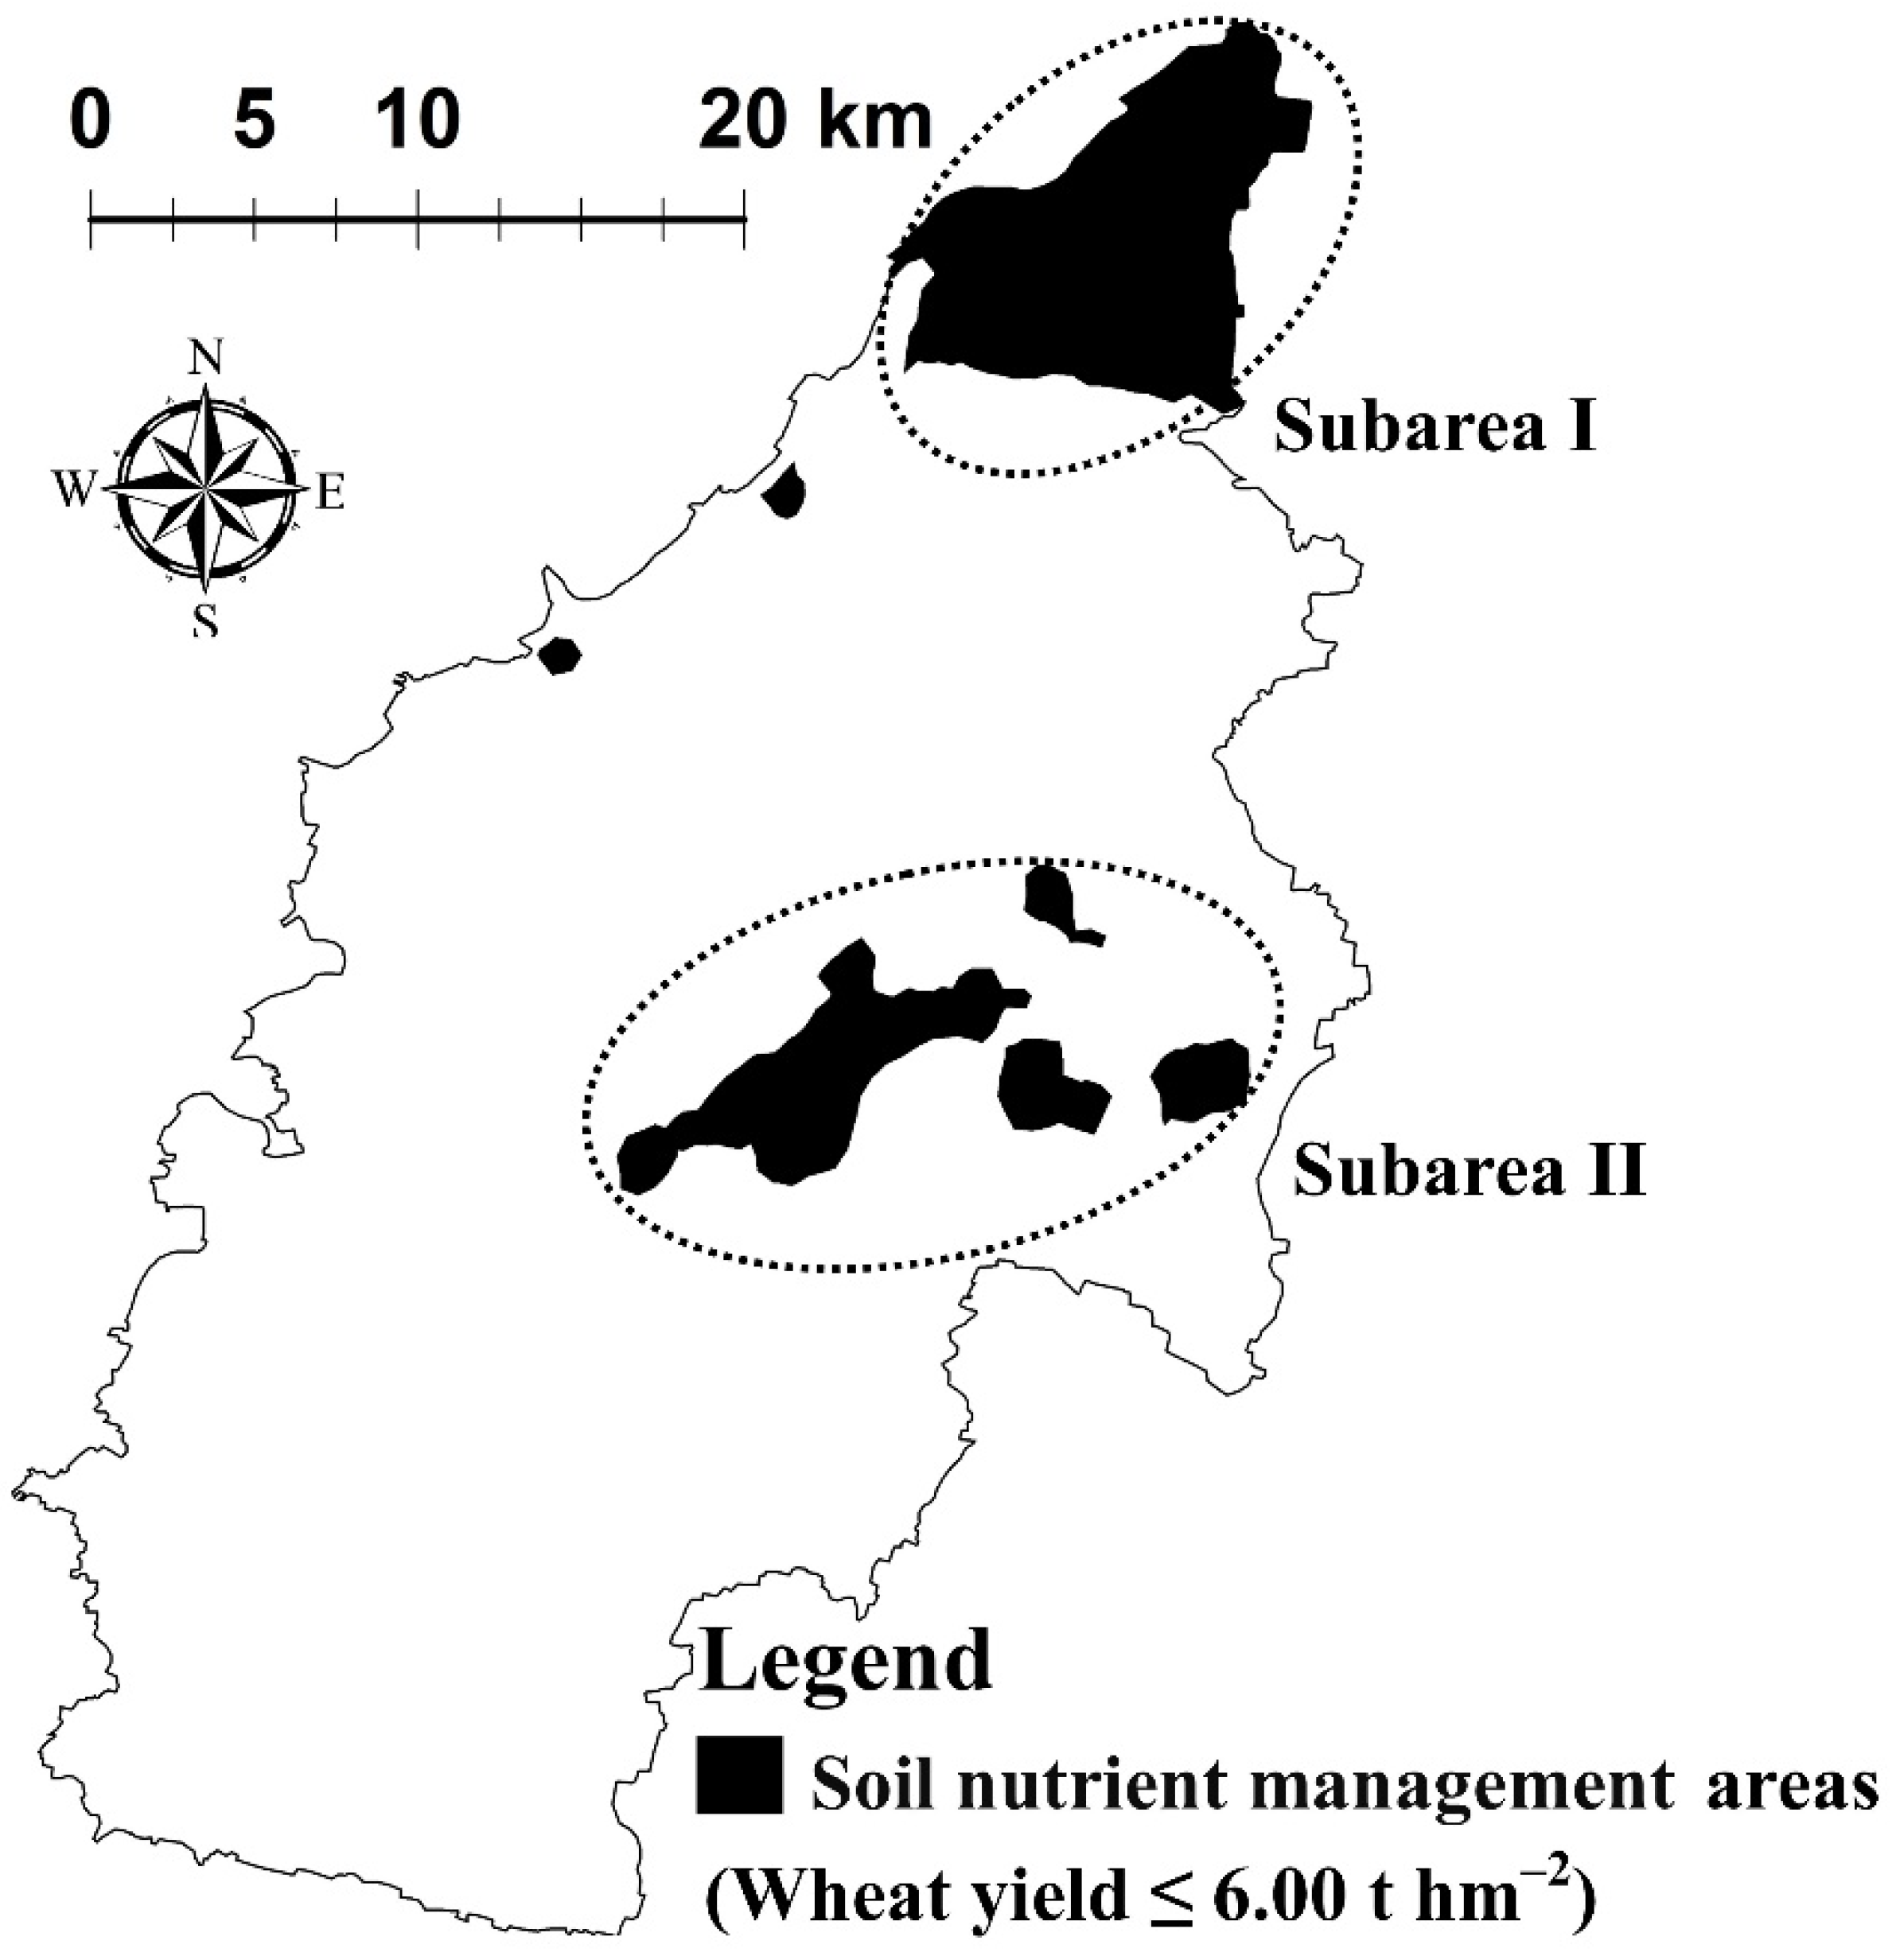
3.6. Delineating Areas for Soil Improvement

Soil nutrient management areas (wheat yield < 6.00 t hm−2) delineated based on the spatial distribution pattern of wheat yield are shown in Figure 4. Low-yield areas are mainly located in the northeast (i.e., subarea I) and the middle east (i.e., subarea II) of the study area (Figure 4). Local regression coefficients generated by RGWR indicate that soil pH has a negative contribution to wheat yield while SOM and soil TP have positive contributions (Figure 3). Thus, reducing soil alkalinity, increasing SOM and soil TP should be important measures to increase wheat yield in Yucheng County. Thus, applying organic fertilizer, phosphate fertilizer, or/and acid fertilizer may be important measures to improve soil nutrition, which may be beneficial to increase wheat production in Yucheng County. As the influence strength of the main impact factors (i.e., SOM, soil TP, and soil pH) on wheat yield varies with spatial location (Figure 3), improvement measures should be different for different low-yield areas. For example, SOM has a greater impact on wheat yield in subarea I than in subarea II; soil pH has a greater impact on wheat yield in subarea I than in subarea II (Figure 3 and Figure 4).
Usually, wheat yield is influenced by multiple factors, such as soil physical and chemical properties, climate, irrigation, tillage and so on [5,6,8,12]. At the national scale of China, climate factors may be important indicators affecting the spatial variation of wheat yield [46]. Because the environmental factors in each region are not identical, the main factors that limit the growth of wheat in each region are different. Stepwise regression is an effective model for identifying the main impact factors on crop yield at a regional scale. However, this model is a type of global regression, and spatial coordinate was not considered in regression coefficient estimation. Thus, stepwise regression can only qualitatively identify the main factors that impact wheat yield in the entire study area. RGWR takes into account spatial coordinates in the regression analysis and is robust to outliers. Therefore, RGWR was used to explore the spatially non-stationary influences of main related soil factors on winter wheat yield. Model validation shows that the relationships generated by RGWR are more accurate than those generated by GWR and OLSR.
This study mainly focused on improving soil nutrient management at the county scale to increase wheat yield. Crop yields at the regional scale are often affected by local limiting soil factors. In order to increase the crop yields in a spatially targeted manner, the limiting soil factors must be determined first, and then the spatially non-stationary relationship between crop yield and the limiting soil factors should be explored.
It is worth noting that the content of specific soil factors and their spatial variability in each study area are quite different, and the limiting factors of wheat yield in this study area are not necessarily the same as those in other areas. Moreover, since soil factors will also change to a certain extent over time, the main limiting factors of wheat yield may also change after a larger time span. After a long period of time or in other study areas, the main limiting factors of crop yield and their spatially varying impact need to be re-determined. In addition, wheat cultivars may also have an important influence on wheat yield [47]. Ji-Mai-22, one of the most important wheat cultivars in Yucheng County, was considered in this study. If other wheat cultivars were planted in the same study area, the relationships between wheat yield and related soil properties might not be identical.

4. Conclusions

Stepwise regression was used to identify the most important impact factor on wheat yield from 12 potential impact factors. Then, RGWR was established to explore the relationships between winter wheat yield and its main related soil factors, and its modeling effect was further compared with the traditionally-used OLSR and GWR. Finally, robust geostatistical analysis was conducted for spatially precise soil management measures in the low-yield areas of the county. Results showed that: (i) SOM, soil TP, and pH were the main impact factors on wheat yield; (ii) the relative improvement accuracy over OLSR was 52.31% for RGWR and 34.1% for GWR; (iii) RGWR revealed the spatially non-stationary influences of the main impact factors on wheat yield, which were ignored by the traditional OLSR model; (iv) robust geostatistics obtain a better spatial prediction effect and the low-yield areas are mainly located in the northeast and middle east of the study area. Therefore, the method recommended in this study provided information for guideline field management.

Author Contributions

Conceptualization, M.Q. and J.L.; methodology, M.Q.; software, X.G.; validation, M.Q. and X.G.; formal analysis, X.G.; investigation, J.L.; data curation, J.L.; writing—original draft preparation, M.Q. and J.L.; writing—review and editing, M.Q.; visualization, H.L.; supervision, Y.Z. and B.H.; project administration, Y.Z. and B.H.; funding acquisition, M.Q. and B.H. All authors have read and agreed to the published version of the manuscript.

Funding

This work was financially supported by the National Natural Science Foundation of China (41771249); the Knowledge Innovation Program of Institute of Soil Science, Chinese Academy of Sciences (ISSASIP1623); and the Youth Innovation Promotion Association, CAS (2018348).

Institutional Review Board Statement

Not applicable.

Informed Consent Statement

Not applicable.

Data Availability Statement

Not applicable.

Conflicts of Interest

The authors declare no conflict of interest.

References

  1. Godfray, H.C.J.; Beddington, J.R.; Crute, I.R.; Haddad, L.; Lawrence, D.; Muir, J.F.; Pretty, J.; Robinson, S.; Thomas, S.M.; Toulmin, C. Food security: The challenge of feeding 9 billion people. Science 2010, 327, 812–818. [Google Scholar] [CrossRef] [PubMed] [Green Version]
  2. Tilman, D.; Balzer, C.; Hill, J.; Befort, B.L. Global food demand and the sustainable intensification of agriculture. Proc. Natl. Acad. Sci. USA 2011, 108, 20260–20264. [Google Scholar] [CrossRef] [PubMed] [Green Version]
  3. Zhang, F.; Cui, Z.; Fan, M.; Zhang, W.; Chen, X.; Jiang, R. Integrated soil-crop system management: Reducing environmental risk while increasing crop productivity and improving nutrient use efficiency in China. J. Environ. Qual. 2011, 40, 1051–1057. [Google Scholar] [CrossRef]
  4. Tan, X.L.; Guo, T.W.; Song, S.Y.; Zhang, P.L.; Zhang, X.C.; Zhao, C. Balanced fertilizer management strategy enhances potato yield and marketing quality. Agron. J. 2016, 108, 2235–2244. [Google Scholar] [CrossRef]
  5. Altaf, A.; Zhu, X.; Zhu, M.; Quan, M.; Irshad, S.; Xu, D.; Aleem, M.; Zhang, X.; Gull, S.; Li, F.; et al. Effects of Environmental Stresses (Heat, Salt, Waterlogging) on Grain Yield and Associated Traits of Wheat under Application of Sulfur-Coated Urea. Agronomy 2021, 11, 2340. [Google Scholar] [CrossRef]
  6. Kravchenko, A.N.; Robertson, G.P.; Thelen, K.D.; Harwood, R.R. Management, topographical, and weather effects on spatial variability of crop grain yields. Agron. J. 2005, 97, 514–523. [Google Scholar] [CrossRef] [Green Version]
  7. Huang, X.; Wang, L.; Yang, L.; Kravchenko, A.N. Management effects on relationships of crop yields with topography represented by wetness index and precipitation. Agron. J. 2008, 100, 1463–1471. [Google Scholar] [CrossRef] [Green Version]
  8. Alvarez, R.; Steinbach, H.S. A review of the effects of tillage systems on some soil physical properties, water content, nitrate availability and crops yield in the Argentine Pampas. Soil Tillage Res. 2009, 104, 1–15. [Google Scholar] [CrossRef]
  9. Zhao, Y.; Wang, P.; Li, J.; Chen, Y.; Ying, X.; Liu, S. The effects of two organic manures on soil properties and crop yields on a temperate calcareous soil under a wheat–maize cropping system. Eur. J. Agron. 2009, 31, 36–42. [Google Scholar] [CrossRef]
  10. Qiao, S.C.; Wang, H.; Prentice, I.C.; Harrison, S.P. Optimality-based modelling of climate impacts on global potential wheat yield. Environ. Res. Lett. 2021, 114013. [Google Scholar] [CrossRef]
  11. Zhao, S.; He, P.; Qiu, S.; Jia, L.; Liu, M.; Jin, J.; Johnston, A.M. Long-term effects of potassium fertilization and straw return on soil potassium levels and crop yields in north-central China. Field Crops Res. 2014, 169, 116–122. [Google Scholar] [CrossRef]
  12. Bhattacharyya, R.; Pandey, A.K.; Gopinath, K.A.; Mina, B.L.; Bisht, J.K.; Bhatt, J.C. Fertilization and crop residue addition impacts on yield sustainability under a rainfed maize–wheat system in the Himalayas. Proc. Natl. Acad. Sci. India Sect. B Biol. Sci. 2016, 86, 21–32. [Google Scholar] [CrossRef]
  13. Draper, N.; Smith, H. Applied Regression Analysis, 3rd ed.; A Wiley-Interscience Publication: New York, NY, USA, 1998. [Google Scholar]
  14. Bourennane, H.; Nicoullaud, B.; Couturier, A.; King, D. Exploring the spatial relationships between some soil properties and wheat yields in two soil types. Precis. Agric. 2004, 5, 521–536. [Google Scholar] [CrossRef]
  15. Verhulst, N.; Sayre, K.D.; Vargas, M.; Crossa, J.; Deckers, J.; Raes, D.; Govaerts, B. Wheat yield and tillage–straw management system × year interaction explained by climatic co-variables for an irrigated bed planting system in northwestern Mexico. Field Crops Res. 2011, 124, 347–356. [Google Scholar] [CrossRef]
  16. Li, W.; Tang, H.; Qin, Z.; You, F.; Wang, X.; Chen, C.; Ji, J.; Liu, X. Climate Change Impact and Its Contribution Share to Paddy Rice Production in Jiangxi, China. J. Integr. Agric. 2014, 13, 1565–1574. [Google Scholar] [CrossRef]
  17. Zeng, F.; Ali, S.; Zhang, H.; Ouyang, Y.; Qiu, B.; Wu, F.; Zhang, G. The influence of pH and organic matter content in paddy soil on heavy metal availability and their uptake by rice plants. Environ. Pollut. 2011, 159, 84–91. [Google Scholar] [CrossRef]
  18. Wang, K.; Zhang, C.; Li, W. Predictive mapping of soil total nitrogen at a regional scale: A comparison between geographically weighted regression and cokriging. Appl. Geogr. 2013, 42, 73–85. [Google Scholar] [CrossRef]
  19. Evans, F.H.; Salas, A.R.; Rakshit, S.; Scanlan, C.A.; Cook, S.E. Assessment of the use of geographically weighted regression for analysis of large on-farm experiments and implications for practical application. Agronomy 2020, 10, 1720. [Google Scholar] [CrossRef]
  20. Fotheringham, A.S.; Brunsdon, C.; Charlton, M.E. Geographically Weighted Regression: The Analysis of Spatially Varying Relationships; John Wiley & Sons: Hoboken, NJ, USA, 2002. [Google Scholar]
  21. Harris, P.; Fotheringham, A.S.; Juggins, S. Robust geographically weighted regression: A technique for quantifying spatial relationships between freshwater acidification critical loads and catchment attributes. Ann. Assoc. Am. Geogr. 2010, 100, 286–306. [Google Scholar] [CrossRef]
  22. Liu, H.; Jezek, K.C.; O’Kelly, M.E. Detecting outliers in irregularly distributed spatial data sets by locally adaptive and robust statistical analysis and GIS. Int. J. Geogr. Inf. Sci. 2001, 15, 721–741. [Google Scholar] [CrossRef]
  23. Zhang, H.; Mei, C. Local least absolute deviation estimation of spatially varying coefficient models: Robust geographically weighted regression approaches. Int. J. Geogr. Inf. Sci. 2011, 25, 1467–1489. [Google Scholar] [CrossRef]
  24. Qu, M.K.; Chen, J.; Huang, B.; Zhao, Y.C. Exploring the spatially varying relationships between cadmium accumulations and the main influential factors in the rice-wheat rotation system in a large-scale area. Sci. Total Environ. 2020, 736, 139565. [Google Scholar] [CrossRef]
  25. Saito, H.; McKenna, S.A.; Zimmerman, D.A.; Coburn, T.C. Geostatistical interpolation of object counts collected from multiple strip transects: Ordinary kriging versus finite domain kriging. Stoch. Environ. Res. Risk Assess. 2005, 19, 71–85. [Google Scholar] [CrossRef]
  26. Lark, R.M.; Webster, R. Geostatistical mapping of geomorphic variables in the presence of trend. Earth Surf. Process. Landf. 2006, 31, 862–874. [Google Scholar] [CrossRef]
  27. Sun, W.; Zhao, Y.; Huang, B.; Shi, X.; Landon Darilek, J.; Yang, J.; Wang, Z.; Zhang, B. Effect of sampling density on regional soil organic carbon estimation for cultivated soils. J. Plant Nutr. Soil Sci. 2012, 175, 671–680. [Google Scholar] [CrossRef]
  28. Gong, Z.T.; Zhang, G.L.; Chen, Z.C. Development of Soil Classification in China. In Soil Classification: A Global Desk Reference; Eswaran, H., Rice, T., Ahrens, R., Stewart, B.A., Eds.; CRC Press: Boca Raton, FL, USA, 2003; pp. 101–125. [Google Scholar]
  29. Shi, X.Z.; Wang, H.J.; Warner, E.D.; Yu, D.S.; Sun, W.X.; Zhao, Y.C. Cross-reference for relating Genetic Soil Classification of China with WRB at different scales. Geoderma 2010, 154, 344–350. [Google Scholar] [CrossRef]
  30. Lu, R.K. Soil Analytical Methods of Agronomic Chemical; China Agricultural Science and Technology Press: Beijing, China, 2000. (In Chinese) [Google Scholar]
  31. Goovaerts, P. Geostatistics for Natural Resources Evaluation; Oxford University Press: New York, NY, USA, 1997. [Google Scholar]
  32. Matheron, G. Traité de Géostatistique Appliquée, Tome I: Mémoires du Bureau de Recherches Géologiques et Minières, 14th ed.; Technip: Paris, France, 1962; p. 333. [Google Scholar]
  33. Cressie, N.; Hawkins, D.M. Robust estimation of the variogram: I. J. Int. Assoc. Math. Geol. 1980, 12, 115–125. [Google Scholar] [CrossRef]
  34. Lark, R.M. Two Robust estimators of the cross-variogram for multivariate geostatistical analysis of soil properties: Robust estimators of cross-variograms. Eur. J. Soil Sci. 2003, 54, 187–202. [Google Scholar] [CrossRef]
  35. Qu, M.; Chen, J.; Li, W.; Zhang, C.; Wan, M.; Huang, B.; Zhao, Y. Correction of in-situ portable X-ray fluorescence (PXRF) data of soil heavy metal for enhancing spatial prediction. Environ. Pollut. 2019, 254, 112993. [Google Scholar] [CrossRef]
  36. Dowd, P.A. The variogram and kriging: Robust and resistant estimators. In Geostatistics for Natural Resources Characterization; Verly, G., David, M., Journel, A.G., Marechal, A., Eds.; Springer: Dordrecht, The Netherlands, 1984; pp. 91–106. ISBN 978-94-010-8157-3. [Google Scholar]
  37. Genton, M.G. Highly robust variogram estimation. Math. Geol. 1998, 30, 213–221. [Google Scholar] [CrossRef]
  38. Lark, R.M. A comparison of some robust estimators of the variogram for use in soil survey: Robust variogram estimators. Eur. J. Soil Sci. 2000, 51, 137–157. [Google Scholar] [CrossRef]
  39. Brunsdon, C.; Fotheringham, S.; Charlton, M. Geographically weighted regression-modelling spatial non-stationarity. J. R. Stat. Soc. 1998, 47, 431–443. [Google Scholar] [CrossRef]
  40. Zhang, R.; Warrick, A.W.; Myers, D.E. Improvement of the prediction of soil particle size fractions using spectral properties. Geoderma 1992, 52, 223–234. [Google Scholar] [CrossRef]
  41. Papritz, A.; Schwierz, C. R Package Georob: Robust Geostatistical Analysis of Spatial Data. 2018. Available online: https://cran.r-project.org/web/packages/georob/index.html (accessed on 20 September 2021).
  42. Fotheringham, A.S.; Brunsdon, C. Local forms of spatial analysis. Geogr. Anal. 2010, 31, 340–358. [Google Scholar] [CrossRef]
  43. Kemmitt, S.; Wright, D.; Goulding, K.; Jones, D. PH regulation of carbon and nitrogen dynamics in two agricultural soils. Soil Biol. Biochem. 2006, 38, 898–911. [Google Scholar] [CrossRef]
  44. Högberg, M.N.; Högberg, P.; Myrold, D.D. Is microbial community composition in boreal forest soils determined by pH, C-to-N ratio, the trees, or all three? Oecologia 2006, 150, 590–601. [Google Scholar] [CrossRef]
  45. Cambardella, C.A.; Moorman, T.B.; Novak, J.M.; Parkin, T.B.; Karlen, D.L.; Turco, R.F.; Konopka, A.E. Field-scale variability of soil properties in central Iowa soils. Soil Sci. Soc. Am. J. 1994, 58, 1501–1511. [Google Scholar] [CrossRef]
  46. Chen, C.; Wang, E.; Yu, Q. Modeling wheat and maize productivity as affected by climate variation and irrigation supply in north China plain. Agron. J. 2010, 102, 1037–1049. [Google Scholar] [CrossRef] [Green Version]
  47. Fang, Y.; Xu, B.; Liu, L.; Gu, Y.; Liu, Q.; Turner, N.C.; Li, F.M. Does a mixture of old and modern winter wheat cultivars increase yield and water use efficiency in water-limited environments? Field Crops Res. 2014, 156, 12–21. [Google Scholar] [CrossRef]
Figure 1. Study area and the sampling sites in Yucheng County, Shandong Province, China.
Agronomy 12 00298 g001
Figure 2. Spatial distribution maps generated by robust ordinary kriging (ROK) for (a) wheat yield, (b) soil organic matter (SOM), (c) soil total phosphorus (TP), and (d) soil pH.
Agronomy 12 00298 g002
Figure 3. Spatial distribution maps of local regression coefficients generated by robust geographically weighted regression (RGWR) analysis of wheat yield against three explanatory variables: (a) local intercept, (b) local slope of soil organic matter (SOM), (c) local slope of soil total phosphorus (TP), and (d) local slope of soil pH.
Agronomy 12 00298 g003
Figure 4. Soil nutrient management areas delineated based on the spatial distribution patterns of wheat yield predicted by robust geostatistics.
Agronomy 12 00298 g004
Table 1. Descriptive statistics of the sample data for wheat yield, soil organic matter (SOM), total phosphorus (TP), and soil pH (n = 99).
PropertiesMinimumMaximumMeanSD aCV b (%)
SOM (g kg−1)2.3331.0716.036.1738.49
TP (g kg−1)0.203.141.520.5032.89
Soil pH7.509.148.560.222.57
Yield (t hm−2)3.638.446.681.0115.12
a Standard deviation. b Coefficient of variation.
Table 2. Pearson’s correlation coefficients between wheat yield and its main impact factors.
VariablesWheat YieldSoil Organic MatterSoil Total PhosphorusSoil pH
Wheat yield10.71 **0.62 **−0.56 **
Soil organic matter 10.20 *−0.15
Soil total phosphorus 1−0.13
Soil pH 1
* Correlation is significant at the 0.05 level (two-tailed). ** Correlation is significant at the 0.01 level (two-tailed).
Table 3. The medians of the standardized square prediction error (SSPE) generated by leave-one-out cross-validation.
Wheat YieldSoil Organic MatterSoil Total PhosphorusSoil pH
Matheron0.330.3340.3260.351
Genton0.4080.4710.4480.451
Dowd0.4490.4530.3860.432
Cressie-Hawkins0.4180. 4120.4220.44
Note: the medians of SSPE closest to 0.455 are in bold.
Table 4. Parameters of the optimal robust variogram models.
EstimatorModelNuggetSillNugget/Sill (%)Range (km)
Wheat yieldDowdSpherical0.210.8524.717.91
Soil organic matterDowdExponential5.9830.2119.7911.43
Soil total phosphorusGentonExponential0.060.1931.588.95
Soil pHGentonExponential0.0120.04129.279.33
Table 5. Validation indices a for the regression models calculated based on the 99 pairs of the measured yields and predicted yields.
Models bMAE*RI (%)
OLSR1.04-
GWR0.6934.10
RGWR0.5052.31
a MAE*, median absolute error; RI, relative improvement accuracy of one model over OLSR. b OLSR, ordinary least squares regression; GWR, geographically weighted regression; RGWR, robust geographically weighted regression.
Publisher’s Note: MDPI stays neutral with regard to jurisdictional claims in published maps and institutional affiliations.

