Article

Incorporating Auxiliary Data of Different Spatial Scales for Spatial Prediction of Soil Nitrogen Using Robust Residual Cokriging (RRCoK)

1
Key Laboratory of Soil Environment and Pollution Remediation, Institute of Soil Science, Chinese Academy of Sciences, Nanjing 210008, China
2
State Key Laboratory of Soil and Sustainable Agriculture, Institute of Soil Science, Chinese Academy of Sciences, Nanjing 210008, China
*
Author to whom correspondence should be addressed.
Agronomy 2021, 11(12), 2516; https://doi.org/10.3390/agronomy11122516
Submission received: 30 September 2021 / Revised: 18 November 2021 / Accepted: 1 December 2021 / Published: 10 December 2021
(This article belongs to the Special Issue Soil Sustainability in the Anthropocene)

Abstract

:
Auxiliary data has usually been incorporated into geostatistics for high-accuracy spatial prediction. Due to the different spatial scales, category and point auxiliary data have rarely been incorporated into prediction models together. Moreover, traditionally used geostatistical models are usually sensitive to outliers. This study first quantified the land-use type (LUT) effect on soil total nitrogen (TN) in Hanchuan County, China. Next, the relationship between soil TN and the auxiliary soil organic matter (SOM) was explored. Then, robust residual cokriging (RRCoK) with LUTs was proposed for the spatial prediction of soil TN. Finally, its spatial prediction accuracy was compared with that of ordinary kriging (OK), robust cokriging (RCoK), and robust residual kriging (RRK). Results show that: (i) both LUT and SOM are closely related to soil TN; (ii) by incorporating SOM, the relative improvement accuracy of RCoK over OK was 29.41%; (iii) by incorporating LUTs, the relative improvement accuracy of RRK over OK was 33.33%; (iv) RRCoK obtained the highest spatial prediction accuracy (RI = 43.14%). It is concluded that the recommended method, RRCoK, can effectively incorporate category and point auxiliary data together for the high-accuracy spatial prediction of soil properties.

1. Introduction

Nitrogen is essential and often the most limiting nutrient for crop growth [1,2]. When soil nitrogen is limited, crop growth is slow, and the yield is reduced. If the soil nitrogen supply is greater than crop demand, excessive nitrate may enter either ground or surface water, leading to serious negative impacts on the aquatic environment [3,4,5,6,7]. Therefore, understanding the spatial distribution pattern of soil total nitrogen (TN) is crucial for sustainable agricultural production and environmental control.
Kriging is a basic geostatistical technique that provides the best linear, unbiased estimation for a spatial variable based on sample data [8,9,10]. This technology has been widely used for the spatial prediction of soil properties [11,12,13]. Since the kriging model is based on limited samples, there must be a certain degree of uncertainty in its prediction results [14]. In regional soil investigation, huge financial and labor costs usually have to be spent, especially in high-density field sampling and the subsequent measurement of soil samples in the laboratory [15,16]. Therefore, the data that is closely related to the target property should be effectively used as auxiliary information within spatial prediction models [17,18].
Categorical auxiliary data, such as soil types, land-use types (LUTs), and geology types, have been usually incorporated into kriging to improve the spatial prediction quality of soil properties [19,20,21,22]. For example, Goovaerts et al. [23] used geology types as auxiliary information to improve the spatial prediction of the Cd concentration in a 14.5 km2 region in Swiss Jura. Moreover, point auxiliary data, such as sample data in the historical database, has been used as co-variables in geostatistics [24,25,26,27]. Wu et al. [28] used cation exchange capacity as an auxiliary variable to improve the prediction accuracy of soil Cu in northern North Dakota. If the correlation between the auxiliary data and the target soil properties is relatively high, the effect of spatial prediction is usually better.
Due to the different spatial scales, category and point auxiliary data have rarely been incorporated in prediction models together. An effective combination of auxiliary information at different spatial scales can increase the amount of information input in spatial prediction [29], thus improving the spatial prediction accuracy of soil properties. Moreover, traditionally geostatistical models are usually sensitive to outliers. With the strengthening of human activities, some outliers often appear in the soil sample data collected at the regional scale [30]. Therefore, proposing a spatial prediction method that can effectively combine the auxiliary information of different spatial scales and reduce the influence of outliers is very urgent for precise soil nutrient management at the regional scale.
In central China, the dominant LUTs are paddy fields and dry farmland, which are mainly used to cultivate rice (Oryza sativa L.). Due to different cultivation practices, LUTs have a strong effect on the soil TN concentration [18]. In addition, it is widely known that soil organic matter (SOM) is closely related to TN, and it is usually used as a co-variable for the spatial prediction of TN concentration, if denser sample data are available [31]. Therefore, it is desirable and necessary to use LUTs and SOM data as auxiliary information to improve the spatial prediction of TN.
This study used the spatial prediction of soil TN in Hanchuan County, China, as a case study. The main objectives were to (i) quantify the LUT effect on soil TN in Hanchuan County, China; (ii) explore the relationship between soil TN and the auxiliary SOM; (iii) propose robust residual cokriging (RRCoK) for the spatial prediction of soil TN; and (iv) compare its spatial prediction accuracy with that of ordinary kriging (OK), robust cokriging (RCoK), and robust residual kriging (RRK). The ultimate goal was to recommend a method to effectively incorporate auxiliary data of different spatial scales (i.e., category and point auxiliary data) for the high-accuracy spatial prediction of soil properties.

2. Materials and Methods

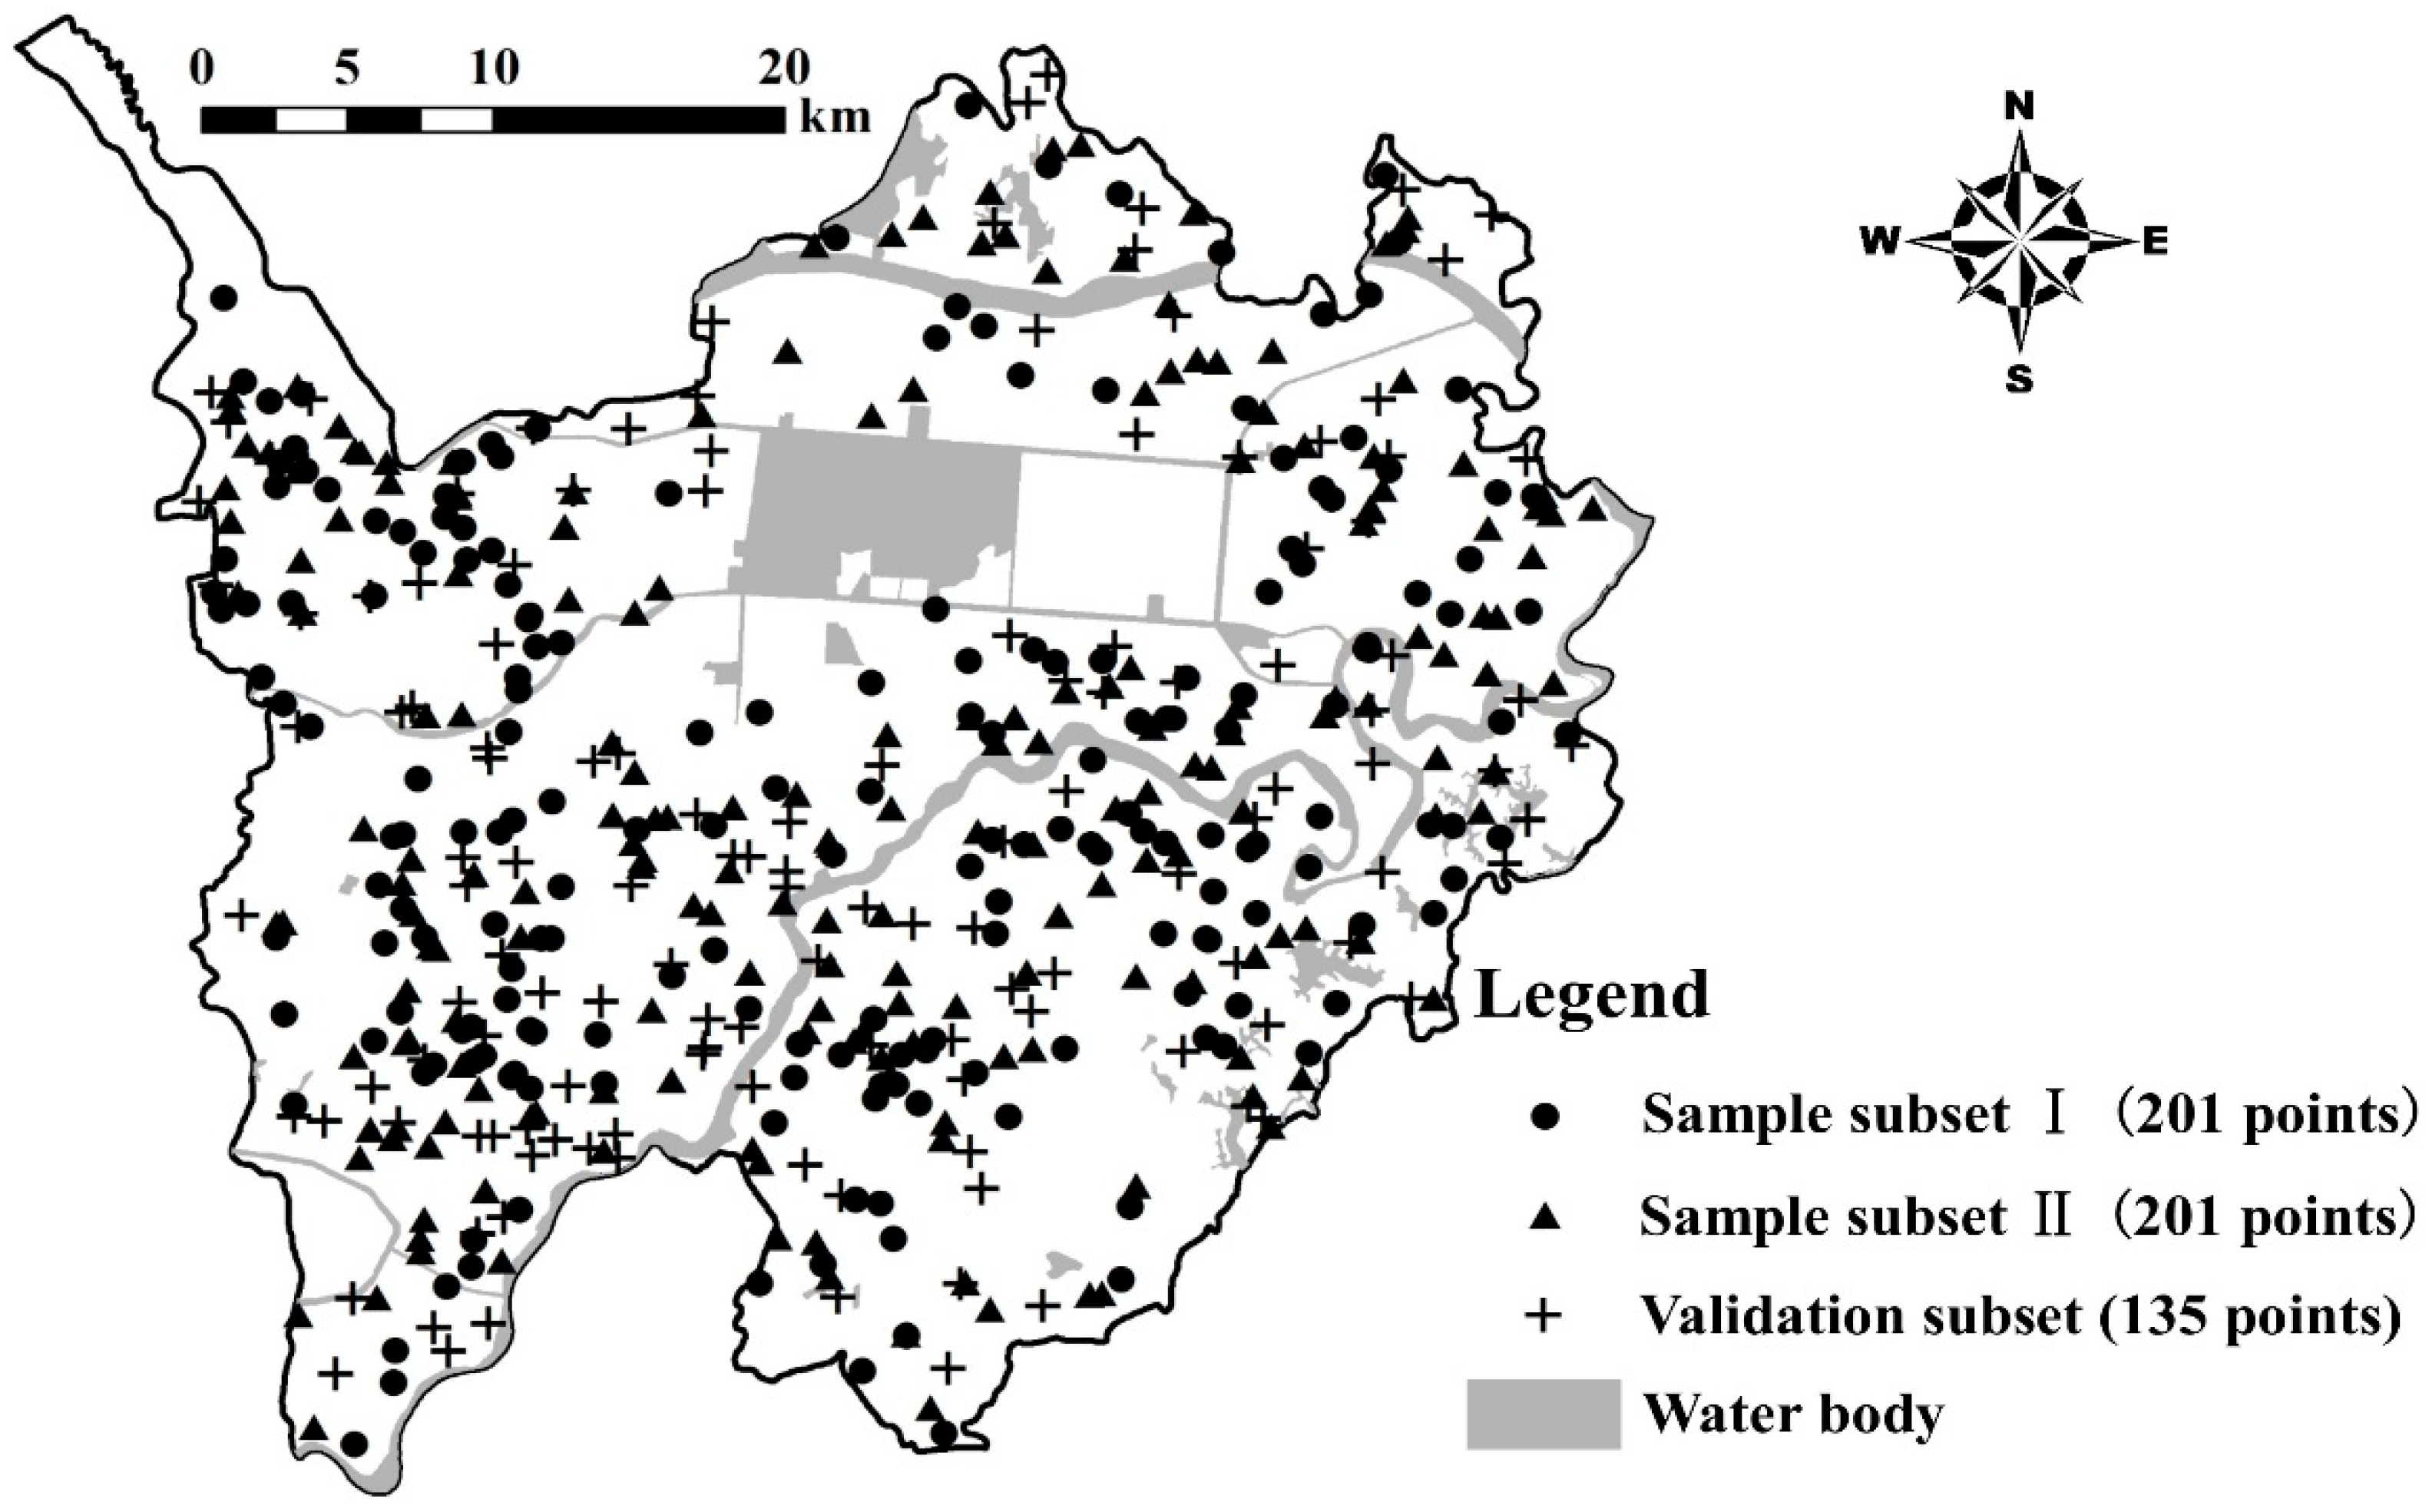
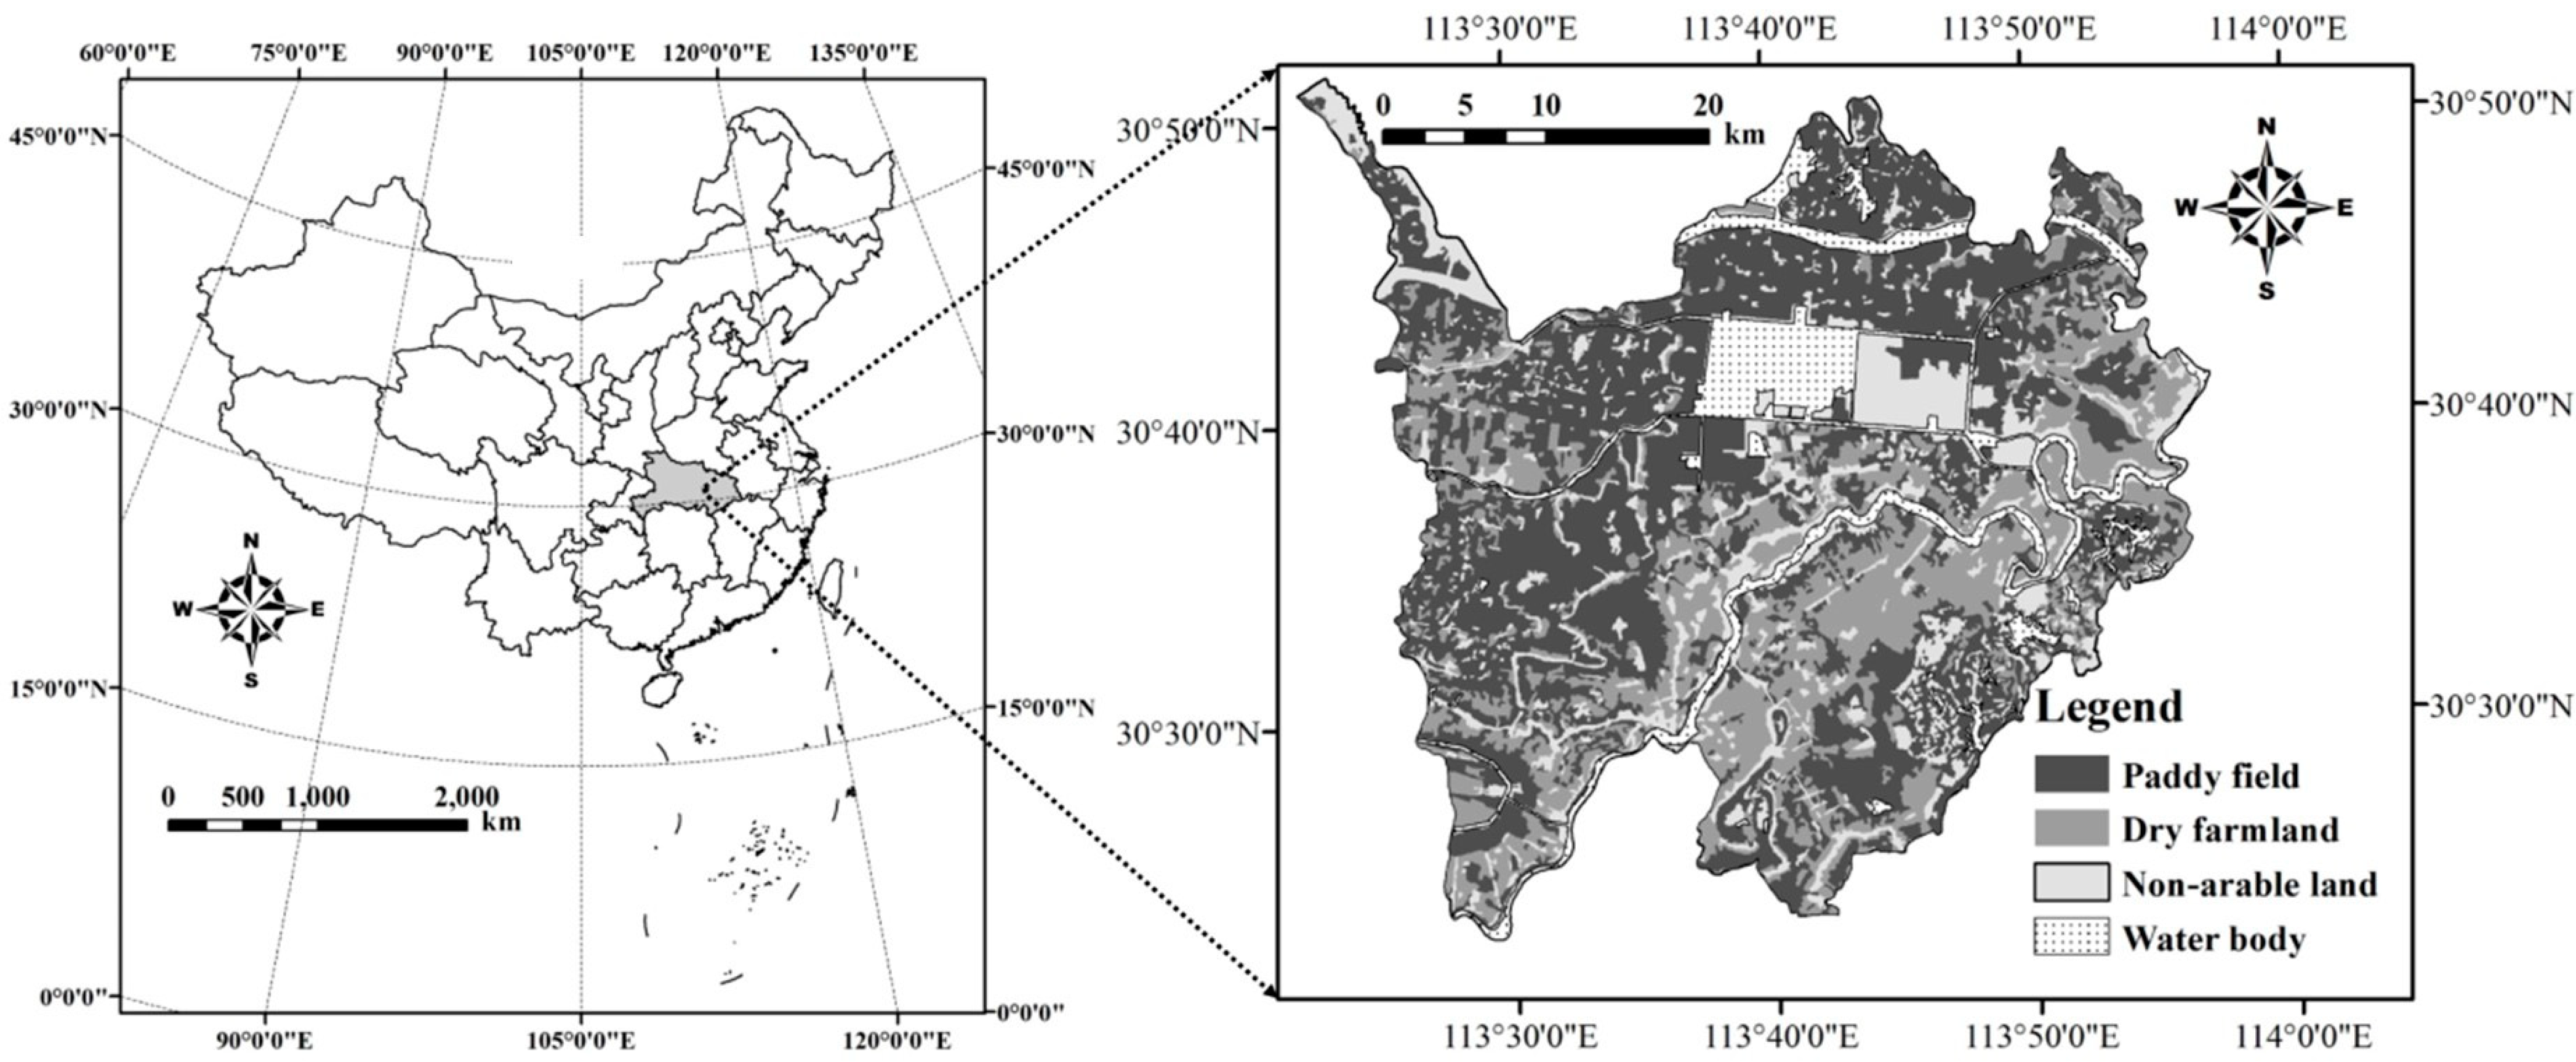
2.1. Study Area and Data

Hanchuan County (30°22′–31°51′ N, 113°2′–113°57′ E) was selected as the study area. This county (1663 km2) is located in the Jianghan Plain in the central region of Hubei Province, China (Figure 1). In this county, the dominant LUTs are paddy field and dry farmland. This region is in the northern, subtropical monsoonal climate zone, with four distinct seasons. The average annual precipitation and temperature are 1224.9 mm and 16.2 °C, respectively [32]. The LUT data were collected from the county’s agricultural department. This study classified the LUT data into four types: paddy field, dry farmland, water body, and non-arable land (Figure 1). Non-arable land refers to all terrestrial lands without tillage, such as wildlands, woodlands, etc.
Based on the principle that the number of samples for each LUT is proportional to the area of the corresponding LUT, a total of 537 soil samples (0–15 cm) were taken in November 2006 in Hanchuan County (Figure 2). During sampling, 6–8 soil subsamples were collected within an area of approximately 100 m2 at each sampling site and then mixed. Approximately 1 kg of the mixed soil for each sample was packed in a bag and delivered to the laboratory for further preparation and analysis. The coordinates of all the sampling locations were recorded using a hand-held global positioning system (GPS). Soil samples were air-dried at room temperature (20–22 °C), crushed after stones and debris were removed, passed through a 2 mm sieve, and then analyzed for the concentrations of TN (Kjeldahl method with H2SO4 + H2O2 digestion) and SOM (potassium bichromate wet combustion procedure) [33]. Quality control was based on the use of standard reference materials and duplicate analyses.

2.2. Data Utilization and Model Comparison

135 sample data (TN) were used for model validation, and the remaining 402 samples were randomly divided into sample subset I (n = 201) and II (n = 201) (Figure 2). TN data are available at sample subset I, and auxiliary SOM data are available at subset I and II.
In this study, we compared the following four spatial prediction models: ordinary kriging with 201 soil TN data; RCoK with 201 soil TN data and 402 SOM data; RRK with 201 soil TN data and LUTs; and RRCoK with 201 soil TN data, 402 SOM data, and LUTs.

2.3. Land-Use Type Effect for Soil Property

Sample sites were first grouped based on LUTs (Figure 1). Then, the sample concentration z ( u ) was decomposed into two parts:
z ( u ) = l ( u ) + r ( u )
with
l ( u ) = { m [ l u ( u ) ]     m [ l u 0 ] ,   i f m [ l u ( u ) ]   is   significantly   different from   [ l u 0 ] 0 ,   others
where l ( u ) , r ( u ) , and l u ( u ) are the LUT effect, the residual, and the LUT, respectively, at location u; l u 0 is the LUT corresponding to the lowest concentration; m [ ] is the average concentration corresponding to the LUT in brackets. The difference between m [ l u ( u ) ] and m [ l u 0 ] was tested by an analysis of variance (ANOVA).

2.4. Robust Residual Cokriging (RRCoK)

RRCoK was proposed to incorporate auxiliary data at different spatial scales (i.e., LUTs and SOM) and weaken the influence of outliers on the spatial prediction of soil TN. After LUT effects were removed, the residual was regarded as a new spatial variable [17,21]. y R R C o K * ( u ) , predicted by RRCoK, is the sum of the land-use effect l ( u ) and the residual r R C o K * ( u ) predicted by RCoK:
y R R C o K * ( u ) = l ( u ) + r R C o K * ( u )
with
r R C o K * ( u ) = α 1 = 1 n 1 λ α 1 ( u ) r ( u α 1 ) + α 2 = 1 n 2 λ α 2 ( u ) y ( u α 2 )
with the kriging system
α 1 = 1 n 1 λ α 1 ( u ) = 1   and   α 2 = 1 n 2 λ α 2 ( u ) = 0
where the λ α 1 ′s are the n 1 weights of the r samples (i.e., the residual of soil TN) and the λ α 2 ′s are the n2 weights of y samples (i.e., SOM).
It is well known that the traditionally-used auto- and cross-variograms are non-robust to outliers [34,35,36]. Outliers may affect the fit of variograms, reducing the spatial prediction accuracy of soil TN. Therefore, in addition to Matheron’s estimators of auto- and cross-variograms, three robust auto-variogram estimators (i.e., Cressie-Hawkins estimator [37], Dowd’s estimator [38], and Genton’s estimator [39]) and two robust cross-variogram estimators (i.e., MVE estimator and M&G estimator), developed by Lark et al. [36], were used in this study. The best variogram was determined based on the θ ( u ) index [35]:
θ ( u ) = { z * ( u ) z ( u ) } 2 σ K 2 ( u )
where z * ( u ) and z ( u ) are the predicted and measured residuals, respectively, at sample location u; σ K 2 ( u ) represents the prediction variance at sample location u. According to Lark et al. [35], the best variogram corresponded to the one with the median of θ ( u ) being closest to 0.455. The details of the RCoK were described in Lark et al. [35,36].
When the LUT effect is zero, RRCoK becomes RCoK; When there is no correlation between SOM and TN, RRCoK becomes RRK. Detailed descriptions of OK, cokriging, robust kriging can be found in Lark et al. [36], Deutsch and Journel. [40], Olea [41], and Remy et al. [42].

2.5. Evaluation of Soil Nitrogen Predictions

To evaluate the spatial prediction accuracy of the four methods, the mean absolute error (MAE) and the root mean square error (RMSE) were calculated based on the 135 pairs of measured and predicted values of the soil TN at validation sites (Figure 2).
M A E = 1 135 i = 1 135 | x i y i |
R M S E = 1 135 i = 1 135 ( x i y i ) 2
where x i and y i are the measured and predicted data on the validation locations, respectively. A lower MAE and RMSE indicate a higher accuracy for the corresponding model. The relative improvement (RI) of one method over the other is calculated using [43]
R I = R M S E R R M S E E R M S E R
where RMSER and RMSEE are the RMSE for the reference and the evaluated method, respectively. If RI is positive, the accuracy of the evaluated method is higher than that of the reference method, and vice versa [44].
In this study, geostatistical analyses were performed on a regular square grid with a cell size of 200 × 200 m. The “georob” in R 3.5.0 software (version 3.3.3, http://cran.rproject.org) was used to fit variograms. ArcGIS (version 10.0) was used for the spatial analysis and producing maps.

3. Results and Discussion

3.1. Sample Data Analysis

Summary statistics of TN and SOM are presented in Table 1. The average concentrations were 1.76 g kg−1 in the paddy field, 1.27 g kg−1 in the dry farmland, and 0.8 g kg−1 in the non-arable land. The ANOVA test showed that the LUT effects on soil TN are significant. This result is consistent with previous studies [21,45]. The reason may be that arable fields have more fertilizer input and organic matter accumulation. Therefore, categorical LUTs should be valuable auxiliary information for the spatial prediction of soil TN in this study.
The Pearson’s correlation coefficient (r) was 0.92 for SOM and TN and 0.91 for SOM and the residual of TN. These statistics indicate that the SOM is also valuable auxiliary information if denser sample data are available, and should be incorporated into kriging models for the spatial prediction of soil TN.

3.2. Determination of the Optimal Auto-Variograms and Cross-Variograms

The medians of θ ( u ) , calculated based on leave-one-out cross-validation, are presented in Table 2 and Table 3. The medians of θ ( u ) , calculated based on the traditionally-used Matheron estimator, are all considerably less than 0.455. The reason may be that the Matheron estimator usually overestimates the prediction variance. The medians of θ ( u ) , calculated based on the robust Genton auto-variogram estimator and the M&G cross-variogram estimator, are all closest to 0.455. Therefore, the above two robust estimators were used for the spatial prediction of soil TN.

3.3. Variogram Analysis

Due to the fact that no apparent anisotropy was found from the sample data, experimental auto- and cross-variograms were estimated omni-directly in this study. By fitting experimental variograms, parameters of the auto- and cross-variogram models that were used for the four kriging models are presented in Table 4. The experimental variogram of the TN residual data is fitted by a spherical model, and all other experimental variograms and cross-variograms are fitted by exponential models. The nugget/sill ratio has often been used as a criterion to describe the spatial autocorrelation of an environmental variable or the spatial cross-correlation of two environmental variables [46,47]. The nugget/sill ratios of the auto-variogram models for TN, SOM, and their residuals range from 22.22 to 42.12%, showing a moderate spatial auto-correlation. The nugget/sill ratio of the cross-variogram model between TN and SOM is 20.33%, showing a moderate spatial cross-correlation. In addition, the residual data of the soil TN has a lower nugget/sill ratio than the original data. The reason may be that the residual data obtain better spatial structure characteristics after removing the LUT effects. Therefore, both SOM and LUTs are closely related to soil TN and should be used as auxiliary information for the spatial prediction of soil TN.

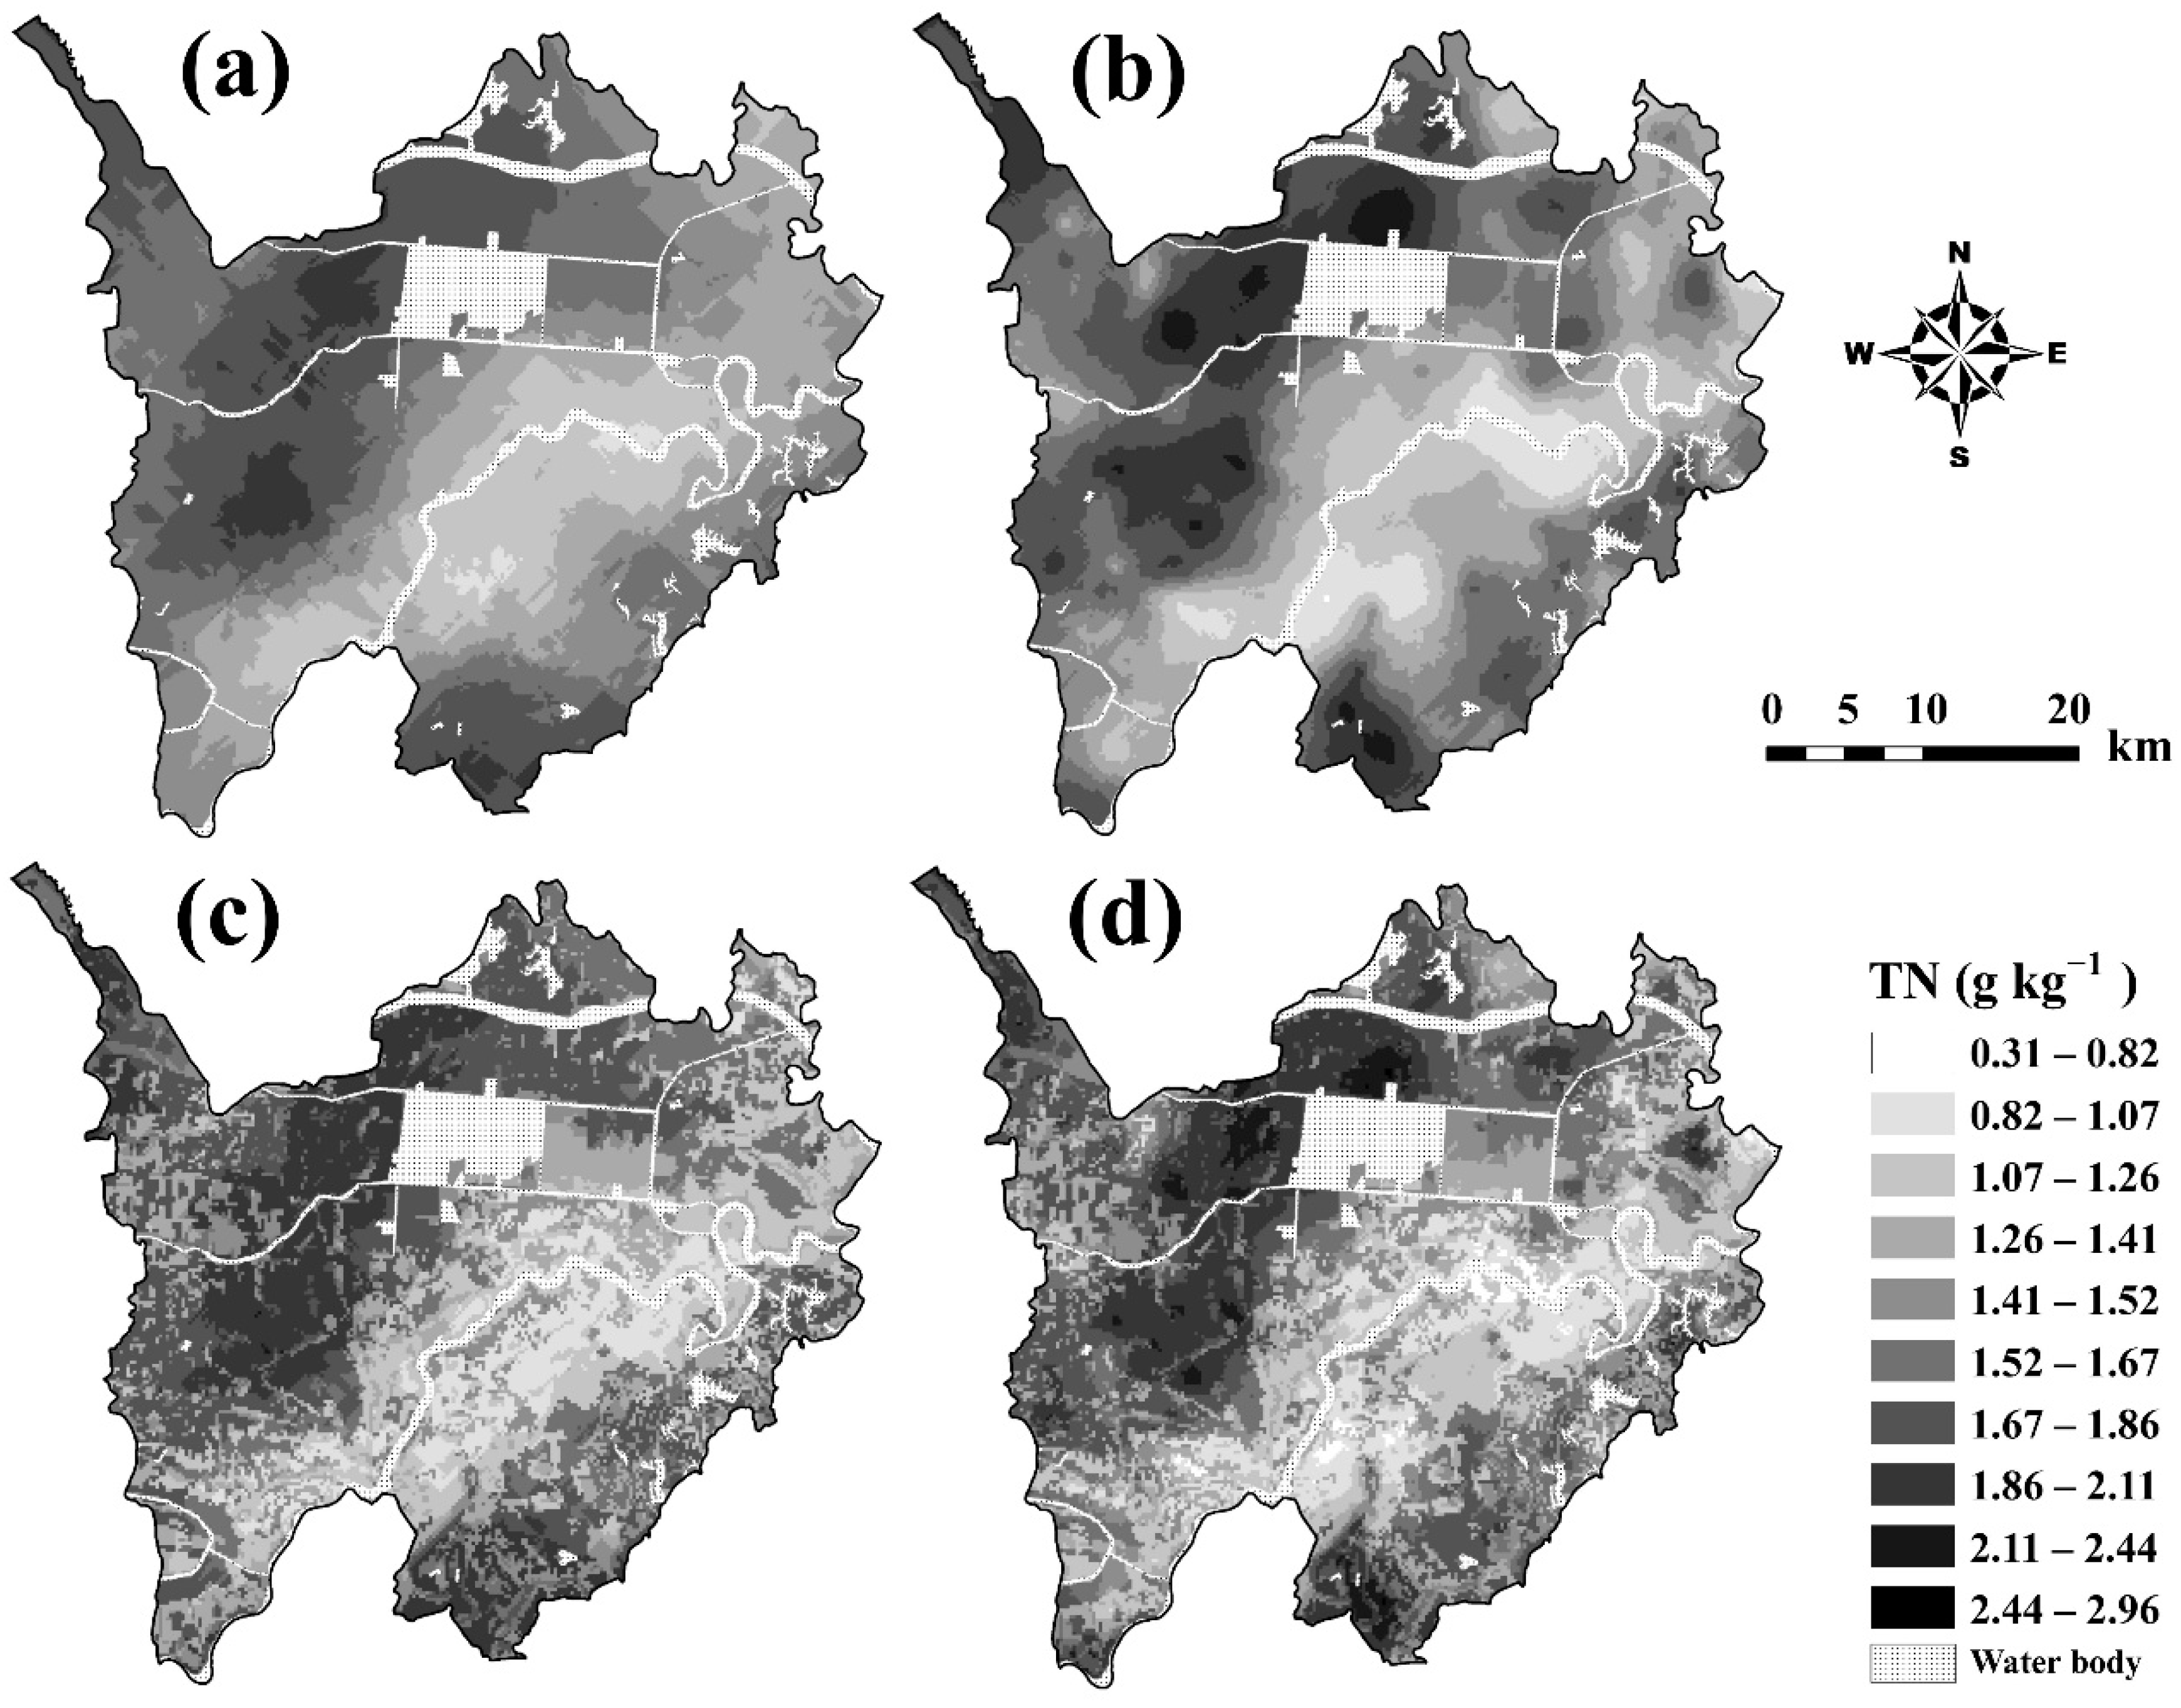
3.4. Spatial Distribution Patterns of Soil Total Nitrogen

The spatial distribution patterns of soil TN, predicted by the four kriging methods, are presented in Figure 3. All the maps show similar general spatial distribution patterns, with a lower concentration mainly occurring in the mid-south region along a river, and a higher concentration mainly appearing in the northwest region of the study area. Among the four maps, the TN distributions that were predicted by OK and RCoK are smoother than those predicted by RRK and RRCoK. The smoothing effect is a widely known characteristic of kriging interpolation, which may overestimate low values and underestimate high values [23,48,49]. In this study, the LUT effect on the soil TN was effectively preserved by RRK and RRCoK. In the top-left corner of the study area, where no sample data were available, higher TN concentrations, which were predicted by RRK and RRCoK, appear in paddy fields, and lower TN concentrations, which were predicted by RRK and RRCoK, appear in dry farmlands. However, the spatial distribution patterns of the soil TN concentrations predicted by OK and RCoK are smooth, regardless of the LUTs (Figure 1 and Figure 3).

3.5. Prediction Accuracy Analysis

Validation indices for the four spatial prediction methods (OK, RCoK, RRK, and RRCoK) are presented in Table 5. RRCoK obtained the highest spatial prediction accuracy (MAE = 0.22 and RMSE = 0.29), while the traditionally-used OK obtained the lowest spatial prediction accuracy (MAE = 0.45 and RMSE = 0.51). The relative improvement of accuracy over OK was 43.14% for RRCoK, 33.33% for RRK, and 29.41% for RCoK.
In this study, LUTs and SOM improved the spatial prediction accuracy of TN, and their joint use further improved the prediction accuracy. LUTs have a better effect than SOM when they are used individually. Increasing the number of SOM samples may further improve the prediction accuracy of TN. The combined effect of LUT and SOM in RRCoK is not equal to the sum of the effect of LUT in RRK or the effect of SOM data in RCoK. A major reason could be that there may be some redundant information between LUT and SOM.
Appropriate spatial prediction methods can make more effective use of sample data [12,13]. However, the amount of information input is one of the most important factors that limits spatial prediction accuracy. It is worth noting that a new comprehensive categorical variable could be obtained through GIS spatial overlay analysis, if there are multiple related categorical variables. Therefore, RRCoK could apply to the cases where multiple categorical and point auxiliary variables are involved simultaneously. In addition, three important factors should be considered in the selection of auxiliary information: (i) the selection of data closely related with the target variable; (ii) the data being inexpensively measured or obtained (e.g., existing data); (iii) the data being exhaustive or more densely sampled.
In this study, both LUTs and SOM can be easily obtained, so they are used as auxiliary information in the spatial prediction of soil TN. In a large-scale regional soil survey, the huge financial and human cost is usually one of the primary considerations. In this case, the fusion of auxiliary information regarding different spatial scales (category and point auxiliary data) is extremely important for the high-precision spatial prediction of target soil properties. Therefore, RRCoK is an effective method for the mapping of soil properties at a regional scale.

4. Conclusions

This study first quantified the LUT effect on soil TN in Hanchuan County, China. Next, the relationship between soil TN and the auxiliary SOM was explored. Then, RRCoK was proposed for the spatial prediction of soil TN. Finally, its spatial prediction accuracy was compared with that of ordinary kriging (OK), robust cokriging (RCoK), and robust residual kriging (RRK). Results show that: (i) both LUT and SOM are closely related to soil TN; (ii) by incorporating SOM, the relative improvement accuracy of RCoK over OK was 29.41%; (iii) by incorporating LUTs, the relative improvement accuracy of RRK over OK was 33.33%; (iv) RRCoK obtained the highest spatial prediction accuracy (RI = 43.14%). Therefore, the recommended method, RRCoK, can effectively incorporate category and point auxiliary data together for the high-accuracy spatial prediction of soil properties. This method may be applicable to spatially predicting other soil properties that are influenced by categorical and point auxiliary variables.

Author Contributions

Conceptualization, M.Q.; methodology, M.Q.; software, X.G.; validation, M.Q. and X.G.; formal analysis, X.G.; investigation, H.L.; data curation, H.L.; writing—original draft preparation, M.Q.; writing—review and editing, M.Q.; visualization, H.L.; supervision, Y.Z. and B.H.; project administration, Y.Z. and B.H.; funding acquisition, M.Q. All authors have read and agreed to the published version of the manuscript.

Funding

This work was financially supported by the National Natural Science Foundation of China [41771249]; the Knowledge Innovation Program of Institute of Soil Science, Chinese Academy of Sciences [ISSASIP1623]; and the Youth Innovation Promotion Association, CAS [2018348].

Institutional Review Board Statement

Not applicable.

Informed Consent Statement

Not applicable.

Data Availability Statement

Not applicable.

Conflicts of Interest

The authors declare no conflict of interest.

References

  1. Li, Y.; Zhang, J. Agricultural diffuse pollution from fertilisers and pesticides in China. Water Sci. Technol. 1999, 39, 25–32. [Google Scholar] [CrossRef]
  2. Nikièma, P.; Buckley, K.E.; Enns, J.M.; Qiang, H.; Akinremi, O.O. Effects of liquid hog manure on soil available nitrogen status, nitrogen leaching losses and wheat yield on a sandy loam soil of western Canada. Can. J. Soil Sci. 2013, 93, 573–584. [Google Scholar] [CrossRef]
  3. Carpenter, S.R.; Caraco, N.F.; Correll, D.L.; Howarth, R.W.; Sharpley, A.N.; Smith, V.H. Nonpoint pollution of surface waters with phosphorus and nitrogen. Ecol. Appl. 1998, 8, 559–568. [Google Scholar] [CrossRef]
  4. Lu, P.; Su, Y.; Niu, Z.; Wu, J. Geostatistical Analysis and Risk Assessment on Soil Total Nitrogen and Total Soil Phosphorus in the Dongting Lake Plain Area, China. J. Environ. Qual. 2007, 36, 935–942. [Google Scholar] [CrossRef] [PubMed]
  5. Ma, J.; Chen, X.; Huang, B.; Shi, Y.; Chi, G.; Lu, C. Utilizing water characteristics and sediment nitrogen isotopic features to identify non-point nitrogen pollution sources at watershed scale in Liaoning Province, China. Environ. Sci. Pollut. Res. 2015, 22, 2699–2707. [Google Scholar] [CrossRef]
  6. Smith, K.A.; Jackson, D.R.; Pepper, T.J. Nutrient losses by surface run-off following the application of organic manures to arable land. 1. Nitrogen. Environ. Pollut. 2001, 112, 41–51. [Google Scholar] [CrossRef]
  7. Wu, L.; Gao, J.-E.; Ma, X.-Y.; Li, D. Application of modified export coefficient method on the load estimation of non-point source nitrogen and phosphorus pollution of soil and water loss in semiarid regions. Environ. Sci. Pollut. Res. 2015, 22, 10647–10660. [Google Scholar] [CrossRef]
  8. Qu, M.; Wang, Y.; Huang, B.; Zhao, Y. Spatial uncertainty assessment of the environmental risk of soil copper using auxiliary portable X-ray fluorescence spectrometry data and soil pH. Environ. Pollut. 2018, 240, 184–190. [Google Scholar] [CrossRef]
  9. Li, J.; Heap, A.D. A review of comparative studies of spatial interpolation methods in environmental sciences: Performance and impact factors. Ecol. Inform. 2011, 6, 228–241. [Google Scholar] [CrossRef]
  10. Tutmez, B.; Hatipoglu, Z. Comparing two data driven interpolation methods for modeling nitrate distribution in aquifer. Ecol. Inform. 2010, 5, 311–315. [Google Scholar] [CrossRef]
  11. Burgess, T.M.; Webster, R. Optimal Interpolation and Isarithmic Mapping of Soil Properties. J. Soil Sci. 1980, 31, 333–341. [Google Scholar] [CrossRef]
  12. Veronesi, F.; Schillaci, C. Comparison between geostatistical and machine learning models as predictors of topsoil organic carbon with a focus on local uncertainty estimation. Ecol. Indic. 2019, 101, 1032–1044. [Google Scholar] [CrossRef]
  13. Đurđević, B.; Jug, I.; Jug, D.; Bogunović, I.; Vukadinović, V.; Stipešević, B.; Brozović, B. Spatial variability of soil organic matter content in Eastern Croatia assessed using different interpolation methods. Int. Agrophys. 2019, 33, 31–39. [Google Scholar] [CrossRef]
  14. Qu, M.; Chen, J.; Huang, B.; Zhao, Y. Resampling with in situ field portable X-ray fluorescence spectrometry (FPXRF) to reduce the uncertainty in delineating the remediation area of soil heavy metals. Environ. Pollut. 2021, 271, 116310. [Google Scholar] [CrossRef] [PubMed]
  15. Weindorf, D.C.; Bakr, N.; Zhu, Y. Advances in portable X-ray fluorescence (PXRF) for environmental, pedological, and agronomic applications. Adv. Agron. 2014, 128, 1–45. [Google Scholar] [CrossRef]
  16. Rouillon, M.; Taylor, M.P.; Dong, C. Reducing risk and increasing confidence of decision making at a lower cost: In-situ pXRF assessment of metal-contaminated sites. Environ. Pollut. 2017, 229, 780–789. [Google Scholar] [CrossRef] [PubMed]
  17. Bogunovic, I.; Trevisani, S.; Pereira, P.; Vukadinovic, V. Mapping soil organic matter in the Baranja region (Croatia): Geological and anthropic forcing parameters. Sci. Total Environ. 2018, 643, 335–345. [Google Scholar] [CrossRef] [PubMed]
  18. Bogunovic, I.; Pereira, P.; Coric, R.; Husnjak, S.; Brevik, E.C. Spatial distribution of soil organic carbon and total nitrogen stocks in a karst polje located in Bosnia and Herzegovina. Environ. Earth Sci. 2018, 77, 612. [Google Scholar] [CrossRef]
  19. Liu, T.-L.; Juang, K.-W.; Lee, D.-Y. Interpolating Soil Properties Using Kriging Combined with Categorical Information of Soil Maps. Soil Sci. Soc. Am. J. 2006, 70, 1200–1209. [Google Scholar] [CrossRef]
  20. Qu, M.; Li, W.; Zhang, C.; Wang, S. Effect of Land Use Types on the Spatial Prediction of Soil Nitrogen. GIScience Remote. Sens. 2012, 49, 397–411. [Google Scholar] [CrossRef] [Green Version]
  21. Zhang, Z.; Yu, D.; Shi, X.; Warner, E.; Ren, H.; Sun, W.; Tan, M.; Wang, H. Application of categorical information in the spatial prediction of soil organic carbon in the red soil area of China. Soil Sci. Plant Nutr. 2010, 56, 307–318. [Google Scholar] [CrossRef]
  22. Zhang, J.; Wang, Y.; Qu, M.; Chen, J.; Yang, L.; Huang, B.; Zhao, Y. Source apportionment of soil nitrogen and phosphorus based on robust residual kriging and auxiliary soil-type map in Jintan County, China. Ecol. Indic. 2020, 119, 106820. [Google Scholar] [CrossRef]
  23. Goovaerts, P. Geostatistics for Natural Resources Evaluation; Oxford University Press: New York, NY, USA, 1997. [Google Scholar]
  24. Liao, K.; Xu, S.; Wu, J.; Zhu, Q. Spatial estimation of surface soil texture using remote sensing data. Soil Sci. Plant Nutr. 2013, 59, 488–500. [Google Scholar] [CrossRef]
  25. Vauclin, M.; Vieira, S.R.; Vachaud, G.; Nielsen, D.R. The Use of Cokriging with Limited Field Soil Observations. Soil Sci. Soc. Am. J. 1983, 47, 175–184. [Google Scholar] [CrossRef]
  26. Wu, C.; Wu, J.; Luo, Y.; Zhang, L.; DeGloria, S.D. Spatial Prediction of Soil Organic Matter Content Using Cokriging with Remotely Sensed Data. Soil Sci. Soc. Am. J. 2009, 73, 1202–1208. [Google Scholar] [CrossRef]
  27. Zhang, R.; Shouse, P.; Yates, S. Use of Pseudo-Crossvariograms and Cokriging to Improve Estimates of Soil Solute Concentrations. Soil Sci. Soc. Am. J. 1997, 61, 1342–1347. [Google Scholar] [CrossRef]
  28. Wu, J.; Norvell, W.A.; Hopkins, D.G.; Smith, D.B.; Ulmer, M.G.; Welch, R.M. Improved Prediction and Mapping of Soil Copper by Kriging with Auxiliary Data for Cation-Exchange Capacity. Soil Sci. Soc. Am. J. 2003, 67, 919–927. [Google Scholar] [CrossRef]
  29. Chen, J.; Qu, M.; Zhang, J.; Xie, E.; Zhao, Y.; Huang, B. Improving the spatial prediction accuracy of soil alkaline hydrolyzable nitrogen using GWPCA-GWRK. Soil Sci. Soc. Am. J. 2021, 85, 879–892. [Google Scholar] [CrossRef]
  30. Lv, J. Multivariate receptor models and robust geostatistics to estimate source apportionment of heavy metals in soils. Environ. Pollut. 2019, 244, 72–83. [Google Scholar] [CrossRef] [PubMed]
  31. Wu, C.; Wu, J.; Luo, Y.; Zhang, L.; DeGloria, S.D. Spatial Estimation of Soil Total Nitrogen Using Cokriging with Predicted Soil Organic Matter Content. Soil Sci. Soc. Am. J. 2009, 73, 1676–1681. [Google Scholar] [CrossRef]
  32. Hanchuan County People’s Government, Overview of Hanchuan. 2012. Available online: http://www.hanchuan.gov.cn (accessed on 30 September 2021).
  33. Soil Science Society of China. Methods of Soil Agrochemistry Analysis; Chinese Agriculture Science and Technology Press: Beijing, China, 2000. (In Chinese) [Google Scholar]
  34. Matheron, G. Traité de Géostatistique Appliquée, Tome I: Mémoires du Bureau de Recherches Géologiques et Minières, 14th ed.; Technip: Paris, France, 1962; p. 333. [Google Scholar]
  35. Lark, R.M. A comparison of some robust estimators of the variogram for use in soil survey: Robust variogram estimators. Eur. J. Soil Sci. 2000, 51, 137–157. [Google Scholar] [CrossRef]
  36. Lark, R.M. Two robust estimators of the cross-variogram for multivariate geostatistical analysis of soil properties: Robust estimators of cross-variograms. Eur. J. Soil Sci. 2003, 54, 187–202. [Google Scholar] [CrossRef]
  37. Cressie, N.; Hawkins, D.M. Robust estimation of the variogram: I. J. Int. Assoc. Math. Geol. 1980, 12, 115–125. [Google Scholar] [CrossRef]
  38. Dowd, P.A. The variogram and kriging: Robust and resistant estimators. In Geostatistics for Natural Resources Characterization; Verly, G., David, M., Journel, A.G., Marechal, A., Eds.; Springer: Dordrecht, The Netherlands, 1984; pp. 91–106. ISBN 978-94-010-8157-3. [Google Scholar]
  39. Genton, M.G. Highly Robust Variogram Estimation. Math. Geol. 1998, 30, 213–221. [Google Scholar] [CrossRef]
  40. Deutsch, C.V.; Journel, A.G. GSLIB: Geostatistical Software Library and User’s Guide; Oxford University Press: New York, NY, USA, 1992. [Google Scholar]
  41. Olea, R.A. Geostatistics for Engineers and Earth Scientists; Kluwer Academic Publishers: New York, NY, USA, 1999. [Google Scholar]
  42. Remy, N.; Boucher, A.; Wu, J. Applied Geostatistics with SGeMS: A User’s Guide; Cambridge University Press: New York, NY, USA, 2009. [Google Scholar]
  43. Mishra, U.; Lal, R.; Liu, D.; Van Meirvenne, M. Predicting the Spatial Variation of the Soil Organic Carbon Pool at a Regional Scale. Soil Sci. Soc. Am. J. 2010, 74, 906–914. [Google Scholar] [CrossRef]
  44. Zhang, R.; Warrick, A.W.; Myers, D.E. Improvement of the prediction of soil particle size fractions using spectral properties. Geoderma 1992, 52, 223–234. [Google Scholar] [CrossRef]
  45. Wang, Y.; Zhang, X.; Huang, C. Spatial variability of soil total nitrogen and soil total phosphorus under different land uses in a small watershed on the Loess Plateau, China. Geoderma 2009, 150, 141–149. [Google Scholar] [CrossRef]
  46. Cambardella, C.A.; Moorman, T.B.; Novak, J.M.; Parkin, T.B.; Karlen, D.L.; Turco, R.F.; Konopka, A.E. Field-Scale Variability of Soil Properties in Central Iowa Soils. Soil Sci. Soc. Am. J. 1994, 58, 1501–1511. [Google Scholar] [CrossRef]
  47. Qu, M.; Li, W.; Zhang, C.; Huang, B.; Zhao, Y. Spatially Nonstationary Relationships between Copper Accumulation in Rice Grain and Some Related Soil Properties in Paddy Fields at a Regional Scale. Soil Sci. Soc. Am. J. 2014, 78, 1765–1774. [Google Scholar] [CrossRef]
  48. Lark, R.M.; Webster, R. Geostatistical mapping of geomorphic variables in the presence of trend. Earth Surf. Process. Landf. 2006, 31, 862–874. [Google Scholar] [CrossRef]
  49. Webster, R.; Oliver, M.A. Geostatistics for Environmental Scientists, 2nd ed.; John Wiley & Sons Ltd: Chichester, UK, 2007; ISBN 978-0-470-02858-2. [Google Scholar]
Figure 1. Location of the study area and the land-use type map.
Agronomy 11 02516 g001
Figure 2. Spatial distribution of the sample subsets: validation subset (TN), sample subset I (TN and SOM), and sample subset II (SOM).
Agronomy 11 02516 g002
Figure 3. Spatial distribution patterns of soil TN predicted by (a) OK with 201 soil TN data; (b) RCoK with 201 soil TN data and 402 SOM data; (c) RRK with 201 soil TN data and LUTs; and (d) RRCoK with 201 soil TN data, 402 SOM data, and LUTs.
Agronomy 11 02516 g003
Table 1. Summary statistics a of soil total nitrogen (TN) (g kg−1) and soil organic matter (SOM) (g kg−1) in different sample subsets and land-use types.
PropertySample SubsetLand-UseNumberMinMaxMeanSDCV (%)
TNSubset IAll2010.312.961.460.5537.67
TNSubset IPaddy field1070.542.961.760.5531.25
TNSubset IDry farmland640.312.411.270.4434.65
TNSubset INon-arable land300.632.630.80.5670
TNValidation subsetAll1350.202.991.450.5739.31
SOMSubsets I + IIAll4022.8457.9022.929.4841.36
a Min, minimum; Max, maximum; SD, standard deviation; CV, coefficient of variation.
Table 2. The medians of θ ( u ) , calculated based on leave-one-out cross-validation for determination of the optimal auto-variograms.
Methods aMatheronGentonDowdCressie-Hawkins
RRK0.3220.4430.4350.431
a RRK, robust residual kriging with 201 soil TN data and LUTs.
Table 3. The medians of θ ( u ) , calculated based on leave-one-out cross-validation for determination of the optimal cross-variograms.
Methods aMatheronMVEM&G
RCoK0.3320.4210.456
RRCoK0.3440.4260.453
a RCoK, robust cokriging with 201 soil TN data and 402 SOM data; RRCoK, robust residual cokriging with 201 soil TN data, 402 SOM data, and LUTs.
Table 4. Parameters of the auto- and cross-variograms for different kriging models.
RobustModelNuggetSillNugget/Sill (%)Range (km)
Auto-variograms
TN201NoExponential0.140.354013.11
TN201 *YesExponential0.10.2737.0414.02
R_TN201 *YesExponential0.040.1822.2216.33
SOM402 *YesExponential3583.142.1212.38
Cross-variograms
TN201-SOM402 *YesSpherical0.854.1820.3314.44
R_TN201-SOMR402 *YesSpherical0.613.1819.1811.45
TN201, variogram fitted based on 201 TN data; TN201 *, robust variogram fitted based on 201 TN data; R_TN201 *, robust variogram fitted based on 201 residual data of TN; SOM402 *, robust variogram fitted based on 402 SOM data. TN201-SOM402 *, robust cross-variogram fitted based on 201 TN data and 402 SOM data; R_TN201-SOMR402 *, robust cross-variogram fitted based on 402 SOM data and 201 residual data of TN.
Table 5. Validation indices † for the four spatial prediction methods.
Method ‡MAERMSERI (%)
OK0.450.51-
RCoK0.30.3629.41
RRK0.270.3433.33
RRCoK0.220.2943.14
MAE, absolute mean error; RMSE, root mean square error; RI, relative improvement using OK as the reference. ‡ OK, ordinary kriging with 201 soil TN data; RCoK, robust cokriging with 201 soil TN data and 402 SOM data; RRK, robust residual kriging with 201 soil TN data and LUTs; RRCoK, robust residual cokriging with 201 soil TN data, 402 SOM data, and LUTs.
Publisher’s Note: MDPI stays neutral with regard to jurisdictional claims in published maps and institutional affiliations.

