Article

Current Skills of Students and Their Expected Future Training Needs on Precision Agriculture: Evidence from Euro-Mediterranean Higher Education Institutes

by
Thomas Bournaris
1,*,
Manuela Correia
2,
Alessandro Guadagni
3,
Jeremy Karouta
4,
Anne Krus
5,
Stefania Lombardo
6,
Dimitra Lazaridou
1,
Efstratios Loizou
7,
José Rafael Marques da Silva
2,
Jorge Martínez-Guanter
8,
Anastasios Michailidis
1,
Stefanos Nastis
1,
Aikaterini Paltaki
1,
Maria Partalidou
1,
Manuel Pérez-Ruiz
8,
Ángela Ribeiro
4,
Constantino Valero
5 and
Marco Vieri
6
1
Department of Agricultural Economics, Faculty of Agriculture, Aristotle University of Thessaloniki, 54124 Thessaloniki, Greece
2
Department of Rural Engineering, University of Evora, Largo dos Colegiais 2, 7004-516 Évora, Portugal
3
ValueDo srl, Via Filippo Corridoni 91, 50134 Florence, Italy
4
Spanish National Research Council (CSIC), Center for Automation and Robotics, Calle Serrano 117, 28006 Madrid, Spain
5
Department of Agricultural Engineering, Universidad Politécnica de Madrid, 28040 Madrid, Spain
6
Department of Agricultural, Food Production and Forest Management, University of Florence, P.zza S. Marco, 4, 50121 Firenze, Italy
7
Department of Regional Development and Cross Border Studies, University of Western Macedonia, 53100 Kozani, Greece
8
Área de Ingeniería Agroforestal, Departamento de Ingeniería Aeroespacial y Mecánica de Fluidos, Universidad de Sevilla, C. San Fernando, 4, 41004 Sevilla, Spain
*
Author to whom correspondence should be addressed.
Agronomy 2022, 12(2), 269; https://doi.org/10.3390/agronomy12020269
Submission received: 18 December 2021 / Revised: 13 January 2022 / Accepted: 17 January 2022 / Published: 21 January 2022
(This article belongs to the Special Issue Smart Farming in Service of Modernizing Agriculture)

Abstract

:
This paper set out to explore the precision agriculture (PA)-training needs of students studying in agricultural universities in the Euro-Mediterranean region (Greece, Italy, Portugal and Spain). SPARKLE is a Knowledge Alliance Project, funded by the European Union (EU), and one of its main goals is to narrow the innovation divide between entrepreneurship and the effective application of sustainable PA. During the project, the research conducted in all countries in the Euro-Mediterranean region revealed differences in the PA-training needs of university students. Additionally, this paper set out to explore the socioeconomic characteristics of students that affect their interest and knowledge towards PA. Finally, this paper aimed to understand the scope, present status and strategies for improving PA training in agricultural universities in the Euro-Mediterranean region. The following descriptive statistics and two multivariate analysis techniques were used: Two-Step Cluster Analysis (TSCA) and Categorical Regression (CATREG). Results support the notion that the lack of “PA knowledge/interest” adds to the technological gap amongst university students, slow adoption of PA and lower levels of overall rural economic development. These findings will be used as the fundamental cognition for the development of a joint action plan and several other national plans in the selected regions.

1. Introduction

Agriculture aims to utilize technology to feed the world, by adopting everything from self-driving tractors [1] to sensor technology, artificial intelligence [2] and bioengineering. The agricultural sector should aim to develop new, innovative and sustainable production methods to achieve the sustainable development goals (SDGs). Precision agriculture (PA), has become an indispensable part of the site-specific treatment of agronomic inputs, such as fertilizers, pesticides and irrigation water, in developed countries [3].
Many definitions have been proposed for PA, but the most commonly used definition adopted by the International Society of Precision Agriculture is that PA, or precision farming (PF), is “a management strategy that gathers, processes and analyses temporal-spatial and individual data and combines it with other information to support management decisions according to estimated variability for improved resource use efficiency, productivity, quality, profitability and sustainability of agricultural production”.
PA is a holistic production system that succeeds in costs reduction, quality and quantity yield improvement and decreasing environmental impacts, while managing spatial and temporal variability within the field [4,5,6,7]. PA is one of the main parts of a reduced-input agriculture system that aims to achieve higher profitability along with sustainability [8,9]. PA includes technologies that identify variations within the fields and allow farmers to provide a variable rate of agronomic input instead of a homogenous one [10].
Implementation of PA technologies was at first rapid but later it slowed because of numerous factors, along with the issues posed by the inability to understand how to maximize the power of PA [11]. Say et al. [12] reported that along with the United States (US), which is a leading country, Canada, Australia and some European Union (EU) countries, have adopted PA technologies. Barnes et al. [13] agree with Say et al. [12], pointing out that the adoption of PA technologies in the EU is lower than that of the US or Australia. Moreover, the adoption rate in southeast Europe is slow, considering the high investment cost, no application of new technologies by farmers, no knowledge of PA practices and the small size of farms [9]. Recently, a survey by Bramley and Ouzman [14] mentioned that 60% of EU farmers believed that by 2030 adoption of PA technologies would be accelerated due to the increased use of sensors, software, and wireless connectivity.
The rate of adoption of PA technologies is slow and it has proven to be a long-term process [15]. It is essential to understand the factors that motivate farmers and their perceptions of PA benefits [16]. Tey and Brindal [17] categorized factors influencing the adoption of PA practices into the following seven groups: Socioeconomic, agro-ecological, institutional, informational, farmer perception, behavioral and technological factors. There are many such factors mentioned in the literature, such as high initial investment costs [5,9,11,12,13,18,19], high maintenance costs [5,13,18,19], high learning costs [5], agricultural education [9,11,12,13,19,20], level of current technological adoption [13], complexity of technology [5,18,19], consultants and advisory services [9,11,12,17,19], uncertainty towards outcomes [13,18], farmer’s age [6,9,13,17], farm size [6,9,13,17], household income [13] and soil texture and quality [9,12].
Regarding PA benefits, the literature identified economical [4,8,12,19,21,22], environmental [4,12,19,21,22,23], social [4,21,22] and technical [4,19,21].
Over the last 20 years, many research and development efforts have been made to evaluate PA adoption, training, knowledge gaps and future needs in this production system. In the first two years, Ferguson [24] published an extensive report on a variety of educational resources for producers and advisors on PA. Heiniger et al. [25] found that field days and tours were beneficial in showing the use of PA technologies in the field. At the same time, Kitchen et al. [11] identified the barriers preventing PA adoption and steps to improve PA educational programs. A few years later, McBratney et al. [20] explored the future directions of PA and applied a typology to the possibility of some countries adopting PA. A survey was conducted on the adoption of PA among farmers, advisors, teachers and industry representatives [4]. Kutter et al. [5] analyzed the importance of farmers’ communication and co-operation in the adoption of PA. The next year, a review of the factors influencing farmers to adopt or not adopt PA technologies was published [17]. Say et al. [12] identified the factors that can influence the application of PA in both developed and developing countries. In the same year, Paustian and Theuvsen [6] presented a wide range of farm characteristics and farmer demographics in relation to PA adoption. Later, Kountios et al. [22] explored the educational needs and attitudes of farmers in Greece towards PA. A recent study, identified 10 key milestones as the basis for future adoption efforts regarding PA [26]. Additionally, a literature review was performed recently to explore all the factors affecting PA adoption [27].
There is no doubt that a lack of knowledge and expertise on PA issues is one of the main barriers to the successful implementation of PA [20], along with other barriers such as major capital expenditure, data protection and incompatibility [28]. The rapid growth of PA has led to the need for farmer and professional agribusiness education [29]. The diffusion of PA practices is supported by educational programs and is promoted to farmers through extension services [22]. Therefore, it is crucial for the PA sector to develop a well-qualified workforce [30]. Educators of PA must keep up with the continuous changes of PA and properly adjust the education programs. Additionally, they need to provide high-quality education material, so students can get new abilities and skills [11]. “The more highly qualified students in PA, the more support they will be able to provide to farmers and increase the adoption of PA practices,” [30]. Moreover, Pocknee et al. [31] suggest that in the future, long-distance education programs will be more common. The key to successfully implementing PA is the improvement of education programs of students and the presence of advisory services for farmers [4]. Along with training-course improvement, significant attention should be given to the assessment of training needs [32]. However, it remains problematic how and if agriculture universities’ course syllabus is nowadays able to train the educators of PA according to the labor market needs.
The main aim was to classify university students according to their attitudes, training needs and knowledge/interest towards PA. This study attempted to reveal the differences in PA training needs between university students in the Euro-Mediterranean region. Secondly, this study aimed to investigate the socio-economic characteristics of students that affect their interest and knowledge towards PA. Finally, its goal was to identify the scope, present status, and strategies for improving PA training in agricultural universities in the Euro-Mediterranean region. The descriptive statistics method and two multifactorial analysis techniques, Two-Step Cluster Analysis (TSCA) and Categorical Regression (CATREG) were used for our investigation.
The remainder of this paper is organized as follows. The material and methods section describes the research on data collection, the formulation of the questionnaire, validity, and reliability tests, as well as the methodology followed for data analysis. The next section presents the results of both the descriptive statistics analysis and multivariate statistical analysis. Finally, we present the conclusions of the study.

2. Materials and Methods

Our field research stems from the SPARKLE project (Sustainable Precision Agriculture: Research and Knowledge for Learning how to be an agri-Entrepreneur) between four partner countries, namely, Greece, Spain, Italy, and Portugal [33]. Data were collected with purposive sampling with questionnaires from students at a school of Agricultural Engineering. In the proposal of the SPARKLE project and in the work packages there were specifications for the research sample in terms of countries, universities, number of respondents/questionnaires, percentages by gender and percentages by educational level. The questionnaire designed was common to all countries. The questionnaire was designed and formatted based on the literature [7,22,30,32,34,35] and consisted of three main sections. The first section had six questions about the level of knowledge and skills of the students in PA. The second section consisted of nine questions about the educational gap, training needs and preferred training method. In the first two sections of the questionnaire, all questions except one were rated on a 5-point Likert scale. In the third and final section, there were three demographic questions. The average time required to complete the questionnaires was approximately 10 min.

2.1. Data Collection

Figure 1 bellow illustrates the four southern European Mediterranean countries, namely, Greece, Spain, Portugal and Italy, where the data were collected from students of school of Agricultural Engineering.
We implemented the questionnaire in each of the countries listed, and at the universities listed below:
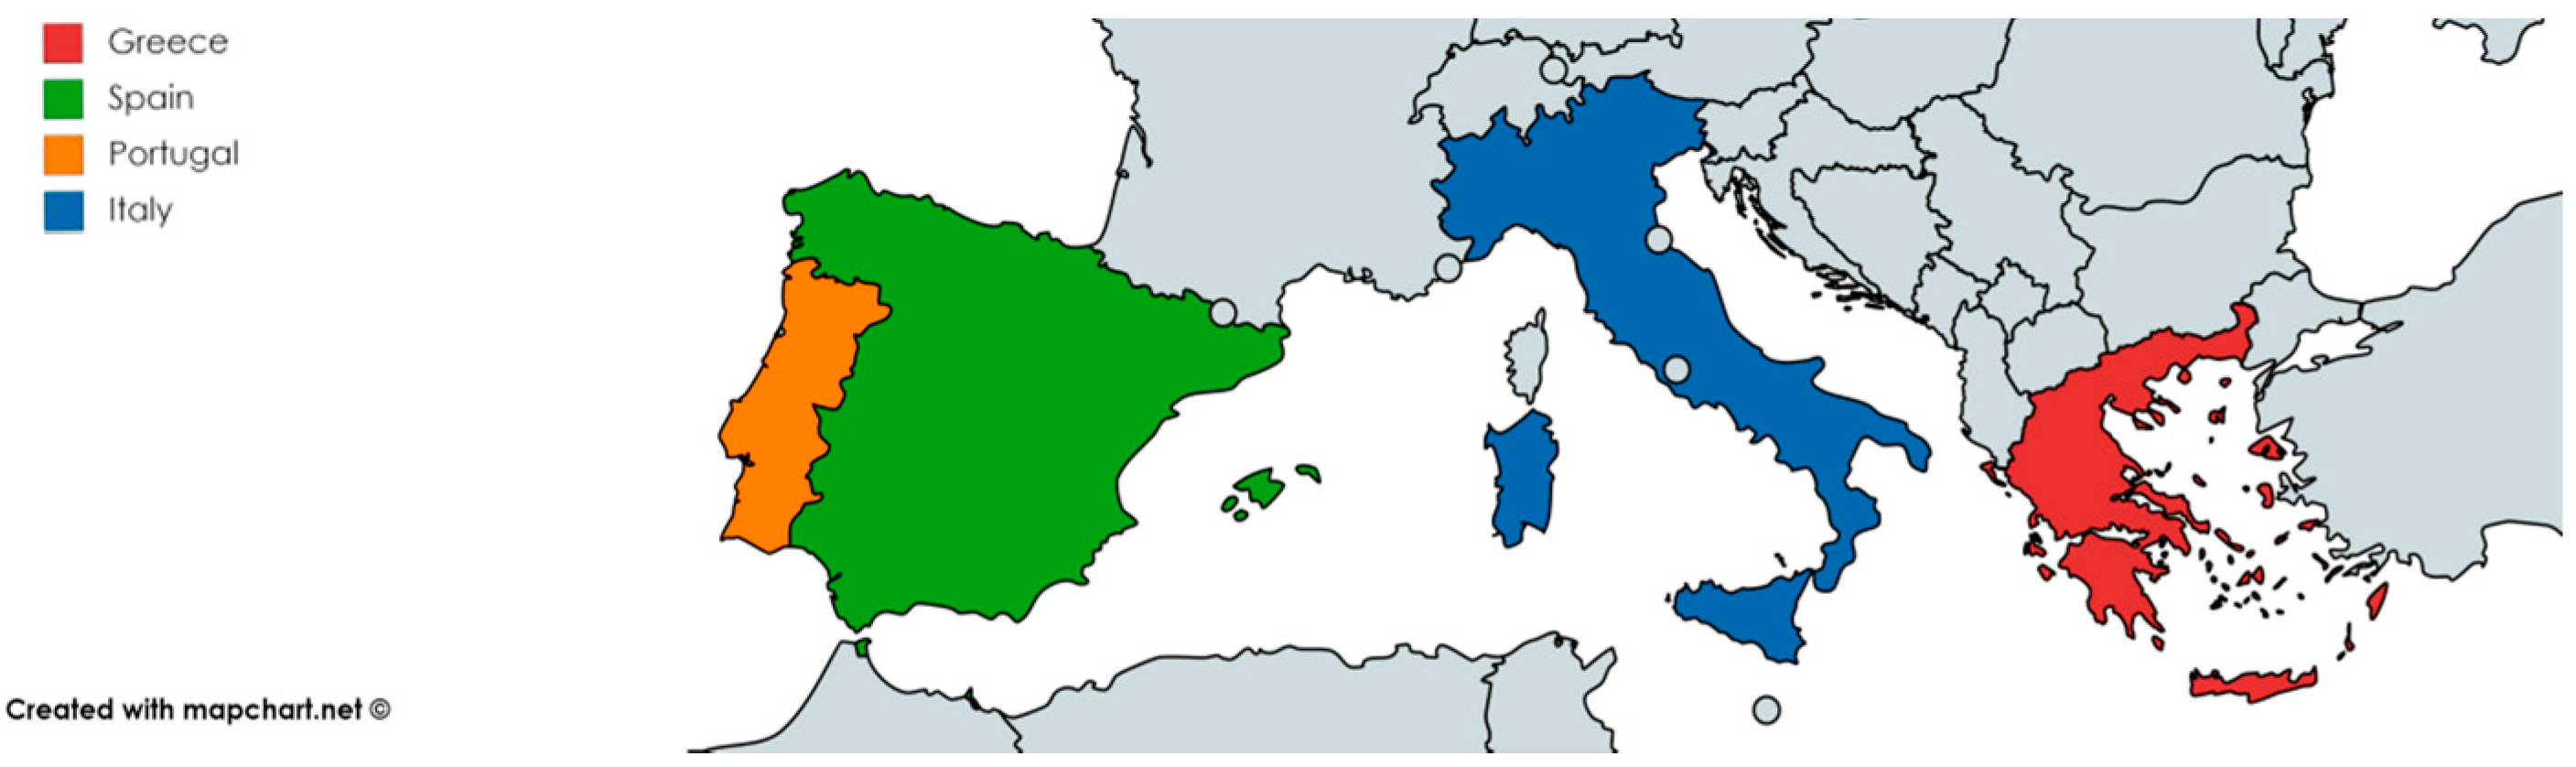
  • In Greece, 100 students participated in the questionnaire at the following universities: (a) Aristotle University of Thessaloniki (Faculty of Agriculture, Forestry and Natural Environment); (b) Alexander Technological Educational Institute of Thessaloniki (School of Agricultural Technology and of Food and Nutrition Technology); (c) Technological Educational Institute of Thessaly (School of Agricultural Technology and of Food and Nutrition Technology).
  • In Italy, 100 students were surveyed, from the University of Florence, Tuscany, Italy.
  • In Portugal, 144 students participated in the questionnaire, in five Higher Education Institutions: (a) Escola Superior Agrária de Santarém; (b) Universidade de Trás-os-Montes e Alto Douro; (c) Escola Superior Agrária de Beja; (d) Universidade de Évora; and e) Escola Superior Agrária de Elvas.
  • In Spain, 192 students were surveyed at the following universities: (a) Universidad Politécnica de Madrid (UPM); (b) Technical School of Agri-food and Environment; (c) School of Agriculture Engineering at University of Sevilla; and (d) Universitat Politécnica de Valéncia.

2.2. Validity and Reliability Tests
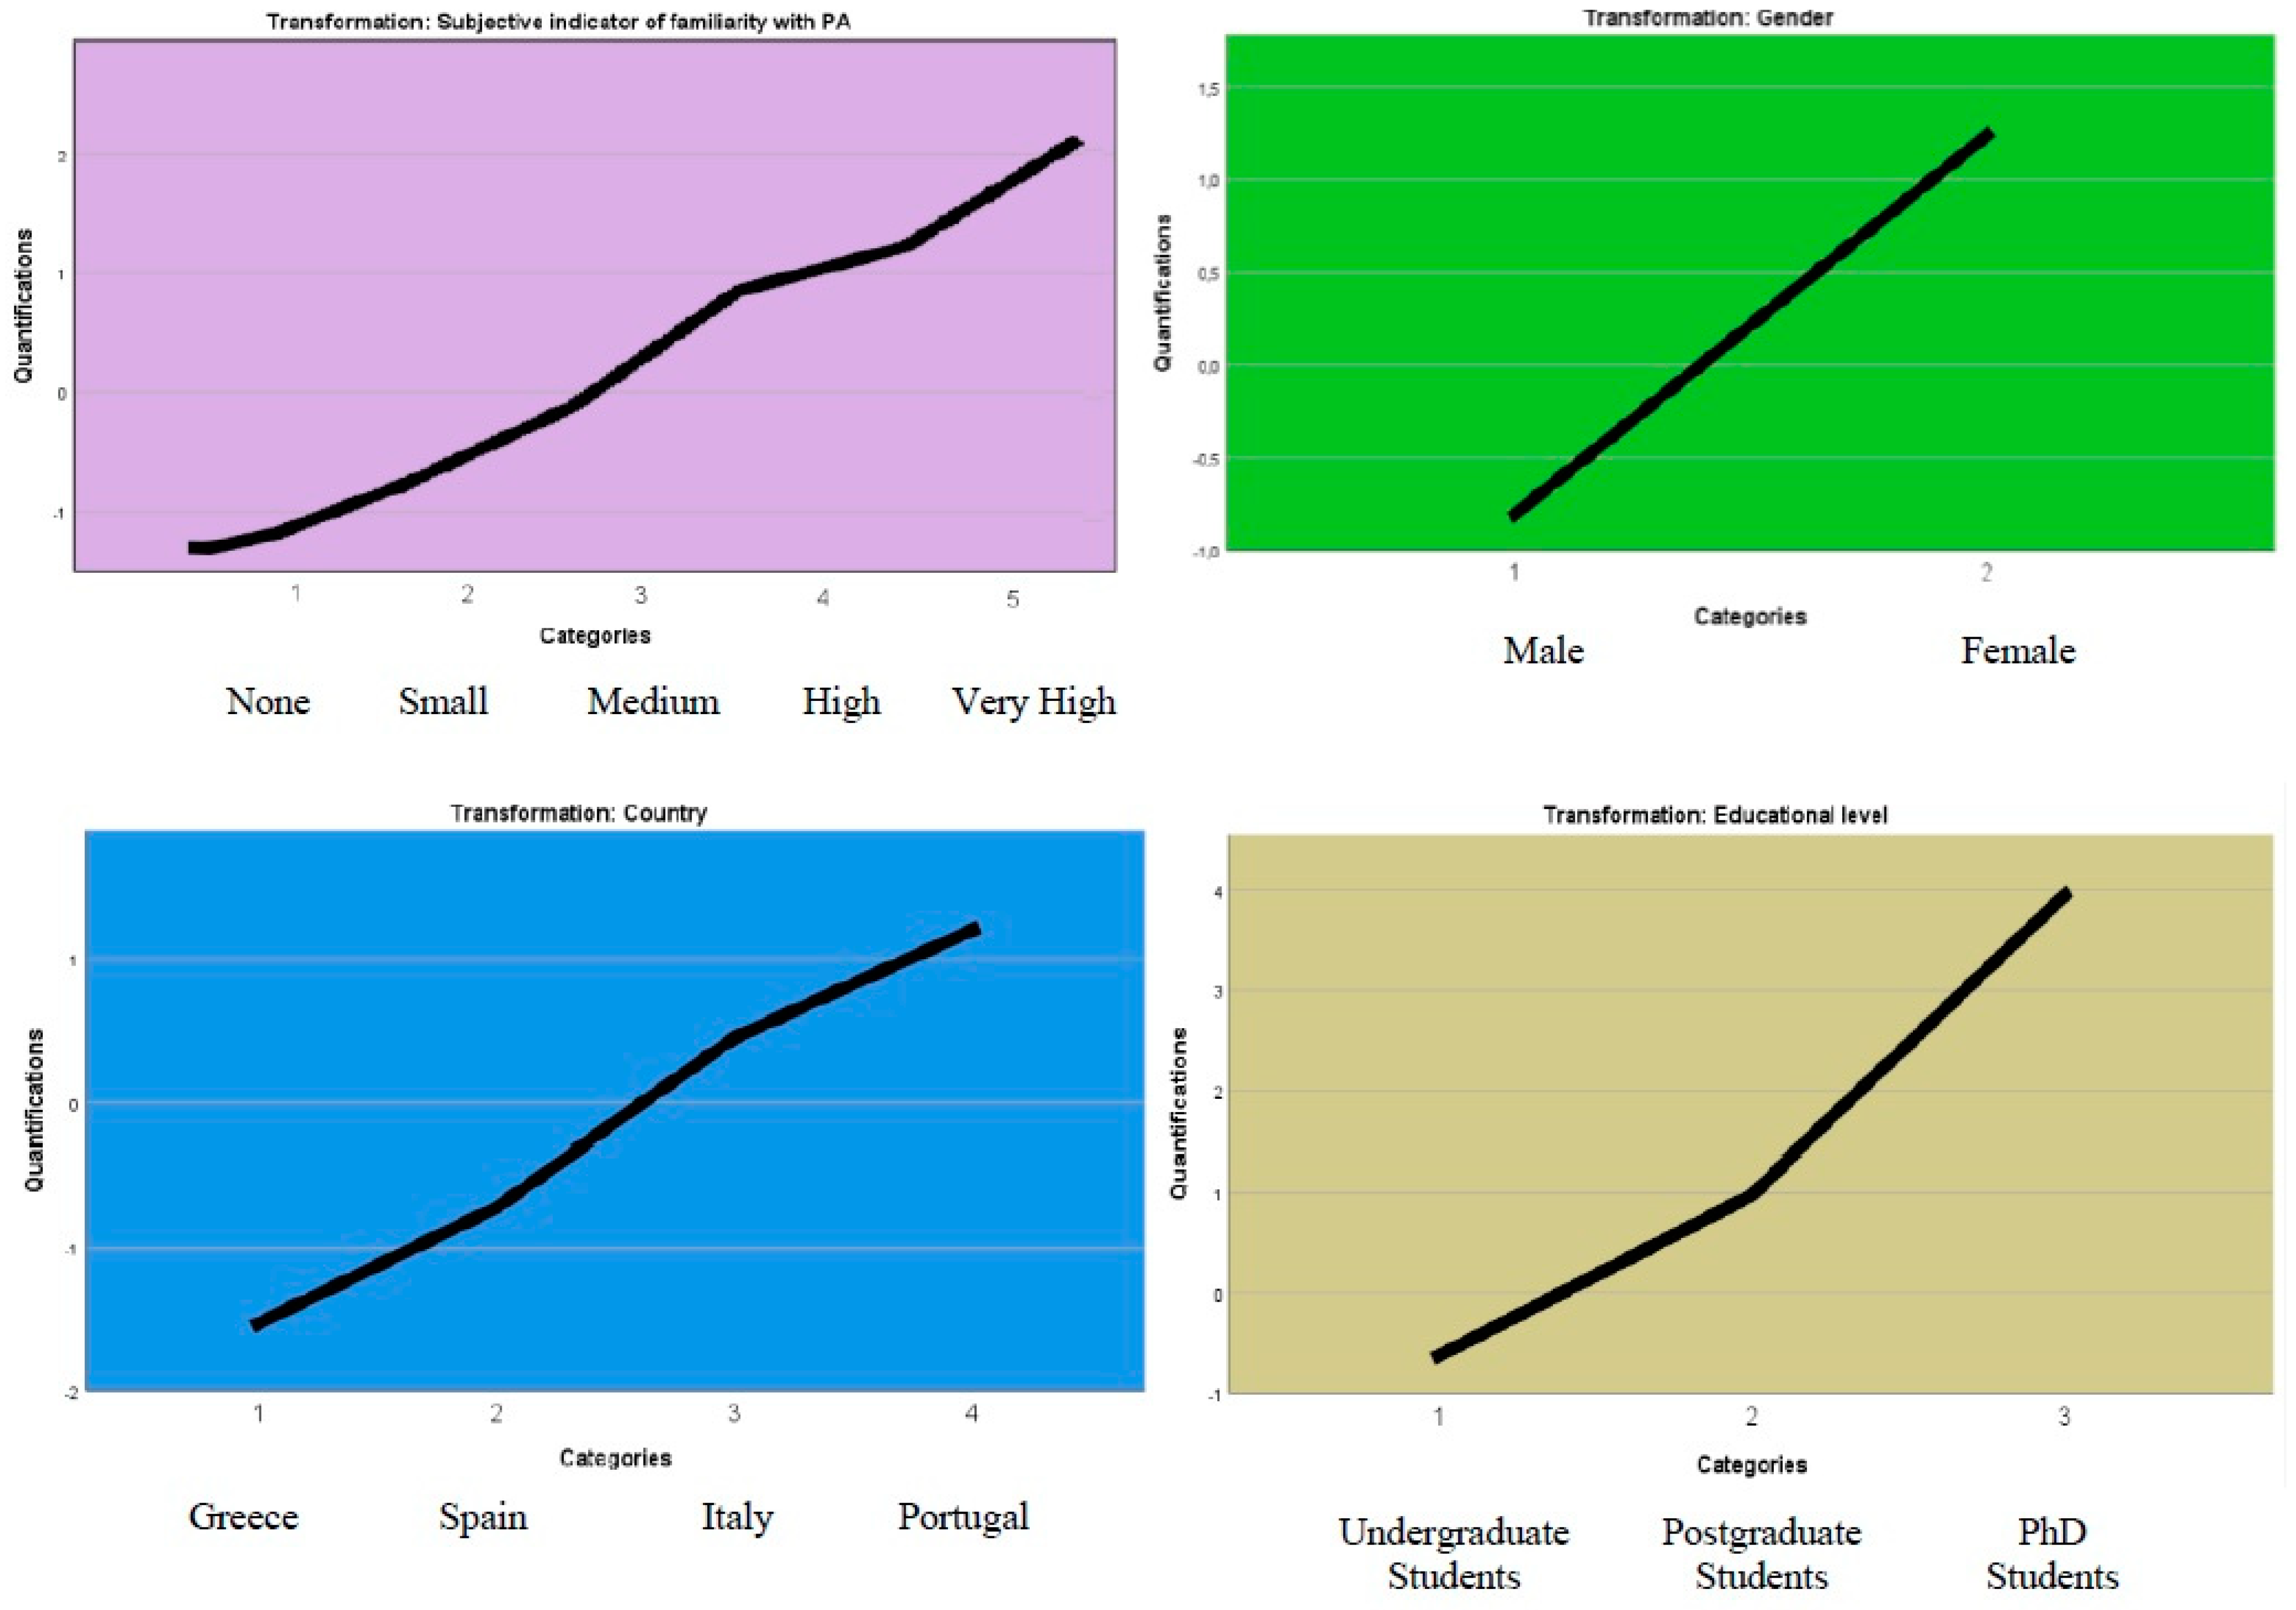
The concepts of validity and reliability are important in any study, whether qualitative or quantitative. Validity represents the degree to which research findings accurately reflect reality [36]. In this research, three education experts reviewed the questionnaires before distributing them to the students. Using the typical 5-point Likert scale of agreement, experts validated each question and statement. When the evaluation of an education expert was less than 4 then he suggested an alternative formulation of the question. This process was repeated until an agreement was reached, for each question and each statement, with an average score greater than or equal to 4.
Reliability is also important in the analysis, especially in the case of the multivariate statistical analysis [37]. Reliability seeks to minimize the errors and biases of research instruments such that they consistently produce the same results whenever repeated, irrespective of the researcher, research conditions or respondents involved [36,38,39]. In total, 114 variables were analyzed in order to define their relationship with each other and to identify questionnaires that had to be excluded. To ensure the reliability of this research, the Cronbach’s alpha test was used to determine the consistency, accuracy, stability, and objectivity of the research tools. The Cronbach’s α coefficient was found to be 0.944, indicating a reliable scale. In addition, Friedman’s two-way analysis of variance with x2 = 2.68 (α = 0.00) and Hotelling T2 = 1.24 (F = 28.12 and α = 0.00) indicated a significant differentiation of the average values of the data. Initially, 580 questionnaires were collected, of which 536 were considered valid. The average response rate was 7.6% for the total survey sample. It is worth noting that after this step, none of the 536 questionnaires were rejected from the analysis.

2.3. Data Analysis

This paper includes an interesting innovative methodological mix, employing both descriptive statistics (frequency, percentage, and mean value) and multivariable analyses (TSCA and CATREG). In this paper, both summary statistics and multivariate analysis techniques were performed with Statistical Package for Social Sciences (SPSS). Specifically, a CATREG model was used to investigate differences in respondents’ familiarity with PA, and a TSCA model was used to classify students into discernible clusters, with similar levels of PA knowledge/interest. The selected methodological framework allows for the identification of students who have different levels of perception and knowledge of PA and the explanation of the factors that influence these levels.
In more detail, TSCA is used as a tool to handle large datasets and create clusters of data that would otherwise not be visible [37]. The cluster analysis process involves the two following stages: the first is to group the observations into small sub-clusters and the second to treat the new sub-clusters as separate observations. The final number of clusters can be specified from the beginning or automatically generated by the analysis [40]. Compared to a conventional cluster analysis methods, TSCA is designed for large dataset analysis, can be applied to continuous and categorical variables and can determine the optimal number of clusters [41].
According to Van der Kooij and Meulman [42,43], a CATREG model is used to highlight the possible relationships between students’ familiarity with PA, and a set of independent variables. It is a modern regression technique, more holistic and efficient than the most commonly used models, especially when using both qualitative and quantitative data [37,44].

3. Results

3.1. Descriptive Statistics Analysis

The first analysis conducted was the descriptive statistics analysis, which outlines the profile of the sample. From this analysis we can also compare students’ current skills and future needs in PA, and highlight the most important training needs and the most efficient training methods. Moreover, we can gage the willingness of students to attend online courses with payment.
Table 1 provides a short description of the research sample. Greece’s sample was 100 questionnaires constituting 18.7% of the total sample. Italy’s sample was the same as Greece’s. Spain’s sample was 192 questionnaires constituting 35.8% of the total sample. Portugal’s sample was 144 questionnaires constituting 26.9% of the total sample. Regarding the gender of the sample, 60.4% were male while 39.0% were female. The mean value of age is almost 24 years, while the average standard deviation of the sample was 5.65. Most of the respondents were undergraduate students, 65.7%, followed by postgraduate students, 31.2%, and finally, PhD candidates with 2.6%.
All students were asked to assess their own knowledge on PA as “small” to “medium” based on the 5-point Likert scale (1 = none, 5 = very high). They also showed a high level of consensus on the requirement of learning new skills to use PA. Table 2 shows a comparison between the current skills/expertise of students and their expected future training needs. Greek students’ current skills are higher in terms of marketing while Spanish students have better knowledge of local ecosystems. Portuguese and Italian students’ current skills are higher in terms of sustainability issues. In addition, the expected educational needs of the Greeks and Portuguese are in innovation management and the Spanish and Italians are in sustainability issues.
The specification and ranking of training needs per country have great importance. Table 3 presents the mean value in each country, from which interesting results are obtained. It can be seen immediately that the ability to choose the right technologies or solutions is a common training requirement for all countries. Furthermore, low waste production is high for students from Spain, Portugal and Italy, with mean value 4.38, 4.24 and 4.08, respectively. Greek and Italian students highlight the need for education in local ecosystems, whereas Spanish and Portuguese students emphasize the importance of acquiring knowledge about working with processed data. Finally, Greek students rank the need for training on issues of solidarity and responsibility for the community as high, with a mean value of 4.11.
As shown in Table 4, “Agriculturalist’s visit in farms”, “Field demonstrations” and “Practical courses/exercise” were ranked higher among training methods, with mean values of 4.45, 4.27 and 4.27, respectively. The most interactive training methods are ranked higher in the table, in contrast with the more passive methods, which are lower.
Regarding the appropriate time for training in PA, most of the students considered it to be before the implementation of the PA, during courses at the university. Table 5 shows the student’s willingness to pay for open online courses (MOOCs) offered by leading universities and independent educational institutions. Almost half of the Greek, Spanish and Portuguese students were willing to pay for these courses, with 41%, 42% and 38%, respectively, whereas 40% of the Italian students, uniquely, expressed neutral willingness. Finally, unanswered questionnaires were again observed in Portugal and Spain, at 4% and 1%, respectively.

3.2. Multivariate Statistical Analysis

The second analysis conducted was the multivariate statistical analysis. CATREG was used in order to investigate differences in respondents’ familiarity with PA and to highlight possible relations between PA knowledge/interest and a set of other selected independent categorical variables. TSCA was used to classify students into discernible clusters, with similar levels of PA knowledge/interest. Both CATREG and TSCA have been employed to discover statistical relationships that were not apparent through the descriptive statistical analysis and to segment the students according to their levels of PA knowledge/interest and, thus, to facilitate personalized training tailored to the needs of the students in each cluster.
Table 6 presents a set of 14 variables used for the creation of the dependent variable of the CATREG model. Each variable received a value from 1 to 5, where 1 = none and 5 = very high. Thus, the set of 14 independent variables constitutes a multi-thematic one “Subjective indicator of familiarity with PA”. In particular, the average scores for each respondent were used as the numerical values of the dependent variable, “Subjective indicator of familiarity with PA”. This is a very important variable, created from the data of Table 6, which presents the level of interest and knowledge of each respondent in sustainable precision-farming issues.
Then, to further analyze the above indicator (dependent variable), CATREG was performed for the total sample (536 questionnaires) to identify how this familiarity was influenced by a set of respondents’ personal characteristics as well as other variables (Table 7). Additionally, it yielded a R2 value equal to 0.866, indicating a significant relationship between the “Subjective indicator of familiarity with PA” and the group of selected predictors (86.6% of the variance in the “Subjective indicator of familiarity with PA” rankings is explained by the regression of the optimally transformed variables used). The F statistic value 3.430 with α = 0.00 indicated a consistently well-performing model.
The relative-importance measures [45] of the independent variables show that the most influential factors predicting “Subjective familiarity with PA” correspond to socio-demographic characteristics and, particularly, to the following factors, in a hierarchical order: (a) country (17.1%); (b) educational level (11.5%); (c) gender (11.0%). Additionally, the additional significance of the independent variables is estimated at 39.60%.
A better prediction of “Subjective indicator of familiarity with PA” can be derived from the transformed plots (Figure 2) of the main independent variables that present the higher relative importance measures (more than 0.100). In these plots, the original category values are displayed on the x-axis and the obtained category quantifications on the y-axis. The higher quantification received by the original category, the greater the contribution of this category in the interpretation of the dependent variable (“Subjective indicator of familiarity with PA”). The most influential factors predicting the “Subjective indicator of familiarity with PA” are “Gender” (1 = Male, 2 = Female), “Country” (1 = Greece, 2 = Spain, 3 = Italy & 4 = Portugal), and “Educational Level” (1 = Undergraduate students, 2 = Postgraduate students, 3 = PhD candidates). This means that the most familiar students with PA were the female PhD candidates from Portugal.
TSCA was applied to classify the sample into different clusters of students and to investigate the different levels of familiarity with PA. This methodology allows for the verification or rejection of generalizations of Rogers’ diffusion of innovations theory [46]. The analysis provided the optimal solution of five clusters. Thus, the clusters were formed as follows:
  • The first cluster included 78 respondents with 15.8%.
  • The second cluster included 114 respondents with 23.1%.
  • The third cluster included 84 respondents with 17.0%.
  • The fourth cluster comprised the majority of respondents, 138, with 27.9%.
  • The fifth cluster included 80 respondents with 16.2%.
  • Finally, 42 respondents were not included in any cluster as they exhibited individual behavior and were not grouped.
Depending on the predictors of familiarity with PA, it is evident that the first cluster mainly comprises the “laggards” (mean value of familiarity with PA = 1.94). The second cluster comprises the “innovators” (mean value of familiarity with PA = 3.10), the third cluster comprises the “early adopters” (mean value of familiarity with PA = 2.91), the fourth cluster comprise the “early majority” (mean value of familiarity with PA = 2.44) and the fifth cluster comprise the “late majority” (mean value of familiarity with PA = 1.99).
Table 8 presents the socioeconomic characteristics and the mean value of familiarity with PA of the members of each cluster. The “innovators” are male, postgraduate students, from Italy and almost 26 years old. The “early adopters” are male, undergraduate students, from Portugal and almost 25 years old. The “early majority” are male, undergraduate students, from Spain and almost 23 years old. The “late majority” are male, undergraduate students, from Greece and almost 23 years old. The “laggards” are female, undergraduate students, from Spain and almost 23 years old (Table 8).
It is obvious that there is a very strong relationship between “age” and “familiarity with PA” but also between “country” and “familiarity with PA”. Indeed, older students from Italy and Portugal are more familiar with the issues of PA.

4. Conclusions and Discussion

This paper presented an evaluation of the knowledge and skills of students in agricultural universities in Greece, Spain, Portugal and Italy in order to investigate their training needs in PA. The questionnaires, conducted with the participation of students of various universities in these 4 countries, provide detailed insights on the opinions from the perspective of a university students in the field of agriculture. Students from all countries seem to think that they are undertrained in PA skills. Moreover, almost all survey participants showed a high level of consensus on the requirement of learning new skills in order to adopt PA, especially in agronomic and technological skills. According to data analysis, the most important problem highlighted by students is “Choosing the right technologies or solutions”. The research presents and proposes some knowledge-sharing mechanisms and training methods to tackle problems and to design effective and efficient teaching material. It is also noted that almost half of the Greek, Portuguese and Spanish students are willing to pay for MOOCs online courses. In addition, the results showed that the preferred time for PA training is “during university courses”, that is, prior to its implementation.
The multivariate statistical analysis carried out provided an opportunity to discover statistical relationships that were not apparent through the descriptive statistical analysis conducted initially. For this purpose, a new variable, “Subjective indicator of familiarity with PA”, was created, which acted as the dependent variable in the analysis of multiple independent variables. A CATREG model was used to analyze the characteristics of this new significant variable. According to the model, the most important variables predicting the “Subjective indicator of familiarity with PA” are “gender”, “country” and “educational level”. Through analysis, it was found that women, PhD candidates from Portugal, are the most familiar with PA (having a very strong statistical relationship) in terms of knowledge and interest. Results of the TSCA support the generalizations of Rogers’ diffusion of innovation theory [46,47]. In particular, TSCA creates 5 clusters for which the characteristics are presented above. It also emphasizes a strong relationship between “age”, “country” and “familiarity with PA”.
Through the results of the research, we propose the creation of separate training programs for each cluster created. Otherwise, the generalized and shared education of all groups of students remains untargeted to the specific needs of each group, providing little benefit in their comprehensive training. In fact, data analysis clarifies the specific training needs of each cluster that the training material should focus on. The main results of this paper can be correlated with those of Saleh and Man [32]. They can also be compared the studies by Kountios et al. [22], who recognized the low level of familiarity of students with PA and the importance of intensifying education in order to promote PA adoption. Due to the observed interest of the students in PA, it appears that the curricula of the departments of agriculture should be improved and capability of graduates working in the science of PA should be increased. Adding courses related to PA either through its technology practices or through current legislation is necessary to promote all the relevant knowledge before it can be applied. In addition, it is suggested that courses added at the undergraduate, postgraduate and PhD level should include both theoretical and practical elements, so that students better understand their working environment and the needs of farmers. Additionally, specialized seminars can be used as a form of training whereby useful skills that offer new business opportunities in the future can be acquired.
Due to the continuous development of technology and the agricultural economy, PA is constantly evolving. This means that all universities should be fully aware of these changes to be able to adapt their curricula and integrate improvements in technology, communications, applicable law and science in general. In addition, through the education of students, farmers will benefit indirectly, as the more qualified students will become the future agriculturalists who will advise and support them in making decisions about their farms. Thus, it is equally important for students to acquire educational and entrepreneurial skills to assist in the smooth transition of farmers to digital farming and the use of PA technologies.

Author Contributions

Conceptualization, M.V., A.M., A.P., M.P. and D.L.; methodology, S.N., A.M., M.V. and S.L.; software, A.P. and E.L.; validation, J.R.M.d.S., C.V., M.C. and A.K.; formal analysis, T.B.; investigation, Á.R., J.K. and A.G.; resources, M.V. and S.L.; data curation, M.V.; writing—original draft preparation, A.P.; writing—review and editing, A.M., J.M.-G. and M.P.-R.; visualization, E.L.; supervision, A.M.; project administration, M.V.; funding acquisition, M.V. All authors have read and agreed to the published version of the manuscript.

Funding

The authors would like to acknowledge the cooperation of the partners of “SPARKLE—Sustainable Precision Agriculture: Research and Knowledge for Learning how to be an agri-Entrepreneur”, Project co-funded by the Erasmus + program of the European Union. Utilizing the results of the research, a Moodle e-learning platform with international relevance has been created with the aim of training students on PA issues. The platform is operational from February 2020 and can be found here: http://sparkle-project.eu/moodle/ (accessed on 17 December 2021).

Institutional Review Board Statement

Not applicable.

Informed Consent Statement

Not applicable.

Conflicts of Interest

The authors declare no conflict of interest.

References

  1. Pérez-Ruiz, M.; Gonzalez-de-Santos, P.; Ribeiro, A.; Fernandez-Quintanilla, C.; Peruzzi, A.; Vieri, M.; Tomic, S.; Agüera, J. Highlights and preliminary results for autonomous crop protection. Comput. Electron. Agric. 2015, 110, 150–161. [Google Scholar] [CrossRef]
  2. Partel, V.; Charan Kakarla, S.; Ampatzidis, Y. Development and evaluation of a low-cost and smart technology for precision weed management utilizing artificial intelligence. Comput. Electron. Agric. 2019, 157, 339–350. [Google Scholar] [CrossRef]
  3. Aragó Galindo, P.; Granell, C.; Molin, P.G.; Huerta Guijarro, J. Participative site-specific agriculture analysis for smallholders. Precis. Agric. 2012, 13, 594–610. [Google Scholar] [CrossRef] [Green Version]
  4. Reichardt, M.; Jürgens, C. Adoption and future perspective of precision farming in Germany: Results of several surveys among different agricultural target groups. Precis. Agric. 2009, 10, 73–94. [Google Scholar] [CrossRef]
  5. Kutter, T.; Tiemann, S.; Siebert, R.; Fountas, S. The role of communication and co-operation in the adoption of precision farming. Precis. Agric. 2011, 12, 2–17. [Google Scholar] [CrossRef]
  6. Paustian, M.; Theuvsen, L. Adoption of precision agriculture technologies by German crop farmers. Precis. Agric. 2017, 18, 701–716. [Google Scholar] [CrossRef]
  7. Kountios, G.; Ragkos, A.; Bournaris, T.; Papadavid, G.; Michailidis, A. Educational needs and perceptions of the sustainability of precision agriculture: Survey evidence from Greece. Precis. Agric. 2018, 19, 537–554. [Google Scholar] [CrossRef]
  8. Zhang, N.; Wang, M.; Wang, N. Precision agriculture—A worldwide overview. Comput. Electron. Agric. 2002, 36, 113–132. [Google Scholar] [CrossRef]
  9. Alexandridis, T.K.; Andrianopoulos, A.; Galanis, G.; Kalopesa, E.; Dimitrakos, A.; Katsogiannos, F.; Zalidis, G. An Integrated Approach to Promote Precision Farming as a Measure Toward Reduced-Input Agriculture in Northern Greece Using a Spatial Decision Support System. In Comprehensive Geographic Information Systems; Elsevier Inc.: Amsterdam, The Netherlands, 2017; pp. 315–352. ISBN 978-0-12-804793-4. [Google Scholar]
  10. Pallottino, F.; Biocca, M.; Nardi, P.; Figorilli, S.; Menesatti, P.; Costa, C. Science mapping approach to analyze the research evolution on precision agriculture: World, EU and Italian situation. Precis. Agric. 2018, 19, 1011–1026. [Google Scholar] [CrossRef]
  11. Kitchen, N.R.; Snyder, C.J.; Franzen, D.W.; Wiebold, W.J. Educational Needs of Precision Agriculture. Precis. Agric. 2002, 3, 341–351. [Google Scholar] [CrossRef]
  12. Say, S.M.; Keskin, M.; Sehri, M.; Sekerli, Y.E. Adoption of Precision Agriculture Technologies in Developed and Developing Countries. In Proceedings of the International Science and Technology Conference (ISTEC), Berlin, Germany, 16–18 August 2017; pp. 41–49. [Google Scholar]
  13. Barnes, A.P.; Soto, I.; Eory, V.; Beck, B.; Balafoutis, A.; Sánchez, B.; Vangeyte, J.; Fountas, S.; van der Wal, T.; Gómez-Barbero, M. Exploring the adoption of precision agricultural technologies: A cross regional study of EU farmers. Land Use Policy 2019, 80, 163–174. [Google Scholar] [CrossRef]
  14. Bramley, R.G.V.; Ouzman, J. Farmer attitudes to the use of sensors and automation in fertilizer decision-making: Nitrogen fertilization in the Australian grains sector. Precis. Agric. 2019, 20, 157–175. [Google Scholar] [CrossRef]
  15. Miller, N.J.; Griffin, T.W.; Ciampitti, I.A.; Sharda, A. Farm adoption of embodied knowledge and information intensive precision agriculture technology bundles. Precis. Agric. 2019, 20, 348–361. [Google Scholar] [CrossRef]
  16. Thompson, N.M.; Bir, C.; Widmar, D.A.; Mintert, J.R. Farmer Perceptions Of Precision Agriculture Technology Benefits. J. Agric. Appl. Econ. 2019, 51, 142–163. [Google Scholar] [CrossRef] [Green Version]
  17. Tey, Y.S.; Brindal, M. Factors influencing the adoption of precision agricultural technologies: A review for policy implications. Precis. Agric. 2012, 13, 713–730. [Google Scholar] [CrossRef]
  18. Ferrández-Pastor, F.; García-Chamizo, J.; Nieto-Hidalgo, M.; Mora-Pascual, J.; Mora-Martínez, J.; Ferrández-Pastor, F.J.; García-Chamizo, J.M.; Nieto-Hidalgo, M.; Mora-Pascual, J.; Mora-Martínez, J. Developing Ubiquitous Sensor Network Platform Using Internet of Things: Application in Precision Agriculture. Sensors 2016, 16, 1141. [Google Scholar] [CrossRef] [Green Version]
  19. Clark, B.; Jones, D.G.; Kendall, H.; Taylor, J.; Cao, Y.; Li, W.; Zhao, C.; Chen, J.; Yang, G.; Chen, L.; et al. A proposed framework for accelerating technology trajectories in agriculture: A case study in China. Front. Agric. Sci. Eng. 2018, 5, 485–498. [Google Scholar] [CrossRef]
  20. McBratney, A.; Whelan, B.; Ancev, T.; Bouma, J. Future Directions of Precision Agriculture. Precis. Agric. 2005, 6, 7–23. [Google Scholar] [CrossRef]
  21. Far, S.T.; Rezaei-Moghaddam, K. Impacts of the precision agricultural technologies in Iran: An analysis experts’ perception & their determinants. Inf. Process. Agric. 2018, 5, 173–184. [Google Scholar] [CrossRef]
  22. Kountios, G.; Bournaris, T.; Papadavid, G.; Michailidis, A.; Klavdianou, A.P.; Papadaki-Klavdianou, A. Exploring educational needs of young farmers in precision agriculture in Serres, Greece, and the perspective of innovative agricultural educational programs. J. Int. Bus. Entrep. Dev. 2018, 11, 4–14. [Google Scholar] [CrossRef]
  23. Rezaei-Moghaddam, K.; Salehi, S. Agricultural specialists’ intention toward precision agriculture technologies: Integrating innovation characteristics to technology acceptance model. Afr. J. Agric. Res. 2010, 5, 1191–1199. [Google Scholar]
  24. Ferguson, R.B. Educational resources for precision agriculture. Precis. Agric. 2002, 3, 359–371. [Google Scholar] [CrossRef]
  25. Heiniger, R.W.; Havlin, J.L.; Crouse, D.A.; Kvien, C.; Knowles, T. Seeing is believing: The role of field days and tours in precision agriculture education. Precis. Agric. 2002, 3, 309–318. [Google Scholar] [CrossRef]
  26. Yost, M.A.; Sudduth, K.A.; Walthall, C.L.; Kitchen, N.R. Public–private collaboration toward research, education and innovation opportunities in precision agriculture. Precis. Agric. 2019, 20, 4–18. [Google Scholar] [CrossRef]
  27. Pathak, H.S.; Brown, P.; Best, T. A systematic literature review of the factors affecting the precision agriculture adoption process. Precis. Agric. 2019, 20, 1292–1316. [Google Scholar] [CrossRef]
  28. Markus, G.; Sebastian Schleicher, K.E. Barriers to Adoption of Smart Farming Technologies. In Proceedings of the 14th International Conference on Precision Agriculture, Montreal, QC, Canada, 24–27 June 2018; pp. 9–21. [Google Scholar]
  29. Balafoutis, A.T.; Beck, B.; Fountas, S.; Tsiropoulos, Z.; Vangeyte, J.; Van Der Wal, T.; Soto-Embodas, I.; Gómez-Barbero, M.; Pedersen, S.M.; Balafoutis, A.T.; et al. Smart Farming Technologies—Description, Taxonomy and Economic Impact. In Precision Agriculture: Technology and Economic Perspectives; Springer: Cham, Switzerland, 2017; pp. 21–77. [Google Scholar] [CrossRef] [Green Version]
  30. Fausti, S.; Erickson, B.; Clay, S.; Schumacher, L.; Clay, D.; Skouby, D. Educator Survey: Do institutions provide the precision agriculture education needed by agribusiness? J. Agribus. 2018, 36, 41–63. [Google Scholar]
  31. Pocknee, S.; Kvien, C.; Rains, G.; Fiez, T.; Durfey, J.; Mask, P. Web-based educational programs in precision agriculture. Precis. Agric. 2002, 3, 327–340. [Google Scholar] [CrossRef]
  32. Saleh, J.M.; Man, N.B. Training Requirements of Agricultural Extension Officers Using Borich Needs Assessment Model. J. Agric. Food Inf. 2017, 18, 110–122. [Google Scholar] [CrossRef]
  33. Bournaris, T.; Mattas, A.; Michailidis, A.; Andujar, D.; Correia, M.; De Pascale, V.; Díaz, M.; Diezma, B.; Guadagni, A.; Karamouzi, E.; et al. SPARKLE e-Learning Platform for Sustainable Precision Agriculture. HAICTA 2020, 2761, 334–339. [Google Scholar]
  34. Movahedi, R.; Nagel, U.J. Identifying Required Competencies for the Agricultural Extension and Education Undergraduates. J. Agric. Sci. Technol. 2012, 14, 727–742. [Google Scholar]
  35. Bournaris, T. Evaluation of e-Government Web Portals: The Case of Agricultural e-Government Services in Greece. Agronomy 2020, 10, 932. [Google Scholar] [CrossRef]
  36. Neuman, W.L. Social Research Methods: Qualitative and Quantitative Approaches, 7th ed.; Bacon, P.A., Ed.; Sage: Boston, MA, USA, 2011. [Google Scholar]
  37. Michailidis, A.; Partalidou, M.; Nastis, S.A.; Papadaki-Klavdianou, A.; Charatsari, C. Who goes online? Evidence of internet use patterns from rural Greece. Telecommun. Policy 2011, 35, 333–343. [Google Scholar] [CrossRef]
  38. Sarantakos, S. Social Research; MacMillan Press LTD: Hampshire, UK, 2005. [Google Scholar]
  39. Loizou, E.; Michailidis, A.; Chatzitheodoridis, F. Investigating the drivers that influence the adoption of differentiated food products: The case of a greek urban area. Br. Food J. 2013, 115, 917–935. [Google Scholar] [CrossRef]
  40. Trpkova, M.; Tevdovski, D. Twostep cluster analysis: Segmentation of largest companies in Macedonia. In Proceedings of the Challenges for Analysis of the Economy, the Businesses, and Social Progress International Scientific Conference, Szeged, Hungary, 19–21 November 2009; Kovács, P., Szép, K., Katona, T., Eds.; Unidocument Kft: Szeged, Hungary, 2009; pp. 302–320. [Google Scholar]
  41. Şchiopu, D. Applying TwoStep Cluster Analysis for Identifying Bank Customers’ Profile. Buletinul 2010, LXII, 66–75. [Google Scholar]
  42. Van der Kooij, A.J.; Meulman, J. MURALS: Multiple regression and optimal scoring using alternating least squares. In Advances in Statistical Software; Bandilla, W., Faulbaum, F., Eds.; Lucius & Lucius: Stuttgart, Germany, 1997; pp. 99–106. [Google Scholar]
  43. Chatzitheodoridis, F.; Kontogeorgos, A.; Liltsi, P.; Apostolidou, I.; Michailidis, A.; Loizou, E. Small women’s cooperatives in less favored and mountainous areas under economic instability. Agric. Econ. Rev. 2016, 17, 63–79. [Google Scholar]
  44. Lazaridou, D.; Michailidis, A.; Trigkas, M. Socio-economic factors influencing farmers’ willingness to undertake environmental responsibility. Environ. Sci. Pollut. Res. 2019, 26, 14732–14741. [Google Scholar] [CrossRef]
  45. Pratt, J. Dividing the indivisible: Using simple symmetry to partition variance explained. In Proceedings of the Second International TAMPERE Conference in Statistics, Tampere, Finland, 1–4 July 1987; Pukkika, T., Puntanen, S., Eds.; University of Tampere: Tampere, Finland, 1987; pp. 245–260. [Google Scholar]
  46. Rogers, E.M. Diffusion of Innovations, 4th ed.; The Free Press: New York, NY, USA, 1995; ISBN 0028740742. [Google Scholar]
  47. Loizou, E.; Chatzitheodoridis, F.; Michailidis, A.; Tsakiri, M.; Theodossiou, G. Linkages of the energy sector in the greek economy: An input-output approach. Int. J. Energy Sect. Manag. 2015, 9, 393–411. [Google Scholar] [CrossRef]
Figure 1. Study map territorial integrity.
Agronomy 12 00269 g001
Figure 2. Transformed plots.
Agronomy 12 00269 g002
Table 1. Description of the sample.
Distribution of the Sample by CountryNumber of QuestionnairesValue
Greece10018.7%
Italy10018.7%
Spain19235.8%
Portugal14426.9%
Socioeconomic Characteristics
Male32460.4%
Female20939.0%
Age (mean value) 23 years and 11 months
Undergraduate students35265.7%
Postgraduate students16731.2%
PhD candidates142.6%
Table 2. Current skills and future needs in PA.
SkillsCurrent SkillsExpected Training Needs
GreeceSpainPortugalItalyGreeceSpainPortugalItaly
ΜΜΜΜΜΜΜΜ
Technological expertise2.462.72.782.083.363.933.43.24
Legislative expertise1.861.791.91.783.273.413.43.02
Local community leadership2.242.032.241.833.283.443.272.91
Business management skills2.52.32.331.743.53.563.352.95
Innovation management2.472.312.351.793.673.963.423.38
Marketing skills2.672.562.52.013.623.433.232.99
Sustainability2.442.923.082.783.574.043.383.55
Local ecosystems2.392.932.982.723.353.963.43.25
M = Mean value, 1 = None, 5 = Very high.
Table 3. Most important training needs.
CountryTraining NeedsM
GreeceKnowledge of local ecosystems4.33
How to choose right technologies or solutions4.13
Sense of solidarity and responsibility for the community 4.11
SpainLow waste production4.38
How to choose right technologies or solutions4.32
Working with processed data4.18
PortugalHow to choose right technologies or solutions4.30
Low waste production4.24
Working with processed data4.15
ItalyHow to choose right technologies or solutions4.10
Low waste production4.08
Knowledge of local ecosystems4.04
M = Mean value, 1 = Not important, 5 = Very important.
Table 4. Efficiency of training methods.
Training MethodsMSt.dev.
Agriculturalist’s visit in farms4.450.18
Field demonstrations4.270.37
Practical courses/exercise4.270.12
Educational excursions4.150.12
Farmer’s visits to the agriculturalist’s office3.890.15
Education at the individual level/individual contact3.810.09
Short-term seminars3.670.15
Lectures at physical meetings3.610.23
Agricultural journals3.600.17
Online communication with agriculturalist3.590.21
Creating newsgroups3.490.17
Online courses/e-learning3.330.12
Helpline instructions3.190.07
Articles in newspapers3.150.19
Television broadcasts3.110.30
Information in the form of forms or brochures 2.900.17
Broadcasts on radio2.860.12
DVD2.860.36
M = Mean value, St.dev. = Standard deviation, 1 = Not efficient, 5 = Very efficient.
Table 5. Willingness to pay for massive open online courses (MOOCs).
GreeceSpainPortugalItalyAverage
%%%%%
Extremely unlikely9.006.004.008.006.75
Unlikely6.0016.0017.0020.0014.75
Neutral27.0029.0033.0040.0032.35
Likely41.0042.0038.0029.0037.5
Extremely likely17.006.004.003.007.50
Not answered/I do not know-1.004.00-2.50
Table 6. Set of Independent variables of the CATEREG Model.
Level of Knowledge of PA
Level of current technological expertise (knowledge of new technology and equipment)
Level of current legislative expertise (knowledge of laws, regulations and provisions)
Level of current local community leadership (knowledge of opinion leadership/detection of the influencers in a local community)
Level of current business management skills (do you have skills/expertise in business management?)
Level of current innovation management (do you have skills/expertise in innovation management?)
Level of current marketing skills (do you have skills/expertise in marketing?)
Level of current sustainability (knowledge of sustainability issues and circular agriculture)
Level of current local ecosystems (knowledge of local ecosystems)
Level of knowledge of soft PA
Level of knowledge of hard PA
Level of interest of hard PA
Level of interest of soft PA
Level of knowledge of intelligent machinery (precision seeding, section control for sprayers)
Ordinal variables.
Table 7. Relative Important Measures.
CorrelationsImportanceTolerance
Zero-OrderPartialPartAfter
Transformation
Before
Transformation
Gender−0.200−0.209−0.1740.1100.8950.880
Age0.1460.1330.1100.052 0.8530.756
Educational level0.1980.2160.1800.115 0.8730.742
Country0.2050.2730.2320.171 0.6950.682
Willing to pay for a MOOCs0.1520.0700.0570.0280.8370.842
When do you think is the best time to get training in PA?−0.067−0.099−0.0810.0170.9380.923
PA increases productivity0.2110.0660.0540.044 0.6140.591
Life-long learning would be necessary to keep up with the speed of PA0.1750.0430.0350.0220.7180.624
PA contributes to lower production costs0.2240.0820.0670.073 0.3840.478
PA results in improved income0.162−0.065−0.053−0.040 0.4250.488
PA requires high investment0.039−0.065−0.053−0.0070.7660.577
PA requires great economic risk0.0450.0380.0310.0050.6550.673
PA primary products are safe0.1520.1440.1190.062 0.7770.642
PA primary products are of high nutritional value0.091−0.104−0.086−0.0310.5810.467
PA protects the environment0.1900.0870.0710.055 0.5370.410
PA improves the sustainable management of land parcels0.0100.1380.1140.0040.7320.741
I prefer conventional farming methods0.038−0.152−0.126−0.0180.6350.565
PA requires relevant information0.1310.0410.0340.0160.6870.502
PA requires relevant education/training0.1040.1060.0870.0310.7750.750
PA requires young age−0.142−0.196−0.1630.081 0.7280.724
I cannot familiarize myself with PA methods0.154−0.1720.1420.0980.4480.356
Successful examples of other farmers influence my adoption of PA methods0.046−0.114−0.094−0.0200.4300.353
PA requires innovation from farmers0.0660.0590.0480.0120.6820.704
Business consultants influence my adoption of PA methods0.1220.1040.0850.041 0.5780.592
Government/public incentives influence my adoption of PA techniques0.1320.0950.0780.037 0.6770.658
PA is now necessary0.1320.1290.1060.0480.7610.639
PA would improve my social position0.041−0.124−0.102−0.0150.7270.662
Dependent variable: Subjective indicator of familiarity with PA.
Table 8. Students’ characteristics in each cluster.
Variables“Innovators” Second Cluster
(23.1%)
“Early Adopters” Third Cluster
(17.0%)
“Early Majority” Fourth Cluster
(27.9%)
“Late Majority”
Fifth Cluster
(16.2%)
“Laggards” First Cluster
(15.8%)
GenderMaleMaleMaleMaleFemale
Mean age (years)25.8924.7522.9023.3422.74
CountryItalyPortugalSpainGreeceSpain
EducationPostgraduateUndergraduateUndergraduateUndergraduateUndergraduate
Familiarity with PA3.102.912.411.991.94
1 = Not at all, 5 = Extremely.
Publisher’s Note: MDPI stays neutral with regard to jurisdictional claims in published maps and institutional affiliations.

