Article

Prediction of Plant Nutrition State of Rice under Water-Saving Cultivation and Panicle Fertilization Application Decision Making

1
Department of Agronomy, National Chung Hsing University, Taichung 402202, Taiwan
2
Crop Science Division, Taiwan Agricultural Research Institute, Council of Agriculture, Taichung 413008, Taiwan
3
Department of Civil Engineering, and Innovation and Development Center of Sustainable Agriculture, National Chung Hsing University, Taichung 402202, Taiwan
4
Pervasive AI Research (PAIR) Labs, Hsinchu 30010, Taiwan
5
Miaoli District Agricultural Research and Extension Station, Council of Agriculture, Miaoli 36346, Taiwan
*
Author to whom correspondence should be addressed.
Agronomy 2021, 11(8), 1626; https://doi.org/10.3390/agronomy11081626
Submission received: 1 July 2021 / Revised: 9 August 2021 / Accepted: 11 August 2021 / Published: 16 August 2021
(This article belongs to the Special Issue Smart Farming in Service of Modernizing Agriculture)

Abstract

:
Rice is a staple food crop in Asia. The rice farming industry has been influenced by global urbanization, rapid industrialization, and climate change. A combination of precise agricultural and smart water management systems to investigate the nutrition state in rice is important. Results indicated that plant nitrogen and chlorophyll content at the maximum tillering stage were significantly influenced by the interaction between water and fertilizer. The normalized difference vegetation index (NDVI) and normalized difference red edge (NDRE), obtained from the multispectral images captured by a UAV, exhibited the highest positive correlations (0.83 and 0.82) with plant nitrogen content at the maximum tillering stage. The leave-one-out cross-validation method was used for validation, and a final plant nitrogen content prediction model was obtained. A regression function constructed using a nitrogen nutrition index and the difference in field cumulative nitrogen had favorable variation explanatory power, and its adjusted coefficient of determination was 0.91. We provided a flow chart showing how the nutrition state of rice can be predicted with the vegetation indices obtained from UAV image analysis. Differences in field cumulative nitrogen can be further used to diagnose the demand of nitrogen topdressing during the panicle initiation stage. Thus, farmers can be provided with precise panicle fertilization strategies for rice fields.

1. Introduction

Rice (Oryza sativa L.) is a staple food crop satisfying food demand for 50% of the global population. With climate change, the frequency of extreme weather events is gradually increasing. Thus, the production and the cultivation of crops have become more difficult, and the risk of a global food shortage has increased [1,2]. When the environmental temperature increases, plant evapotranspiration increases. Thus, the weather thermal equilibrium system is changed, and regional temperature and rainfall are influenced. Extreme weather results in problems of high temperature, drought, and flooding, and crop growth is hindered. With the increasing global average temperature, the yields of major food crops are apparently decreasing [3]. Higher temperature causes increased cellular respiration in rice plants. The carbon metabolism increases, and the rice yield decreases. High temperatures have caused the global rice yield to decrease by 9–10% [4]. The sea-level rise caused by global warming has resulted in floods in coastal areas. Typhoons and torrential rain cause floods and extremely large agricultural losses. Research indicates that, when crops are flooded, their ability to absorb oxygen from the soil is limited. Floods cause hypoxia in plant cells, which influences energy synthesis. Oxidative phosphorylation and cellular respiration in mitochondria are limited. During a flood, the oxygen, carbon dioxide, and illumination intensity received by plants decrease, and photosynthesis efficiency decreases. Thus, less energy is generated for crop growth, and the yield decreases [5,6,7]. Alternatively, long-term rain deficiency causes water shortage and drought [8]. According to predictions, 15 million ha of fields may be influenced by water shortage by 2025 in the rice irrigation areas of Asia [9].
In the cultivation and production of rice, irrigation management is a key factor in yield. However, with the global population continuing to grow, water resource shortage is currently a pressing concern [10]. A flood-based irrigation system is generally used in the production and cultivation management of rice, and the planting process requires a large amount of irrigation water. Water-saving cultivation management methods that reduce the amount of irrigation water in the field without influencing rice yield are urgently required. Current water-saving cultivation methods include saturated soil culture, controlled irrigation drainage culture, and intermittent irrigation. Studies have demonstrated that water-saving cultivation methods can reduce water usage [11,12,13,14].
Culture environments and management methods have different influences on the physiological traits of rice. They also influence rice yield and quality [15,16,17]. Nitrogen is an essential element at the growth and development stages of rice. Rice requires sufficient quantities of nitrogen during the growth process, and the amount of nitrogen influences growth and yield. However, due to weather and environment influences, the nitrogen in soil is insufficient for rice growth. Fertilizers must be applied properly to supplement the nitrogen nutrients [18]. However, to increase rice yield, farmers often apply excessive amounts of nitrogen fertilizer, which results in yield loss and severe environmental pollution. In addition, human health, ecosystem equilibrium, climate change, and agricultural sustainability are influenced [16,19]. Nitrogen deficiency at the tillering stage influences the number of rice panicles, and nitrogen deficiency at the panicle differentiation stage influences the number of grains per panicle, the fertility rate, and the thousand grain weight. Thus, the final yield is influenced. If excessive nitrogen fertilizer is applied at the early development stage of rice, it causes dark-green leaves and higher numbers of sterile tillers. If the amount of nitrogen fertilizer is excessive at the booting stage, the rice stems and leaves become weak, resulting in lodging. Situations of uneven heading and incomplete grain filling cause poor rice quality [20]. Consequently, precise fertilization management can avoid the problem of excessive fertilization and stabilize rice production yield and quality.
Rice is the major staple food crop for people in Asia. The rice farming industry has been influenced by global urbanization and rapid industrialization. Problems related to an aging workforce, insufficient manpower, and small-scale, low-yield smallholder farming are prevalent. Rice cultivation requires smart management. With the rapid development of wireless network technology, use of the technology to manage rice production has increased. Imaging technology continues to progress through unmanned aerial vehicles (UAVs) with RGB and multispectral cameras to evaluate crop phenotypic traits [21]. Furthermore, UAVs can facilitate soil inspection, sowing, spraying fertilizers and pesticides, monitoring crops, growth evaluation, surveying, and transportation in agriculture, and they are mainly applied to crops including rice, corn, soybeans, and vegetables [22]. In the related research on evaluating crop growth, image analysis using UAVs equipped with spectral sensors can be used to estimate crop plant height, crop density, and nutritional status [23,24,25].
Precise agricultural smart management systems can improve production efficiency, optimize the production process, and protect the environment. In order to make precise decisions of panicle fertilization application, the early-maturing rice Tainung 71 (TNG71) was used for water and fertilizer trials in this study. Different irrigation methods and nitrogen fertilizer levels were evaluated in fields. The physiological trait changes of rice were observed, and field environment data were collected. Water management was conducted with field sensors. In addition, an unmanned aerial vehicle (UAV) was used to capture images for constructing relationships between the images and the physiological traits of rice. An intelligent production cultivation management model was developed to achieve the goal of intelligent cultivation management.

2. Materials and Methods

2.1. Experiment Location and Materials

The study site was the experimental field of Taiwan Agricultural Research Institute in Taichung City, Taiwan (24.02° N, 120.69° E). The location has subtropical and tropical weather with a mean annual temperature of 24.4 °C and annual rainfall of 2507 mm. The field is an independent experimental area managed by professional personnel with sufficient resources for experiments. The test rice variety was TNG71, a variety of early-maturing rice. The growth time of the first cropping season is 118 days, and the growth time of the second cropping season is 104 days. It is a variety widely grown in Taiwan. Rice farming in Taiwan has two crop seasons per year. Due to the climate, the growth time of the first crop is longer than that of the second. In addition, the yield of the first crop is higher.

2.2. Intelligent Water Management, Water Level Measurement, and Irrigation Water Calculation in the Experimental Field

A split-plot design was employed for the field experiment. The factor of the primary section was water, and the factor of the secondary section was nitrogen fertilizer. The field had two replications. Each treatment experiment field size was around 970 m2. The irrigation methods of conventional plant (CP) and alternative wet and dry (AWD) were used for water management. For the CP irrigation, the water level of the field was maintained at 1–3 cm during the rooting stage and 3–5 cm during the tillering stage. Irrigation was stopped at the field drying stage, and water shortage was avoided at the heading stage. For the AWD irrigation, the field was irrigated to 3–5 cm, and irrigation was resumed 24 h after the water level was 0 cm. This process was repeated until the final harvest. In the management process, irrigation was stopped at the field drying stage, and water shortage was avoided at the heading stage. For water management, intelligent field sensors were used to assist the irrigation (Multi-Functional Water Level Sensor, SW01T06001R, Taichung, Taiwan). The sensors were installed at about 30 cm depth in the field soil. An intelligent cloud environment weather station system was constructed in the experimental field. The system contained a host controller, a 4G module, a lightning rod (surge absorber), a waterproof box with the international protection code 66, a 2 inch solenoid valve, a water-level sensor (Figure S1a), and a remote intelligent water meter (Figure S1b). For water-level monitoring, the sensor was placed at approximately one-fourth the total field size from the water outlet in the field. Water levels were documented and transmitted to the cloud for storage. In addition, time-lapse photography devices and water-level meters were installed for manual measurement to supplement the water-level documentation. The water level was documented at 8 a.m. every morning. For the irrigation calculation, the irrigation switch was controlled using the remote solenoid valve. At the same time, the irrigation was documented with the intelligent water meter.

2.3. Fertilizer Management in the Experimental Field

Four nitrogen fertilizer levels were used in fertilizer management: fertilizer shortage, lower bound of optimal fertilizer, upper bound of optimal fertilizer, and excessive fertilizer. The amount of fertilizer for both crops of TNG71 were 80 kg/ha, 120 kg/ha, 160 kg/ha, and 200 kg/ha (Table S1). The crops were seeded on 8 March 2019 and 26 July 2019. In addition, on-site physiological trait investigation and UAV photography were conducted every 2 weeks after seeding. The on-site investigations and UAV photography were complete within the same week, and they ended at the rice maturity stage (Table S1).

2.4. Measurement of Leaf Chlorophyll Content and Plant Nitrogen Content

The measurement of chlorophyll content in the rice was conducted using a destructive method and a nondestructive method. For the destructive method, two plants in every section in the field were randomly selected for sampling. All the leaves above the ground were shredded and evenly mixed. Then, 1 g of fresh weight rice leaves was placed in a 15 mL centrifuge tube with 15 mL of 95% alcohol for extraction over 3 days. The extract was diluted 10 times, and a spectrophotometer (Molecular Devices, LLC/ABS Plus) was used to measure the absorbance of A665 and A649. In addition, total chlorophyll content per gram was calculated as follows:
Total chlorophyll = (6.1 × A665) + (20.04 × A649) (μg Chl·100 μL−1);
Total chlorophyll concentration (mg·g−1 FW) = total chlorophyll × 150 (dilution ratio) ÷ 1000 ÷ FW (g).
For the nondestructive method, a chlorophyll meter (SPAD-502) was used for the measurement. In each measurement, the second leaf from the top was selected, and the meter was used to clamp three leaves in every bunch of rice. The average of the three values represented the SPAD value of the bunch. Three bunches were randomly selected in each section for measurement.
The method of Huang et al. (2011) [26] was referenced for the measurement of plant nitrogen content. In the experimental field, two bunches in every section were randomly selected for sampling. The plants were placed in a 70 °C oven for 72 h and then reduced to powder in a grinder. The powder sample of 0.2 g was placed in a nitrification tube with 0.3 g of salicylic acid (217 mM in 5 mL of concentrated sulfuric acid) and 5 mL of concentrated sulfuric acid (18.2 M), left to react for 8 h. After the reaction was completed, 0.3 g of sodium hyposulfite (241.8 mM in 5 mL of concentrated sulfuric acid) was added. Then, it was placed in a block digester for reaction at 150 °C for 50 min, 250 °C for 30 min, 360 °C for 2 h, and 200 °C for 1 h. When the temperature was decreased from 360 °C to 220 °C, 4 mL of H2O2 was added. After the final reaction was completed, the sample was cooled to room temperature. Afterward, impurities were filtered out with a filter paper. The sample was added to 50 mL of double-distilled water, and the mixture was the sample solution. In the microplate, 90 μL of salicylic acid solution, 90 μL of sodium chlorate solution, and 20 μL of total nitrogen standard solution or 20 μL of sample solution were added for reaction for 15 min. The spectrophotometer was used to measure the absorbance of A650. Calibration was first conducted with a salicylic acid solution at 650 nm wavelength. The absorbance of the standard solution was used as the standard curve to obtain a linear formula. Then, the absorbance of the sample solution was substituted into the linear formula to obtain the nitrogen content of the sample. In addition, plant nitrogen content per gram was calculated as follows:
Total nitrogen content (mg·g−1) = measured nitrogen content (ppm) × 0.05 L (volume conversion) × 5 (weight conversion) × 10 (dilution ratio).
The recommended amount of panicle fertilizer was estimated by calculating the nitrogen nutrition index (NNI).

2.5. UAV Photography and Vegetation Index Image Analysis

A UAV was used for the field photography. The UAV model was a DJI M200 equipped with a multispectral camera (Micasense Rededge-M, MicaSense Inc., Seattle, WA, USA). The camera can shoot in five wave bands: blue light 475 nm, green light 560 nm, red light 668 nm, red edge 717 nm, and near infrared 840 nm. The Micasense Rededge-M shoots regularly using an automatic setting. The flight height was set at 40 m, and the image resolution was approximately 3.0 cm/pixel. The slight side overlap rate was 75%. Four ground control points were placed in the field, and the spatial coordinates of the control points were accessed with real-time kinematic positioning using virtual reference stations. The horizontal measurement accuracy was 2 cm, and this technique was used for the subsequent orthogonal modeling operation. The shooting time and the weather were documented, and image problems of blur, overexposure, and damage were manually examined after image captures. For image analysis, Agisoft Metashape was used to produce orthomosaics. Its principle is vertically capturing multiple neighboring and overlapping images of the ground. The 3D information was obtained through photogrammetry, and ground control points were shot to construct orthomosaics with precise coordinates. To ensure every image captured had identical lighting conditions, the multispectral camera shot a lighting calibration plate on the ground before every flight. In addition, ArcMAP 10.4 was used to extract the spectrum data of the sample areas for calculation of the vegetation indices in the divided sample areas of the entire field. The normalized difference vegetation index (NDVI) and the normalized difference red edge (NDRE) index were chosen as the study parameters. NDVI extracts red light and infrared wave bands for calculation, and NDRE extracts red edge and infrared wave bands for calculation. Their formulas are as follows:
NDVI = (NIR − R)/(NIR + R);
NDRE = (NIR − RE)/(NIR + RE).

2.6. Statistical Analysis

Statistical Analysis System (SAS) 9.4 version was used for the statistical analysis. An a priori comparison of analysis of variance was used to examine significance during processing. Then, the least significant difference test was used to examine the differences of the average values during processing. Different letters indicate significant differences (p < 0.05). The corrplot package of R language (version 3.6.2) was used for correlation analysis of the vegetation indices and the physiological traits of the rice in the same period [27,28]. A double asterisk represented p < 0.01, indicating a significant correlation. Regression analysis was conducted on the vegetation indices and physiological traits of the field in the same period. Statistical Analysis System 9.4 version was used for the regression analysis. After the regression function was obtained, the adjusted coefficient of determination Ra2 was used to assess the performance of the regression function. Then, the tidyverse and caret packages of R language (version 3.6.2) were used for leave-one-out cross-validation analysis.

3. Results

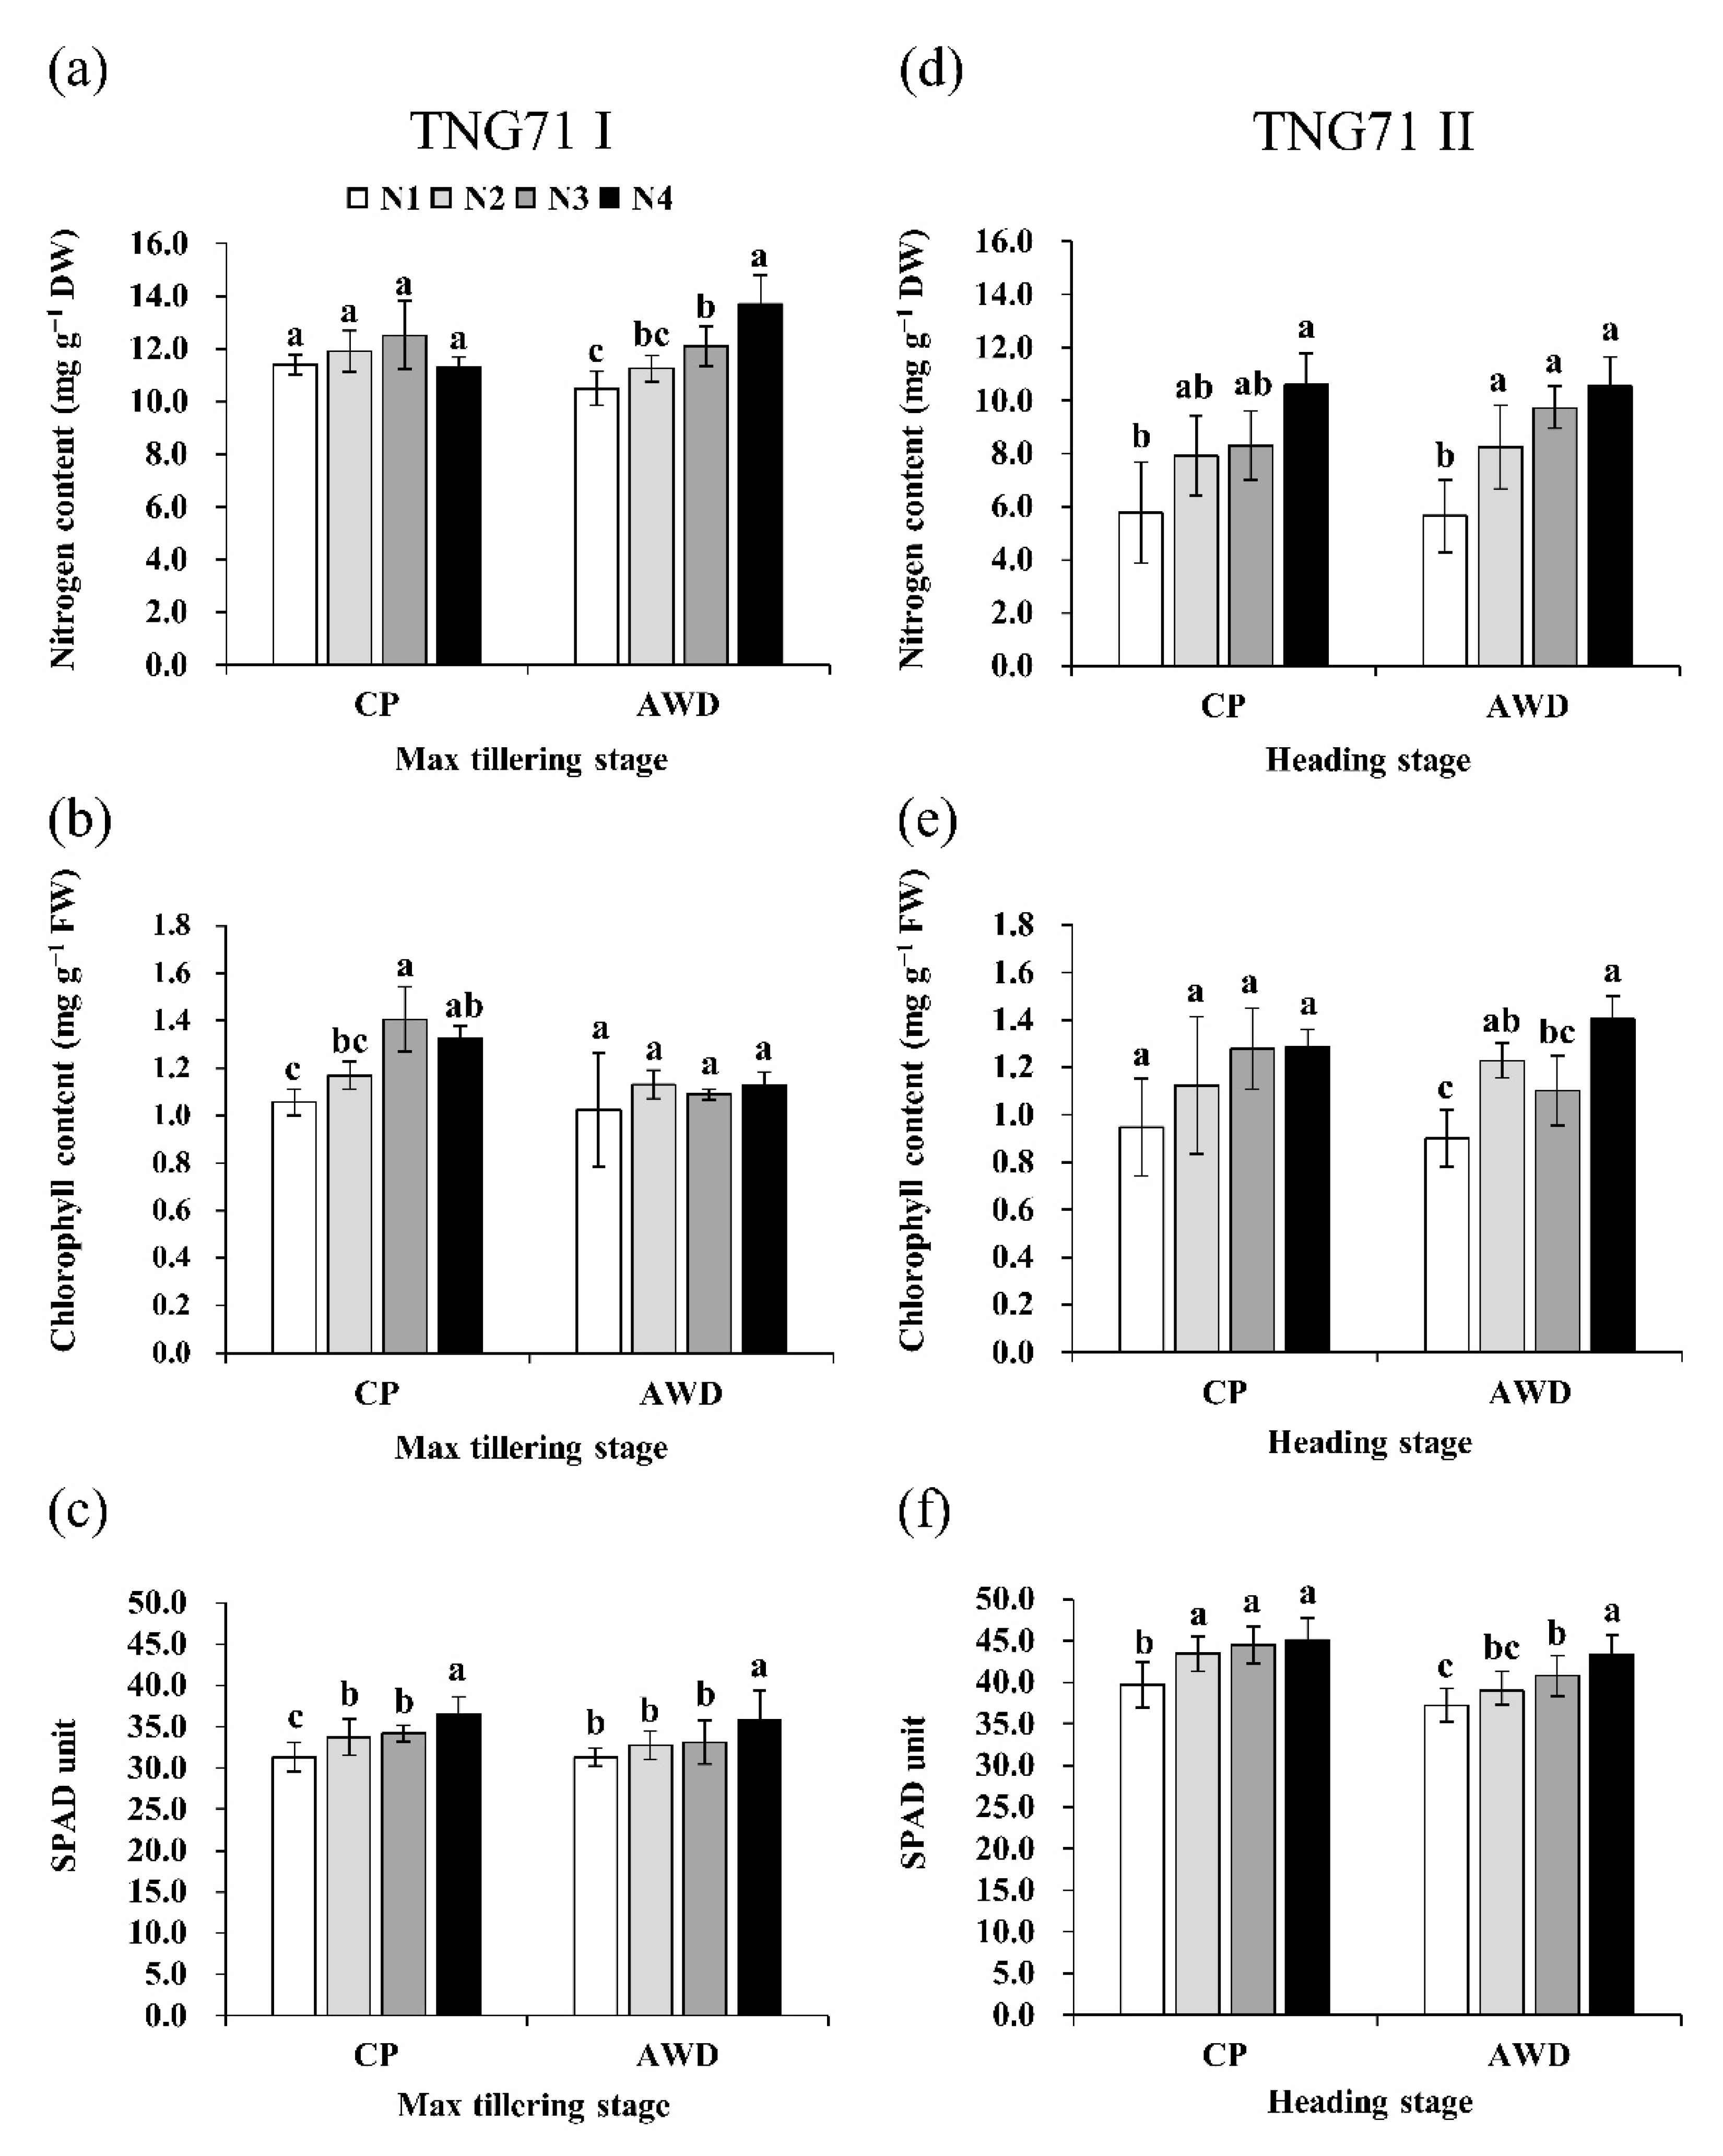
3.1. Physiological Trait Changes of Early-Maturing Rice TNG71 under Different Water and Nitrogen Fertilizer Management Conditions

With the development of intelligent agricultural production and management, a fertilizer management system must define the determining indices of rice production and management. In addition, rice nutrition state monitoring can be conducted with intelligent technology for decision making. To understand the physiological trait changes of rice under different water and fertilizer management conditions, as well as to develop a rice fertilizer management index, physiological traits with two irrigation methods and four nitrogen fertilizer levels were observed. The investigation continued from the vegetative stage to the reproductive stage, and the investigation items included plant nitrogen content, chlorophyll content, and SPAD value. The stage where physiological trait differences started to appear was determined. The analysis of variance results of the first crop of TNG71 indicated that nitrogen fertilizer difference at the maximum tillering stage had a significant influence on plant nitrogen content, chlorophyll content, and SPAD value (Table 1).
However, there was no significant influence prior to the maximum tillering stage (data not shown). The plant nitrogen content and chlorophyll content at the maximum tillering stage were significantly influenced by the interaction between water and fertilizer. Thus, the rice physiological traits with fixed water management and different fertilizer levels were compared. With increasing nitrogen fertilizer levels at the maximum tillering stage, aside from the CP plant nitrogen content and AWD chlorophyll content, the other values of plant nitrogen content, chlorophyll content, and SPAD value all increased significantly (Figure 1). For the second crop of TNG71, the difference in nitrogen fertilizer had a significant influence on plant nitrogen content, chlorophyll content, and SPAD value at the heading stage (Table 2). However, there was no significant influence before the heading stage (data not shown). With increasing nitrogen fertilizer levels at the heading stage of the second crop, plant nitrogen content and SPAD value significantly increased. In addition, the chlorophyll content for AWD nitrogen fertilizer level 1 (N1) was significantly lower than that for level 2 (N2) and level 4 (N4) (Figure 1). The statistical analysis results revealed that the nitrogen fertilizer effect on plant nitrogen content, chlorophyll content, and SPAD values of the first and the second crop was significant at the maximum tillering stage and the heading stage, respectively (Table 1 and Table 2).

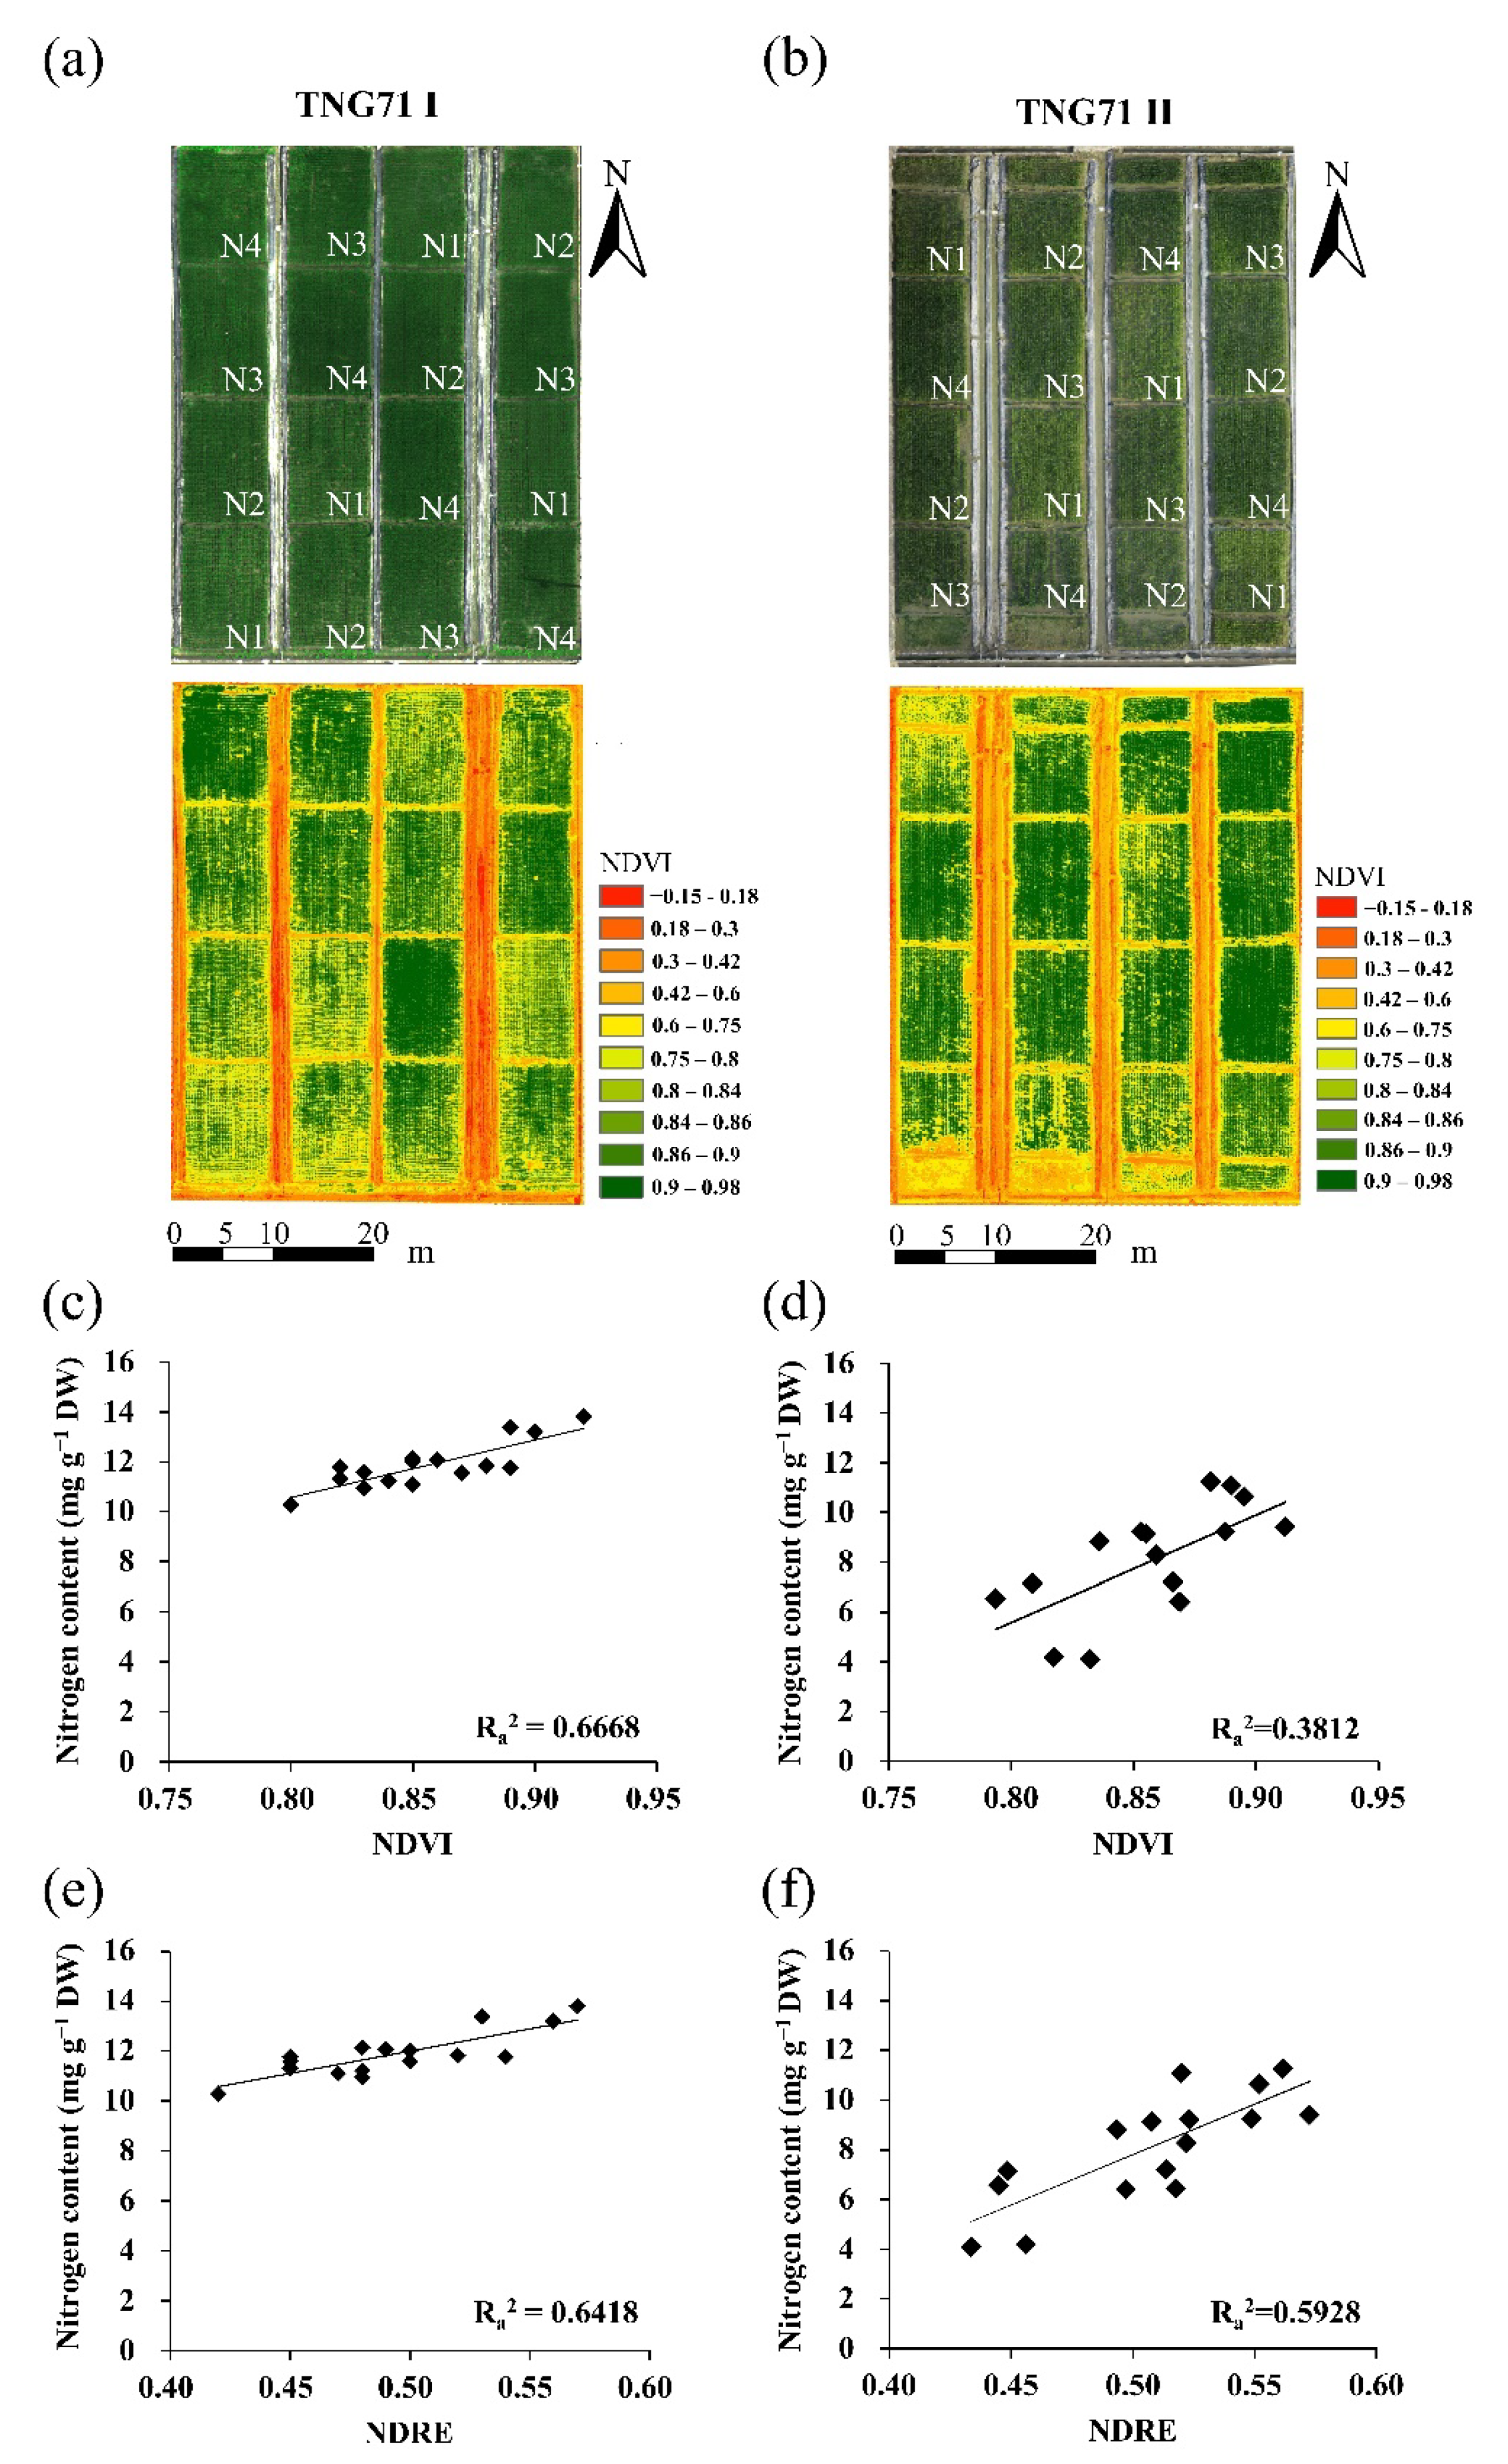
3.2. Correlation Analysis and Regression Analysis of the Vegetation Indices and Fertilizer Management Indices of UAV Images

To introduce intelligent methods to plant nutrition state monitoring, a UAV with a multispectral camera was used to capture images of TNG71 at different stages. The vegetation indices were calculated using image analysis results. In aerial images, the leaf colors of the two crops had apparent differences at the maximum tillering stage and the heading stage with the four nitrogen fertilizer levels. In addition, the vegetation indices of NDVI and NDRE were calculated with the obtained spectral data (Figure 2a,b).
The correlation analysis of the vegetation indices and plant nitrogen content, chlorophyll content, and SPAD values at different stages of the two crops indicated that NDVI and NDRE had significant positive correlations with plant nitrogen content, chlorophyll content, and SPAD values after the middle tillering stage of the first crop. The plant nitrogen content had the highest positive correlations with NDVI and NDRE at the maximum tillering stage, with correlation coefficients of 0.8294 and 0.8153, respectively. The plant nitrogen content in the second crop had a higher significant positive correlation with NDRE at the heading stage, with a correlation coefficient of 0.7051 (Table 3). The adjusted coefficient of determination of the first crop in the regression analysis suggested that the regression function constructed with NDVI, NDRE, and plant nitrogen content at the maximum tillering stage had the optimal variation explanatory power. The adjusted coefficients of determination (Ra2) were 0.6668 and 0.6418. For the yellow ripe stage of the second crop, the regression function constructed with NDVI, NDRE, and chlorophyll content had the optimal variation explanatory power (Table 4). The Ra2 values were 0.7068 and 0.7535. In addition, leave-one-out cross-validation was used to validate the regression models, and a final plant nitrogen content prediction model was obtained. The results indicated that the plant nitrogen content prediction model with NDVI and NDRE at the maximum tillering stage of the first crop of TNG71 had favorable goodness of fit. The Ra2 values were 0.56 and 0.53, and the root-mean-square errors were 0.57 and 0.60 (Figure 3a,b). These results suggest that the vegetation indices obtained from the image analysis of the multispectral camera images of the first crop at the maximum tillering stage can be used as a tool for intelligent monitoring of plant nitrogen content.

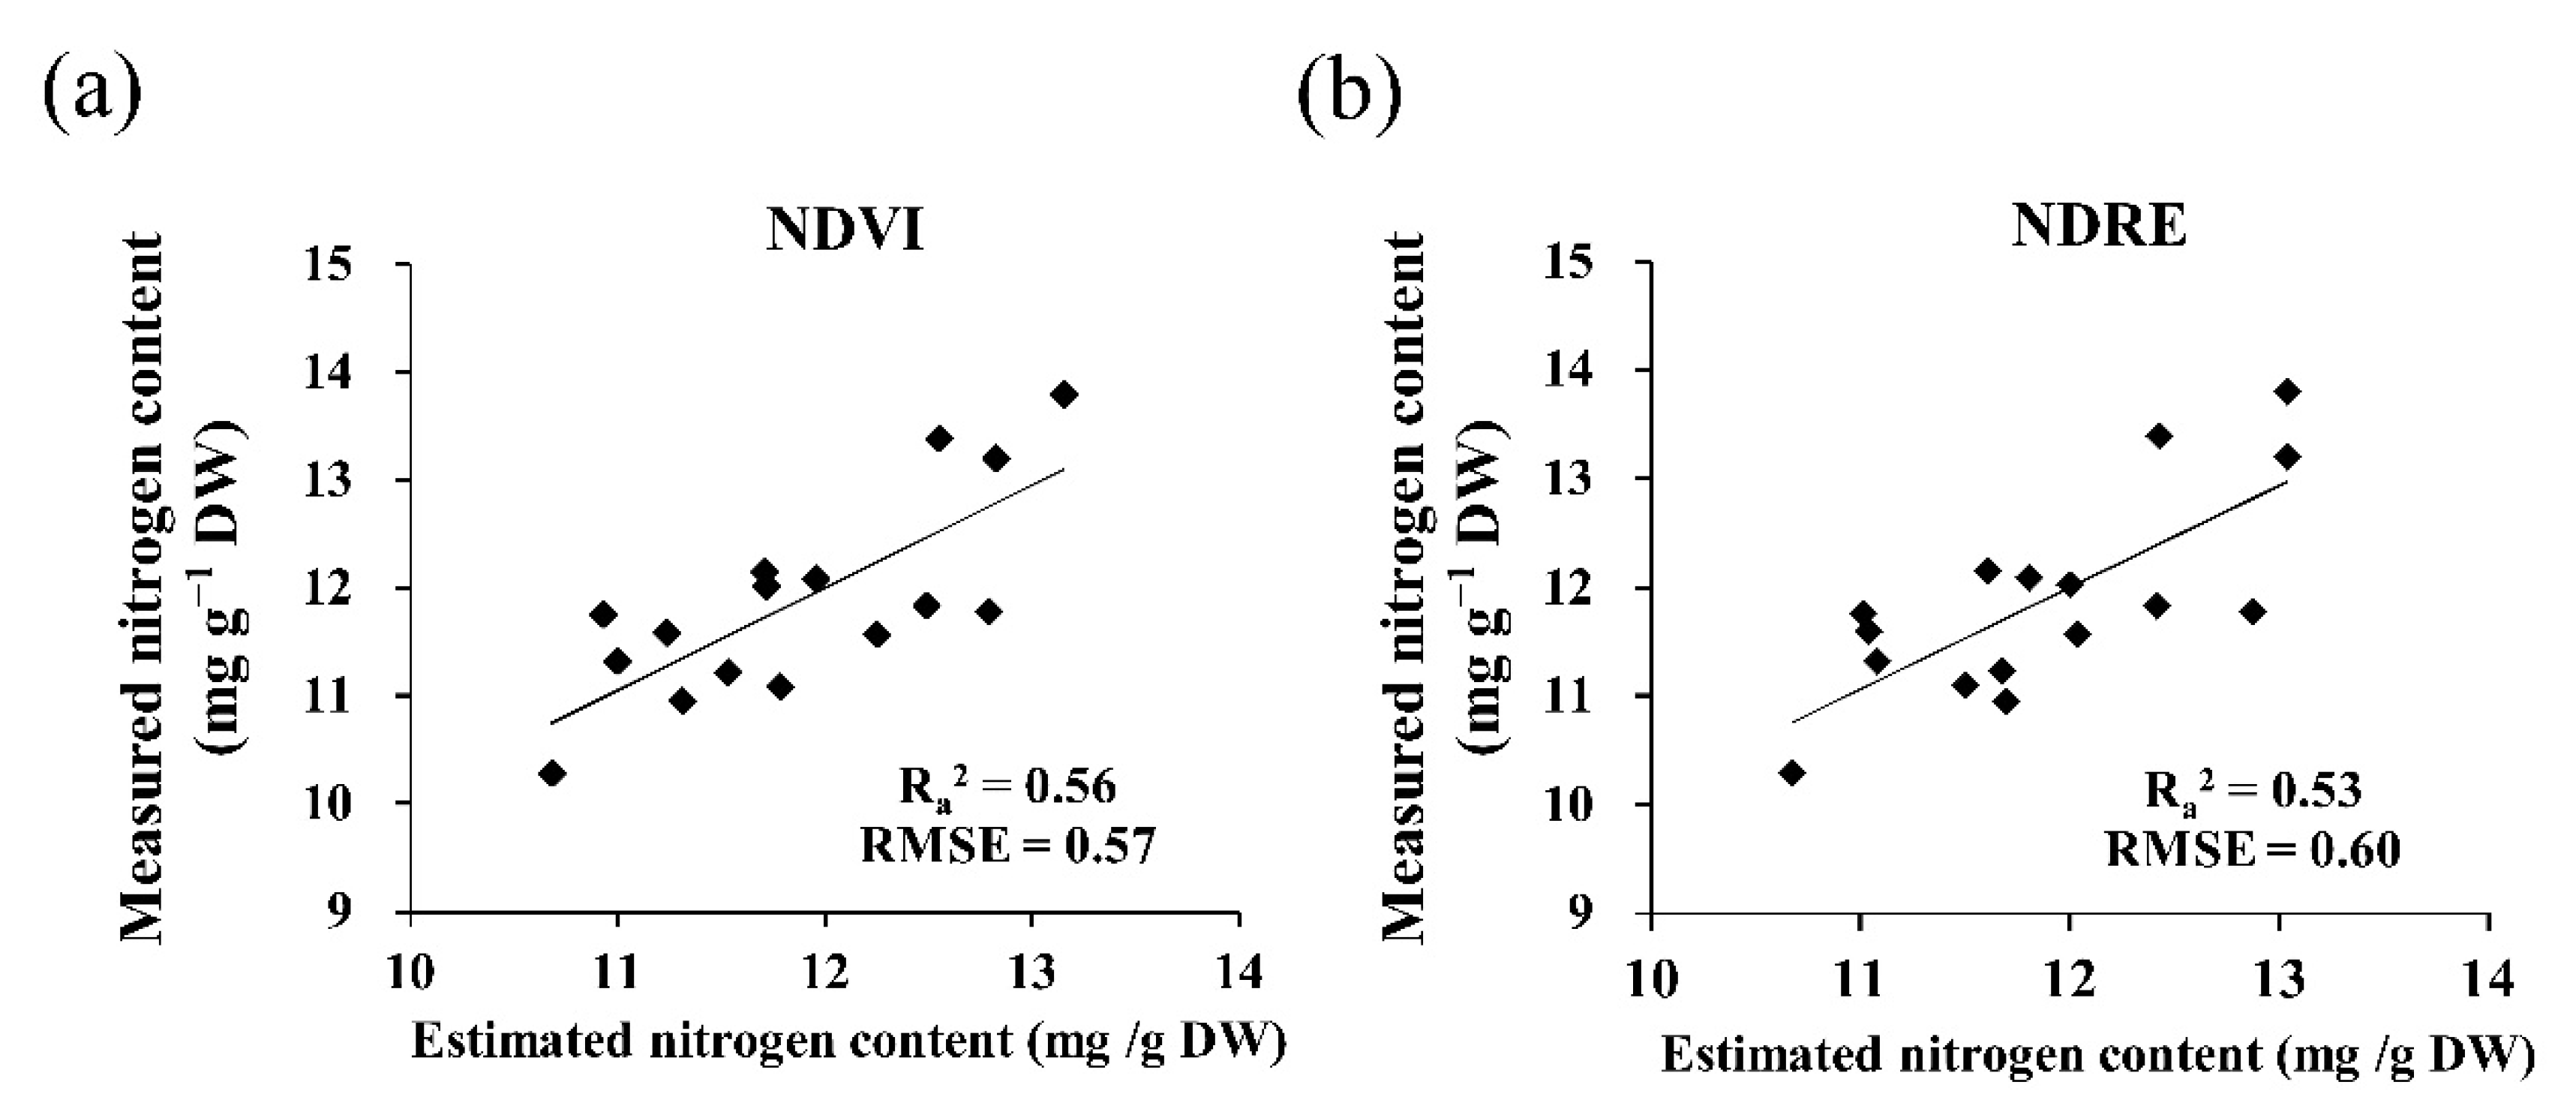
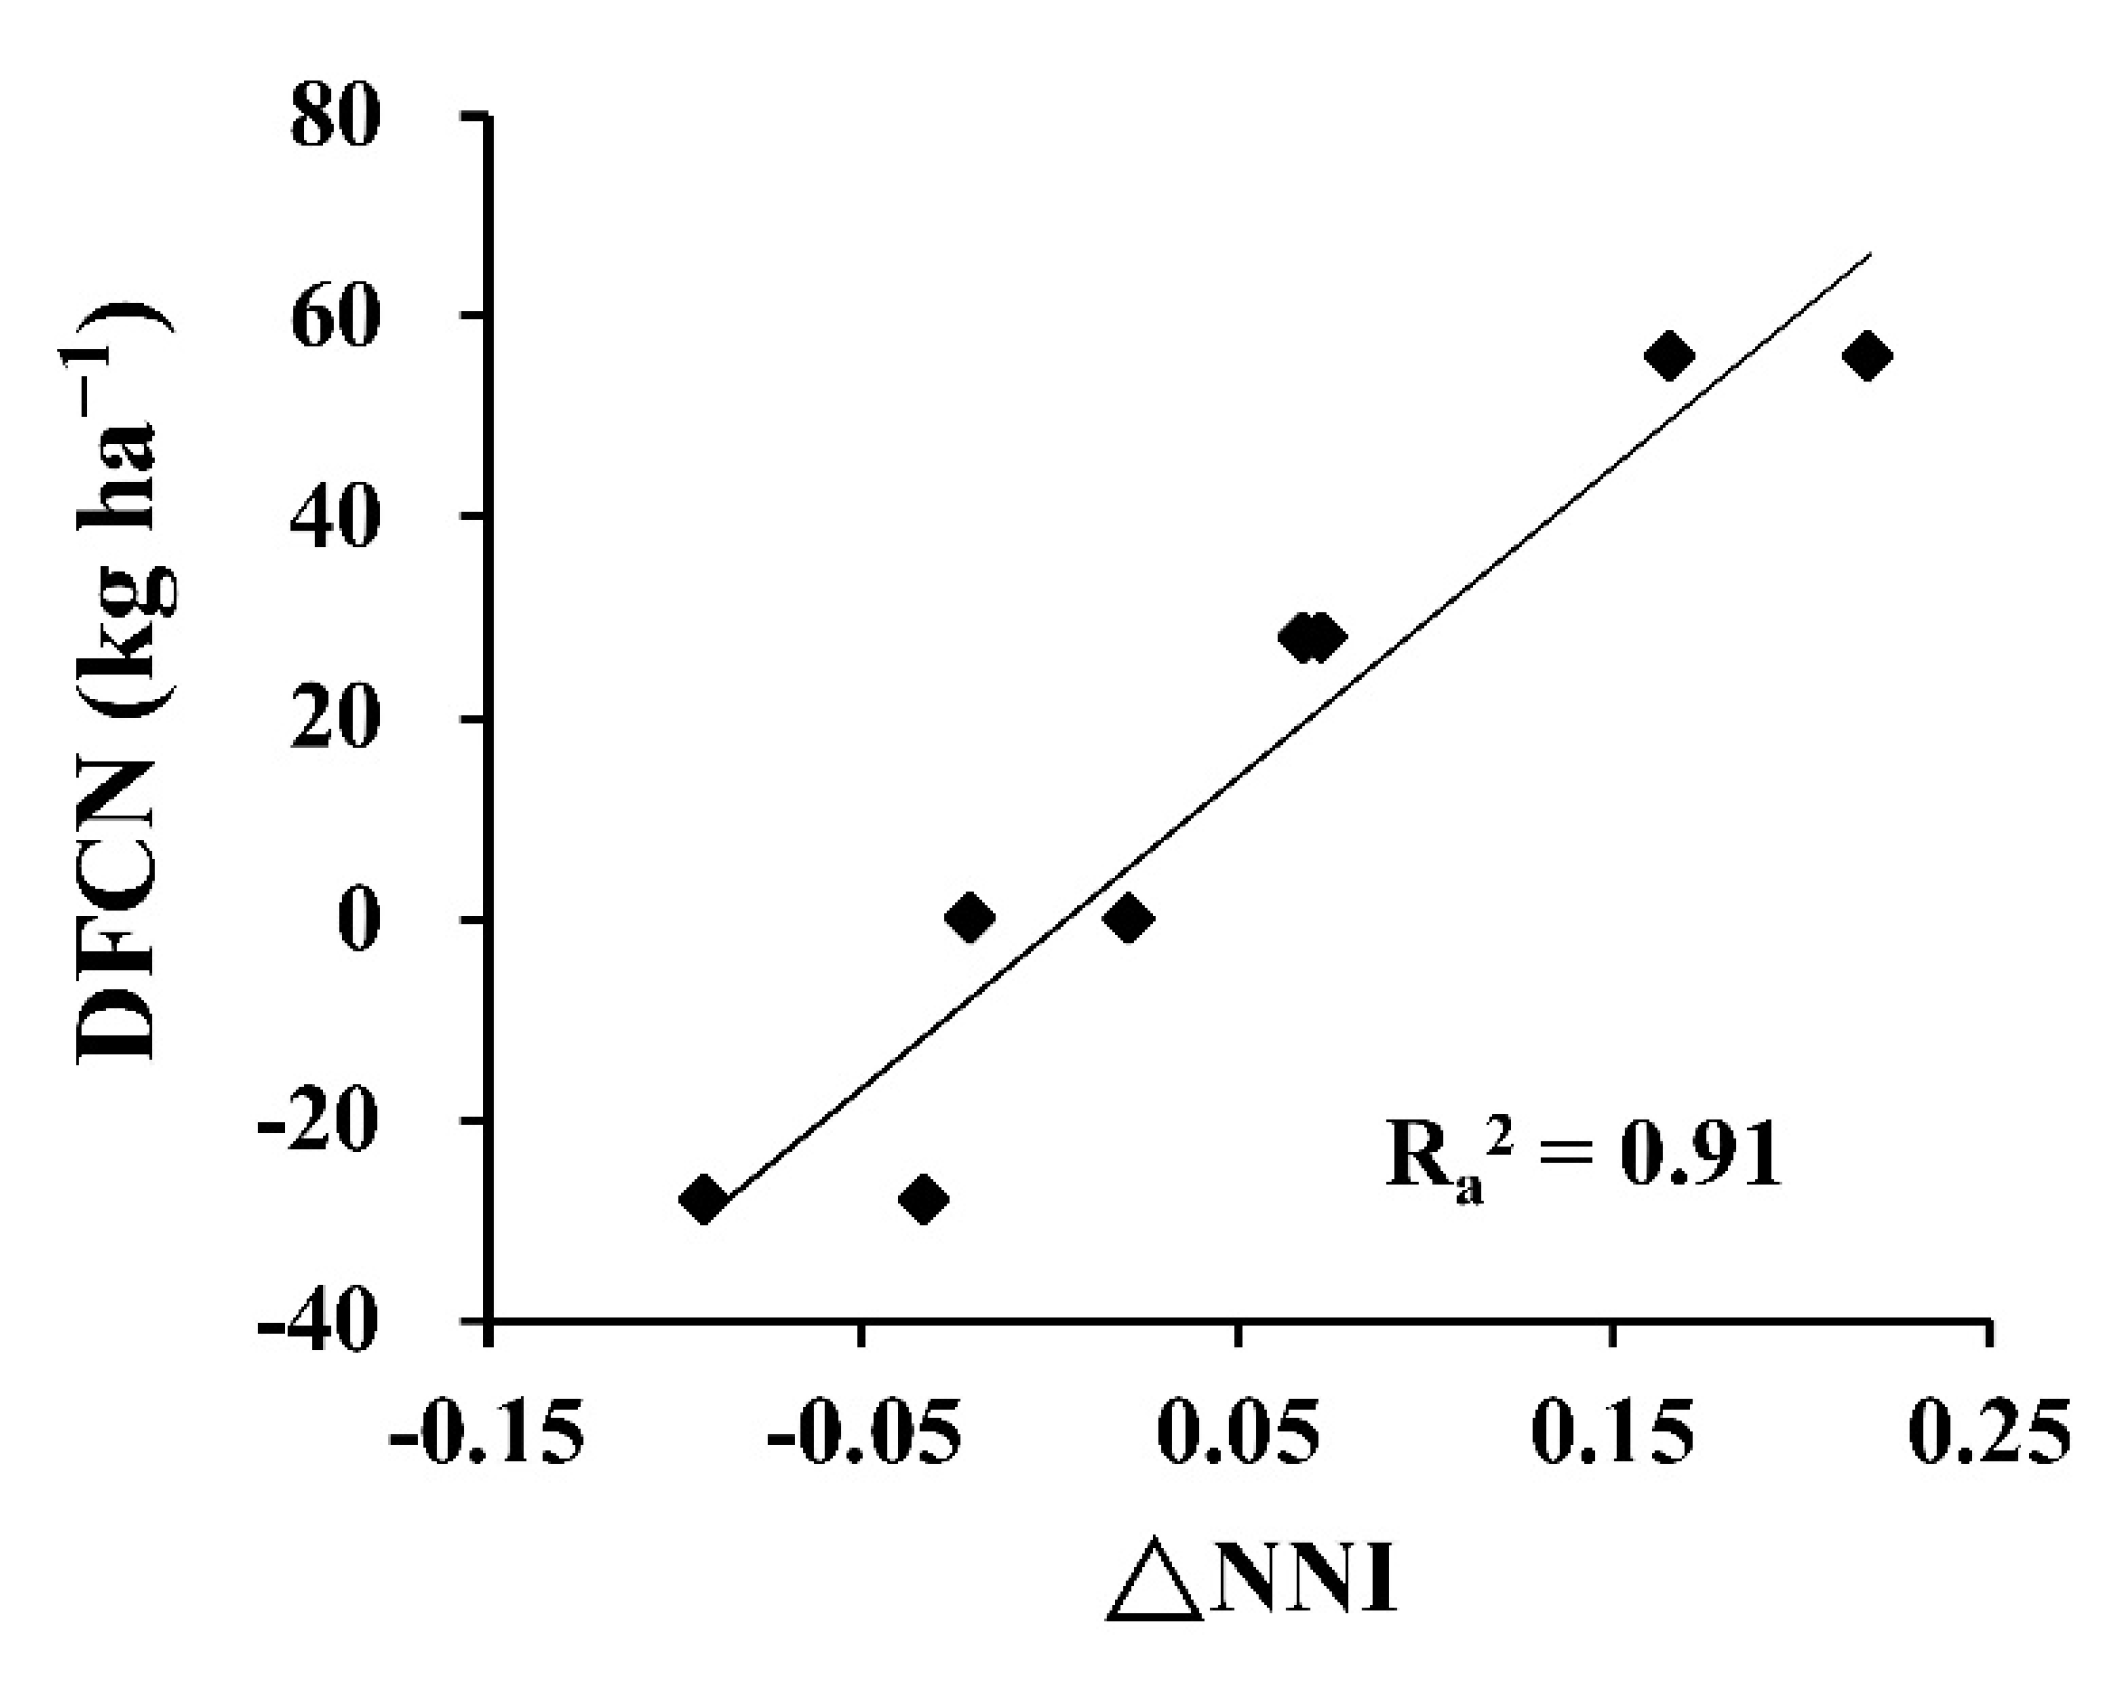
3.3. Nitrogen Fertilizer Model under AWD Irrigation of Early-Maturing Rice TNG71

The application of panicle fertilizer in rice field cultivation management has a large influence on yield. Thus, information for plant nutrition state judgments before panicle fertilizer application can have positive effects on the development of rice farming. The experimental results indicated that the physiological traits of TNG71 prior to panicle fertilizer application had significant differences in the four nitrogen fertilizer levels. Thus, the results at the tillering stage were used for the calculation of a nitrogen nutrition index (NNI), and the recommended amount of panicle fertilizer was estimated. The plant nitrogen content with the highest yield under AWD irrigation was used as the optimal plant nitrogen nutrition state (Nref) for the NNI calculation. The final yields indicated that the application of level 2 nitrogen fertilizer to the first crop under AWD irrigation had the highest yield at 5560.8 kg/ha (Figure S2). The plant nitrogen content at the maximum tillering stage with level 2 nitrogen fertilizer application under AWD irrigation was used as Nref. The plant nitrogen content for other nitrogen fertilizer levels was used as the plant nitrogen content observation value (Nobs). The rice plant NNI was calculated as follows:
NNI = N o b s N r e f .
The value of NNI for each nitrogen fertilizer level minus 1 (ΔNNI) represents the difference between the nitrogen nutrition state and the optimal nitrogen nutrition state for each level. According to the yields, the field cumulative nitrogen with level 2 nitrogen fertilizer was used as the standard value. The difference in field cumulative nitrogen (DFCN) was determined by subtracting the standard value from the field cumulative nitrogen of other nitrogen fertilizer levels. This also represents the difference between the cumulative nitrogen of the observed field and the standard value. The regression analysis of ΔNNI and DFCN suggests that the regression function constructed with ΔNNI and DFCN had favorable variance explanatory power. The adjusted coefficient of determination was 0.91 (Figure 4). Thus, NNI was used as the index to assess crop nutrition state, and it can be used as a reference for the adjustment of nitrogen fertilizer applications. Thus, decision making can be more effective regarding panicle fertilizer applications in rice fields.

4. Discussion

The goal of this study was to use a UAV with a multispectral camera to accurately monitor the rice plant nutrition state in a field using a nondestructive method. In addition, decision making was conducted with image interpretation. The physiological traits of rice are influenced by environmental factors such as soil nutrition, climate, and rice variety. Thus, for the field fertilizer management of rice, plant nutrition state can be understood from physiological traits, and decision making can be informed. Plant nitrogen content and chlorophyll content influence the nitrogen metabolism and photosynthesis of rice, and they are important indices in the rice production process. Research indicates that the plant nitrogen content in rice increases with nitrogen fertilizer supply. Higher plant nitrogen content can produce more RuBisCo to improve photosynthesis efficiency [29,30]. In research on chlorophyll content and nitrogen fertilizer, chlorophyll content significantly increased with the application of nitrogen fertilizer. Thus, the final rice yield was influenced. With increasing plant nitrogen content and chlorophyll content, the rice leaf color becomes a darker green, and rice leaves have higher SPAD values with increasing levels of nitrogen fertilizer [31,32]. The results of the present study indicate that, for the first crop of TNG71, the effect of fertilizer was not obvious prior to the maximum tillering stage. The physiological traits of rice had no significant differences. On the 22nd day after the second top dressing, the physiological traits of the rice started to exhibit significant changes. Plant nitrogen content, chlorophyll content, and SPAD values increased significantly with increasing nitrogen fertilizer at the maximum tillering stage (Figure 1). Plant nitrogen content and chlorophyll content are influenced by the interaction between water and fertilizer. This indicates that irrigation methods influence the effects of fertilizer application on the physiological traits of rice. Past research has indicated that irrigation models and nitrogen application levels interact with each other, thus influencing both the efficiency of nitrogen fertilizer applications and the rice yields. The AWD irrigation method can reduce ineffective tillering and facilitate root growth. In addition, it influences the nitrogen absorption efficiency and photosynthesis of rice [33]. Both the irrigation model and the amount of nitrogen fertilizer influence the physiological traits of rice. Again, TNG71 is an early-maturing rice variety. The second crop has a faster growth rate due to higher temperatures at the early stage of cultivation. The plant nitrogen content, chlorophyll content, and SPAD value did not differ significantly before the heading stage in the nitrogen fertilizer experiment. The effects of the fertilizer were not demonstrated in the physiological traits until the heading stage when plant nitrogen content, chlorophyll content, and SPAD value increased significantly with the nitrogen fertilizer level (Figure 1).
Rice plants use chlorophyll and carotenoid for absorption and photosynthesis, which provides energy for rice. Chlorophyll is a major nitrogenous substance in rice, and it can be used as a plant growth monitoring index [34]. Chlorophyll content can determine the photosynthesis ability and productivity of rice. Plant nitrogen content is a key influence factor for canopy light use efficiency and canopy photosynthesis rate [35]. The canopy leaf number and the plant nitrogen content of rice both influence canopy spectral characteristics. Past research has indicated that crops with more chlorophyll absorb red light and reduce red light reflectance. However, they reflect large amounts of infrared light, resulting in higher infrared light reflectance [36]. Consequently, spectral reflectance and fertilizer management indices can be used to construct a prediction model and to monitor plant nitrogen and chlorophyll content. The results of the current study indicate that, when the physiological traits of rice start showing differences due to the influence of fertilizer, image spectra can be used to analyze leaf color differences in the field (Figure 2a, b). In this study, infrared light, red edge, and red light were used for analysis, and NDVI and NDRE were obtained from calculations. The results indicate that these two vegetation indices have significant correlations with physiological traits. The NDVI and NDRE of the first crop of TGN71 had the highest correlations with plant nitrogen content at the maximum tillering stage. Due to its higher growth rate, the second crop of TNG71 exhibited significant differences in physiological traits only until the heading stage. NDRE and plant nitrogen content had the highest correlation (Table 3). Previous studies reported that vegetation indices had the optimal prediction outcomes regarding rice leaf nitrogen content at the maximum tillering stage and the panicle differentiation stage [37,38]. The lower correlations in the early tillering stage may be due to the physiological traits of rice exhibiting no significant differences according to the nitrogen fertilizer level at the early stage. In addition, the plants were smaller, and soil reflectance had a major impact upon the values of the vegetation indices. Thus, the vegetation indices had lower correlations with the on-site physiological traits. At the maturity stage, the spectral characteristics of rice changed because of heading and leaf yellowing. Thus, the calculation of vegetation indices might be influenced. Consequently, the vegetation indices differed greatly from the on-site physiological traits of rice, thereby lowering the correlations.
A flow chart of UAV image analysis of the rice field and panicle fertilizer recommendations is presented in Figure 5. In addition, a fertilizer management model with AWD irrigation was constructed according to the experimental results. This model can capture field images with large areas from a great distance at the maximum tillering stage and analyze field vegetation indices by using the images. The vegetation indices are used to predict the plant nitrogen content of rice at the maximum tillering stage, and this content is then used to calculate ΔNNI. The nutrition state of the field rice is obtained from the monitoring of ΔNNI, and DFCN is estimated for the adjustment of subsequent panicle fertilizer applications (Figure 4). Therefore, when the DFCN of the observed field is lower than that of the standard field, then the level of panicle fertilizer application is increased. Otherwise, the level is decreased.
In this study, an intelligent fertilizer management model with AWD irrigation was constructed. UAV image analysis was used to calculate vegetation indices, and these indices were used to estimate the plant nitrogen content of rice. The model can be used to understand the real-time plant nutrition state of field rice, and DFCN can also be estimated. In addition, a reliable panicle fertilizer application prediction model was obtained. Manual methods were mainly used for cultivation management in the past for rice field monitoring, and cultivation experience was generally shared verbally. Developing an intelligent management and decision-making system to monitor field conditions in real time, thereby providing farmers with accurate cultivation management information, can save time and labor. This system can also address the problem of insufficient agriculture manpower and aging populations in rural areas and achieve technology-assisted intelligent field management.

Supplementary Materials

The following are available online at https://www.mdpi.com/article/10.3390/agronomy11081626/s1; Figure S1. Intelligent sensor for paddy field: (a) water-level sensor; (b) remote intelligent water meter; Figure S2. The yields of the early-maturing rice TNG71 in the first crop under different water and fertilizer treatments; Table S1. The four nitrogen fertilizer levels and UAV flight dates during the first and second crop in 2019.

Author Contributions

Data curation, G.-S.L.; formal analysis, G.-S.L., D.-H.W., and Y.-C.S.; investigation, G.-S.L. and D.-H.W.; methodology, Y.-C.S., B.-J.K., M.-D.Y., and C.-Y.Y.; project administration, M.-H.L., H.-Y.L., and C.-Y.Y.; supervision, M.-D.Y., M.-H.L., H.-Y.L., and C.-Y.Y.; validation, G.-S.L., Y.-C.S., and B.-J.K.; writing—review and editing, C.-Y.Y. All authors have read and agreed to the published version of the manuscript.

Funding

This research was funded by the Council of Agriculture and the Ministry of Science and Technology, Taiwan, under grant numbers 108AS-13.2.4-FD-Z1 and 109AS-11.2.4-FD-Z1.

Institutional Review Board Statement

Not applicable.

Informed Consent Statement

Not applicable.

Data Availability Statement

Not applicable.

Acknowledgments

We thank Pei-Jhen Wu and Tzu-Chiao Liao for their support in paddy field management and figure preparation for the manuscript.

Conflicts of Interest

The authors declare no conflict of interest.

References

  1. Premanandh, J. Factors affecting food security and contribution of modern technologies in food sustainability. J. Sci. Food Agric. 2011, 91, 2707–2714. [Google Scholar] [CrossRef] [PubMed]
  2. Long, S.P.; Marshall-Colon, A.; Zhu, X.G. Meeting the global food demand of the future by engineering crop photosynthesis and yield potential. Cell 2015, 161, 56–66. [Google Scholar] [CrossRef] [Green Version]
  3. Tito, R.; Vasconcelos, H.L.; Feeley, K.J. Global climate change increases risk of crop yield losses and food insecurity in the tropical Andes. Glob. Chang. Biol. 2018, 24, e592–e602. [Google Scholar] [CrossRef] [PubMed]
  4. Cai, Y.; Bandara, J.S.; Newth, D. A framework for integrated assessment of food production economics in South Asia under climate change. Environ. Modell. Softw. 2016, 75, 459–497. [Google Scholar] [CrossRef]
  5. Panda, D.; Sarkar, R.K. Natural leaf senescence: Probed by chlorophyll fluorescence, CO2 photosynthetic rate and antioxidant enzyme activities during grain filling in different rice cultivars. Physiol. Mol. Biol. Plants 2013, 19, 43–51. [Google Scholar] [CrossRef]
  6. Lim, M.N.; Lee, S.E.; Yim, H.K.; Kim, J.H.; Yoon, I.S.; Hwang, Y.S. Differential anoxic expression of sugar-regulated genes reveals diverse interactions between sugar and anaerobic signaling systems in rice. Mol. Cells 2013, 36, 169–176. [Google Scholar] [CrossRef] [Green Version]
  7. Verboven, P.; Pedersen, O.; Ho, Q.T.; Nicolai, B.M.; Colmer, T.D. The mechanism of improved aeration due to gas films on leaves of submerged rice. Plant Cell Environ. 2014, 37, 2433–2452. [Google Scholar] [CrossRef] [Green Version]
  8. Khan, A.A.; Ijaz, M.; Muhammad, J.; Goheer, A.R.; Akbar, G.; Adnan, M. Climate change implications for wheat crop in Dera Ismail Khan district of Khyber Pakhtunkhwa. Pak. J. Meteorol. 2016, 13, 17–27. [Google Scholar]
  9. Tuong, T.P.; Bouman, B.A.M. Rice production in water scare environments. In Water Productivity in Agriculture: Limits and Opportunities for Improvement; Kjine, J.W., Barker, R., Molden, D., Eds.; CABI: Wallingford, UK, 2003; pp. 53–67. [Google Scholar]
  10. Mekonnen, M.M.; Hoekstra, A.Y. Four billion people facing severe water scarcity. Sci. Adv. 2016, 2, e1500323. [Google Scholar] [CrossRef] [PubMed] [Green Version]
  11. Lin, L.; Zhang, Z.B.; Janssen, M.; Lennartz, B. Infiltration properties of paddy fields under intermittent irrigation. Paddy Water Environ. 2014, 12, 17–24. [Google Scholar] [CrossRef]
  12. Tan, X.; Shao, D.; Liu, H. Simulating soil water regime in lowland paddy fields under different water managements using HYDRUS-1D. Agric. Water Manag. 2014, 132, 69–78. [Google Scholar] [CrossRef]
  13. Shao, G.; Cui, J.; Lu, B.; Brian, B.J.; Ding, J.; She, D. Impacts of controlled irrigation and drainage on the yield and physiological attributes of rice. Agric. Water Manag. 2015, 149, 156–165. [Google Scholar] [CrossRef]
  14. Chen, Z.; Yang, X.; Song, W.; Khan, A.; Najeeb, U.; Li, P.; Cao, C. Water-saving cultivation plus super rice hybrid genotype improves water productivity and yield. Agron. J. 2020, 112, 1764–1777. [Google Scholar] [CrossRef]
  15. Yang, S.; Cheng, B.; Wu, J.; Shen, W.; Cheng, S. Review and prospects on rice breeding and extension in China. Rice Sci. 2006, 13, 1–8. [Google Scholar]
  16. Miao, Y.; Stewart, B.A.; Zhang, F. Long-term experiments for sustainable nutrient management in China. A review. Agron. Sustain. Dev. 2011, 31, 397–414. [Google Scholar] [CrossRef] [Green Version]
  17. Li, Y.; Šimůnek, J.; Wang, S.; Yuan, J.; Zhang, W. Modeling of soil water regime and water balance in a transplanted rice field experiment with reduced irrigation. Water 2017, 9, 248. [Google Scholar] [CrossRef] [Green Version]
  18. Cassman, K.G.; Dobermann, A.; Cruz, P.C.S.; Gines, G.C.; Samson, M.I.; Descalsota, J.P.; Alcantara, J.M.; Dizon, M.A.; Olk, D.C. Soil organic matter and the indigenous nitrogen supply of intensive irrigated rice systems in the tropics. Plant Soil 1996, 182, 267–278. [Google Scholar] [CrossRef]
  19. Cao, Q.; Miao, Y.; Feng, G.; Gao, X.; Liu, B.; Liu, Y.; Li, F.; Khosla, R.; Mulla, D.J.; Zhang, F. Improving nitrogen use efficiency with minimal environmental risks using an active canopy sensor in a wheat-maize cropping system. Field Crop. Res. 2017, 214, 365–372. [Google Scholar] [CrossRef]
  20. Wang, Y.; Lu, J.; Ren, T.; Hussain, S.; Guo, C.; Wang, S.; Cong, R.; Li, X. Effects of nitrogen and tiller type on grain yield and physiological responses in rice. AoB Plants 2017, 9, plx012. [Google Scholar] [CrossRef] [PubMed]
  21. Bendig, J.; Bolten, A.; Bennertz, S.; Broscheit, J.; Eichfuss, S.; Bareth, G. Estimating biomass of barley using crop surface models (CSMs) derived from UAV-based RGB imaging. Remote Sens. 2014, 6, 10395–10412. [Google Scholar] [CrossRef] [Green Version]
  22. Ju, C.; Son, H. Multiple UAV systems for agricultural applications: Control, implementation, and evaluation. Electronics 2018, 7, 162. [Google Scholar] [CrossRef] [Green Version]
  23. Wang, H.; Qian, X.; Zhang, L.; Xu, S.; Li, H. A method of high throughput monitoring crop physiology using chlorophyll fluorescence and multispectral imaging. Front. Plant Sci. 2018, 9, 407. [Google Scholar] [CrossRef] [Green Version]
  24. Osco, L.P.; Junior, J.M.; Ramos, A.P.M.; Furuya, D.E.G.; Santana, D.C.; Teodoro, L.P.R.; Gonçalves, W.N.; Baio, F.H.R.; Pistori, H.; Junior, C.A.S.; et al. Leaf nitrogen concentration and plant height prediction for maize using UAV-based multispectral imagery and machine learning techniques. Remote Sens. 2020, 12, 3237. [Google Scholar] [CrossRef]
  25. Ranđelović, P.; Đorđević, V.; Milić, S.; Balešević-Tubić, S.; Petrović, K.; Miladinović, J.; Đukić, V. Prediction of soybean plant density using a machine learning model and vegetation indices extracted from RGB images taken with a UAV. Agronomy 2020, 10, 1108. [Google Scholar] [CrossRef]
  26. Huang, S.C.; Lin, Y.C.; Liu, K.F.; Chen, C.T. Microplate method for plant total nitrogen and phosphorus analysis. Taiwan. J. Agric. Chem. Food Sci. 2011, 49, 19–25. [Google Scholar]
  27. R Core Team. R: A Language and Environment for Statistical Computing; R Foundation for Statistical Computing: Vienna, Austria, 2014; Available online: https://www.R-project.org/ (accessed on June 2020).
  28. Wei, T.; Simko, V. R Package “Corrplot”: Visualization of a Correlation Matrix (Version 0.84). 2017. Available online: https://github.com/taiyun/corrplot (accessed on June 2020).
  29. Ookawa, T.; Naruoka, Y.; Sayama, A.; Hirasawa, T. Cytokinin effects on ribulose-1, 5-bisphosphate carboxylase/oxygenase and nitrogen partitioning in rice during ripening. Crop Sci. 2004, 44, 2107–2115. [Google Scholar] [CrossRef]
  30. Cao, X.; Zhong, C.; Sajid, H.; Zhu, L.; Zhang, J.; Wu, L.; Jin, Q. Effects of watering regime and nitrogen application rate on the photosynthetic parameters, physiological characteristics, and agronomic traits of rice. Acta Physiol. Plant. 2017, 39, 135. [Google Scholar] [CrossRef]
  31. Yuan, Z.; Ata-Ul-Karim, S.T.; Cao, Q.; Lu, Z.; Cao, W.; Zhu, Y.; Liu, X. Indicators for diagnosing nitrogen status of rice based on chlorophyll meter readings. Field Crop. Res. 2016, 185, 12–20. [Google Scholar] [CrossRef]
  32. Zhong, C.; Cao, X.; Hu, J.; Zhu, L.; Zhang, J.; Huang, J.; Jin, Q. Nitrogen metabolism in adaptation of photosynthesis to water stress in rice grown under different nitrogen levels. Front. Plant Sci. 2017, 8, 1079. [Google Scholar] [CrossRef] [PubMed] [Green Version]
  33. Wang, Z.; Zhang, W.; Beebout, S.S.; Zhang, H.; Liu, L.; Yang, J.; Zhang, J. Grain yield, water and nitrogen use efficiencies of rice as influenced by irrigation regimes and their interaction with nitrogen rates. Field Crop. Res. 2016, 193, 54–69. [Google Scholar] [CrossRef]
  34. Feng, H.; Chen, G.; Xiong, L.; Liu, Q.; Yang, W. Accurate digitization of the chlorophyll distribution of individual rice leaves using hyperspectral imaging and an integrated image analysis pipeline. Front. Plant Sci. 2017, 8, 1238. [Google Scholar] [CrossRef] [PubMed] [Green Version]
  35. Kergoat, L.; Lafont, S.; Arneth, A.; Le Dantec, V.; Saugier, B. Nitrogen controls plant canopy light-use efficiency in temperate and boreal ecosystems. J. Geophys. Res. Biogeo. 2008, 113, 1–19. [Google Scholar] [CrossRef] [Green Version]
  36. Lebourgeois, V.; Bégué, A.; Labbé, S.; Houlès, M.; Martiné, J.F. A light-weight multi-spectral aerial imaging system for nitrogen crop monitoring. Preci. Agric. 2012, 13, 525–541. [Google Scholar] [CrossRef]
  37. Xue, L.; Cao, W.; Luo, W.; Dai, T.; Zhu, Y. Monitoring leaf nitrogen status in rice with canopy spectral reflectance. Agrono. J. 2004, 96, 135–142. [Google Scholar] [CrossRef]
  38. Zheng, H.; Cheng, T.; Li, D.; Zhou, X.; Yao, X.; Tian, Y.; Cao, W.; Zhu, Y. Evaluation of RGB, color-infrared and multispectral images acquired from unmanned aerial systems for the estimation of nitrogen accumulation in rice. Remote Sens. 2018, 10, 824. [Google Scholar] [CrossRef] [Green Version]
Figure 1. Plant nitrogen content, chlorophyll content, and SPAD values of early-maturing rice TNG 71 under forms of different water and fertilizer management. (a) Plant nitrogen content of the first crop (TNG71 I) and (d) the second crop (TNG71 II). (b) Chlorophyll content of TNG71 I and (e) TNG71 II. (c) SPAD values of TNG71 I and (f) TNG71 II. The physiological traits of rice with four levels of fertilizer were compared under two water management types: conventional plant (CP) and alternative wet and dry (AWD). Error bars represent SD from independent experiments. An a priori test of analysis of variance and a post hoc least significant difference test were conducted. Different letters represent significant differences (p < 0.05).
Agronomy 11 01626 g001
Figure 2. Regression analysis of vegetation indices and plant nitrogen content of early-maturing rice TNG71 under different forms of fertilization management. (a) UAV pictures and vegetation index values of the first crop of TNG71 (TNG71 I) at the maximum tillering stage and (b) the second crop of TNG71 (TNG71 II) at the heading stage. (c) Regression analysis of normalized difference vegetation index (NDVI) of TNG71 I at the maximum tillering stage and (d) TNG71 II at the heading stage. (e) Regression analysis of normalized difference red edge (NDRE) index of TNG71 I at the maximum tillering stage and (f) TNG71 II at the heading stage. The vegetation index figures represent the NDVI values, displayed using different color scales. The adjusted coefficient of determination Ra2 values are also shown.
Agronomy 11 01626 g002
Figure 3. Cross-validation scatter plots of nitrogen content estimated by the model and measured nitrogen content. (a) Cross-validation scatter plot of normalized difference vegetation index (NDVI) of TNG71 I at the maximum tillering stage. (b) Cross-validation scatter plot of normalized difference red edge (NDRE) index of TNG71 I at the maximum tillering stage. Adjusted coefficient of determination, Ra2; root-mean-square error, RMSE.
Agronomy 11 01626 g003
Figure 4. Regression analysis of difference in nitrogen nutrition index and difference in field cumulative nitrogen of TNG71 I at the maximum tillering stage. Ra2 is the adjusted coefficient of determination. The TNG71 I difference in nitrogen nutrition index (ΔNNI) was calculated using the plant nitrogen content of the optimal yield results with the alternative wet and dry (AWD) irrigation method as the standard value. The difference in field cumulative nitrogen (DFCN) was calculated using the field cumulative nitrogen of the optimal yield results with the AWD irrigation method as the standard value.
Agronomy 11 01626 g004
Figure 5. Flow chart of UAV image analysis and recommended panicle fertilizer application. The yellow squares include the vegetation index calculation of UAV image analysis. The green squares include the on-site plant nitrogen content analysis and difference in nitrogen nutrition index (ΔNNI) calculation. The blue squares include estimation of the regression model and formulation of ΔNNI. The light pink squares include the difference in field cumulative nitrogen (DFCN) estimation and panicle fertilizer recommendation. The black dotted lines in the upper half indicate the analysis for the maximum tillering stage. The black dotted lines in the lower half depict the panicle fertilizer application adjustment for the panicle differentiation stage.
Agronomy 11 01626 g005
Table 1. Analysis of variance results of water and fertilizer for the measured physiological traits of the first crop of early-maturing rice TNG71 at the maximum tillering stage.
SourceDegrees of FreedomMean Square
Nitrogen ContentChlorophyll ContentSPAD Unit
Replicate10.69430.001415.470
Water10.00290.08380.4834
Error (a)10.00510.00014.8169
Nitrogen fertilizer31.8743 *0.0346 *17.533 *
interaction31.7081 *0.0267 *0.3568
Error (b)60.22780.00512.1829
* p < 0.05.
Table 2. Analysis of variance results of water and fertilizer for the measured physiological traits of the second crop of early-maturing rice TNG71 at the heading stage.
SourceDegrees of FreedomMean Square
Nitrogen ContentChlorophyll ContentSPAD Unit
Replicate19.63950.03300.2668
Water10.88030.001233.5415
Error (a)10.21790.01102.1258
Nitrogen fertilizer317.665 **0.1214 *25.267 ***
interaction30.94280.03421.1858
Error (b)60.93970.02071.0171
* p < 0.05; ** p < 0.01; *** p < 0.001.
Table 3. Correlation analysis of the vegetation indices and physiological traits of the first and second crops of early-maturing rice TNG71 at different growth stages.
Growth StageNitrogen ContentChlorophyll ContentSPAD Unit
NDVI yNDRENDVINDRENDVINDRE
I wSeedling0.2810 z-−0.3608-0.2971-
Tillering I x0.3374−0.39910.4518 **0.35830.3234−0.3371
Tillering II0.7504 **0.7722 **0.5949 **0.6885 **0.6195 **0.5900 **
Max tillering0.8294 **0.8153 **0.4500 **0.4828 **0.6805 **0.6691 **
Booting0.8005 **0.8242 **0.30390.28550.35820.3445
Heading0.7053 **0.7786 **0.5007 **0.6198 **0.6991 **0.6355 **
Filling0.5151 **0.5758 **0.7945 **0.7888 **0.7614 **0.7754 **
IIInitial tillering0.36550.3222−0.3638−0.35680.38500.5126 **
Tillering0.5047 **0.4515 **0.28500.39010.4251 **0.6036 **
Max tillering−0.4315 **−0.33000.4798**0.6041 **0.27020.4081 **
Heading0.4905 **0.7051 **0.13990.7747 **0.27470.5483 **
Filling I0.38450.6302 **0.32700.6449 **0.28330.5511 **
Filling II0.5894 **0.26980.8517 **0.8766 **0.7423 **0.7864 **
** p < 0.01 z The value is the correlation coefficient between vegetation index and physiological traits. y NDVI (normalized difference vegetation index); NDRE (normalized difference red edge index). x Tillering I is the initial stage of tillering after the first topdressing; Tillering II is the middle tillering stage after the second topdressing; Filling I is the milk stage during the grain fill process; Filling II is the yellow ripe stage during the grain fill process. w I is the first crop; II is the second crop.
Table 4. Regression analysis of the vegetation indices and physiological traits of the first and second crops of early-maturing rice TNG71 at different growth stages.
Growth StageNitrogen ContentChlorophyll ContentSPAD Unit
NDVI yNDRENDVINDRENDVINDRE
I wSeedling0.0132 z-0.0680 -0.0232 -
Tillering I x0.04960.0992 0.1471 0.0661 0.0406 0.0503
Tillering II0.5318 0.5671 0.3068 0.4364 0.3389 0.3014
Max tillering0.6668 0.6418 0.1439 0.1762 0.4246 0.4080
Booting0.5071 0.5470 0.0276 0.0159 0.0660 0.0556
Heading0.4611 0.5781 0.1372 0.2629 0.4914 0.4025
Filling0.2128 0.2839 0.6049 0.5938 0.5498 0.5728
IIInitial tillering0.0564 0.0383 0.0575 0.01620.0883 0.1744
Tillering0.1969 0.1318 0.0100 0.1128 0.1349 0.3084
Max tillering0.1233 0.0348 0.2177 0.3111 0.0070 0.1016
Heading0.3812 0.5928 0.3025 0.4415 0.0139 0.2469
Filling I0.0869 0.3541 0.0431 0.3742 0.0095 0.3577
Filling II0.2972 0.3235 0.7068 0.7535 0.5191 0.5913
z The value is the adjusted coefficient of determination. y NDVI (normalized difference vegetation index); NDRE (normalized difference red edge index). x Tillering I is the initial stage of tillering after the first topdressing; Tillering II is the middle tillering stage after the second topdressing; Filling I is the milk stage during the grain fill process; Filling II is the yellow ripe stage during the grain fill process. w I is the first crop; II is the second crop.
Publisher’s Note: MDPI stays neutral with regard to jurisdictional claims in published maps and institutional affiliations.

