Article

Genome-Wide Identification and Expression Analysis of the BTB Domain-Containing Protein Gene Family in Sugar Beet

1
College of Modern Agriculture and Ecologcial Environment, Heilongjiang University, Harbin 150080, China
2
Sugar Beet Engineering Research Center of Heilongjiang Province, Heilongjiang University, Harbin 150080, China
*
Author to whom correspondence should be addressed.
Agronomy 2022, 12(2), 253; https://doi.org/10.3390/agronomy12020253
Submission received: 8 December 2021 / Revised: 14 January 2022 / Accepted: 17 January 2022 / Published: 20 January 2022
(This article belongs to the Section Crop Breeding and Genetics)

Abstract

:
Cercospora leaf spots (CLSs) is a fungal disease of sugar beet caused by C. beticola, which damages leaves and leads to yield cut on sugar beet worldwide. BTB protein genes are critical to plant defense against bacterial infection. Here, 49 members of the BTB protein gene family were identified from the big data of the sugar beet genome, and bioinformatics was used to analyze the BTB protein family. Through molecular techniques, C. beticola of CLS was identified. In addition, the transcriptome data of sugar beet resistant and susceptible materials after C. beticola infection were obtained. Three BTB genes most significantly related to C. beticola stress were screened from the transcriptome data. The three genes are BvBTB1, BvBTB2, and BvBTB3, their full-length cDNA sequences were acquired by RT-PCR. The phenotypes of sugar beet resistant and susceptible materials under different spore concentrations of C. beticola were analyzed. Further, under the stress of C. beticola, qRT-PCR results showed that the expression levels of BvBTB1, BvBTB2, and BvBTB3 in roots and leaves were tissue-specific and expressed differently in various tissues. BvBTB1, BvBTB2, and BvBTB3 were overexpressed in the resistant and susceptible materials within five days after C. beticola infection: the peak appeared on the fifth day, and the highest expression was 25 times that of the control group. However, the lowest was 1.1 times of the control group, moreover, the expression in the resistant material was higher than that in the susceptible material. Overall, these results showed that BvBTB genes were involved in the response in sugar beet to C. beticola infection. Therefore, the study provided a scientific theoretical basis for developing new resistant varieties in sugar beet.

1. Introduction

The BTB protein family is a new protein family, and it has been found in plants in recent years. The BTB protein family contains a conserved BTB protein-protein interaction motif, members of the family are diverse, there are 150 and 80 members of the BTB gene family in Arabidopsis and rice, respectively [1].
The BTB protein family has performed an important role in plant growth and development, disease resistance, stress resistance, protein ubiquitination and degradation, cytoskeleton composition, ion channel and cell cycle regulation [2,3,4]. NPR1 is an important gene of BTB protein genes under plant stress. NPR1 was first cloned from Arabidopsis [5,6,7,8], and it has been shown that overexpression of NPR1 can improve disease resistance. NPR1 regulated systemic acquired resistance (SAR) in Arabidopsis, the interaction between nuclear localized NPR1 and TGA transcription factors, led to the activation of defense genes. Overexpression of NPR1 in Arabidopsis increased the resistance to Pseudomonas syringae, Peronospora parasitica, and Erysiphe cichoracearum [9]. The high expression of transgene Arabidopsis AtNPR1 in rice enhanced the resistance of rice to bacterial blight and rice blast [10,11,12], overexpression of transgene Arabidopsis AtNPR1 in tomato showed resistance to broad spectrum to pathogens [11], overexpression of transgene Arabidopsis NPR1 improved wheat sharp eyespot resistance in transgenic wheat [13,14]. Overexpression of MpNPR1 in transgenic apples increased the resistance to pathogenic bacteria Erwinia amylovora, Venturia inaequalis, and Gymnosporangium juniperi-virginianae. MnNPR1A and MnNPR1B, the members of NPR1 subfamily in banana, were transferred into Arabidopsis NPR1 mutant, it was found that the two genes can reactivate the resistance of NPR1 mutant to pathogens, and the two genes induced the normal expression of PR1 protein [15,16]. In cucumbers, CsBTB presented different expression patterns in cucumber tissues, and CsBTB expression levels were regulated by cold stress, salt stress and drought stress [17]. CaBPM4 silencing significantly reduced the resistance to Phytophthora capsici and root activity by changing the transcriptional levels of CaPR1, CaDEF1, and CaSAR82 which were related to immunity and defense [18,19]. Overexpression of AtNPR1 in monocotyledonous plants improved the ability to resist pathogens, which suggested that monocotyledons and dicotyledons may have the same NPR1 disease resistance regulation pathway. The highly expressed AtNPR1 gene was introduced into common wheat, in order to obtain transgenic a transgenic wheat strain with significantly improved sharp eyespot resistance, a highly expressed AtNPR1 gene was driven by the ubiquitin promoter, which further verified the important role of AtNPR1 gene in plant disease resistance [11]. Specifically, GmBTB was a new nuclear protein of the BTB domain, which positively regulated the response of soybean to Phytophthora sojae infection. Overexpression of GmBTB can improve the resistance to Phytophthora sojae [5].
Sugar beet (Beta vulgaris L.), one of the main sugaring raw materials, is the second largest sugar crop in the world, 25% of sucrose is provided by sugar beet. CLS is a fungal disease caused by Cercospora beticola. CLS is a worldwide disease that affects sugar beet yield and CLS occurs in all sugar beet planting countries [20]. It is reported that sugar beet yield loss caused by CLS reached 50% [21]. C. beticola is a destructive pathogen in sugar beet, in the long-term evolution of plants, and complex disease resistance mechanisms against pathogen infection have been formed [22]. However, the pathogenesis and molecular mechanism of sugar beet defense response to CLS are not clear. Up to now, there are few studies on BTB genes in sugar beet, and identifying resistance to CLS has not been found.

2. Materials and Methods

2.1. Materials and Treating Methods

For many years, among our research materials, resistant material ‘F85621’, has been one of the most common materials with resistance to C. beticola, and susceptible material ‘KWS9147’, has been one of the most sensitive to C. beticola, both self-fertile materials were specially provided by the Sugar Beet Resistance Breeding Laboratory of Heilongjiang University, Harbin, China. The two materials were used for expression analysis and gene isolation in this study. ‘F85621’ and ‘KWS9147’ beet plants were grown at 25 °C in a 16-h/8-h light/dark photoperiod with 70% relative humidity for 15 days.
C. Beticola was isolated from infected beet plants in Heilongjiang, China (Yang et al., 2017) and cultivated at 25 °C for 15 days on PDA medium.
Pathogen isolation: tissue isolation method [23]. The surfaces of the collected diseased leaves were cleaned with tap water and wiped with absorbent paper, then a 0.5 × 0.5 cm2 tissue block was taken from the diseased leaf with a sterile scalpel, the tissue blocks were placed on a PDA plate and cultured alternately at 28 °C for 12 h/12 h under light and dark for 15 days. Then, according to the morphological observation of C. beticola, C. beticola was continuously selected from the fungus in the culture medium until it was completely isolated.
Purification of pathogen: the isolated fungus was eluted with sterile water and diluted to an average of only one spore per visual field, the spore was directly picked out on the PDA plate under the microscope and cultured alternately at 28 °C for 12 h/12 h under light and dark for 15 days for standby.
In this study, the ITS gene sequence was selected to amplify the isolated pathogenic strain. The ITS gene primers were designed by ourselves, and relevant articles were referred to while designing ITS gene primers [23,24]. The required primers are shown (Table 1), all primers were designed in this paper. The ITS sequence of the C. beticola strain was amplified by PCR, the PCR products were connected into λ DNA, and then the products of ligation were sent to the company for sequencing, C. beticola was obtained, 7 × 10⁶ and 16 × 106 spores/mL spore suspensions were prepared.
Three plants with the same growth and no mechanical damage were taken separately from the resistant and susceptible materials, the surfaces of plants were disinfected with 75% alcohol and then cleaned with sterile water, plants were recovered after one day. The spore concentrations of 7 × 10⁶ spores/mL of C. beticola were used to infect the plants by spraying, after 12 h of infection, three leaves of the same part were taken separately from the two materials for RNA extraction and transcriptome analysis, according to the transcriptome data, three BTB genes with the most significant differences were selected.
The leaves of resistant and susceptible materials were sprayed with spore suspension with spore concentrations of 7 × 10⁶ and 16 × 106 spores/mL of C. beticola, and the control group was sprayed with distilled water, the three plants with the same growth and no mechanical damage were taken separately in the same area of the small pot at each time period of 0, 120, 168, and 216 h for the test, at the same time, the samples were photographed to note their phenotypes.
‘F85621’ mRNA was used to amplify the full-length cDNA sequences of BvBTB. A high-fidelity enzyme from Takkara Bio, Dalian PrimeSTAR® Max DNA Polymerase, was used, and the reaction system was a total of 50 μL, including 25 μL Prime STAR Max Premix (2×), 10 μmol/L upstream and downstream primers 2 μL each, cDNA 2 μL (150~200 ng/μL), finally, making up to 50 μL with ddH2O. The primers used are provided (Table 1). The PCR amplification conditions: 98 °C for 3 min; 98 °C for 10 s, 54, 58, and 62 °C for 15 s, 72 °C for 1 min, 30 cycles; 72 °C for 5 min.

2.2. Expression Analysis of BvBTB1, BvBTB2, and BvBTB3

The extraction of total RNA and reverse transcription were performed using TRIzol reagent (Invitrogen, Shanghai, China) and a ReverTra Ace Kit (Toyobo, Osaka, Japan) according to the manufacturer’s protocol. The qRT-PCR was employed to measure the gene expression levels using a TB Green ® Premix EX Taq™ II collection kit (Takkara Bio, Dalian, China) with an ABI 7500 real-time fluorescence quantitative PCR instrument (Roche, Shanghai, China). The gene expression levels were calculated by the 2−ΔΔCt method with Gapdh as the internal control. The qPCR analyses were performed with three technical replicates. The primers used for expression analysis are shown (Table 1). The total reaction system was 20 μL, including 10 μL TB Green Premix Ex Taq II (2X), 10 μmol/L upstream and downstream primers 2 μL each, 2 μL ROX Reference Dye, 2 μL cDNA, making up to 50 μL with sterile H2O. By using the Mx3000 p fluorescence quantitative PCR instrument for qRT-PCR, the reaction procedure is as follows: 95 °C for 30 s, 95 °C for 5 s, 60 °C for 34 s, 40 cycles; 95 °C 15 s, 60 °C 1 min, 95 °C 15 s. The significance was analyzed by the Spass software.

2.3. Bioinformatic Analysis of BTB Proteins and Genes

Sequences of all BTB protein genes are publicly available on NCBI, Bethesda, MD, USA. By using the SMART database (http://smart.embl-heidelberg.de, accessed on 21 June 2021), all proteins containing the BTB domain in sugar beet were obtained, verifying them through NCBI (https://www.ncbi.nlm.nih.gov, accessed on 23 June 2021) and Pfam database (http://pfam.sanger.ac.uk, accessed on 23 June 2021), finally, a total of 49 BTB protein genes and 49 proteins were obtained. The BTB protein and gene sequences were obtained. TBtools were used to predict the domain of the BTB protein family and to analyze cis elements of the BTB protein gene family.
The physical and chemical properties of the BTB protein family were analyzed by using the online software pI/MW (http://Web.Easy.Org/protparam, accessed on 29 June 2021).

2.4. Statistical Analysis

All experiments in this study were performed at least three times. Statistical significance between different measurements was examined by variance analysis. A difference was considered to be statistically significant when p < 0.05, different letters represent significant levels of p < 0.05.

3. Results

3.1. Analysis of Physicochemical Properties of the BTB Protein Family in Sugar Beet

According to the different domains in the BTB protein family in sugar beet, the BTB proteins were divided into nine subfamilies in sugar beet and played different roles, the nine subfamilies were: Ankyrin, Armadillo, MATH, NPH3, BACK, TAZ, TPR, BTB-only, and other. The physical and chemical properties of 49 members of the BTB protein family in sugar beet were analyzed by the online software pI/MW (http://Web.Easy.Org/protparam, accessed on 29 June 2021) (Table 2). Gene accession numbers of the BTB protein family are shown (Table 2). The number of amino acids encoded by 49 proteins ranged from 139 to 1120. The isoelectric points of 49 proteins ranged from 4.70 to 9.51, except for the proteins of the TAZ subfamily and NPH3 subfamily, the isoelectric points of other subfamilies were distributed between 5.5 and 7.63, which showed that most of the amino acids encoded by sugar beet BTB gene family are acidic amino acids. Except for BVRB—7 g 159950 and BVRB—05090, the average hydrophilicity and hydrophobicity of other proteins were negative, suggesting that most of the BTB protein family in sugar beet belonged to hydrophilic proteins. In addition, the number of phosphorylation sites of 49 BTB proteins ranged from 3 to 25, and the results of subcellular localization prediction showed that most proteins of the sugar beet BTB family were located in the nucleus, and the remaining proteins were located on the cell membrane and chloroplast respectively. The protein accession numbers of BvBTB1, BvBTB2, and BvBTB3 were BVRB—5 g 109820, BVRB—000890, and BVRB—9 g 217510, respectively.

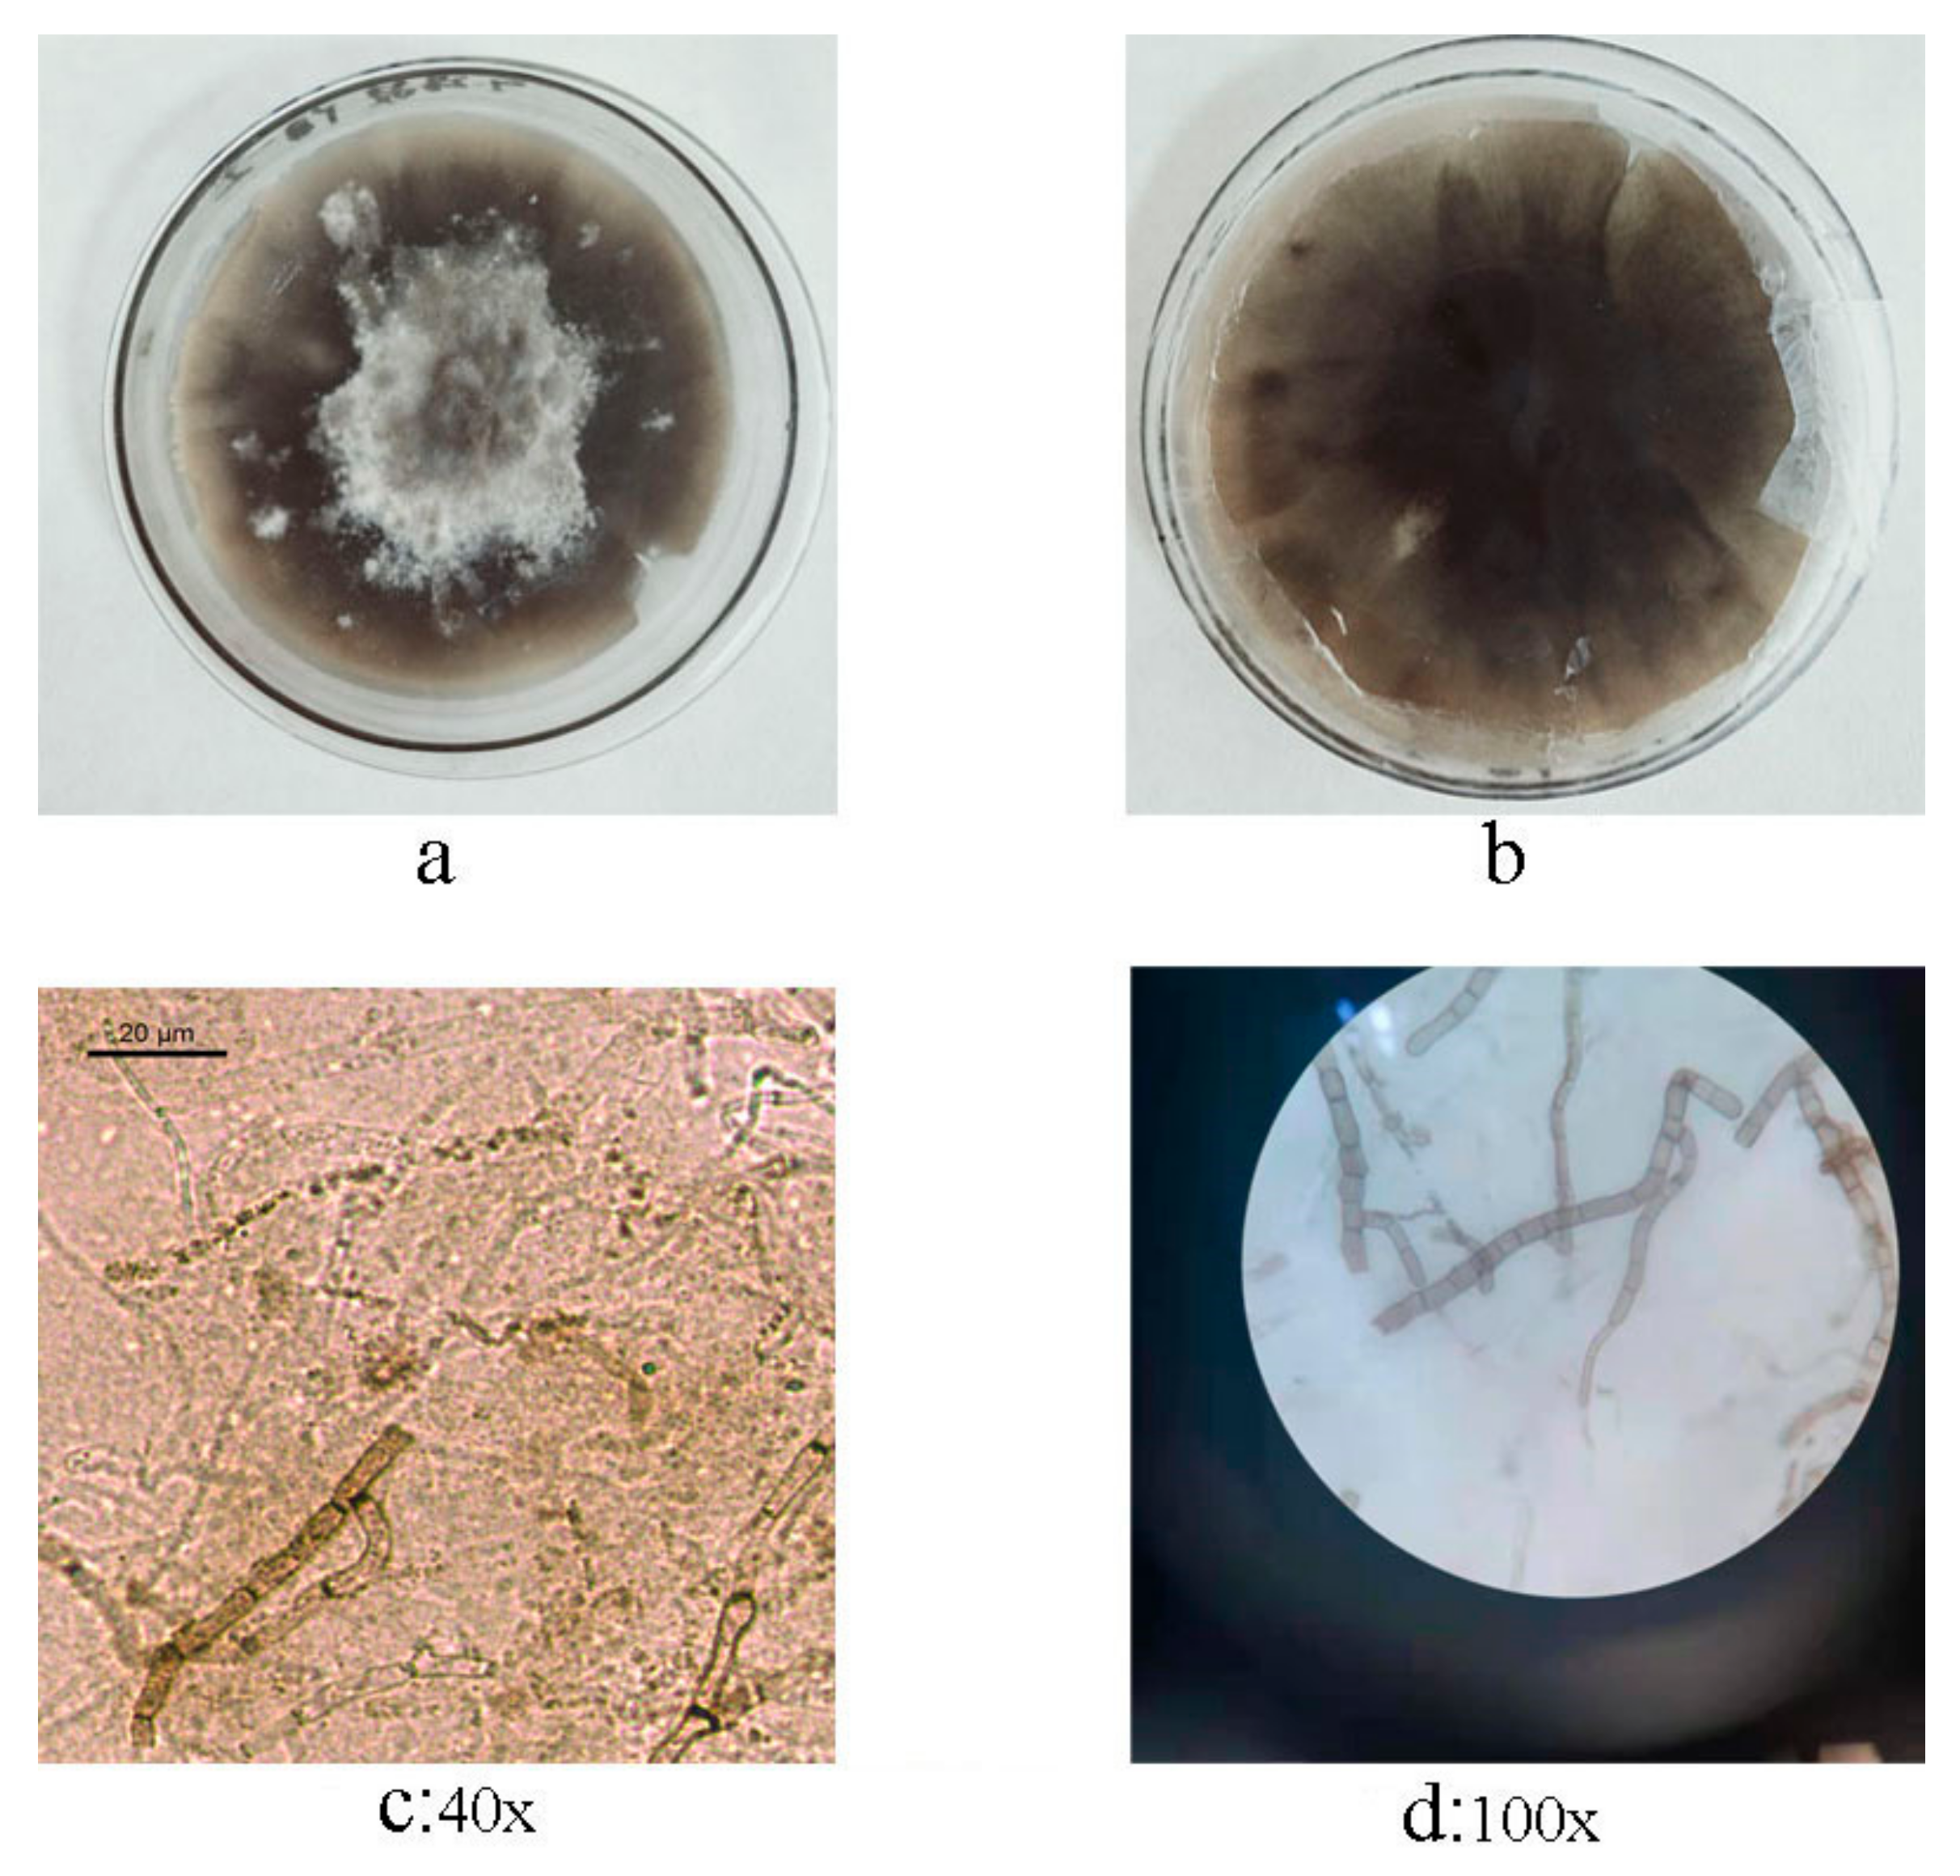
3.2. Isolation and Morphological Identification of C. beticola in Sugar Beet

Sugar beet diseased leaves with CLS cultured in PDA medium until C. beticola was isolated, and the morphology of C. beticola was observed and identified. The colony of C. beticola was round and gray white with a diameter of 0.5~6 µm, there was a dark brown and black matrix on the gray background of C. beticola (Figure 1a,b). The conidia of C. beticola were light brown, 2.5~4 µm wide, 50~200 µm long with few branches, and in the shape of a transparent needle, and had many diaphragms (Figure 1c,d).

3.3. Confirmation to C. beticola in Sugar Beet

The ITS sequence of the C. beticola strain was amplified by PCR (Figure 2), and the ITS sequence was obtained. The PCR products were connected to λ DNA, and then the products of ligation were sent to the company for sequencing. The results showed that the total length of CDS of the ITS gene was 700 bp, which was identified as C. beticola of CLS by molecular identification.

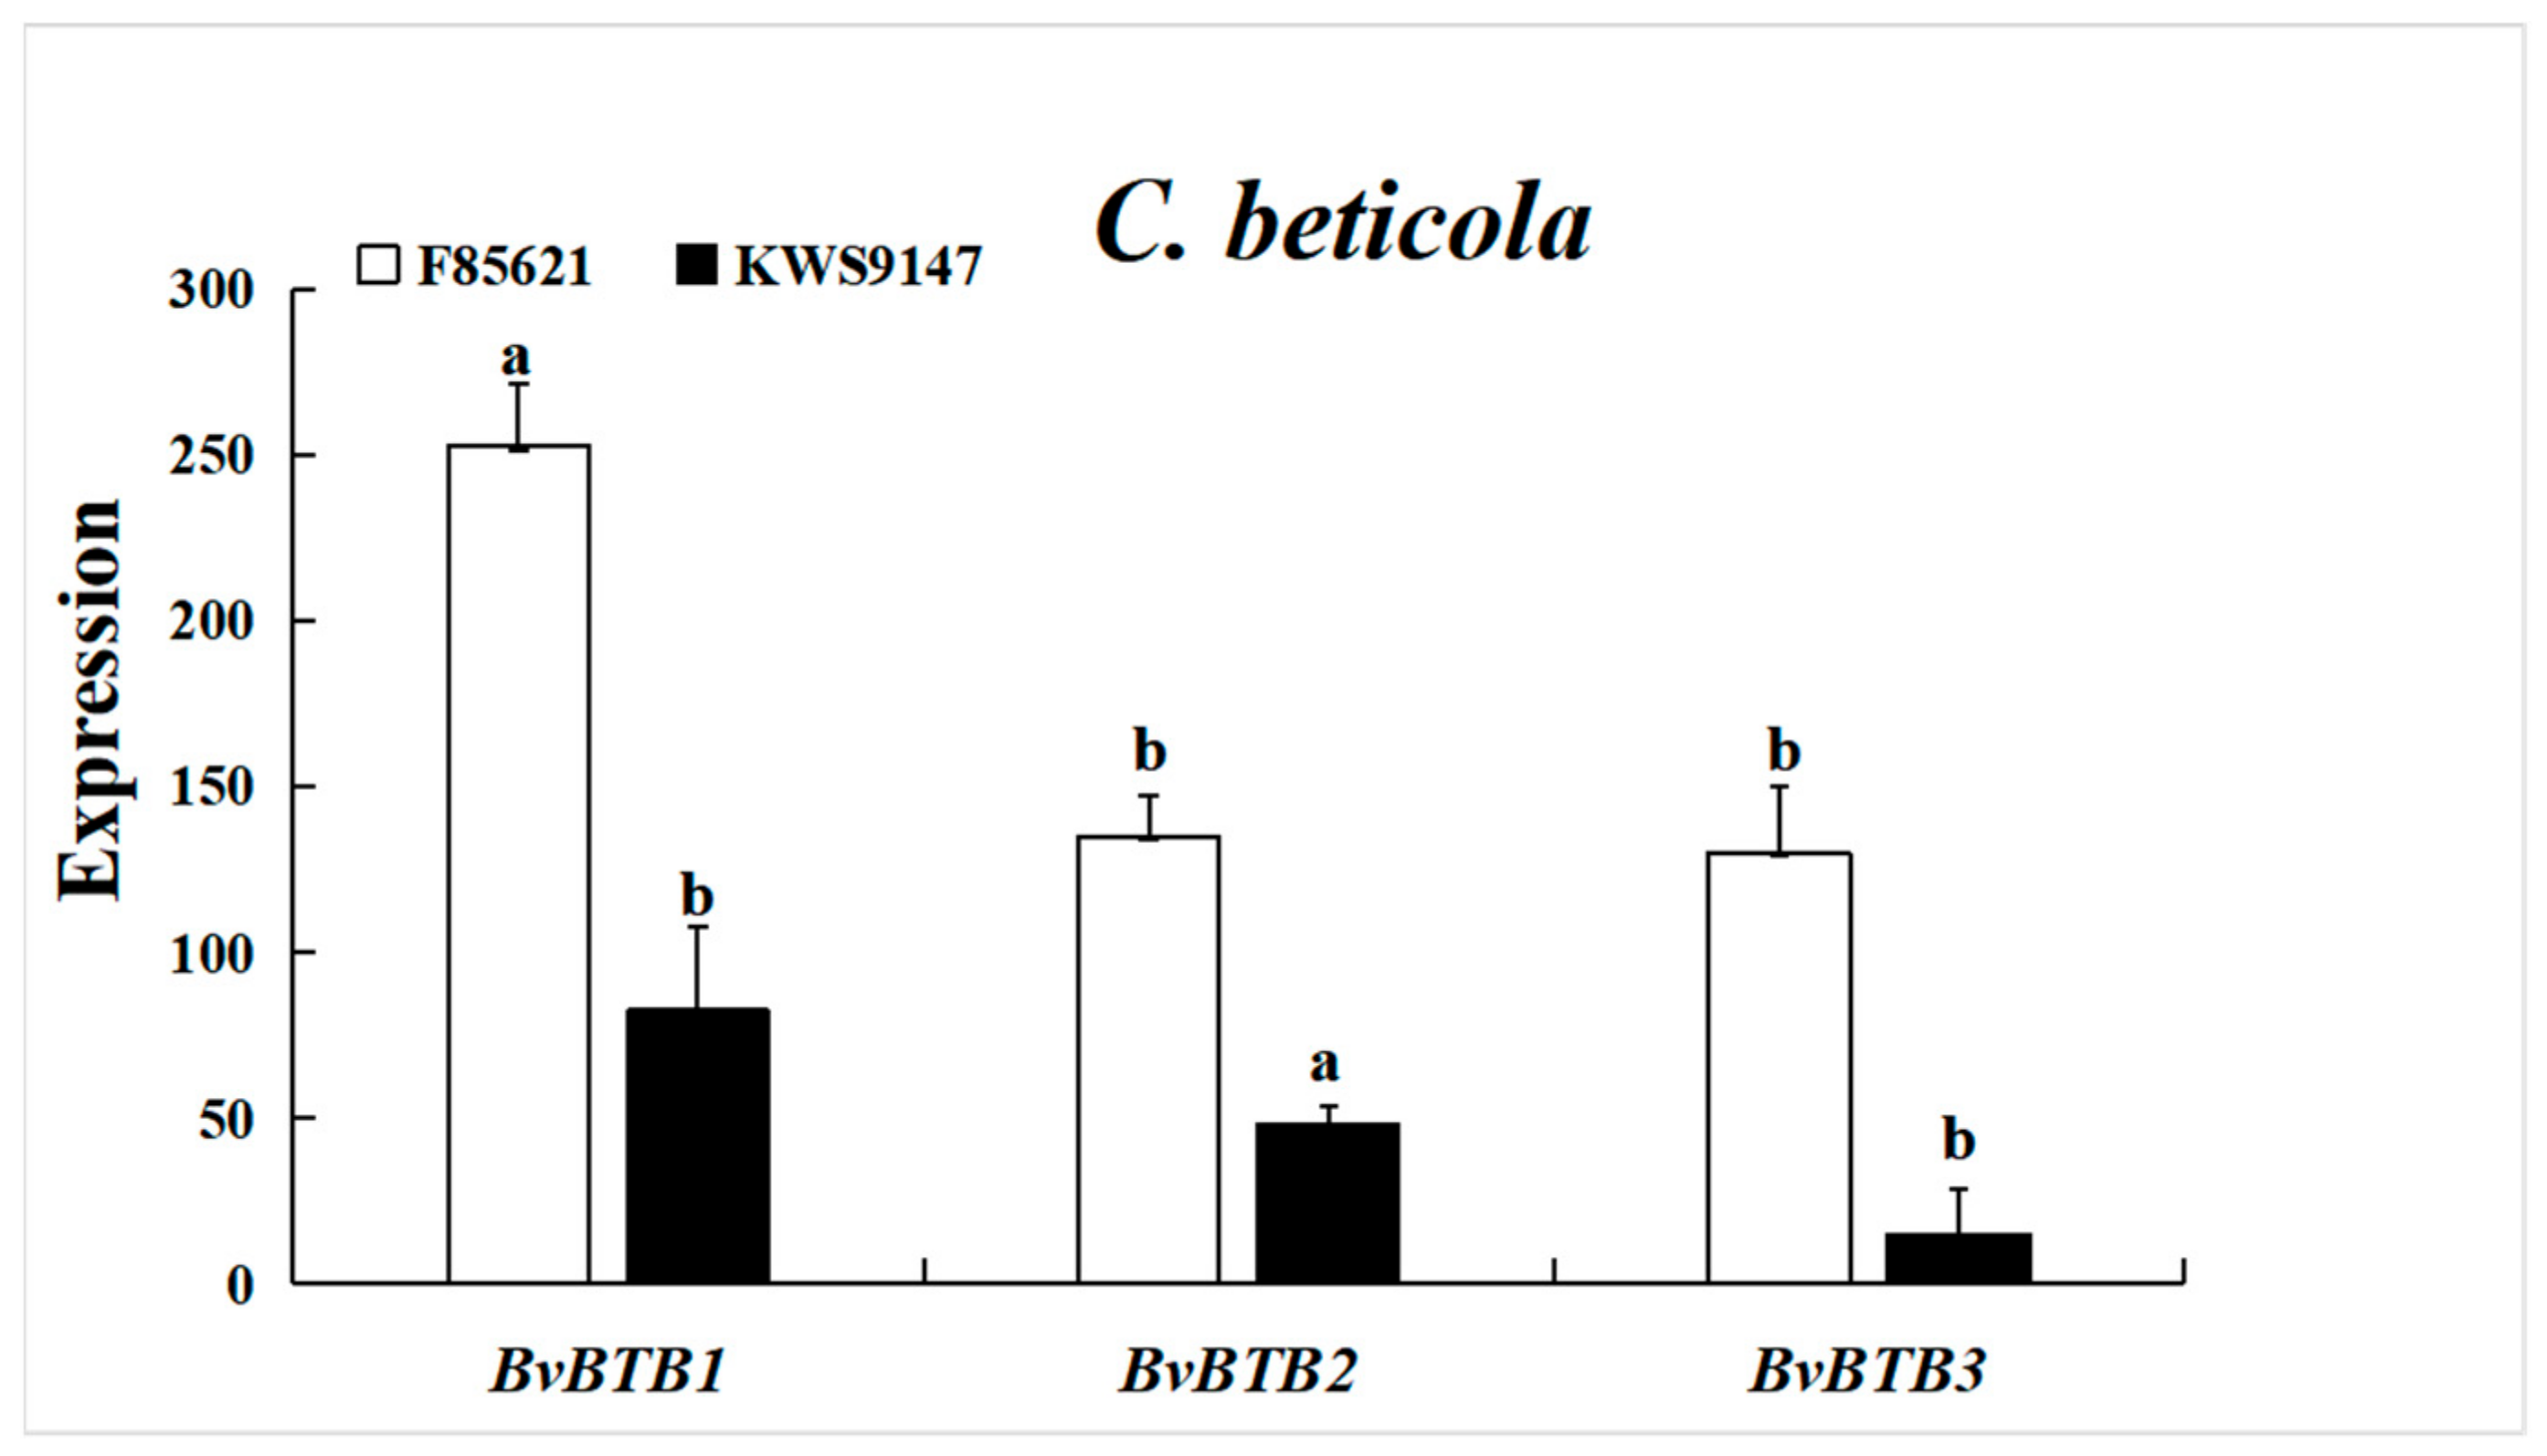
3.4. Screening BvBTB Genes with Significant Differential Expression

The transcriptome data of the resistant material ‘F85621’ and susceptible material ‘KWS9147’ in sugar beet in response to the C. beticola infection were analyzed. The most significantly expressed BvBTB1, BvBTB2, and BvBTB3 were found from the BTB protein gene family, expression of BvBTB1 was the highest, it was about 252. In the resistant material, expression of BvBTB1 was about 2 times that of BvBTB2 and BvBTB3, while in susceptible materials, expression of BvBTB1 was about 1.8 times that of BvBTB2, expression of BvBTB1 was about 5.6 times that of BvBTB3. Further, expression of BvBTB genes in the resistant material was significantly higher than that in the susceptible material (Figure 3).

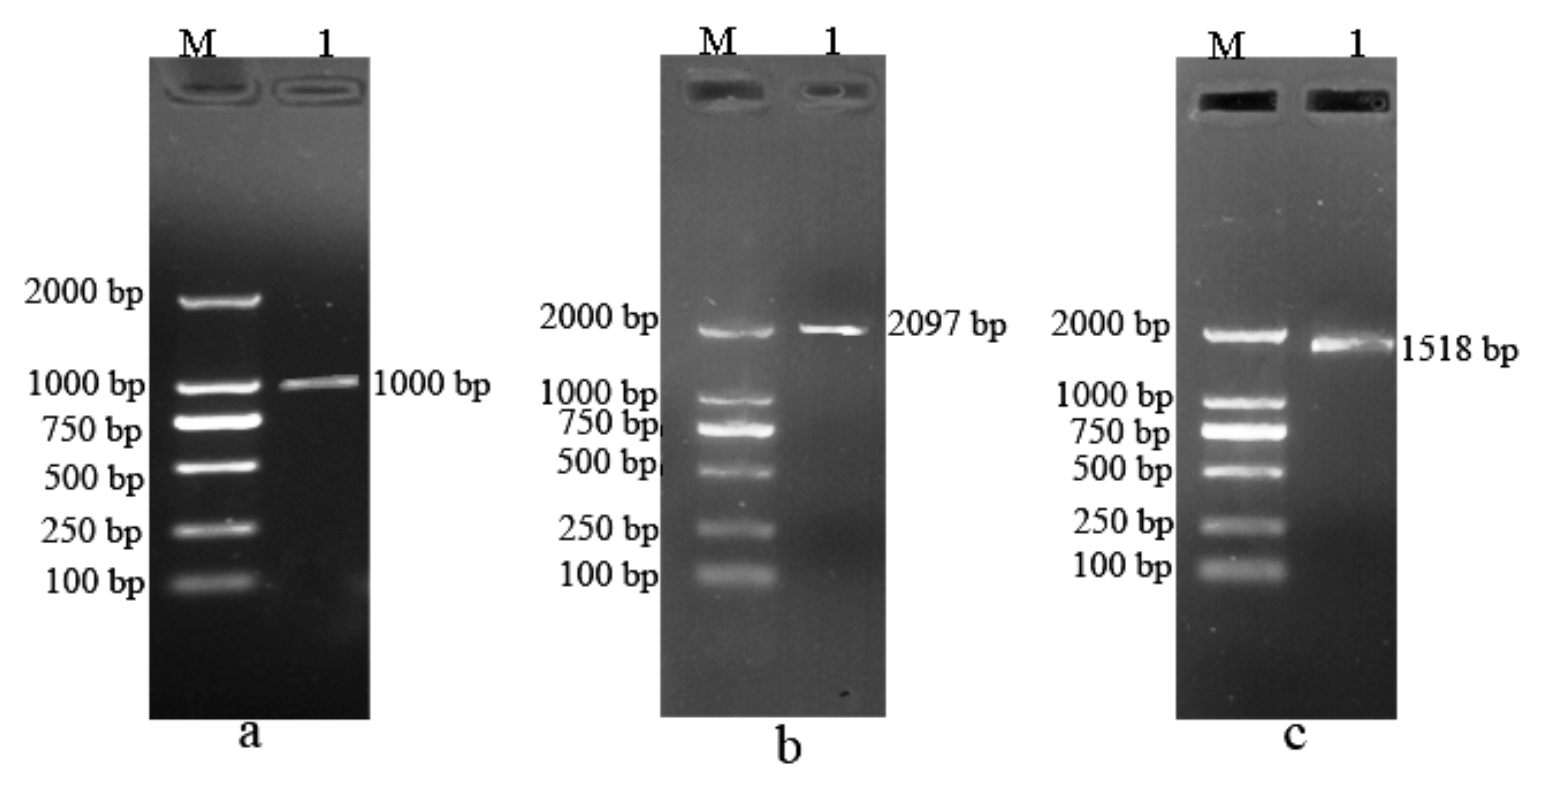
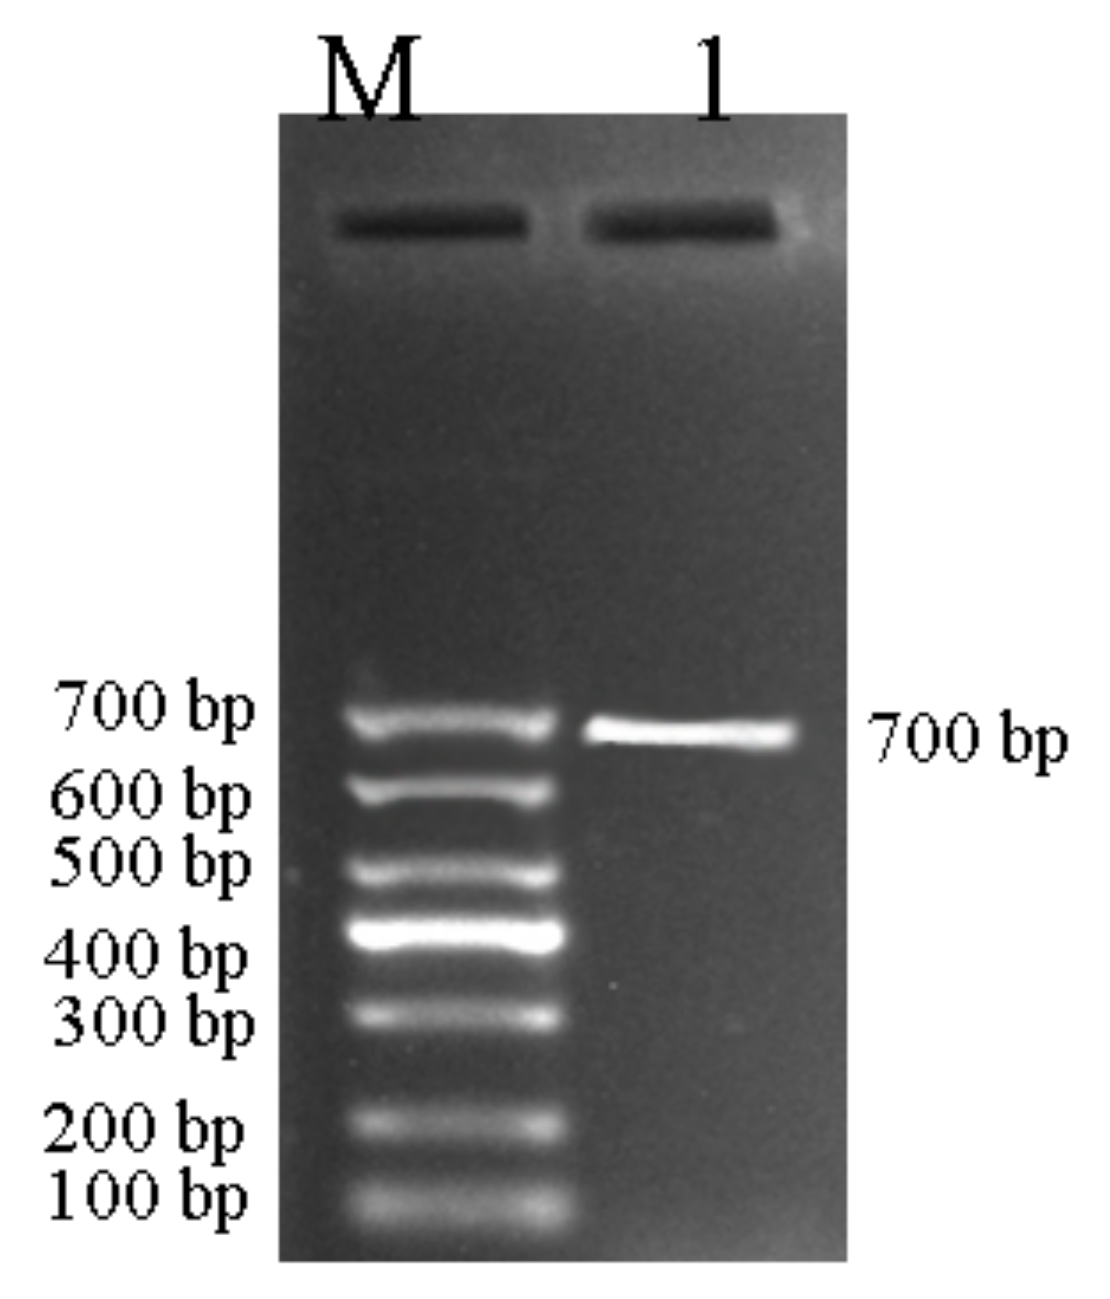
3.5. Agarose Gel Electrophoresis of PCR Amplification of BvBTB1, BvBTB2, and BvBTB3

Gene accession numbers of BvBTB1, BvBTB2, and BvBTB3 were found in the NCBI, Bethesda, MD, USA database, which were KMT11299.1, 104883420, and KMT00450.1, respectively, the three full-length cDNA sequences were acquired, and their lengths were 1746, 2097, and 1518 bp, respectively, primers were designed according to the cDNA sequences for RT-PCR amplifying, the amplified bands were about 1000 (Figure 4a), 2097 (Figure 4b), and 1518 bp (Figure 4c), respectively.

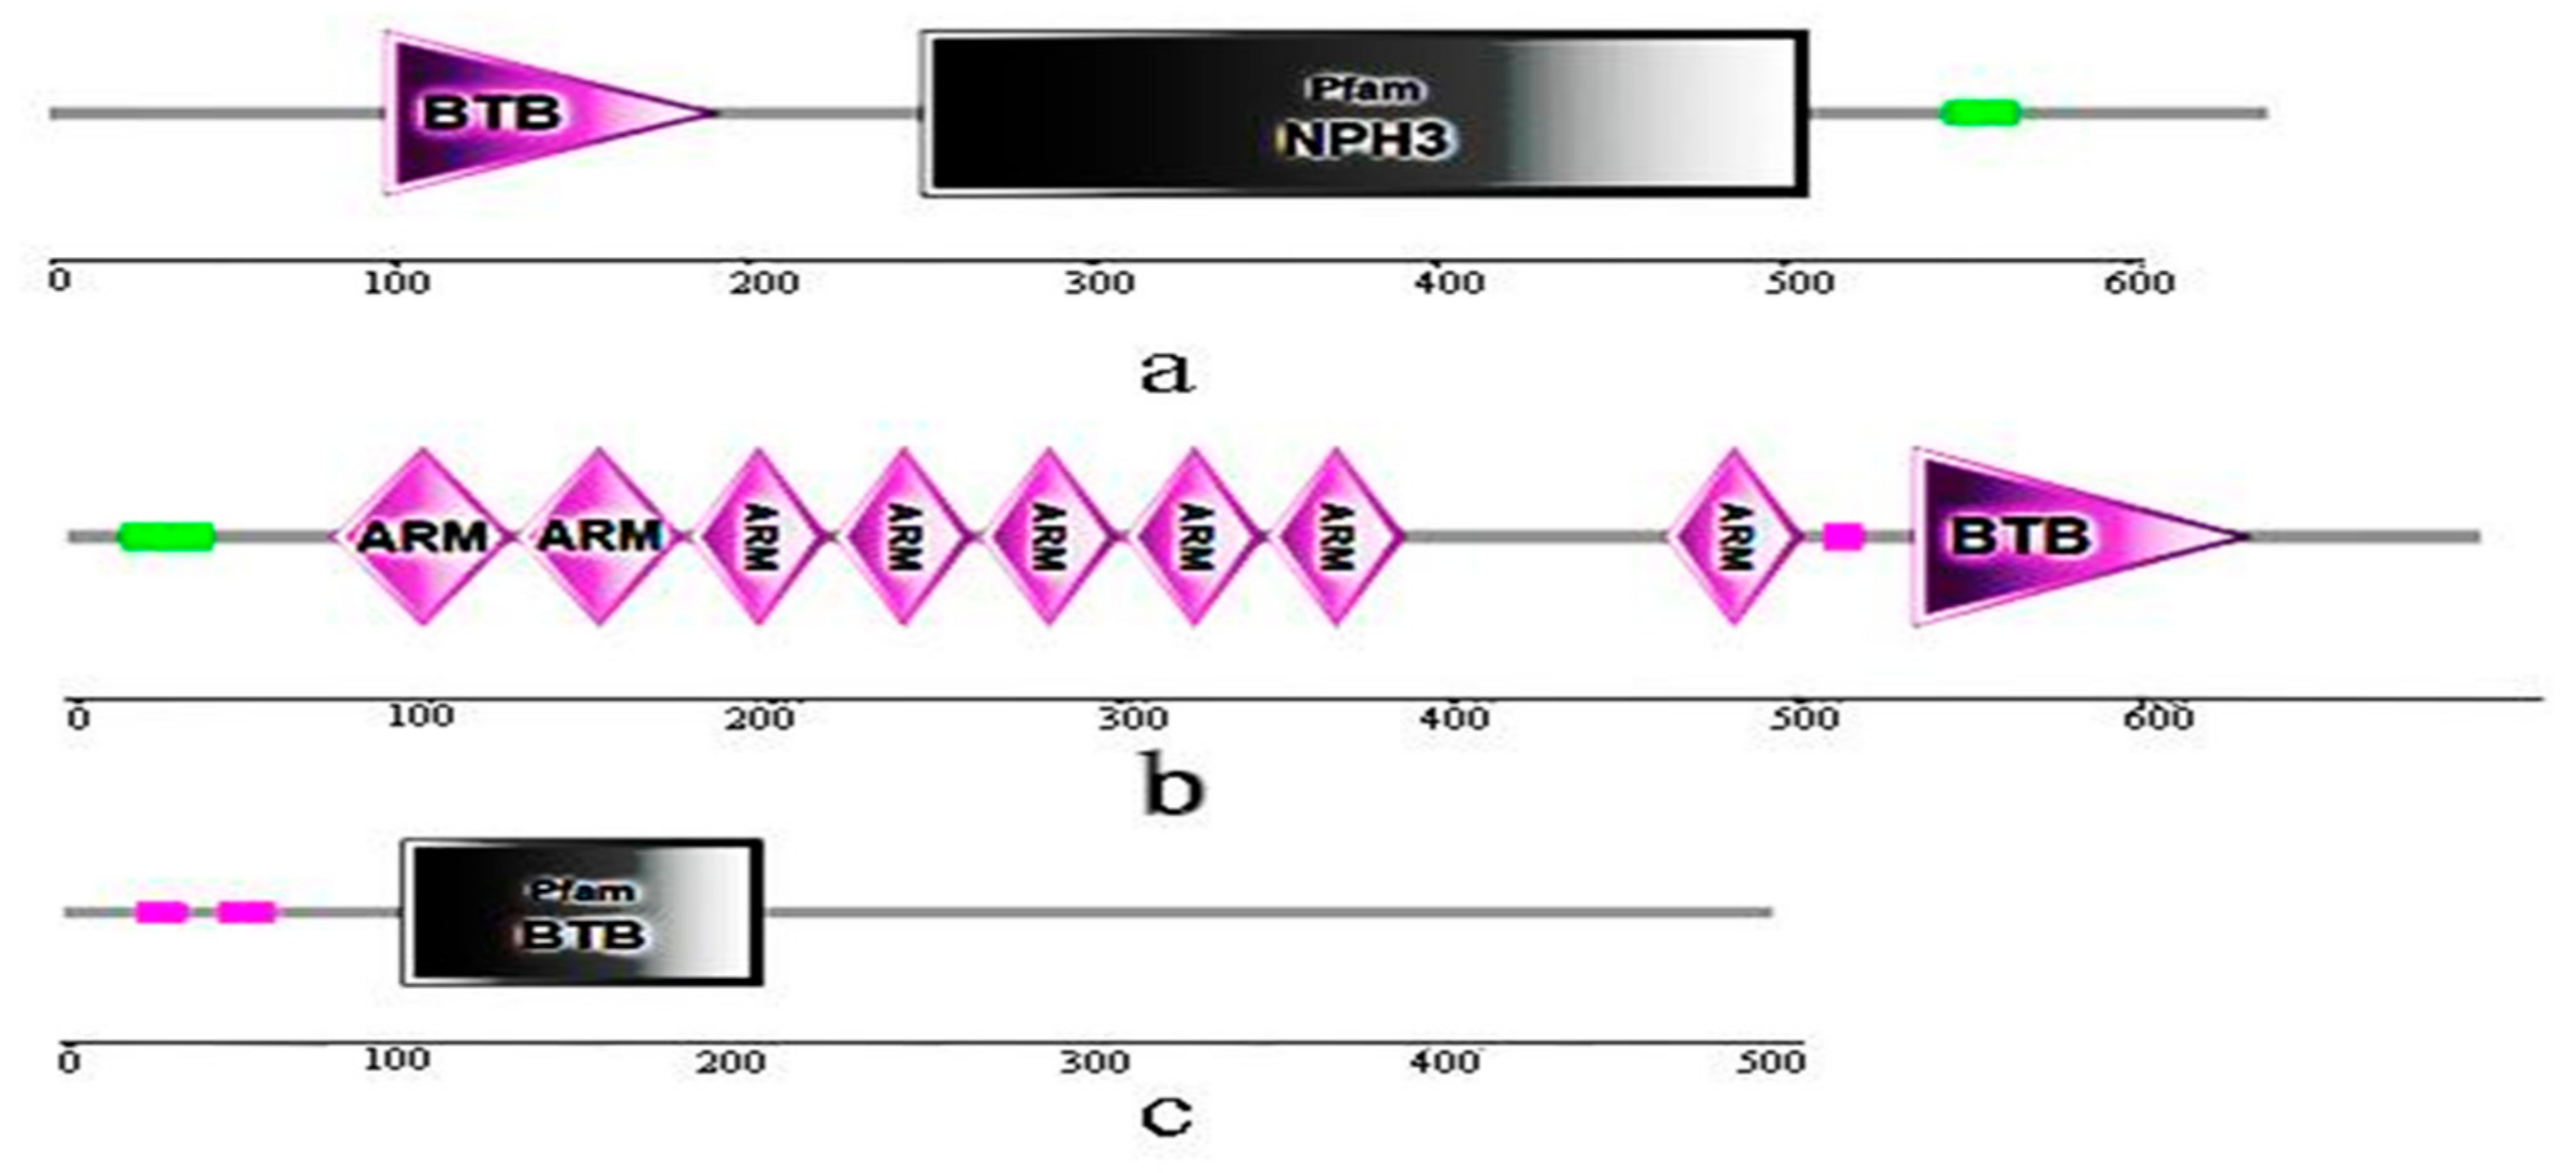
3.6. Conserved Domains of BvBTB1, BvBTB2, and BvBTB3 Proteins

Conserved domains of the BvBTB proteins were analyzed: BvBTB1, BvBTB2, and BvBTB3 proteins all had a unique conserved domain BTB belonging to the BTB protein family. In addition to the BTB domain, BvBTB1 protein also had an NPH3 domain, and BvBTB2 protein also had eight ARM domains with unknown roles, however, BvBTB3 protein had only the BTB domain (Figure 5).

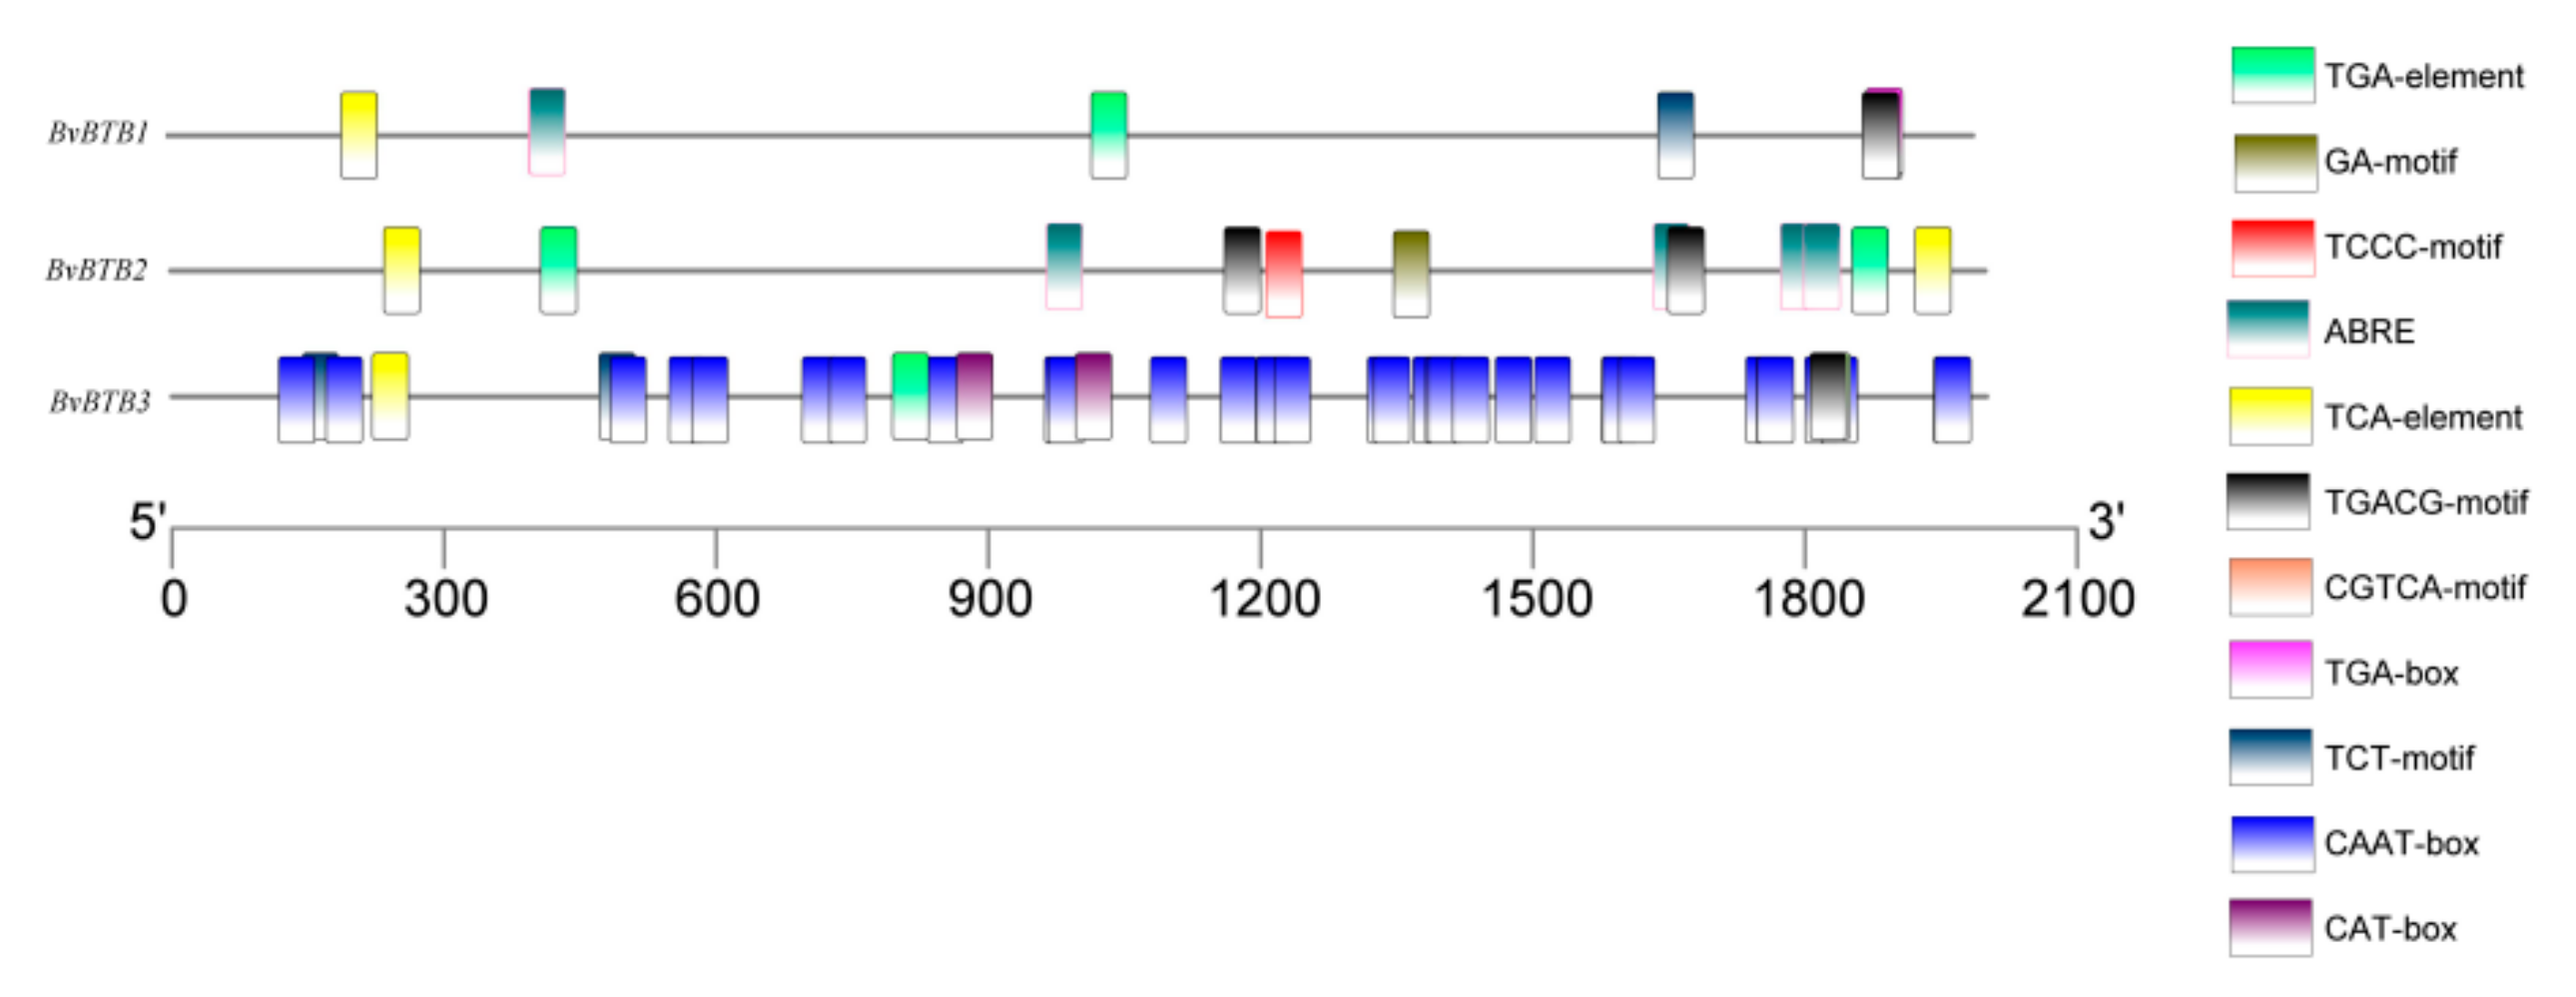
3.7. Analysis of Promoter Elements of BvBTB1, BvBTB2, and BvBTB3

The promoter elements of BvBTB genes with 2000 bp upstream of the transcription beginning site were analyzed, and their regulatory roles at the transcription level were also analyzed. Most cis regulatory elements of BvBTB genes were screened, which were related to light, defense, stress, MeJA response, endosperm, meristem expression, and circadian rhythm control, such as G-boxlight element related to light response, TCA-element related to hormone and to salicylic acid response, and TC-rich repeats element related to stress response including defense and stress response. Among them, BvBTB genes contained the most important core TGA element related to bacterial defense (Figure 6).

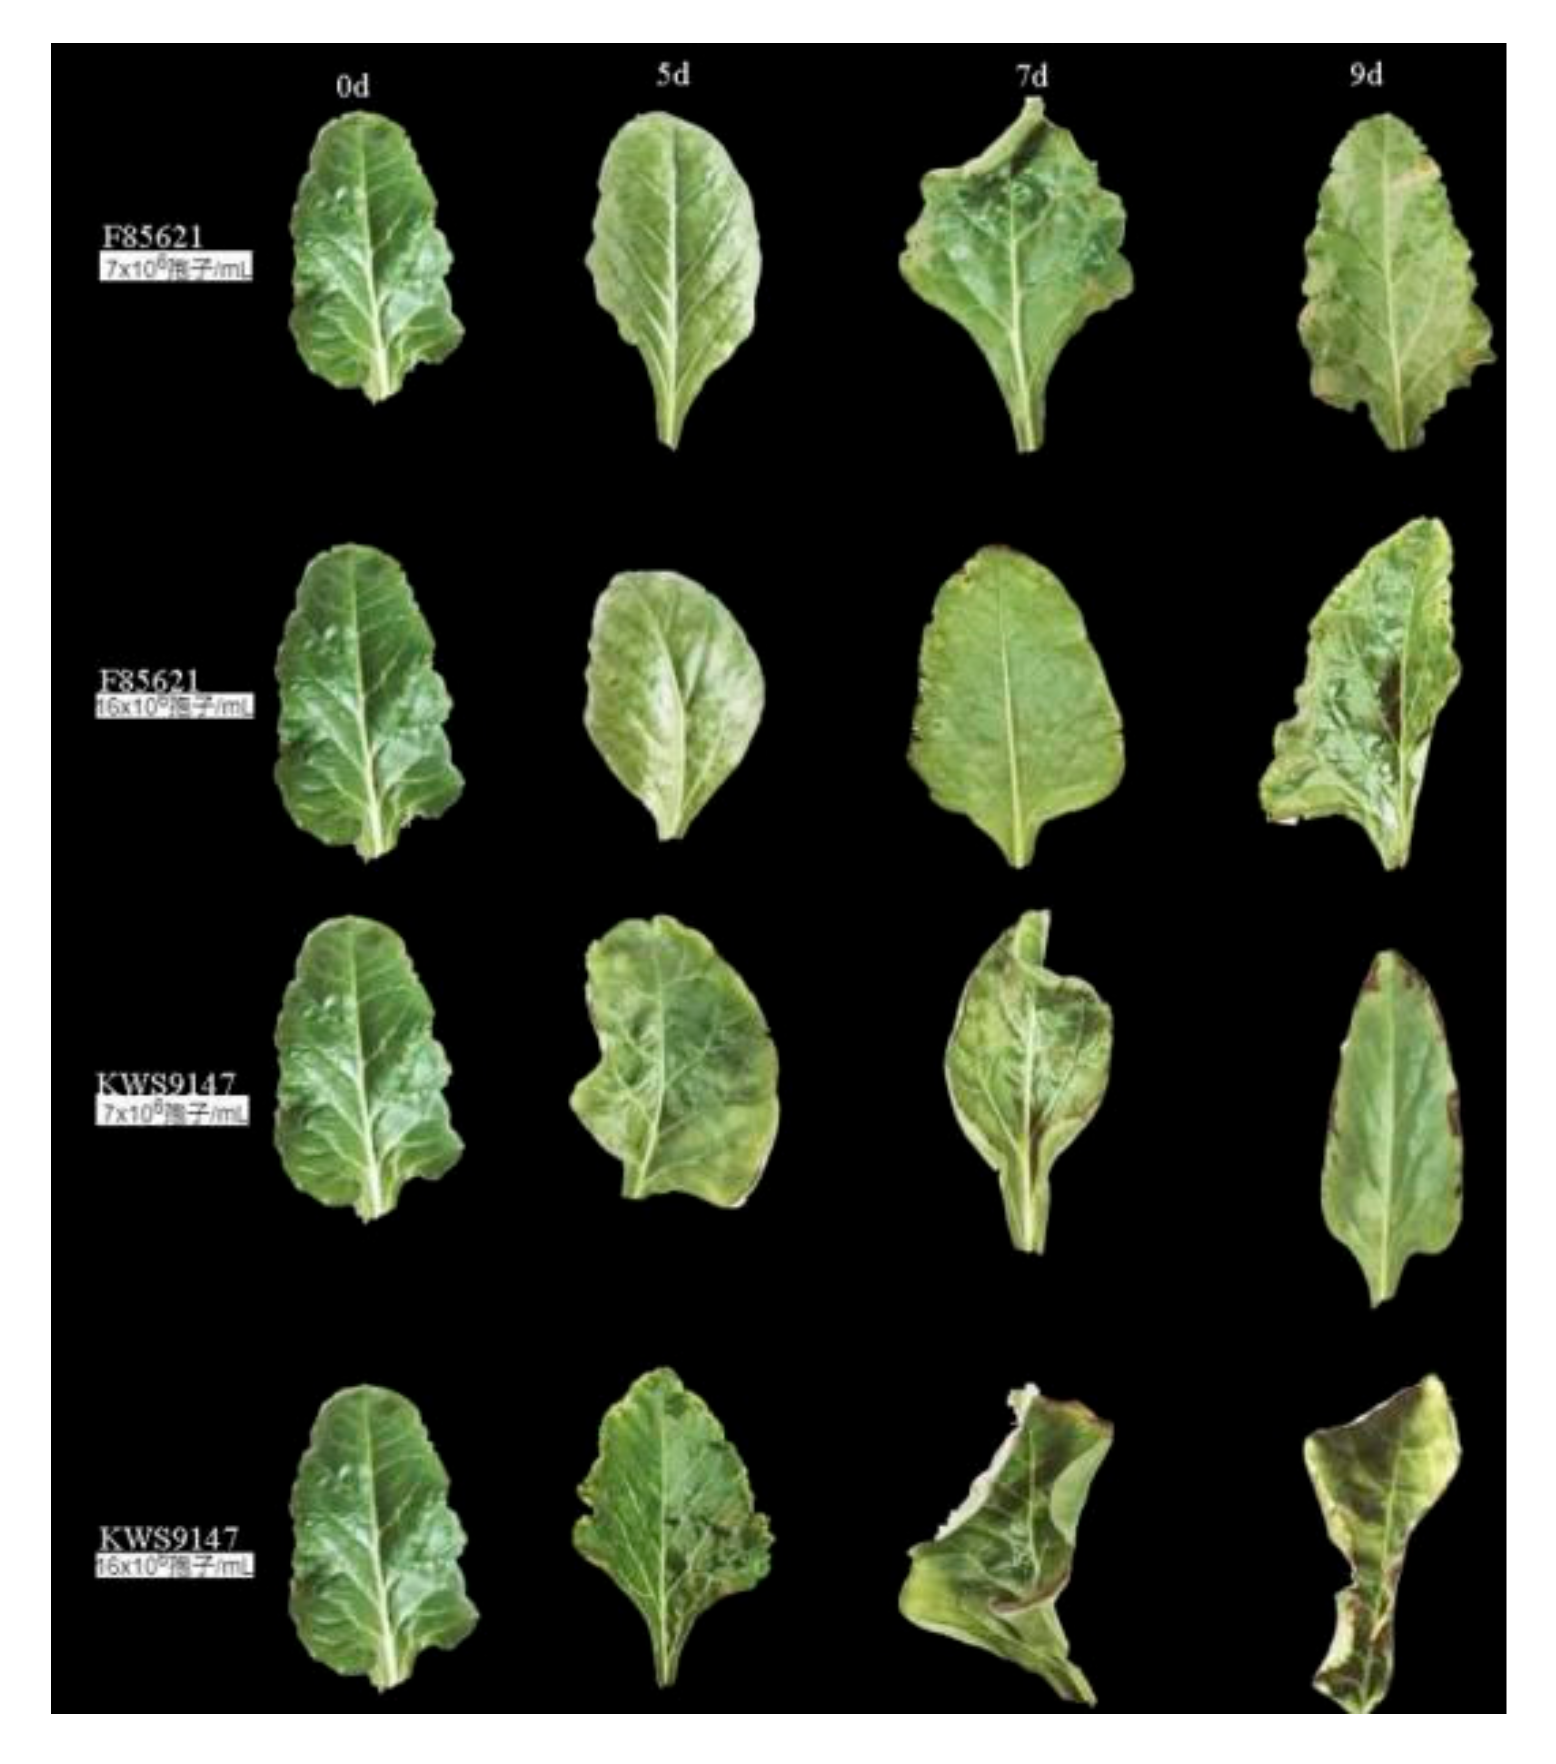
3.8. Phenotypic Analysis of Sugar Beet Resistant and Susceptible Materials at Different Time under Different Spore Concentrations of C. beticola

The resistant material was ‘F84621’, the sugar beet susceptible material was ‘KWS9147’. The leaves of resistant and susceptible materials were sprayed with spore suspension with spore concentrations of 7 × 10⁶ and 16 × 106 spores/mL, the leaves were taken and photographed at 0, 5, 7, and 9 d to observe the phenotype. Phenotype: irregular brown spots first appeared on the leaves, and the disease spots gradually expanded from the outer leaves to the middle and inner leaves. The analysis showed that the disease degree of leaves treated with spore suspension with high concentrations was significantly higher than that treated with spore suspension with low concentrations, the disease severity of susceptible materials was higher than that of resistant materials, in addition, as treating time increases, the spread of CLS also hastened and the damage was also more serious (Figure 7).

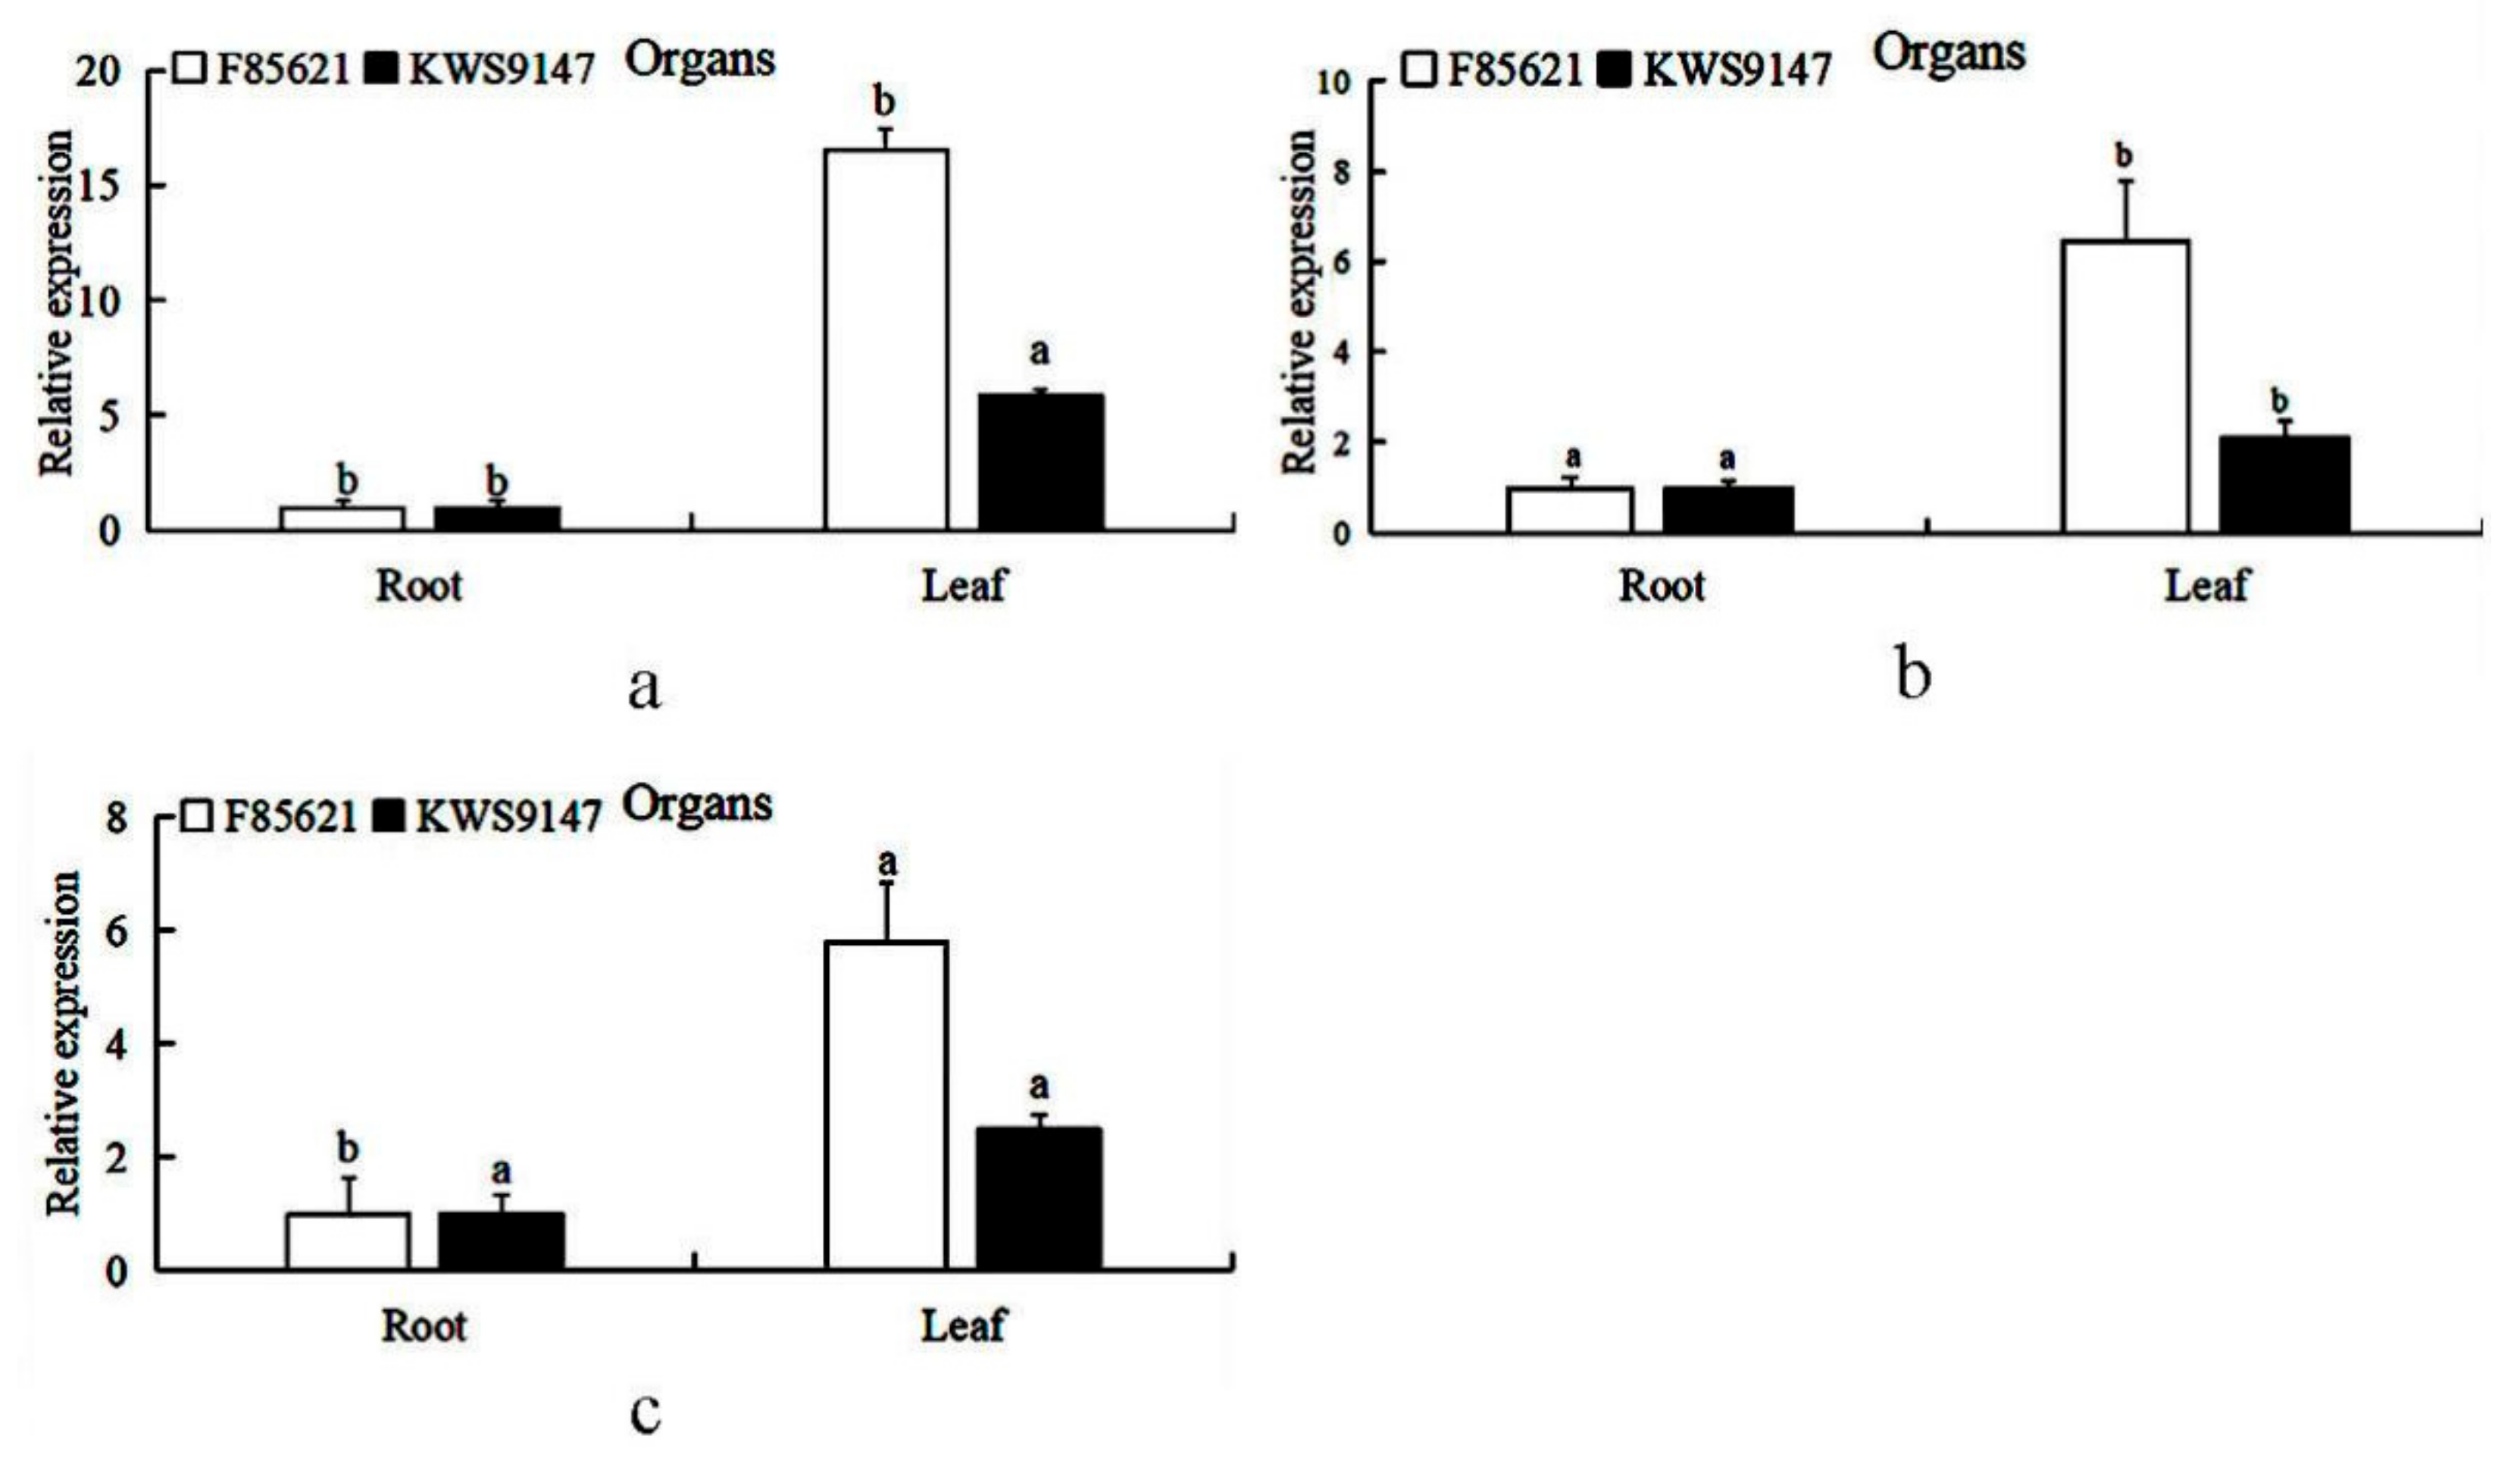
3.9. Tissue Expression Patterns of BvBTB1, BvBTB2, and BvBTB3 in Sugar Beet Resistant Material ‘F85621’ and Susceptible Material ‘KWS9147’

The relative expression of BvBTB1, BvBTB2, and BvBTB3 in roots and leaves in sugar beet resistant and susceptible materials were analyzed, the relative expression of BvBTB1 in leaves in the resistant material ‘F85621’ was about 17 times that of roots, in the susceptible material ‘KWS9147’, the relative expression of BvBTB1 in leaves was about 6 times that of roots, the relative expression of BvBTB2 in leaves in the resistant and susceptible materials was about 6.5 times and 2.2 times that of roots, respectively; however, the relative expression of BvBTB3 in leaves in the resistant and susceptible materials was about 5.8 times and 2.5 times that of roots, respectively. In conclusion, the results showed that the expression of BvBTB1, BvBTB2, and BvBTB3 in leaves was significantly higher than that in roots, and the relative expression of BvBTB1, BvBTB2, and BvBTB3 had significant tissue-specificity (Figure 8).

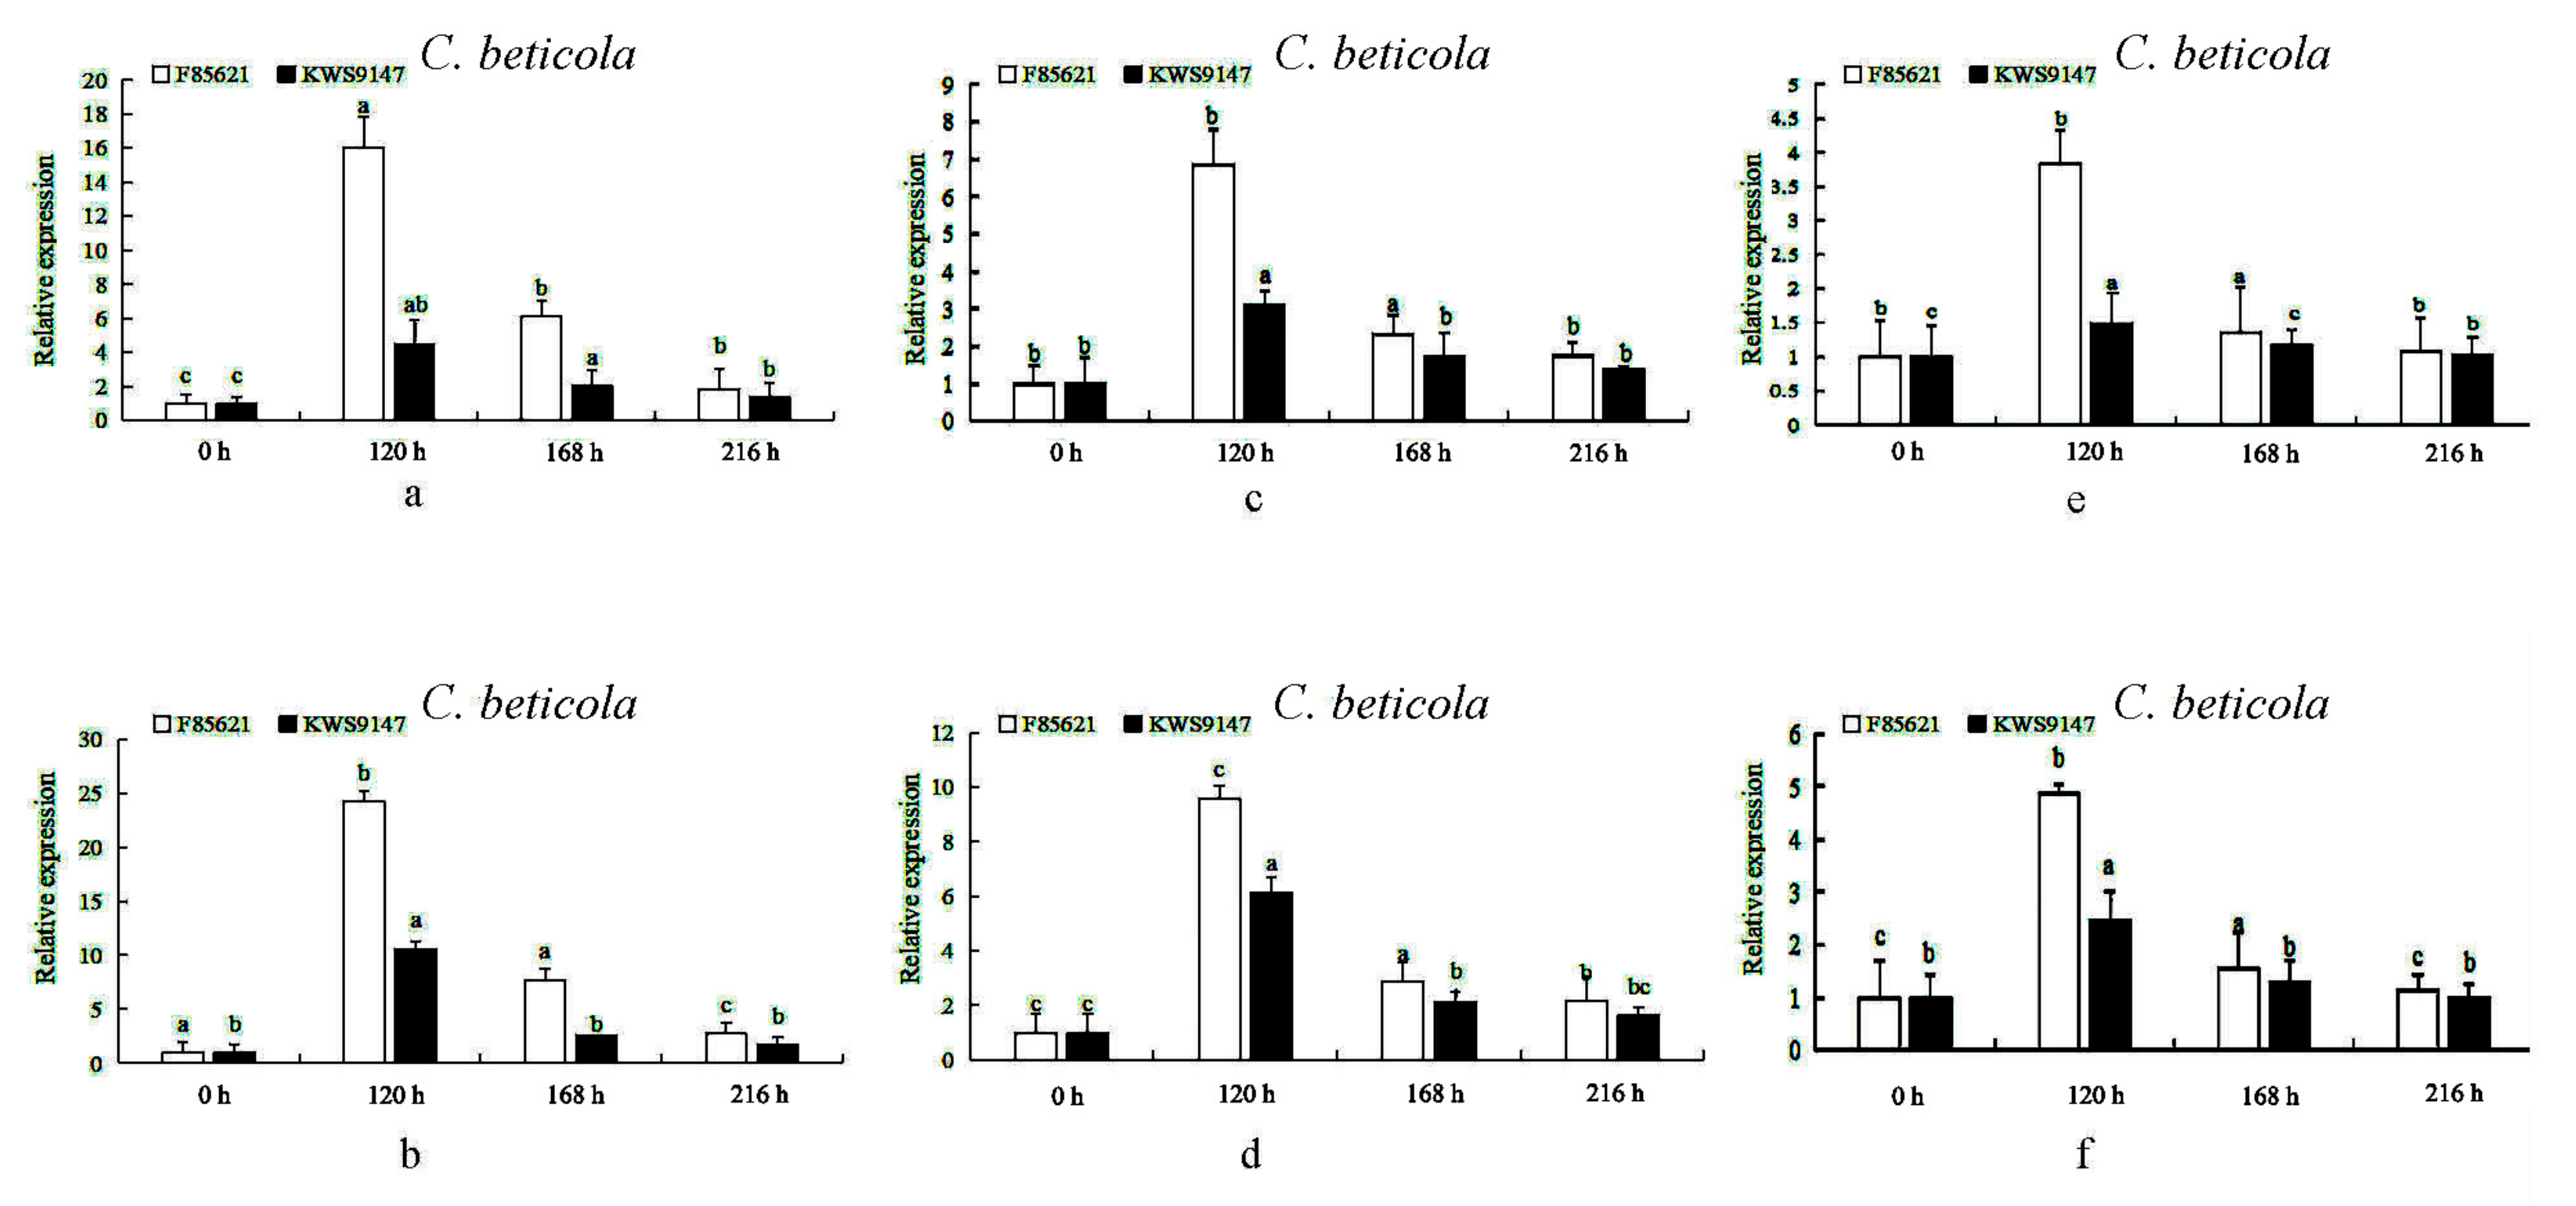
3.10. The Expression Levels of BvBTB1, BvBTB2, and BvBTB3 after High and Low Spore Concentrations of C. beticola Infection at Different Times in Leaves in Sugar Beet Resistant Material ‘F85621’ and Susceptible Material ‘KWS9147’

The sugar beet resistant material was ‘F84621’, while the sugar beet susceptible material was ‘KWS9147’. The leaves of the resistant and susceptible materials were sprayed with spore suspension with spore concentrations of 7 × 10⁶ and 16 × 106 spores/mL. Then, the leaves were taken at 0, 120, 168, and 216 h. The expression patterns of BvBTB1, BvBTB2, and BvBTB3 after high and low spore concentrations of C. beticola infection at different times in leaves in the resistant material ‘F85621’ and susceptible material ‘KWS9147’ in sugar beet were analyzed by qRT-PCR. Under the stress of high and low spore concentrations of C. beticola within 216 h, the relative expression trend of BvBTB1, BvBTB2, and BvBTB3 in leaves first increased rapidly, then quickly decreased, and finally remained the same as the initial amount of the control group. The three genes increased quickly at 120 h, which was significantly higher than the initial amount of the control group, reached the peak at 120 h, then decreased rapidly, finally stabilized, and finally decreased to the same level as the initial amount of the control group (Figure 9). Under the stress of high spore concentrations of C. beticola, the relative expression of BvBTB1, BvBTB2, and BvBTB3 in leaves in the resistant material reached the peak at 120 h, which was about 24, 10, and 5 times that of the control group. However, the relative expression in leaves in the susceptible material was about 10, 6, and 2 times that of the control group (Figure 9b,d,f). By comparison, the comprehensive analysis showed that the relative expression of BvBTB1 was higher than that of BvBTB2 and the expression of BvBTB2 was higher than that of BvBTB3. Moreover, the relative expression of three genes after high spore concentrations of C. beticola infection was significantly higher than that under the stress of low spore concentrations of C. beticola. Similarly, the relative expression of the three genes in the resistant material was significantly higher than that in the susceptible material (Figure 9).

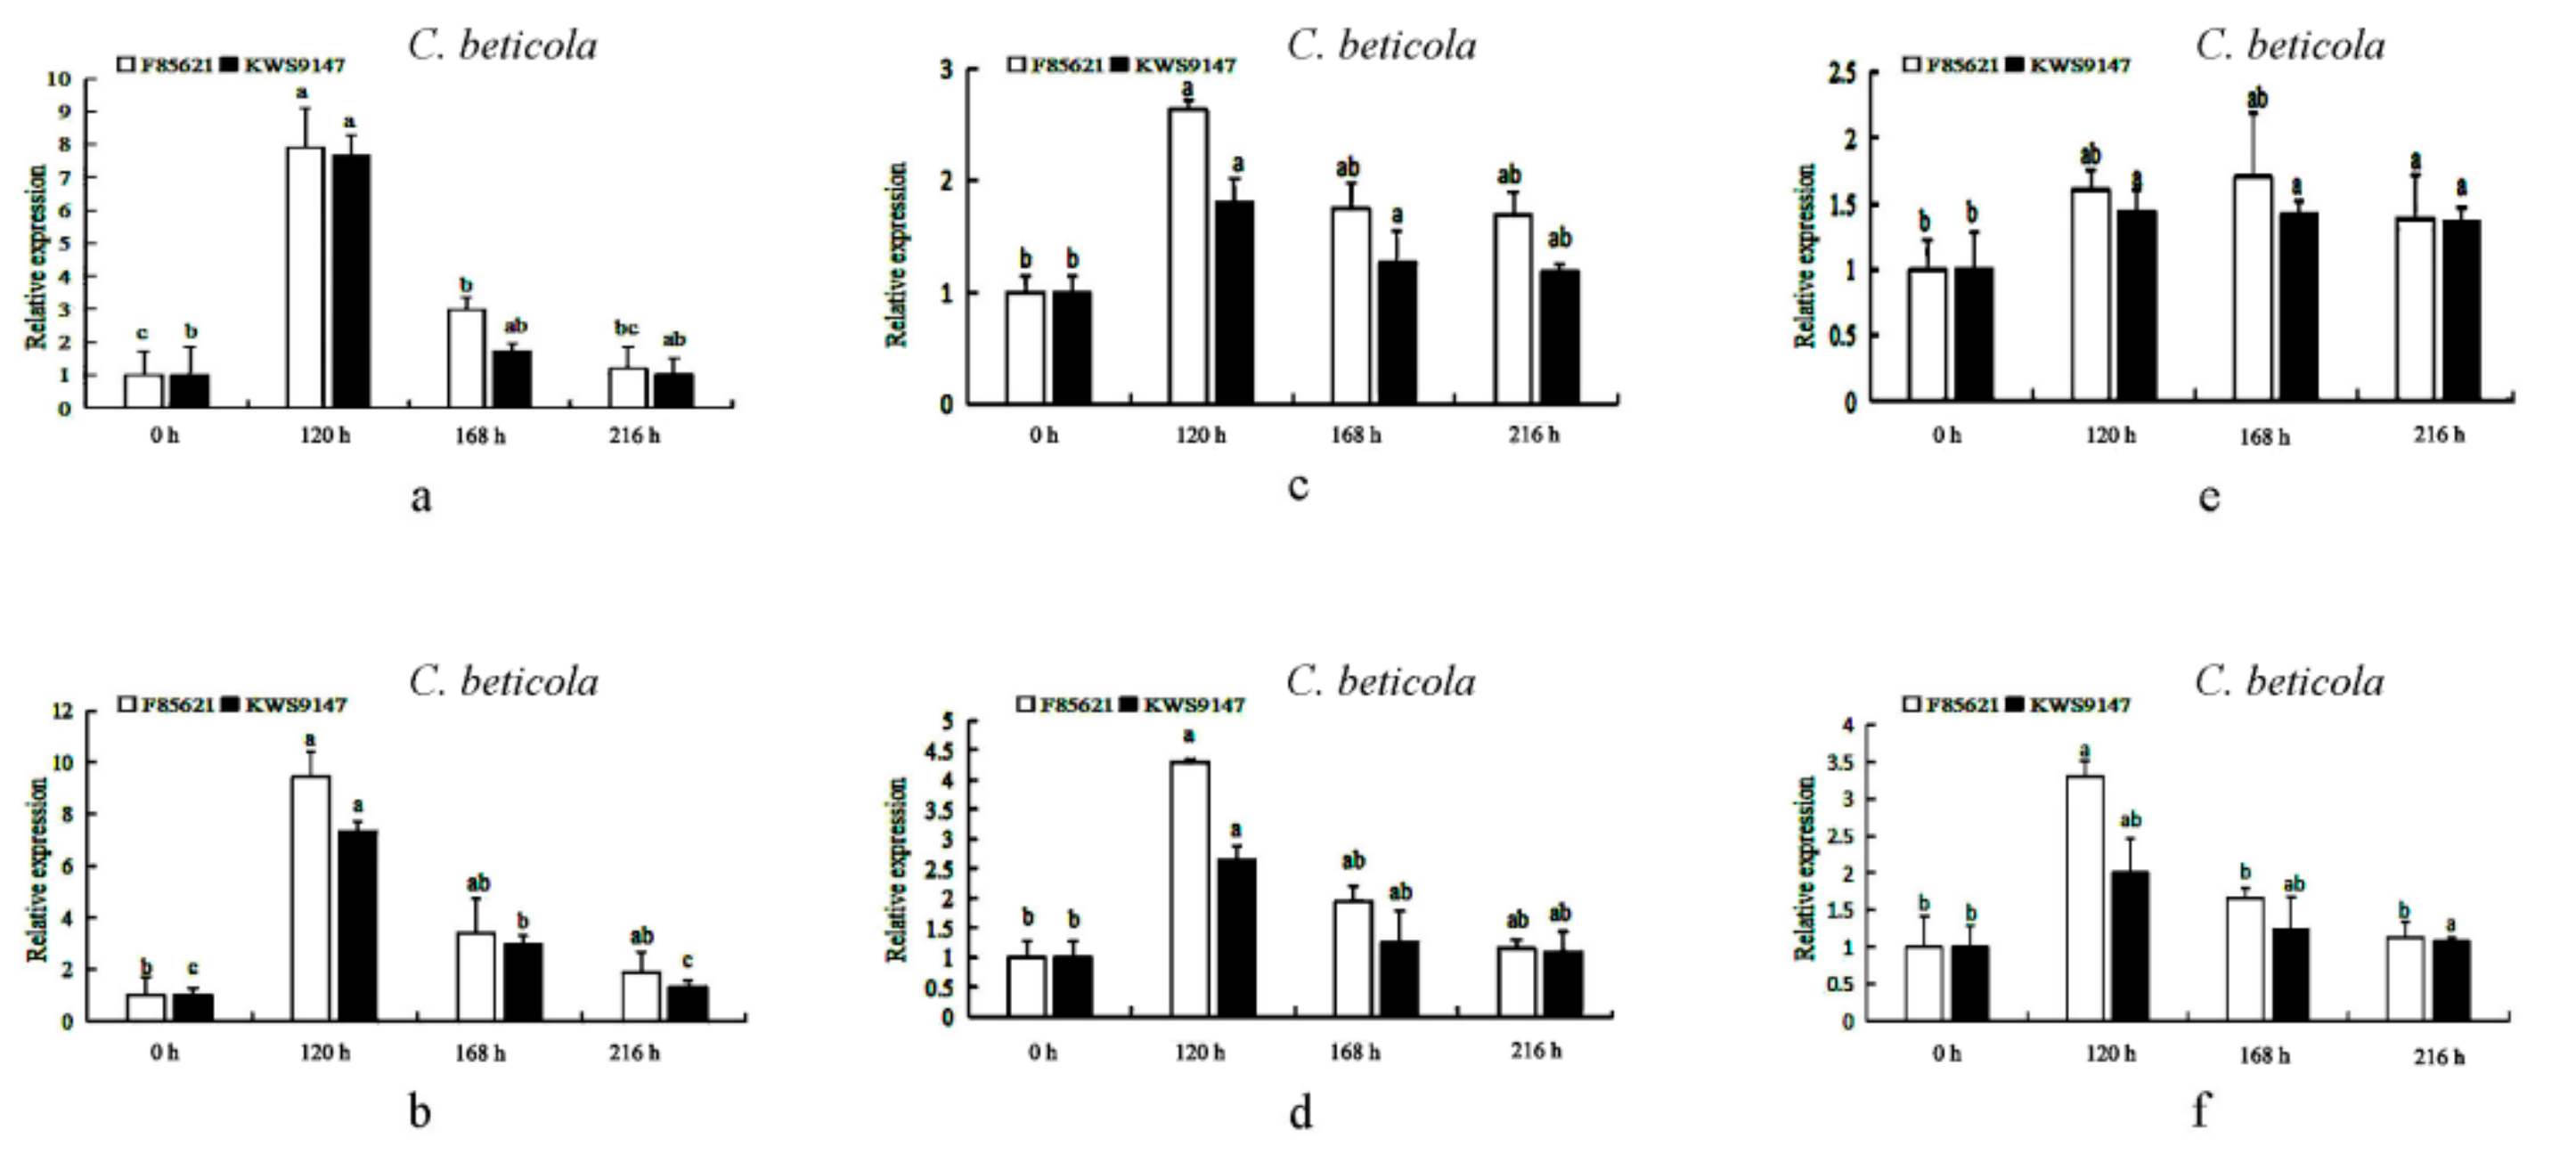
3.11. The Expression Levels of BvBTB1, BvBTB2, and BvBTB3 after High and Low Spore Concentration of C. beticola Infection at Different Times in Roots in Sugar Beet Resistant Material ‘F85621’and Susceptible Material ‘KWS9147’

The sugar beet resistant material was ‘F84621’, while the sugar beet susceptible material was ‘KWS9147’. The leaves of resistant and susceptible materials were sprayed with spore suspensions with spore concentrations of 7 × 10⁶ and 16 × 106 spores/mL. Then, the roots were taken at 0, 120, 168 and 216 h. The expression pattern of BvBTB1, BvBTB2, and BvBTB3 after high and low spore concentrations of C. beticola infection at different times in roots in the resistant material ‘F85621’ and susceptible material ‘KWS9147’ were analyzed by qRT-PCR. The sugar beet resistant material ‘F85621’ and susceptible material ‘KWS9147’ under the stress of high and low concentration of C. beticola within 216 h, the relative expression trend of BvBTB1, BvBTB2, and BvBTB3 in roots first increased rapidly, then quickly decreased rapidly, and finally remained the same as the initial amount of the control group. The three genes increased quickly at 120 h, which was significantly higher than the initial amount of the control group, reached the peak at 120 h, then decreased rapidly, and finally stabilized and decreased to the same level as the initial amount of the control group (Figure 10). Under the stress of high spore concentration of C. beticola, the expression of BvBTB1, BvBTB2, and BvBTB3 in the roots in the resistant material reached the peak at 120 h, which was about 9.5, 4.3 and 3.3 times that of the control group. However, the relative expression in the roots of the susceptible material was about 7, 3, and 1.9 times that of the control group (Figure 10b,d,f). By comparison, the comprehensive analysis showed that the relative expression of BvBTB1 was higher than that of BvBTB2 and the expression of BvBTB2 was higher than that of BvBTB3. Moreover, the expression of three genes after high spore concentration of C. beticola infection was significantly higher than that under the stress of low spore concentration of C. beticola. Similarly, the expression of the three genes in the resistant material was significantly higher than that in the susceptible material (Figure 10). The relative expression of BvBTB1, BvBTB2, and BvBTB3 after high and low spore concentrations of C. beticola infection at different times in leaves and roots in the sugar beet resistant material ‘F85621’ and susceptible material ‘KWS9147’ had similarities.

4. Discussion

In China, CLS is such a common leaf disease of sugar beet that in the main sugar beet producing areas, sugar beet yield was reduced or even lost, which seriously affected the stability of sugar beet yield. Here, cultivating varieties resistant to CLS is the main objective in sugar beet breeding [20,25]. Studies have shown that BTB genes are involved in the establishment of plant SAR and ISR, which are important for plants to produce resistance to broad-spectrum pathogens [17]. Based on the important role of BTB protein genes in plant, it was of great significance to analyze the structural composition of BvBTB genes and the expression induced by C. beticola.
Studies have shown that after being induced by exogenous signals, Arabidopsis NPRl protein interacted selectively with other proteins in the nucleus and activated genes related to SAR after being induced by exogenous signals [11], NPR1 is an important gene of BTB protein genes under plant stress. Here, BvBTB genes were obtained from sugar beet resistant material, and bioinformatics analysis was carried out. BvBTB proteins have high similarity with BTB proteins in other plants reported, BvBTB proteins may interact with other downstream proteins through conserved domains in the nucleus to induce various disease resistance reactions. Furthermore, BvBTB proteins contained other domains besides the BTB domains, which suggested that besides retaining the basic functions of BTB genes, BvBTB genes might also have a new mechanism for further studies. The results of the yeast two-hybrid experiment and pull-down experiment showed that TGA1 and TGA4 belonging to class I, TGA2, TGA5, and TGA6 belonging to class II, and TGA3 and TGA7 belonging to class III can interact with NPR1 [5], all BvBTB genes had TGA promoter elements, it was speculated that TGA elements interacted with BvBTB genes to improve plant disease resistance by combining TGA and PR promoter, which further explained the conservation of their interaction, moreover, most cis regulatory elements of BvBTB genes were screened. BvBTB genes contained the most important core TGA element related to bacterial defense, when the plant is infected by pathogens, it is speculated that the NPR1 monomer may enter the nucleus through acting nuclear localization domain, or NPR1 may interact directly with some TGA transcription factors, which effectively induces the downstream resistance gene PR expression and established systemic acquired resistance.
Overexpression of NPR1 in rice significantly improved its resistance to rice bacterial blight, after inoculation with Gibberella [14], the expression of wheat TaNPR1 was up-regulated in response to the induction of Gibberella, which showed NPRl genes played an important role in plant resistance to many diseases. After rice black-streaked dwarf virus infected maize, the expression of ZmNPR1 was rapidly up-regulated, and the constitutive expression of ZmNPR1 was also detected in different parts in the later stage [26]. After Phytophthora sojae infection, the expression of GmBTB in the resistant and susceptible varieties first increased significantly to the peak, and then decreased sharply, and the expression levels of GmBTB in the tissues of soybean resistant varieties were much higher than that in the tissues of soybean susceptible varieties [5], which was similar to the expression trend of BvBTB genes after C. beticola infection, the relative expression of BvBTB1 was higher than that of BvBTB2, and the relative expression of BvBTB2 was higher than that of BvBTB3, the relative expression of three genes after high spore concentrations of C. beticola infection was significantly higher than that under the stress of low spore concentrations of C. beticola, and the relative expression of three genes in the resistant material was significantly higher than that in the susceptible material. The relative expression of BvBTB1, BvBTB2, and BvBTB3 after high and low spore concentrations of C. beticola infection at different times in leaves and roots in sugar beet resistant material ‘F85621’ and susceptible material ‘KWS9147’ had similarities, it was speculated that BvBTB genes played a key role in the resistance to CLS and the growth and development in sugar beet. The relative expression of BvBTB genes reached the peak at 120 h, which was much greater than the initial amount of the control group, there was a significant difference between roots and leaves, it was speculated that the immune stress response caused by C. Beticola as a pathogen appeared in the early stage of sugar beet infection. The expression of BvBTB genes at high spore concentrations of C. beticola was significantly higher than that at low spore concentrations of C. beticola, it was speculated that the change in the relative expression of BvBTB genes was related to the number and growth distribution of C. beticola. QTL mapping showed that CLS was regulated by multiple quantitative trait genes, and the pathogenesis was complex [5]. At present, no target resistance gene has been cloned in sugar beet. In this study, the amplified bands of BvBTB genes were obtained, and the expression pattern induced by C. beticola was obtained, which laid a foundation for further study on the disease resistance mechanism of CLS.

5. Conclusions

In this study, the BTB Domain-containing protein gene family in sugar beet was identified, and bioinformatics was used to analyze the BTB protein family. Through molecular techniques, C. beticola of CLS was identified. In addition, transcriptome data of sugar beet resistant and susceptible materials after C. beticola infection was obtained, by contrast, the expression levels of BvBTB1, BvBTB2, and BvBTB3 in roots and leaves in the resistant and susceptible materials after high and low spore concentrations of C. beticola infection were analyzed by qRT-PCR, which provided a theoretical basis for the in-depth study on BTB genes in sugar beet, and laid a foundation for developing new resistant varieties and transgenic resistant varieties of sugar beet.

Author Contributions

Conceptualization, Q.Y.; methodology, Q.Y. and Y.L. (Yu Liu); software, Q.Y. and Y.L. (Yu Liu); validation, C.Z., X.W. and Y.L. (Yanli Li); formal analysis, X.W. and Y.L. (Yanli Li); investigation, C.Z.; writing-original draft preparation, Q.Y.; writing-review and editing, Q.Y. and G.D.; supervision, G.D. and L.C.; funding acquisition, G.D. and L.C. All authors have read and agreed to the published version of the manuscript.

Funding

China Agriculture Research System of MOF and MARA, Grant Number: CARS-170102.

Institutional Review Board Statement

Not applicable.

Informed Consent Statement

Not applicable.

Data Availability Statement

Exclude this statement.

Acknowledgments

We thank National Modern Agricultural Industrial Technology System (Sugar) (CARS-170102) and Heilongjiang Economic Crop Industrial Technology Collaborative Innovation System Project “Sugar Beet Breeding Post” (2018711) for financial support of this research.

Conflicts of Interest

The authors declare that none of the authors has competing interests.

References

  1. Zhang, S.Z.; Yan, X.F.; Zhang, C.Z.; Han, D.; Xu, P.F. Progress in the studies of plant BTB/POZ protein and the disease resistance. Soybean Sci. 2019, 38, 311–316. [Google Scholar]
  2. Buscaill, P.; Rivas, S. Transcriptional control of plant defence responses. Curr. Opin. Plant Biol. 2014, 20, 35–46. [Google Scholar] [CrossRef]
  3. Dangl, J.L.; Horvath, D.M.; Staskawicz, B.J. Pivoting the plant immune system from dissection to deployment. Science 2013, 341, 746–751. [Google Scholar] [CrossRef] [PubMed] [Green Version]
  4. Soosaar, J.L.; Burch-Smith, T.M.; Dinesh-Kumar, S.P. Mechanisms of plant resistance to viruses. Nat. Rev. Microbiol. 2005, 3, 789–798. [Google Scholar] [CrossRef] [PubMed]
  5. Zhang, C.; Hong, G.; Li, R.P.; Han, D.; Wang, L.; Xu, P.F.; Zhang, S.Z. GmBvBTB, a novel BTB domain-containing nuclear protein, positively regulates the response of soybean to Phytophthora sojae infection. Mol. Plant Pathol. 2019, 20, 78–91. [Google Scholar] [CrossRef] [PubMed] [Green Version]
  6. Hui, C.; Glazebrook, J.; Clarke, J.D.; Volko, S.; Dong, X. The Arabidopsis NPR1 gene that controls systemic acquired resistance encodes a novel protein containing ankyrin repeats. Plant Cell 1997, 88, 57–63. [Google Scholar]
  7. Huang, J.; Gu, M.; Lai, Z.; Fan, B.; Shi, K.; Zhou, Y.H.; Yu, J.Q.; Chen, Z. Functional analysis of the Arabidopsis PAL gene family in plant growth, development, and response to environmental stress. Plant Phys. 2010, 153, 1526–1538. [Google Scholar] [CrossRef] [PubMed] [Green Version]
  8. Fedele, M.; Crescenzi, E.; Cerchia, L. The POZ/BTB and AT-Hook Containing zinc finger 1 (PATZ1) transcription regulator: Physiological functions and disease involvement. Int. J. Mol. Sci. 2017, 18, 2524. [Google Scholar] [CrossRef] [Green Version]
  9. Cao, H.; Li, X.; Dong, X. Generation of broad-spectrum disease resistance by overexpression of an essential regulatory gene in systemic acquired resistance. Proc. Natl. Acad. Sci. USA 1998, 95, 6531–6536. [Google Scholar] [CrossRef] [Green Version]
  10. Tsuda, K.; Somssich, I.E. Transcriptional networks in plant immunity. New Phytol. 2014, 206, 932–947. [Google Scholar] [CrossRef] [PubMed]
  11. Duan, C.J.; Luo, D.P.; Luo, X.M.; Feng, J.X. Overexpression of arabidopsis thaliana AtNPR1 gene in rice enhances the rice resistance to bacterial blight and blast diseases. Guihaia 2012, 32, 800–805. [Google Scholar]
  12. Vidhyasekaran, P. Plant Hormone Signaling Systems in Plant Innate Immunity; Springer: Berlin/Heidelberg, Germany, 2015; Volume 2, pp. 117–122. [Google Scholar]
  13. Makandar, R.; Essig, J.S.; Schapaugh, M.A.; Trick, H.N.; Shah, J. Genetically engineered resistance to fusarium head blight in wheat by expression of Arabidopsis NPR1. Mol. Plant-Microbe Interact. 2006, 19, 123. [Google Scholar] [CrossRef] [PubMed] [Green Version]
  14. Zhang, S.; Xu, P.; Wu, J.; Xue, A.G.; Zhang, J.; Li, W.; Chen, C.; Chen, W.; Lv, H. Races of Phytophthora sojae and their virulences on soybean cultivars in Heilongjiang, China. Plant Dis. 2010, 94, 87–91. [Google Scholar] [CrossRef] [PubMed] [Green Version]
  15. Endah, R.; Beyene, G.; Kiggundu, A.; Berg, N.; Schluter, U.; Kunert, K.; Chikwamba, R. Elicitor and Fusariuminduced expression of NPR1-like genes in banana. Plant Physiol. Biochem. 2008, 46, 1007–1014. [Google Scholar] [CrossRef]
  16. Rasmussen, M.W.; Roux, M.; Petersen, M.; Mundy, J. MAP kinase cascades in Arabidopsis innate immunity. Front. Plant Sci. 2012, 3, 169. [Google Scholar] [CrossRef] [PubMed] [Green Version]
  17. Che, D.D.; Fan, J.P.; Wang, J.G.; Xu, P.; Yang, T.; Liu, S.K. Cloning and analysis of full-length cDNA of PumNPR1 gene from Pyrus ussuriensis Maxim. J. Northeast Agric. Univ. 2008, 15, 12–17. [Google Scholar]
  18. Zhang, S.B.; Liu, J.B.; Wang, Y.S. Study on the resistance of arbuscular mycorrhizal fungi to Phytophthora capsici of pepper. North. Hortic. 2015, 30, 125–128. [Google Scholar]
  19. He, Y.M.; Liu, K.K.; Zhang, H.X.; Cheng, G.X.; Gong, Z.H. Contribution of cabpm4, a BTB domain–containing gene, to the response of pepper to Phytophthora capsici infection and abiotic stresses. Agronomy 2019, 9, 417. [Google Scholar] [CrossRef] [Green Version]
  20. Weiland, J.; Koch, G. Sugar beet leaf spot disease (C. beticola beticola sacc.)†. Mol. Plant Pathol. 2010, 5, 157–166. [Google Scholar] [CrossRef]
  21. Skaracis, G.N.; Pavli, O.I.; Biancardi, E. C. beticola leaf spot disease of sugar beet. Sugar Tech. 2010, 12, 220–228. [Google Scholar] [CrossRef]
  22. Vaghefi, N.; Kikkert, J.R.; Hay, F.S.; Carver, G.D.; Koenick, L.B.; Bolton, M.D. Cryptic diversity, pathogenicity, and evolutionary species boundaries in C. beticola populations associated with C. beticola leaf spot of Beta vulgaris. Fungal Biol. 2018, 122, 264–282. [Google Scholar] [CrossRef] [PubMed]
  23. Yang, L.; Yang, S.Y.; Ma, W.J.; Zhou, J.H.; Ma, W.J. Isolation and identification of the pathogen of walnut brown spot and investigation of its pathogenesis. For. Sci. Res. 2017, 30, 1004–1008. [Google Scholar]
  24. Berbee, M.L.; Pirseyedi, M.; Hubbard, S. Cochliobolus phylogenetics and the origin of know, highly virulent pathogens, inferred from ITS and glyceraldehyde-3-phosphate dehydrogenase gene sequences. Mycologia 1999, 91, 964–977. [Google Scholar] [CrossRef]
  25. Wolf, P.; Verreet, J.A. Factors affecting the onset of C. beticola leaf spot epidemics in sugar beet and establishment of disease-monitoring thresholds. Phytopathology 2005, 95, 269. [Google Scholar] [CrossRef] [PubMed] [Green Version]
  26. Wang, X.T.; Yang, Q.; Hao, J.J.; Wang, Y.; Zhang, Y.Y.; Li, B.Q. Cloning and expression analysis of Maize ZmNPR1 gene. Acta Bot. Boreali-Occident. Sin. 2018, 38, 1817–1822. [Google Scholar]
Figure 1. Colony and mycelium morphology of C. beticola. (a) The front morphology of the colony of C. beticola. (b) The back morphology of the colony of C. beticola. (c) Mycelial morphology of C. beticola under 40× microscope. (d) Mycelial morphology of C. beticola under 100× microscope.
Agronomy 12 00253 g001
Figure 2. Agarose gel electrophoresis of PCR expansion of ITS sequence of C. beticola. M: DNA Marker I, the ladder was fabricated by Beijng Zoman Biotechnology Co., Ltd., Beijing, China; 1: ITS sequences of C. beticola, 700 bp.
Agronomy 12 00253 g002
Figure 3. Expression of BvBTB genes in different transcriptomes in the materials. The transcriptomic data from sugar beet resistant material ‘F85621’and susceptible material ‘KWS9147’ in response to C. beticola infection for 12 h. X-axial represents the gene names in the sugar beet transcriptomic data, while Y-axial represents BvBTB gene expression in the sugar beet transcriptomic data. The experiment was performed on three biological replicates, each with three technical replicates, and was statistically analyzed using variance analysis (p < 0.05), different letters represent significant levels of p < 0.05.
Agronomy 12 00253 g003
Figure 4. Agarose gel electrophoresis of PCR amplification of BvBTB1, BvBTB2, and BvBTB3. M: D2000 DNA marker, the ladder was fabricated by Tiangen Biochemical Technology (Beijing) Co., Ltd. (Beijing, China); (a) BvBTB1, (b) BvBTB2, (c) BvBTB3; 1: Target gene.
Agronomy 12 00253 g004
Figure 5. Conserved domains of BvBTB1, BvBTB2, and BvBTB3 protein. (a) Conserved domain of BvBTB1 protein. (b) Conserved domain of BvBTB2 protein. (c) Conserved domain of BvBTB3 protein.
Agronomy 12 00253 g005
Figure 6. Analysis of promoter elements of BvBTB, BvBTB2, and BvBTB3.
Agronomy 12 00253 g006
Figure 7. Phenotypic analysis of sugar beet resistant and susceptible material at different times under different spore concentrations of C. beticola.
Agronomy 12 00253 g007
Figure 8. Tissue expression pattern of BvBTB, BvBTB2, and BvBTB3 in sugar beet resistant material ‘F85621’ and susceptible material ‘KWS9147’. (a) Tissue expression pattern of BvBTB1 in sugar beet resistant material ‘F85621’ and susceptible material ‘KWS9147’. (b) Tissue expression pattern of BvBTB2 in sugar beet resistant material ‘F85621’ and susceptible material ‘KWS9147’. (c) Tissue expression pattern of BvBTB3 in sugar beet resistant material ‘F85621’ and susceptible material ‘KWS9147’. The housekeeping gene of beet Gapdh was used as an internal control to normalize the data. The experiment was performed on three biological replicates, each with three technical replicates, and was statistically analyzed using variance analysis (p < 0.05), different letters represent significant levels of p < 0.05.
Agronomy 12 00253 g008
Figure 9. The relative expression of BvBTB1, BvBTB2, and BvBTB3 after high and low spore concentrations of C. beticola infection at different times in leaves in the resistant material ‘F85621’ and susceptible material ‘KWS9147’. X-axial represents the times of C. beticola infection in sugar beet, while Y-axial represents the relative expression of BvBTB in sugar beet materials ‘F85621’ and ‘KWS9147’ on C. beticola infection. (a) The relative expression of BvBTB1 in leaves at 0, 120, 168, 216 h in sugar beet resistant material ‘F85621’ and susceptible material ‘KWS9147’ after low spore concentrations of C. beticola with 7 × 10⁶ spores/mL infection. (b) The relative expression of BvBTB1 in leaves at 0, 120, 168, 216 h in sugar beet resistant material ‘F85621’ and susceptible material ‘KWS9147’ after high spore concentrations of C. beticola with 16 × 106 spores/mL infection. (c) The relative expression of BvBTB2 in leaves at 0, 120, 168, 216 h in sugar beet resistant material ‘F85621’ and susceptible material ‘KWS9147’ after low spore concentrations of C. beticola with 7 × 10⁶ spores/mL infection. (d) The relative expression of BvBTB2 in leaves at 0, 120, 168, 216 h in sugar beet resistant material ‘F85621’ and susceptible material ‘KWS9147’ after high spore concentrations of C. beticola with 16 × 106 spores/mL infection. (e) The relative expression of BvBTB3 in leaves at 0, 120, 168, 216 h in sugar beet resistant material ‘F85621’ and susceptible material ‘KWS9147’ after low spores concentration of C. beticola with 7 × 10⁶ spores/mL infection. (f) The relative expression of BvBTB3 in leaves at 0, 120, 168, 216 h of sugar beet resistant material ‘F85621’ and susceptible material ‘KWS9147’ after high spore concentrations of C. beticola with 16 × 106 spores /mL infection. The housekeeping gene of beet Gapdh was used as an internal control to normalize the data. The experiment was performed on three biological replicates, each with three technical replicates, and was statistically analyzed using variance analysis (p < 0.05), different letters represent significant levels of p < 0.05.
Agronomy 12 00253 g009
Figure 10. The relative expression of BvBTB1, BvBTB2, and BvBTB3 after high and low spore concentrations of C. beticola infection at different times in roots in the resistant material ‘F85621’ and susceptible material ‘KWS9147’. X-axial represents the times of C. beticola infection in sugar beet, while Y-axial represents the relative expression of BvBTB in sugar beet materials ‘F85621’ and ’KWS9147’ on C. beticola infection. (a) The relative expression of BvBTB1 in roots at 0, 120, 168, 216 h in sugar beet resistant material ‘F85621’ and susceptible material ‘KWS9147’ after low spore concentrations of C. beticola with 7 × 10⁶ spores/mL infection. (b) The relative expression of BvBTB1 in roots at 0, 120, 168, 216 h in sugar beet resistant material ‘F85621’ and susceptible material ‘KWS9147’ after high spore concentrations of C. beticola with 16 × 106 spores/mL infection. (c) The relative expression of BvBTB2 in roots at 0, 120, 168, 216 h in sugar beet resistant material ‘F85621’ and susceptible material ‘KWS9147’ after low spore concentrations of C. beticola with 7 × 10⁶ spores/mL infection. (d) The relative expression of BvBTB2 in roots at 0, 120, 168, 216 h in sugar beet resistant material ‘F85621’ and susceptible material ‘KWS9147’ after high spore concentrations of C. beticola with 16 × 106 spores/mL infection. (e) The relative expression of BvBTB3 in roots at 0, 120, 168, 216 h in sugar beet resistant material ‘F85621’ and susceptible material ‘KWS9147’ after low spore concentrations of C. beticola with 7 × 10⁶ spores/mL infection. (f) The relative expression of BvBTB3 in roots at 0, 120, 168, 216 h in sugar beet resistant material ‘F85621’ and susceptible material ‘KWS9147’ after high spore concentrations of C. beticola with 16 × 106 spores/mL infection. The housekeeping gene of beet Gapdh was used as an internal control to normalize the data. The experiment was performed on three biological replicates, each with three technical replicates, and was statistically analyzed using the variance analysis (p < 0.05), different letters represent significant levels of p < 0.05.
Agronomy 12 00253 g010
Table 1. Primers for cloning and expression of BvBTB1, BvBTB2, and BvBTB3 and ITS primers.
PrimerPrimer Sequences (5′–3′)Tm
BvBTB1 Amplification primerR: TTAAGAAATGGAGAACCTTCTTCTCCTTGG
F: ATGATGAGTGCAACAGCGTTGAACCCT
62 °C
BvBTB2 Amplification primerR: CTAATTTAGAGCATTAGGCTTGGTAAGTAACCT
F: ATGGGGTCCAAGGAGTGGC
58 °C
BvBTB3 Amplification primeR: GTTACCAAAGATGATCGAGTAGC
F: TCTCCCAATGTTACACCACAAC
54 °C
BvBTB1 Fluorescent primerR: TCGTTGGCTCCACTCCTTAGCTTTA
F: GAGTACATGCCTCACAGAACAAGCG
60 °C
BvBTB 2 Fluorescent primerR: AGTGGACTTGAGAAGCCCAAGAAGT
F: AGTTGCTTTGGCTCTTGCTCATCTG
60 °C
BvBTB3 Fluorescent primerR: TCCATCGATCGGAGAACAAAGCAGA
F: ACTCCGATTCTCTCTCCTCCATTGC
60 °C
Gapdh Fluorescent primerR: GTTGGAACACGGAA AGCC
F: TGGAGAGGTGGAAGG
60 °C
ITS1 Amplification primerTCCTCCGCTTATTGATATGC60 °C
ITS4 Amplification primerTCCGTAGGTGAACCTGCGG60 °C
Table 2. Physical and chemical properties of the BTB protein family in sugar beet.
Gene
Subfamily
Gene
Accession
Number
Protein
Accession
Number
Amino
Acid
Number
Isoelectric
Point
Average
Hydrophobicity
Number of
Phosphorylation
Sites
Subcellular Localization
NPH3KMS95472.1BVRB—00793011205.91−0.05419Nucleus
KMT02116.1BVRB—9 g 2076005396.68−0.12821Nucleus
KMT16927.1BVRB—2 g 0439706157.50−0.35117Nucleus
KMT09829.1BVRB—6 g 1280506257.54−0.34221Nucleus
KMT03832.1BVRB—8 g 1897506216.73−0.25625Cytoplasm
KMT08787.1BVRB—6 g 13511010765.99−0.72224Nucleus
KMT13794.1BVRB—4 g 0816705599.10−0.25813Cytomembrane Nucleus
KMT00896.1BVRB—9 g 2216806956.88−0.46322Cytomembrane
KMT11299.1BVRB—5 g 1098205818.18−0.17212Cytomembrane Nucleus
KMT09814.1BVRB—6 g 1279006345.96−0.18515Cytomembrane
104899057BVRB—7 g 1644506369.07−0.29215Cytomembrane
KMT05614.1BVRB—7 g 1675506106.63−0.32723Cytomembrane Nucleus
KMT06491.1BVRB—7 g 1566706176.00−0.23014Cytomembrane
KMT03943.1BVRB—8 g 1875206335.74−0.18613Cytomembrane
KMT17316.1BVRB—2 g 0401006885.64−0.35013Cytomembrane Nucleus
KMT09842.1BVRB—6 g 1281704885.59−0.30111Cytomembrane Nucleus
BACKKMT11993.1BVRB—5 g 0995505535.45−0.2659Cytomembrane
KMT20372.1BVRB—1 g 0037105565.04−0.36910Cytomembrane Chloroplast
104898402BVRB—7 g 1599509795.830.10814Nucleus
104905652BVRB—1 g 0211208055.95−0.23913Cytomembrane
ArmKMS95782.1BVRB—00509010126.880.06815Cytomembrane Nucleus
KMT06143.1BVRB—7 g 1631307096.14−0.11913Nucleus
104883420BVRB—0008906986.13−0.08413Nucleus
AnkKMS99096.1BVRB—3 g 0669405795.03−0.26011Nucleus
KMS96007.1BVRB—0030008525.88−0.45315Nucleus
KMT15126.1BVRB—3 g 0624404986.25−0.27312Nucleus
KMS96842.1BVRB—8 g 1991806045.92−0.27113Nucleus
MATHKMT05007.1BVRB—7 g 1716703985.72−0.1618Nucleus
KMS97744.1BVRB—5 g 1241604077.16−0.1445Nucleus
KMS97745.1BVRB—5 g 1241704055.98−0.18310Nucleus
KMT18392.1BVRB—2 g 0254404205.98−0.1339Nucleus
TAZKMS97248.1BVRB—7 g 1769603459.51−0.3235Nucleus
KMT09833.1BVRB—6 g 1280903889.28−0.3218Cytomembrane Nucleus
KMT15541.1BVRB—3 g 0589301399.18−0.3403Nucleus
BTB-onlyKMT11639.1BVRB—5 g 1095303465.69−0.3308Cytomembrane
KMT12649.1BVRB—4 g 0910803295.87−0.1418Cytomembrane
KMT19646.1BVRB—1 g 0103302535.03−0.3138Cytomembrane Nucleus
KMT18872.1BVRB—2 g 0297502795.43−0.2385Cytomembrane Nucleus
TPRKMT10233.1BVRB—5 g 1199308865.72−0.20422Nucleus
OtherKMS99416.1BVRB—2 g 0453804845.35−0.2819Chloroplast
KMT12084.1BVRB—5 g 1003904625.38−0.15217Chloroplast
KMT14083.1BVRB—4 g 0790805586.56−0.42918Chloroplast
KMT08528.1BVRB—6 g 1381105327.89−0.43416Chloroplast Nucleus
KMT12064.1BVRB—5 g 1002105856.59−0.39420Nucleus
KMT05357.1BVRB—7 g 1748905085.42−0.35916Nucleus
KMS93550.1BVRB—0303501815.03−0.1604Cytomembrane Nucleus
KMT12599.1BVRB—5 g 0983804334.70−0.00813Nucleus
KMT12434.1BVRB—5 g 1036504364.93−0.09712Nucleus
KMT00450.1BVRB—9 g 2175104816.48−0.16524Nucleus
Publisher’s Note: MDPI stays neutral with regard to jurisdictional claims in published maps and institutional affiliations.

