
Accumulation Patterns of Six Pyrethrin Compounds across the Flower Developmental Stages—Comparative Analysis in Six Natural Dalmatian Pyrethrum Populations

 , ,
, ,  ,
, 
Abstract
:
1. Introduction
2. Materials and Methods
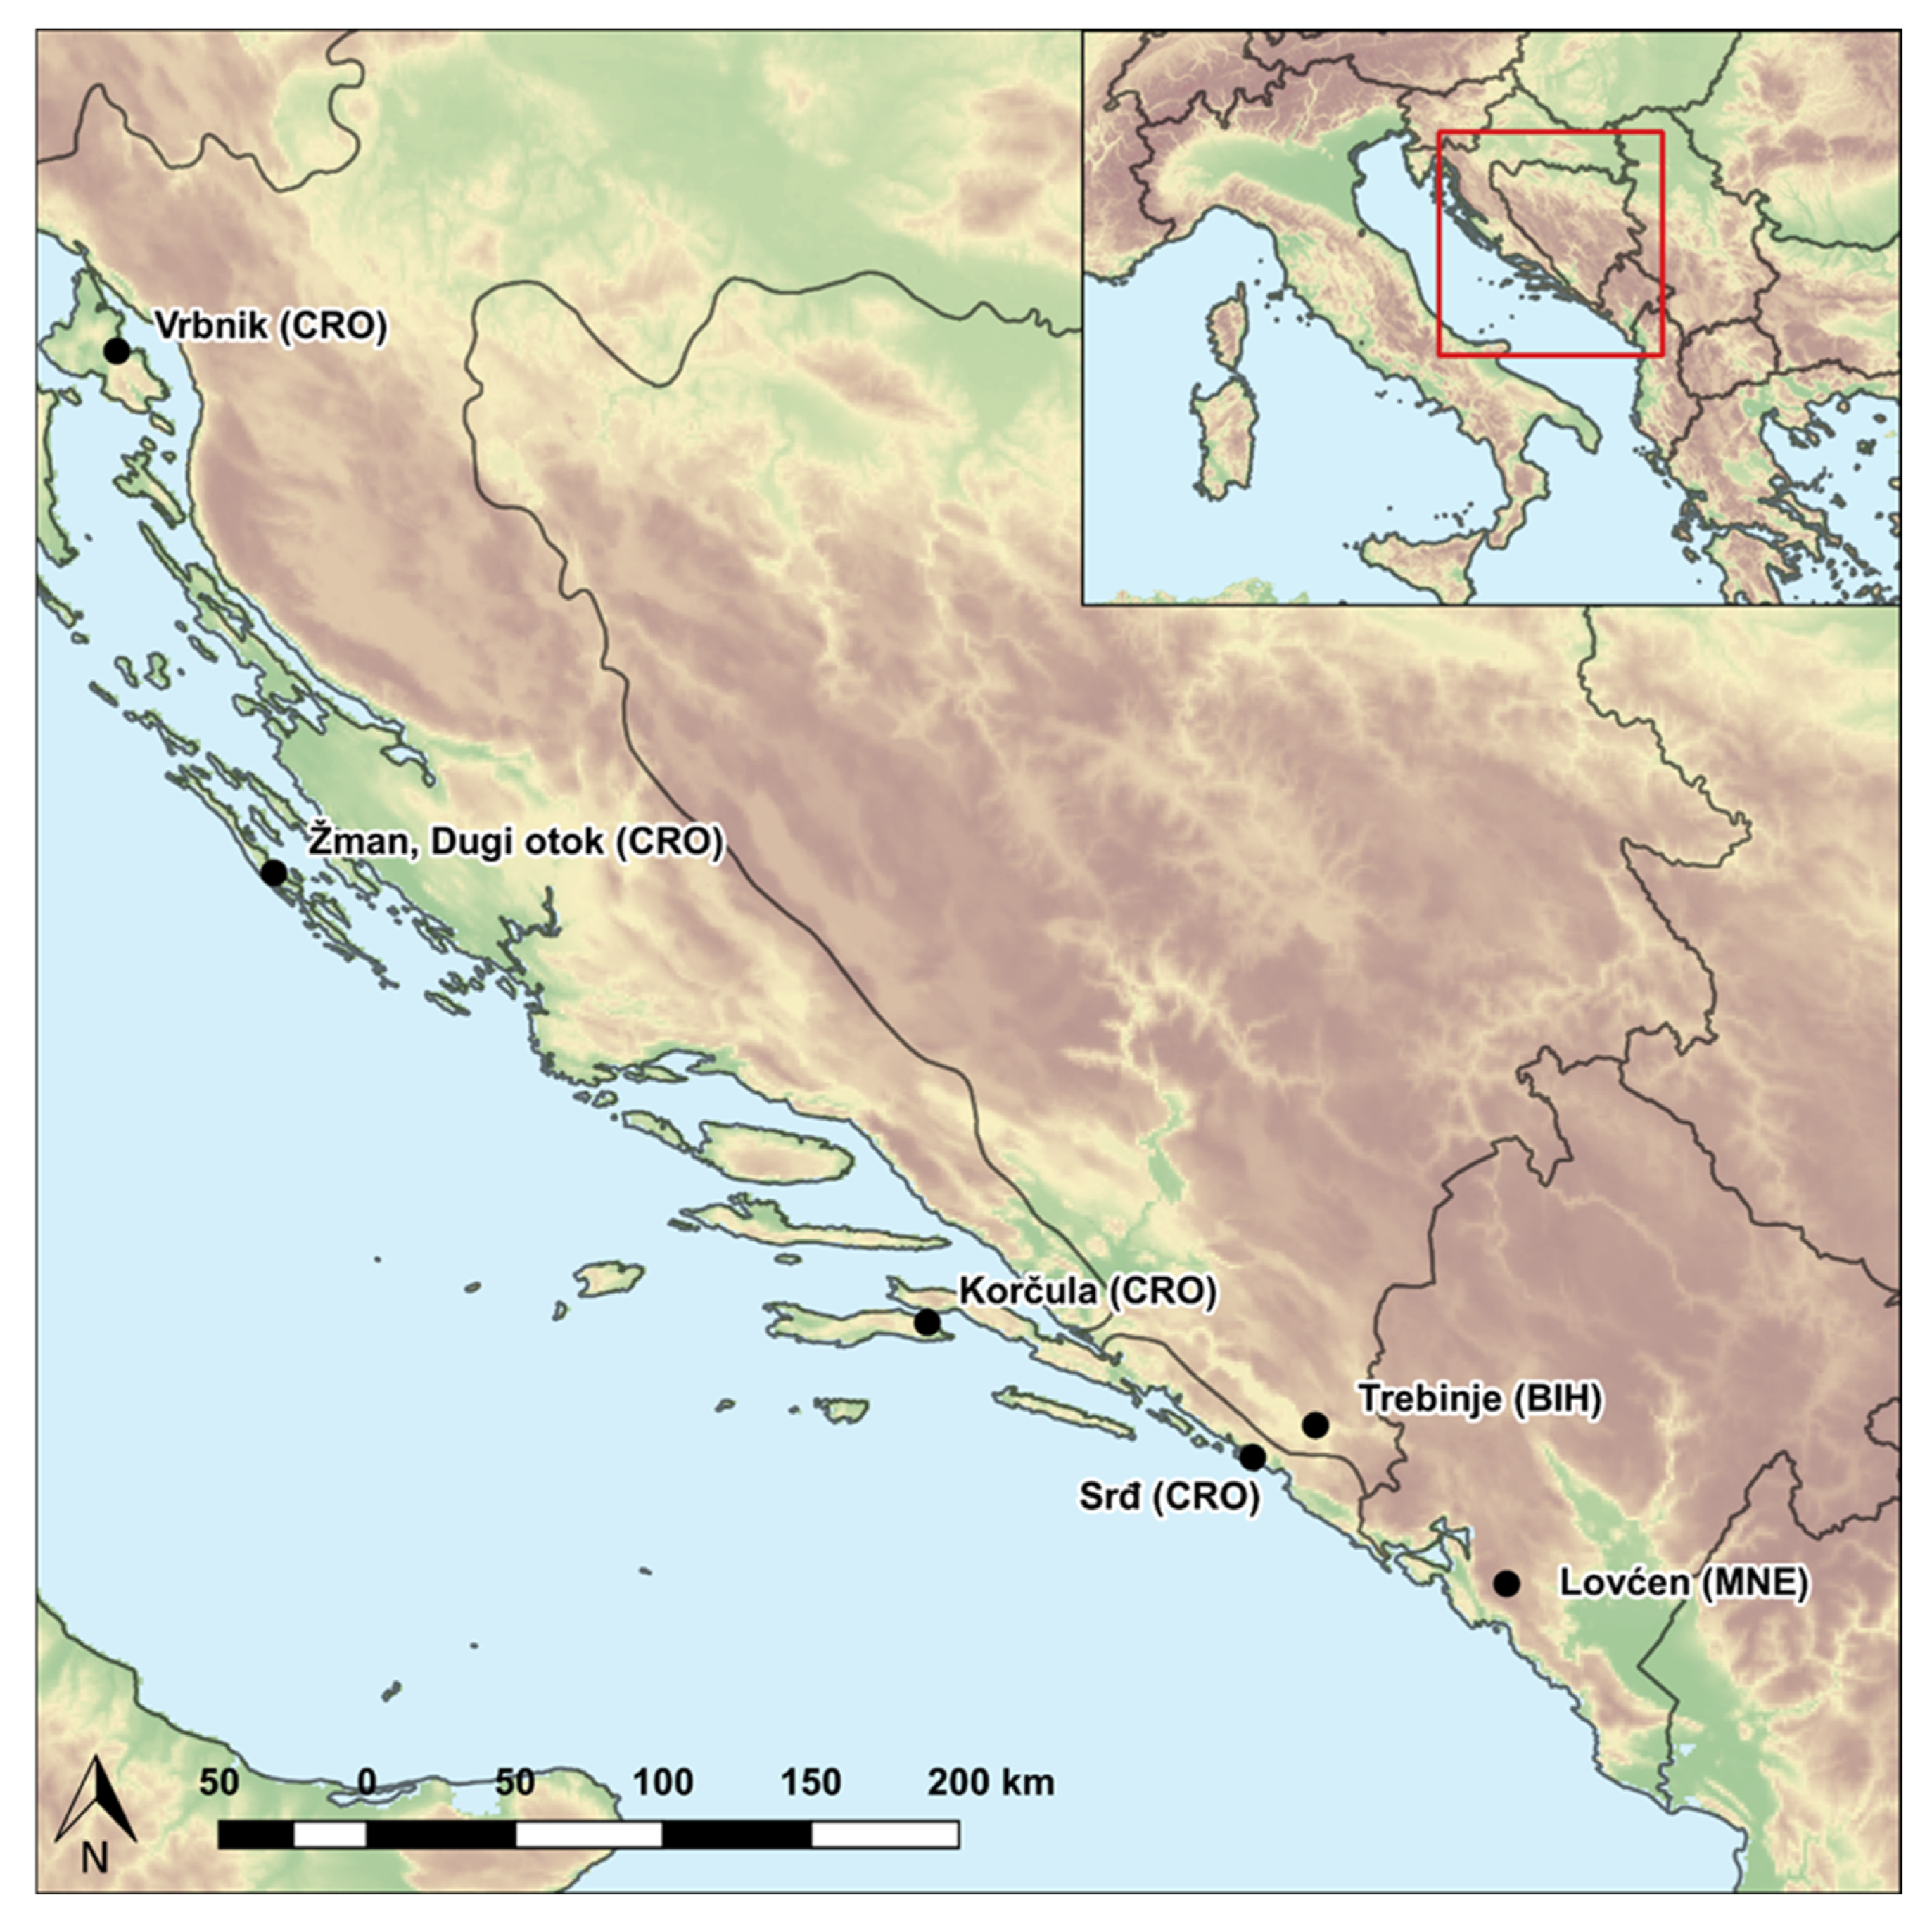
2.1. Plant Material
2.2. Extraction and Quantification of Pyrethrins
2.2.1. Standards and Reagents
2.2.2. Ultrasound Assisted Extraction
2.2.3. HPLC
2.3. Data Analysis
3. Results
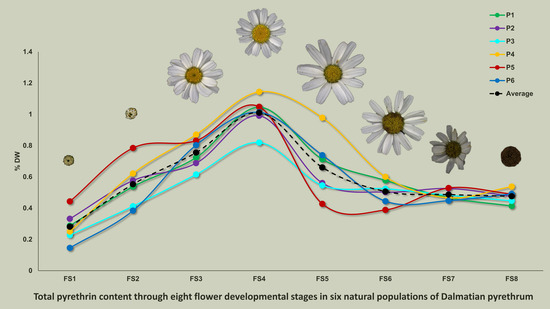
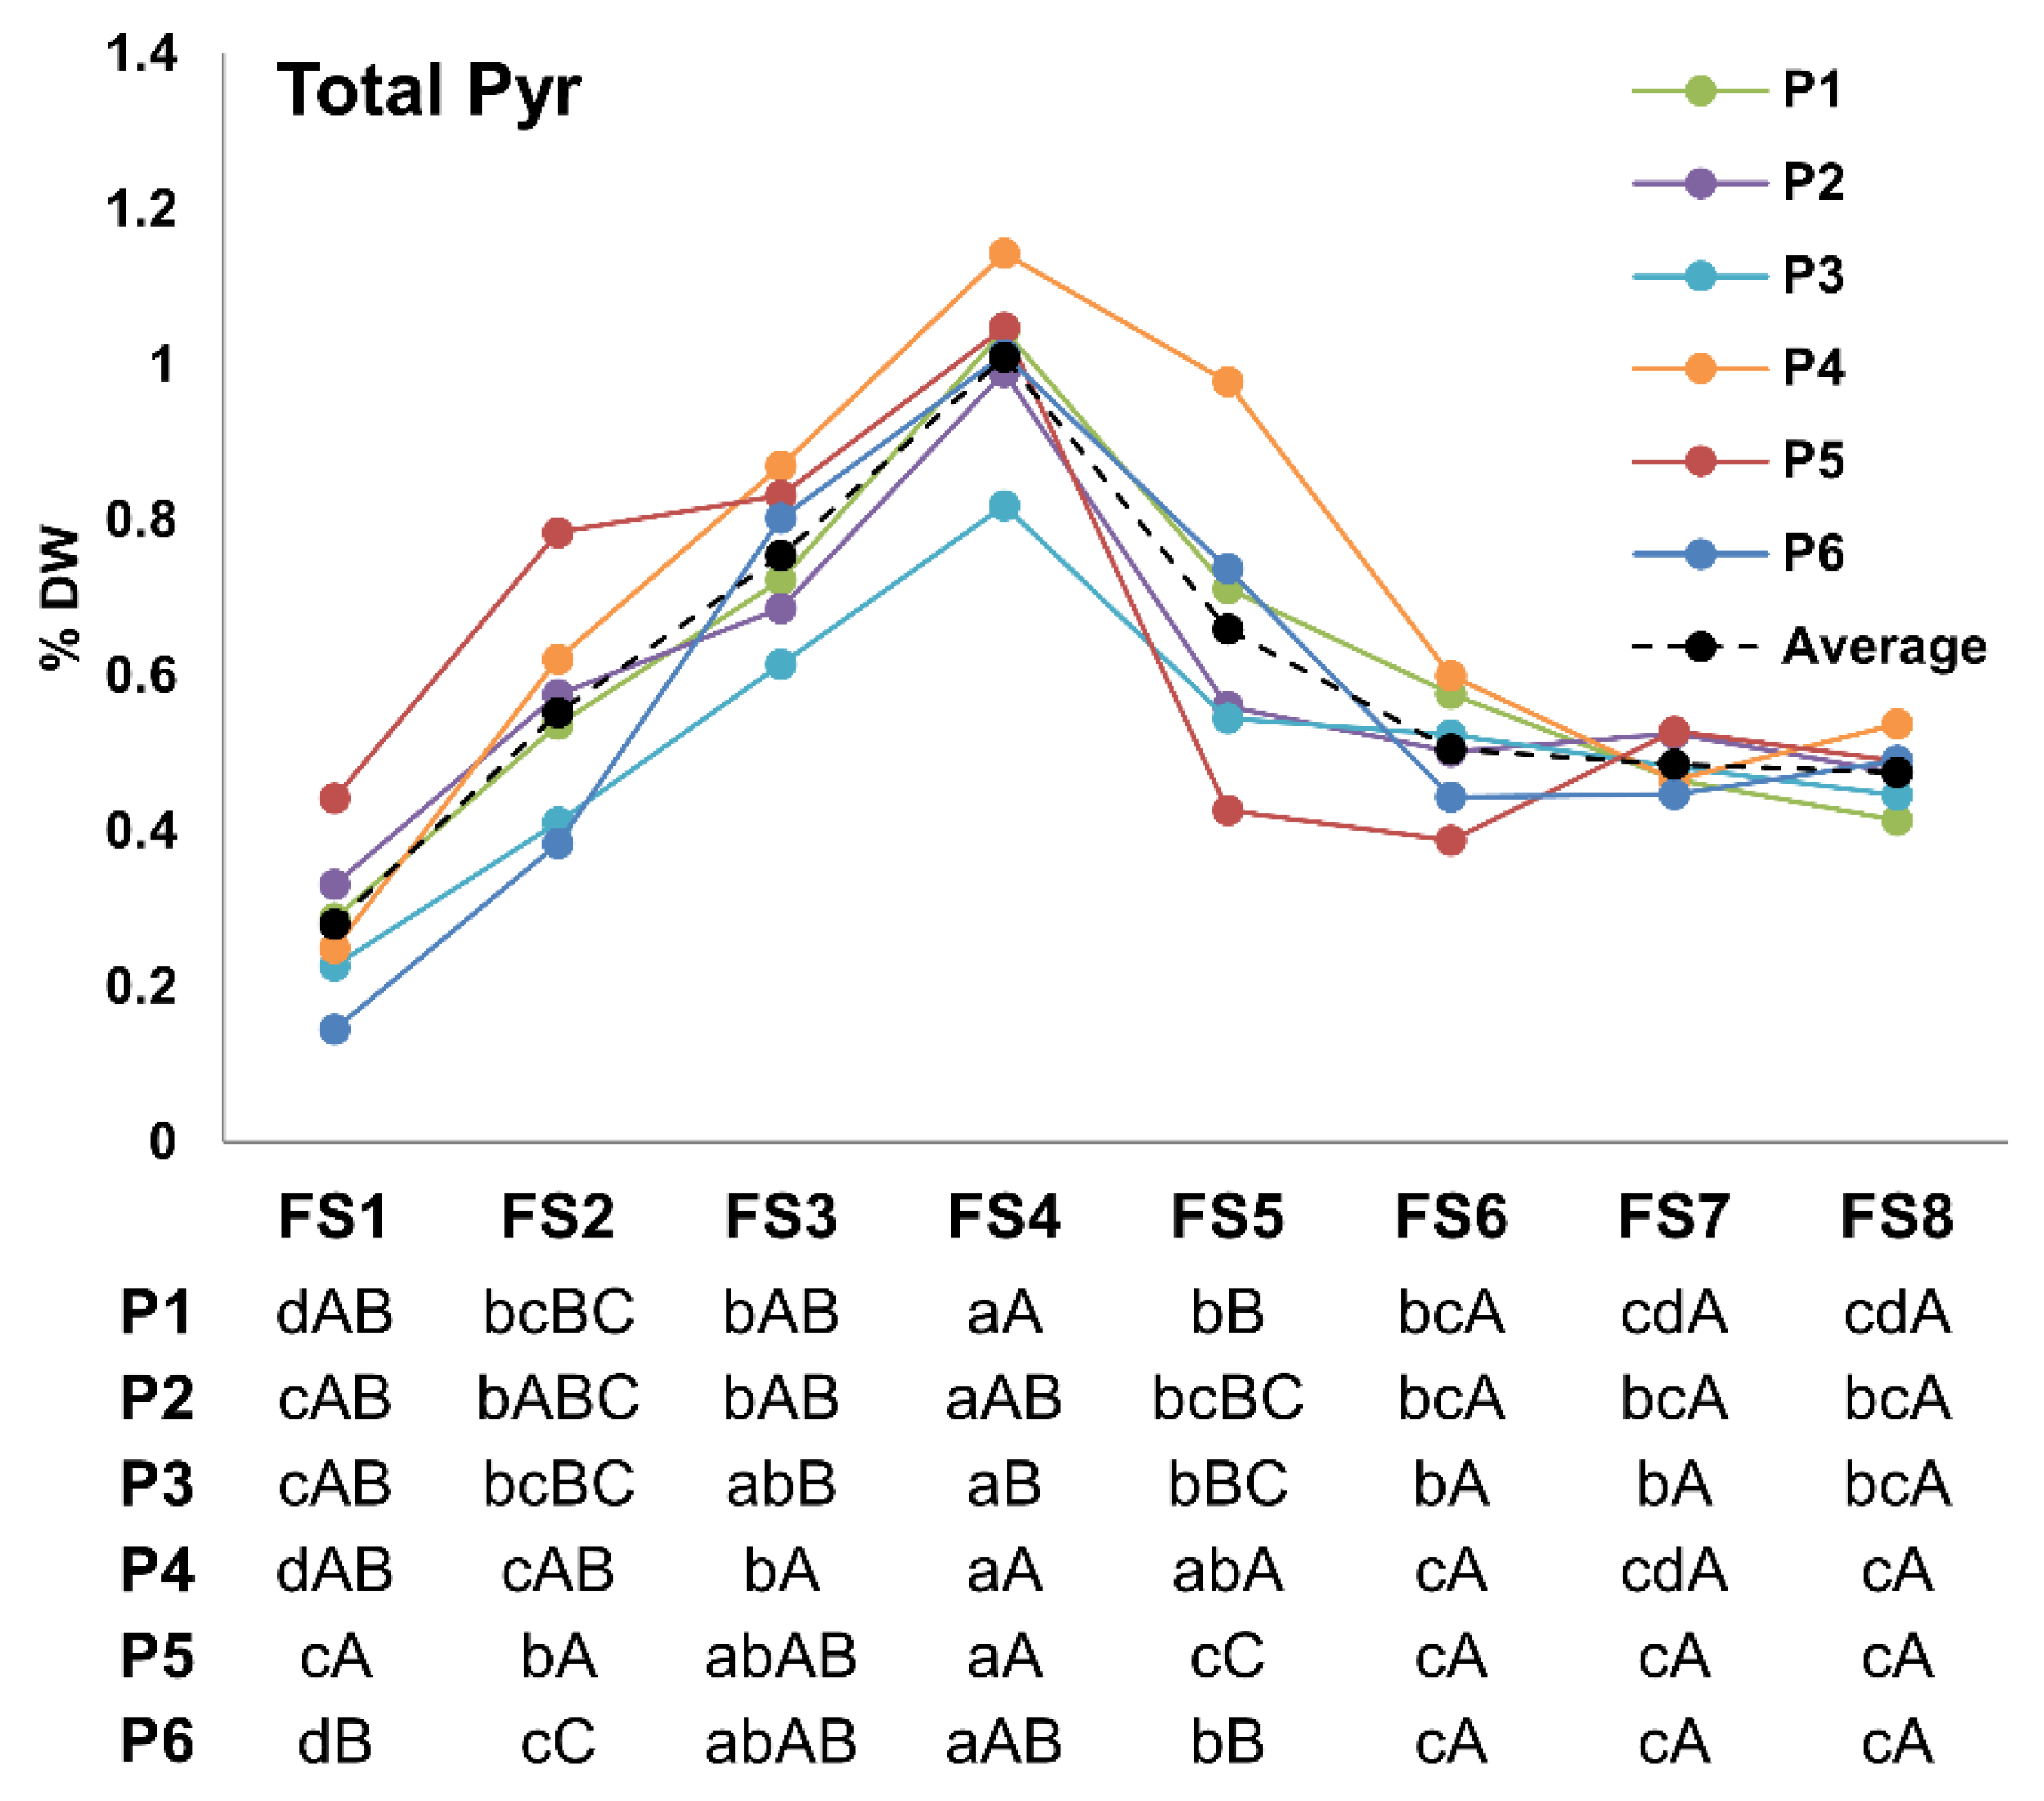
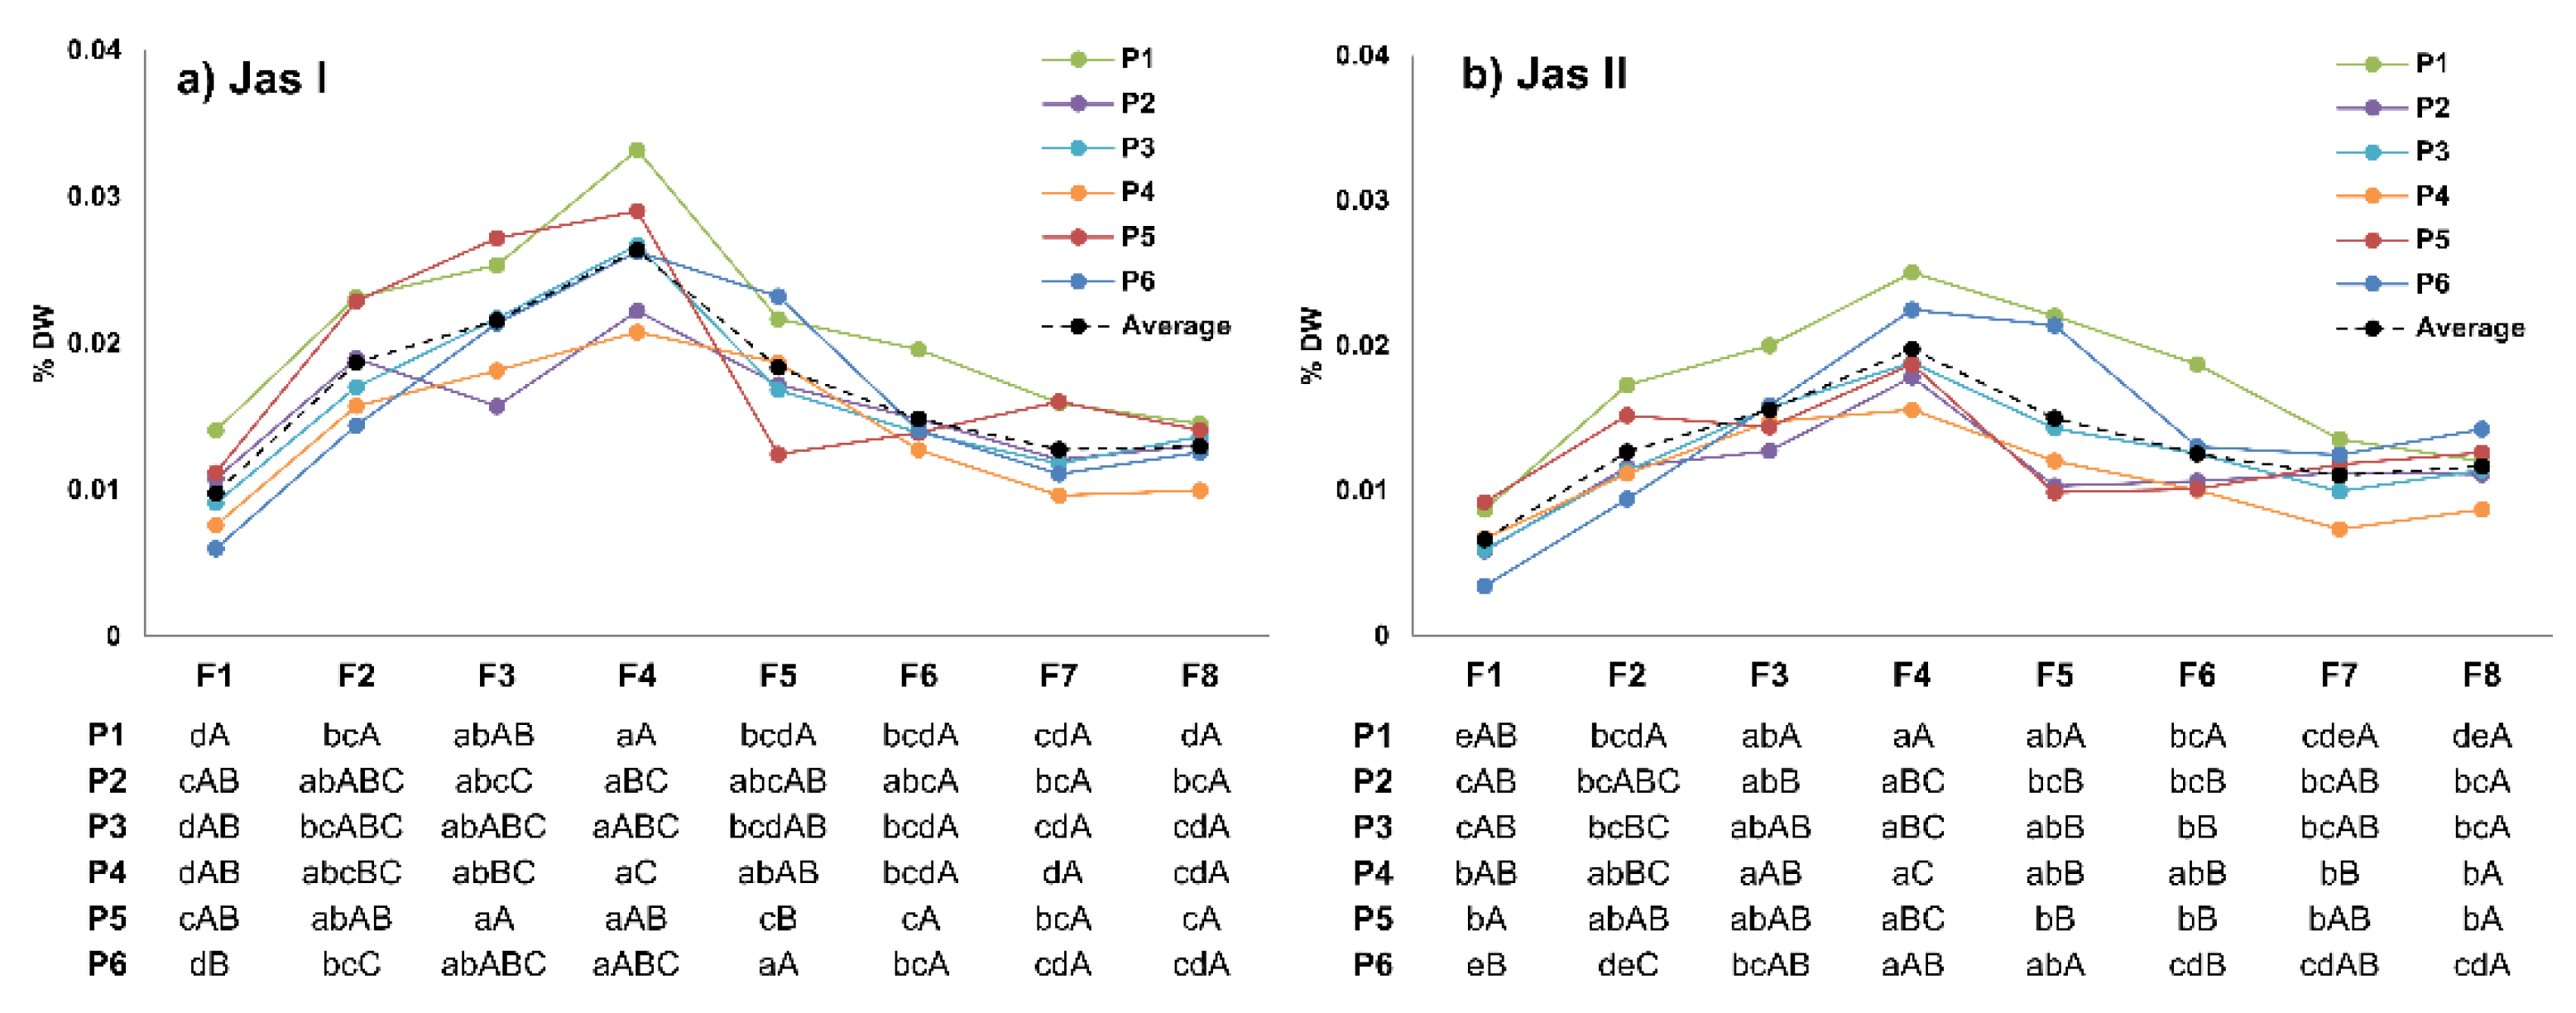
3.1. Total Pyrethrin Content
3.2. Pyrethrin I and II
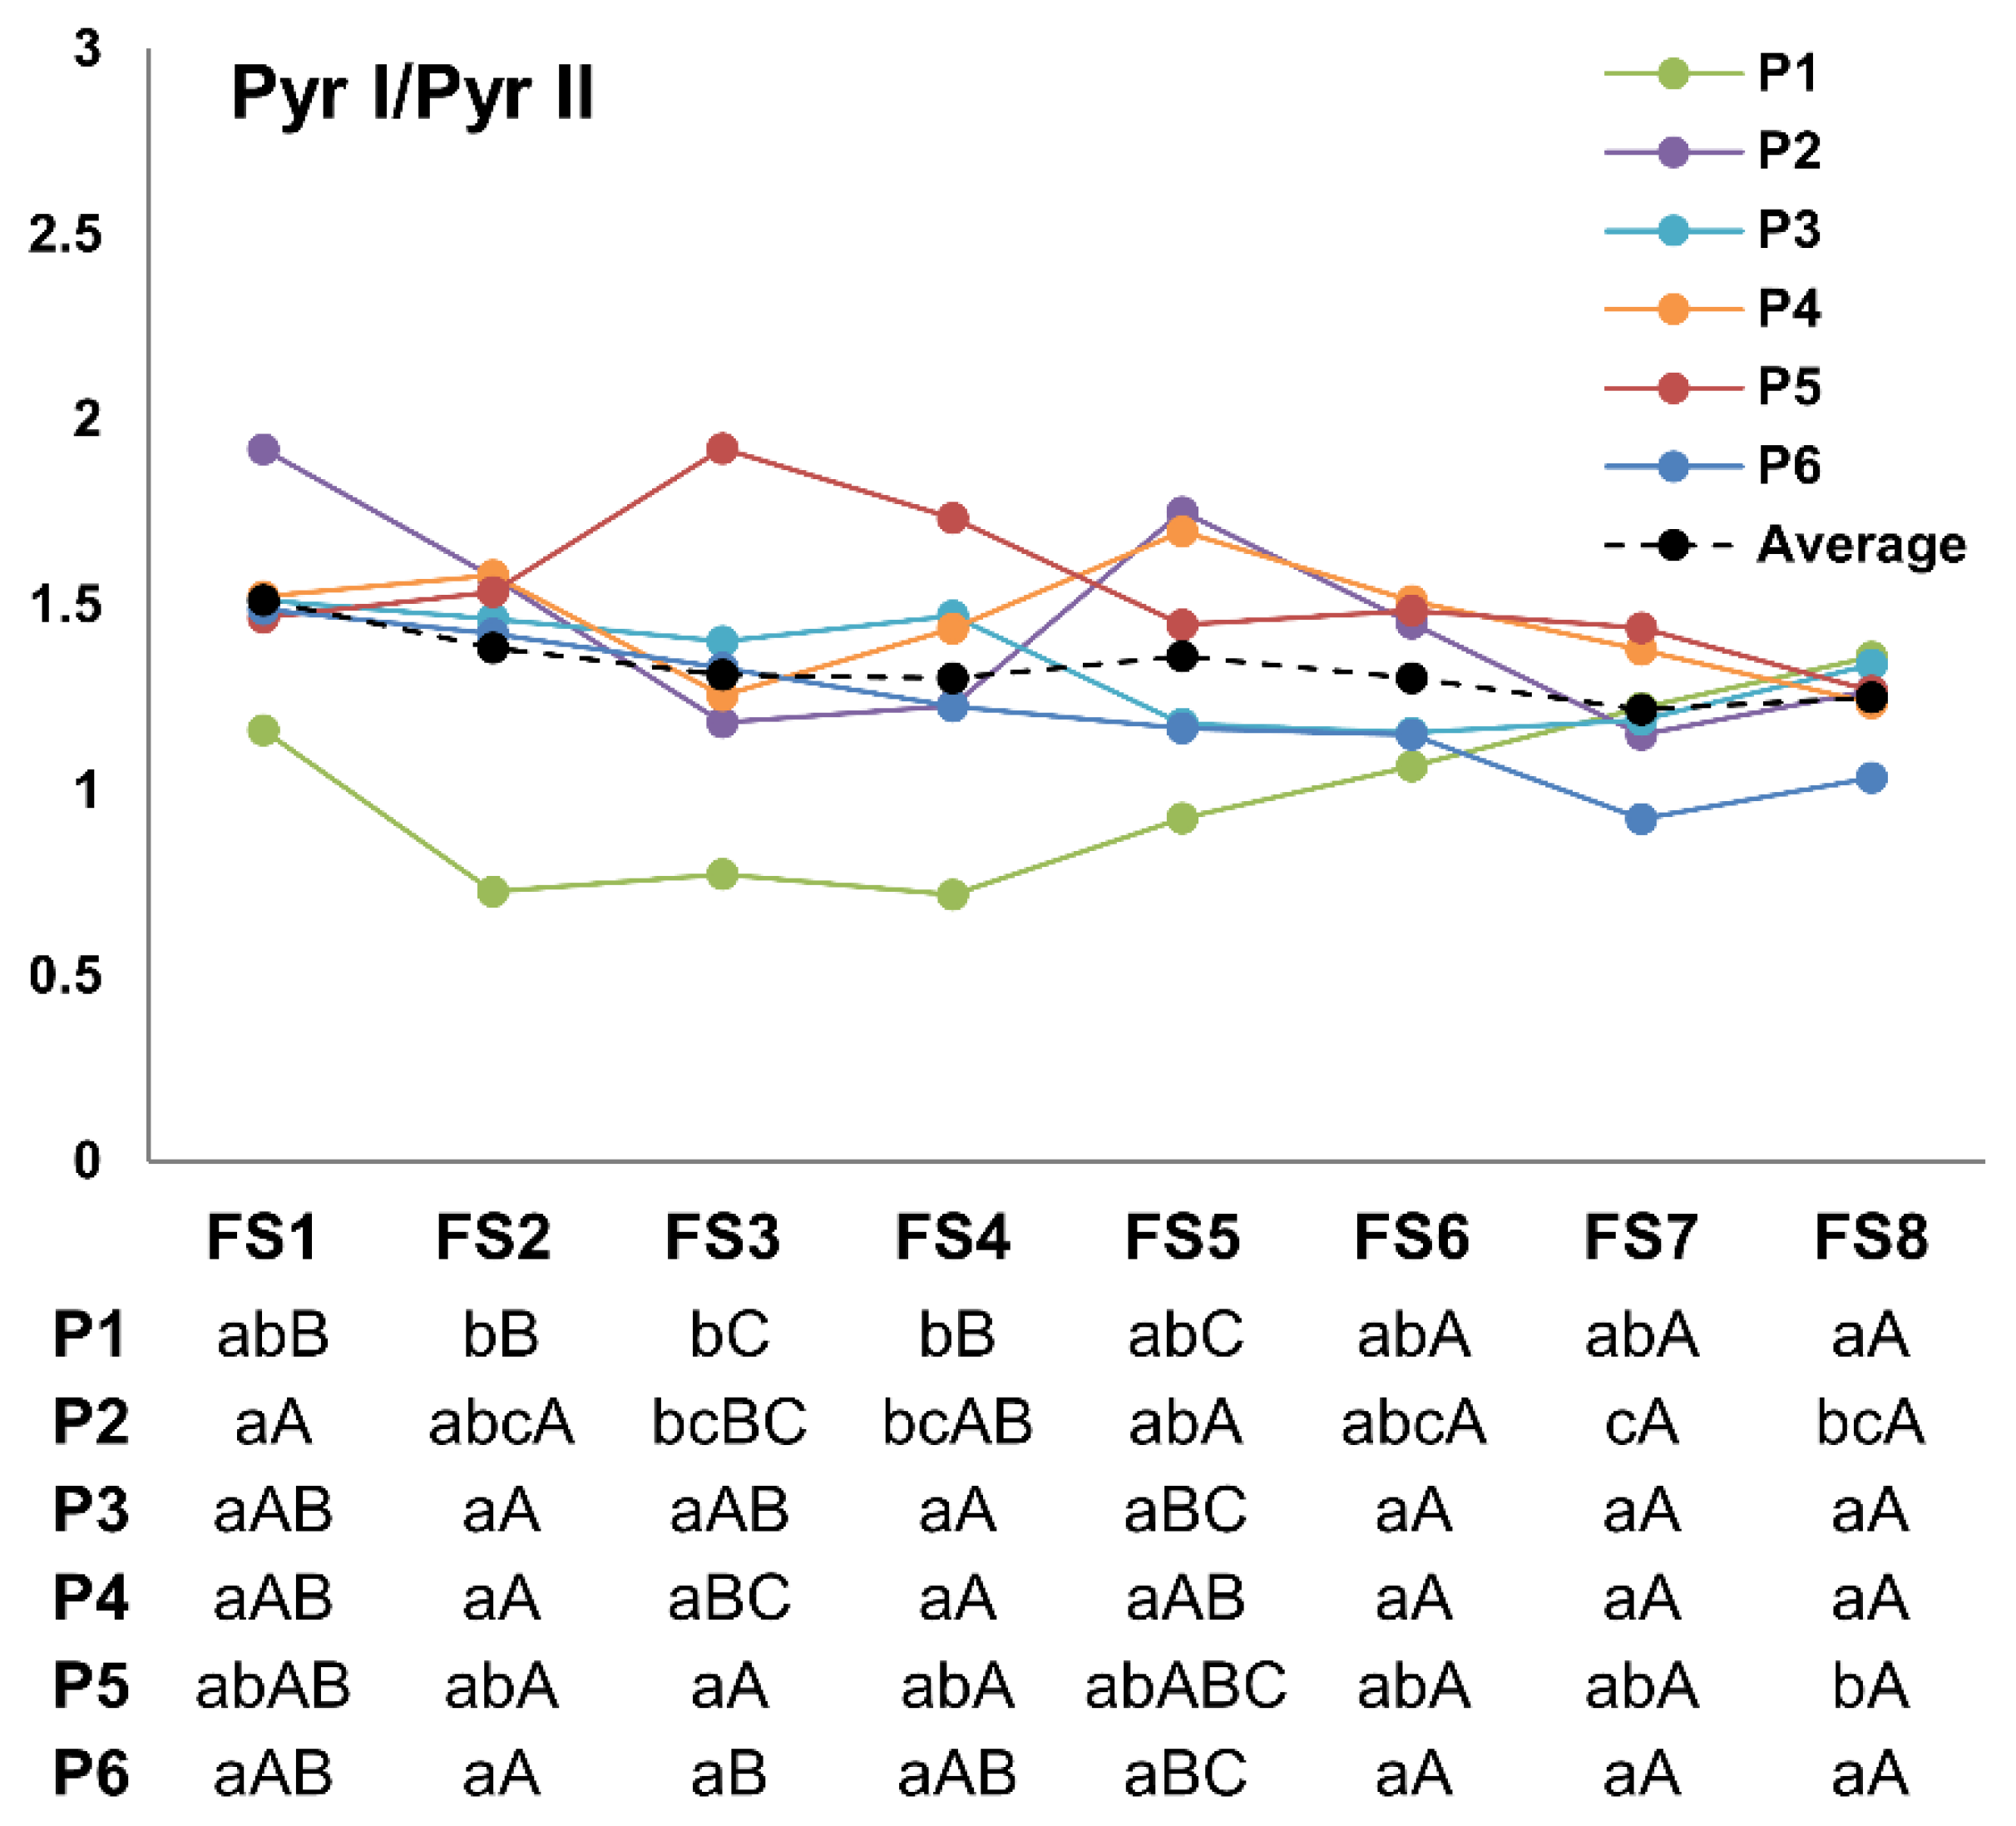
3.3. Pyr I/pyr II Ratio
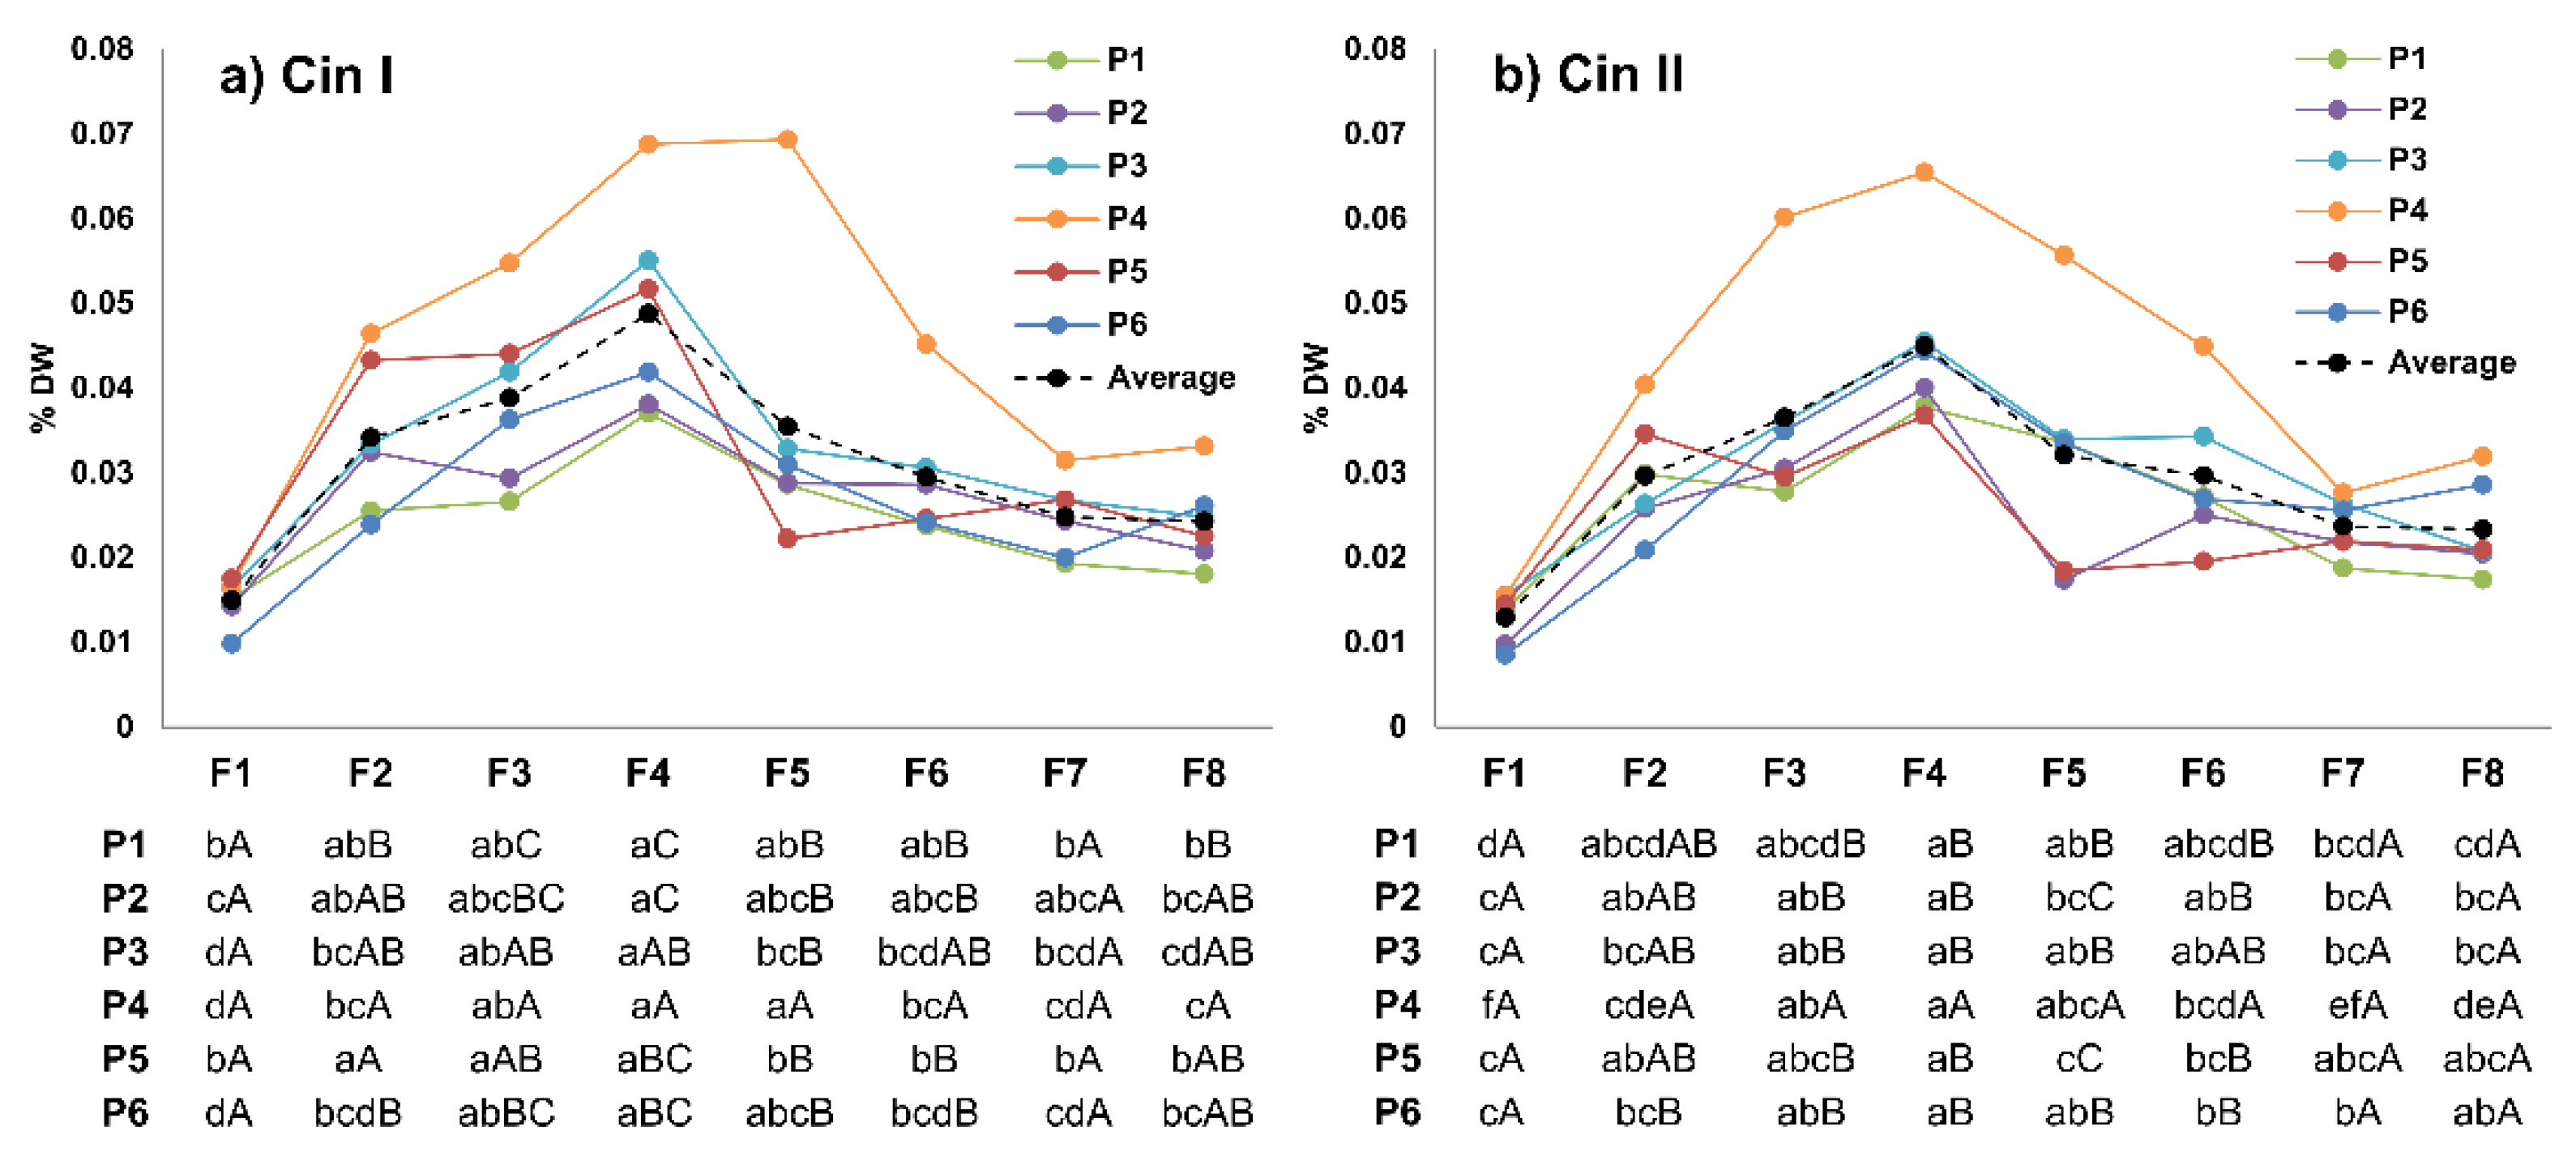
3.4. Cinerin I and II
3.5. Jasmolin I and II
4. Discussion
4.1. Accumulation Patterns of Total Pyrethrin and Pyrethrin Compounds over Flowering Stages
4.2. Variability among Studied Populations
5. Conclusions
Supplementary Materials
Author Contributions
Funding
Institutional Review Board Statement
Informed Consent Statement
Data Availability Statement
Conflicts of Interest
References
- Yang, L.; Wen, K.S.; Ruan, X.; Zhao, Y.X.; Wei, F.; Wang, Q. Response of plant secondary metabolites to environmental factors. Molecules 2018, 23, 762. [Google Scholar] [CrossRef] [Green Version]
- Li, Y.; Kong, D.; Fu, Y.; Sussman, M.R.; Wu, H. The effect of developmental and environmental factors on secondary metabolites in medicinal plants. Plant Physiol. Biochem. 2020, 148, 80–89. [Google Scholar] [CrossRef]
- Figueiredo, A.C.; Barroso, J.G.; Pedro, L.G.; Scheffer, J.J.C. Factors affecting secondary metabolite production in plants: Volatile components and essential oils. Flavour Fragr. J. 2008, 23, 213–226. [Google Scholar] [CrossRef]
- Jones, W.P.; Kinghorn, A.D. Extraction of plant secondary metabolites. In Natural Products Isolation. Methods in Molecular Biology (Methods and Protocols); Sarker, S., Nahar, L., Eds.; Humana Press: Totowa, NJ, USA, 2012; pp. 341–366. ISBN 9781617796234. [Google Scholar]
- Nikolić, T. Flora Croatica; Alfa d.d.: Zagreb, Croatia, 2020; Volume 2. [Google Scholar]
- Head, S.W. A study of the insecticidal constituents in Chrysanthemum cinerariaefolium. (1) Their development in the flower head. (2) Their distribution in the plant. Pyrethrum Post 1966, 8, 32–37. [Google Scholar]
- Ramirez, A.M.; Stoopen, G.; Menzel, T.R.; Gols, R.; Bouwmeester, H.J.; Dicke, M.; Jongsma, M.A. Bidirectional secretions from glandular trichomes of pyrethrum enable immunization of seedlings. Plant Cell 2012, 24, 4252–4265. [Google Scholar] [CrossRef] [Green Version]
- Maciver, D.R. Constituents of Pyrethrum Extract. In Pyrethrum Flowers: Production, Chemistry, Toxicology, and Uses; Casida, J.E., Quistad, G.B., Eds.; Oxford University Press: New York, NY, USA, 1995; pp. 108–122. [Google Scholar]
- Glynne-Jones, A. Pyrethrum. Pestic. Outlook 2001, 12, 195–198. [Google Scholar] [CrossRef]
- Jeran, N.; Grdiša, M.; Varga, F.; Šatović, Z.; Liber, Z.; Dabić, D.; Biošić, M. Pyrethrin from Dalmatian pyrethrum (Tanacetum cinerariifolium/Trevir./Sch. Bip.): Biosynthesis, biological activity, methods of extraction and determination. Phytochem. Rev. 2021, 20, 875–905. [Google Scholar] [CrossRef]
- Li, J.; Yin, L.Y.; Jongsma, M.A.; Wang, C.Y. Effects of light, hydropriming and abiotic stress on seed germination, and shoot and root growth of pyrethrum (Tanacetum cinerariifolium). Ind. Crops Prod. 2011, 34, 1543–1549. [Google Scholar] [CrossRef]
- Food and Agriculture Organization of the United Nations FAOSTAT. Production: Crops. Available online: https://www.fao.org/faostat/en/#data/QCL (accessed on 12 September 2021).
- Botanical Resources Australia BRA. Available online: https://www.botanicalresources.com/ (accessed on 19 September 2020).
- Grdiša, M.; Babić, S.; Periša, M.; Carović-Stanko, K.; Kolak, I.; Liber, Z.; Jug-Dujaković, M.; Satovic, Z. Chemical diversity of the natural populations of Dalmatian Pyrethrum (Tanacetum cinerariifolium/Trevir./Sch.Bip.) in Croatia. Chem. Biodivers. 2013, 10, 460–472. [Google Scholar] [CrossRef]
- Varga, F.; Jeran, N.; Šatović, Z.; Biošić, M.; Grdiša, M. High diversity of natural Dalmatian pyrethrum based on pyrethrin composition at intra- and interpopulation level. Phytochemistry 2021, 192, 112934. [Google Scholar] [CrossRef]
- Morris, S.E.; Davies, N.W.; Brown, P.H.; Groom, T. Effect of drying conditions on pyrethrins content. Ind. Crops Prod. 2006, 23, 9–14. [Google Scholar] [CrossRef]
- Bhat, B.K. Breeding Methodologies Applicable to Pyrethrum. In Pyrethrum Flowers: Production, Chemistry, Toxicology, and Uses; Casida, J.E., Quistad, G.B., Eds.; Oxford University Press: New York, NY, USA, 1995; pp. 67–94. [Google Scholar]
- Grdiša, M.; Liber, Z.; Radosavljević, I.; Carović-Stanko, K.; Kolak, I.; Satovic, Z. Genetic diversity and structure of Dalmatian pyrethrum (Tanacetum cinerariifolium Trevir./Sch./Bip., Asteraceae) within the Balkan refugium. PLoS ONE 2014, 9, e105265. [Google Scholar] [CrossRef] [Green Version]
- Parlevliet, J. The genetic variability of the yield components in the Kenyan pyrethrum populations. Euphytica 1974, 23, 377–384. [Google Scholar] [CrossRef]
- Bhat, B.K.; Menary, R.C. Genotypic and phenotypic correlation in Pyrethrum, (Chrysanthemum cinerariaefolium Vis), and their implication in selection. Pyrethrum Post 1986, 16, 61–65. [Google Scholar]
- Pandita, P.N.; Bhat, B.K. Correlations in phenotypic traits of Pyrethrum (Chrysanthemum cinerariaefolium Vis). Pyrethrum Post 1986, 16, 93–94. [Google Scholar]
- Singh, S.P.; Sharma, J.R.; Rajeswara Rao, B.R.; Sharma, S.K. Genetic improvement of pyrethrum. II. Parent-offspring correlation and progeny performance. Pyrethrum Post 1988, 17, 8–11. [Google Scholar]
- Ambrožič Dolinšek, J.; Kovač, M.; Žel, J.; Camloh, M. Pyrethrum (Tanacetum cinerariifolium) from the Northern Adriatic as a potential source of natural insecticide. Ann. Ser. Hist. Nat. 2007, 17, 39–46. [Google Scholar]
- Wandahwa, P.; Van Ranst, E.; Van Damme, P. Pyrethrum (Chrysanthemum cinerariaefolium Vis.) cultivation in West Kenya: Origin, ecological conditions and management. Ind. Crops Prod. 1996, 5, 307–322. [Google Scholar] [CrossRef]
- Ban, D.; Sladonja, B.; Lukić, M.; Lukić, I.; Lušetić, V.; Ganić, K.K.; Žnidarčič, D. Comparison of pyrethrins extraction methods efficiencies. Afr. J. Biotechnol. 2010, 9, 2702–2708. [Google Scholar] [CrossRef]
- Gallo, M.; Formato, A.; Ianniello, D.; Andolfi, A.; Conte, E.; Ciaravolo, M.; Varchetta, V.; Naviglio, D. Supercritical fluid extraction of pyrethrins from pyrethrum flowers (Chrysanthemum cinerariifolium) compared to traditional maceration and cyclic pressurization extraction. J. Supercrit. Fluids 2017, 119, 104–112. [Google Scholar] [CrossRef]
- Kiriamiti, H.K.; Camy, S.; Gourdon, C.; Condoret, J.S. Pyrethrin exraction from pyrethrum flowers using carbon dioxide. J. Supercrit. Fluids 2003, 26, 193–200. [Google Scholar] [CrossRef]
- Nagar, A.; Chatterjee, A.; Ur Rehman, L.; Ahmad, A.; Tandon, S. Comparative extraction and enrichment techniques for pyrethrins from flowers of Chrysanthemum cinerariaefolium. Ind. Crops Prod. 2015, 76, 955–960. [Google Scholar] [CrossRef]
- Pan, W.H.T.; Chang, C.C.; Su, T.T.; Lee, F.; Fuh, M.R.S. Preparative supercritical fluid extraction of pyrethrin I and II from pyrethrum flower. Talanta 1995, 42, 1745–1749. [Google Scholar] [CrossRef]
- Beckley, V.A. Pyrethrum drying. Pyrethrum Post 1952, 1, 9–11. [Google Scholar]
- Ngugi, C.W.; Ikahu, J.M.K. The effect of drying temperature on pyrethrins content in some pyrethrum clones. Pyrethrum Post 1990, 18, 18–21. [Google Scholar]
- Suraweera, D.D.; Groom, T.; Taylor, P.W.J.; Jayasinghe, C.S.; Nicolas, M.E. Dynamics of flower, achene and trichome development governs the accumulation of pyrethrins in pyrethrum (Tanacetum cinerariifolium) under irrigated and dryland conditions. Ind. Crops Prod. 2017, 109, 123–133. [Google Scholar] [CrossRef]
- Parlevliet, J.E. The Effect of Picking Interval and Flower Head Development on the Pyrethrins Content of Different Pyrethrum Clones. Pyrethrum Post 1970, 10, 10–14. [Google Scholar]
- Bhat, B.K.; Menary, R.C. Genotypic and Phenotypic Variation in Floral development of different Clones of Pyrethrum (Chrysanthemum cinerariaefolium Vis). Pyrethrum Post 1984, 15, 99–103. [Google Scholar]
- Ikahu, J.M.; Ngugi, C.W. Investigations into yield losses of some pyrethrum clones through picking of flowers improper stage of development. Pyrethrum Post 1989, 17, 56–59. [Google Scholar]
- Notcutt, L.A. Oil gland count as an approximate means of evaluating Pyrethrum flowers. Pyrethrum Post 1955, 3, 9–14. [Google Scholar]
- Bhat, B.K.; Menary, R.C. Scanning electron microscopic study of oil glands in pyrethrum flowers. Pyrethrum Post 1979, 15, 11–15. [Google Scholar]
- Suraweera, D.D.; Groom, T.; Nicolas, M.E. Pattern of pyrethrin accumulation, achene and trichome development in relation to pattern of flower development in pyrethrum. Acta Hortic. 2017, 1169, 93–100. [Google Scholar] [CrossRef]
- Head, S.W. Composition of Pyrethrum Extract and Analysis of Pyrethrins. In Pyretrum: The Natural Insecticide; Casida, J.E., Ed.; Academic Press: New York, NY, USA, 1973; pp. 25–53. ISBN 978-0-12-162950-2. [Google Scholar]
- Potts, W.; Menary, R. Research Report on Pyrethrum; University of Tasmania: Hobart, Australia, 1987. [Google Scholar]
- Fulton, D. Agronomic and Seed Quality Studies in Pyrethrum Tanacetum cinerariaefolium Sch. Bip. Ph.D. Thesis, University of Tasmania, Hobart, Australia, 1998. [Google Scholar]
- Beckley, V.A.; Gnadinger, C.B.; Ireland, F. Pyrethrum flowers Kenya, a better source. Ind. Eng. Chem. 1938, 30, 835–838. [Google Scholar] [CrossRef]
- Gnadinger, C.B.; Corl, C.S. Studies on pyrethrum flowers. II. The relation between maturity and pyrethrin content. J. Am. Chem. Soc. 1930, 52, 680–684. [Google Scholar] [CrossRef]
- Babić, S.; Grdiša, M.; Periša, M.; Ašperger, D.; Šatović, Z.; Kaštelan-Macan, M. Ultrasound-assisted extraction of pyrethrins from pyrethrum flowers. Agrochimica 2012, 56, 193–206. [Google Scholar]
- Littell, R.C.; Pendergast, J.; Natarajan, R. Modelling covariance structure in the analysis of repeated measures data. Stat. Med. 2000, 19, 1793–1819. [Google Scholar] [CrossRef]
- Groom, K. An Investigation of Breeding Methods Applicable to Tasmanian-Grown Pyrethrum. Ph.D. Thesis, University of Tasmania, Hobart, Australia, 2003. [Google Scholar]
- Rivera, S.B.; Swedlund, B.D.; King, G.J.; Bell, R.N.; Hussey, C.E.; Shattuck-Eidens, D.M.; Wrobel, W.M.; Peiser, G.D.; Poulter, C.D. Chrysanthemyl diphosphate synthase: Isolation of the gene and characterization of the recombinant non-head-to-tail monoterpene synthase from Chrysanthemum cinerariaefolium. Proc. Natl. Acad. Sci. USA 2001, 98, 4373–4378. [Google Scholar] [CrossRef] [Green Version]
- Ramirez, A.; Yang, T.; Bouwmeester, H.J.; Jongsma, M.A. A trichome-specific linoleate lipoxygenase expressed during pyrethrin biosynthesis in pyrethrum. Lipids 2013, 48, 1005–1015. [Google Scholar] [CrossRef]
- Head, S.W. A Study of the Insecticidal Constituents of Chrysanthemum cinerariaefolium (3) Their Composition in Different Pyrethrum Clones. Pyrethrum Post 1967, 9, 3–7. [Google Scholar]


| No. | ACCENUMB a | Population | Latitude (N) | Longitude (E) |
|---|---|---|---|---|
| P1 | MAP02970 | Vrbnik, Krk (CRO) | 45.07° | 14.66° |
| P2 | MAP02959 | Žman, Dugi otok (CRO) | 43.94° | 15.14° |
| P3 | MAP02824 | Korčula (CRO) | 42.95° | 17.12° |
| P4 | MAP02966 | Srđ (CRO) | 42.65° | 18.11° |
| P5 | MAP02969 | Trebinje (BIH) | 42.72° | 18.30° |
| P6 | MAP02979 | Lovćen (MNE) | 42.37° | 18.88° |
| Phase | Image | Description |
|---|---|---|
| FS1 |  | well-developed closed buds |
| FS2 | 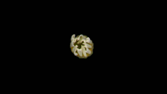 | ray florets emerging from the bud |
| FS3 |  | 1-2 rows of disc florets open |
| FS4 |  | 2-5 rows of disc florets open |
| FS5 | 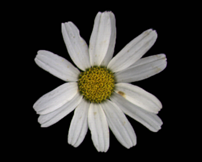 | all disc florets open |
| FS6 | 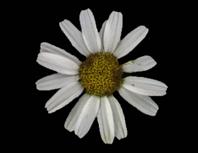 | all florets open; half of them brown |
| FS7 |  | ray florets dry; disc florets intact but with little color |
| FS8 |  | petal of disc florets fallen off; seed mature |
| Time (min) | A (%) | B (%) |
|---|---|---|
| 0.00 | 40 | 60 |
| 15.00 | 40 | 60 |
| 25.00 | 20 | 80 |
| 35.00 | 20 | 80 |
| 35.10 | 40 | 60 |
| 40.00 | 40 | 60 |
Publisher’s Note: MDPI stays neutral with regard to jurisdictional claims in published maps and institutional affiliations. |
© 2022 by the authors. Licensee MDPI, Basel, Switzerland. This article is an open access article distributed under the terms and conditions of the Creative Commons Attribution (CC BY) license (https://creativecommons.org/licenses/by/4.0/).
Share and Cite
Grdiša, M.; Jeran, N.; Varga, F.; Klepo, T.; Ninčević, T.; Šatović, Z. Accumulation Patterns of Six Pyrethrin Compounds across the Flower Developmental Stages—Comparative Analysis in Six Natural Dalmatian Pyrethrum Populations. Agronomy 2022, 12, 252. https://doi.org/10.3390/agronomy12020252
Grdiša M, Jeran N, Varga F, Klepo T, Ninčević T, Šatović Z. Accumulation Patterns of Six Pyrethrin Compounds across the Flower Developmental Stages—Comparative Analysis in Six Natural Dalmatian Pyrethrum Populations. Agronomy. 2022; 12(2):252. https://doi.org/10.3390/agronomy12020252
Chicago/Turabian StyleGrdiša, Martina, Nina Jeran, Filip Varga, Tatjana Klepo, Tonka Ninčević, and Zlatko Šatović. 2022. "Accumulation Patterns of Six Pyrethrin Compounds across the Flower Developmental Stages—Comparative Analysis in Six Natural Dalmatian Pyrethrum Populations" Agronomy 12, no. 2: 252. https://doi.org/10.3390/agronomy12020252
APA StyleGrdiša, M., Jeran, N., Varga, F., Klepo, T., Ninčević, T., & Šatović, Z. (2022). Accumulation Patterns of Six Pyrethrin Compounds across the Flower Developmental Stages—Comparative Analysis in Six Natural Dalmatian Pyrethrum Populations. Agronomy, 12(2), 252. https://doi.org/10.3390/agronomy12020252