

Effects of Phosphorus Supply on Seed Yield and Quality in Flax

 and
and
Abstract
1. Introduction
2. Materials and Methods
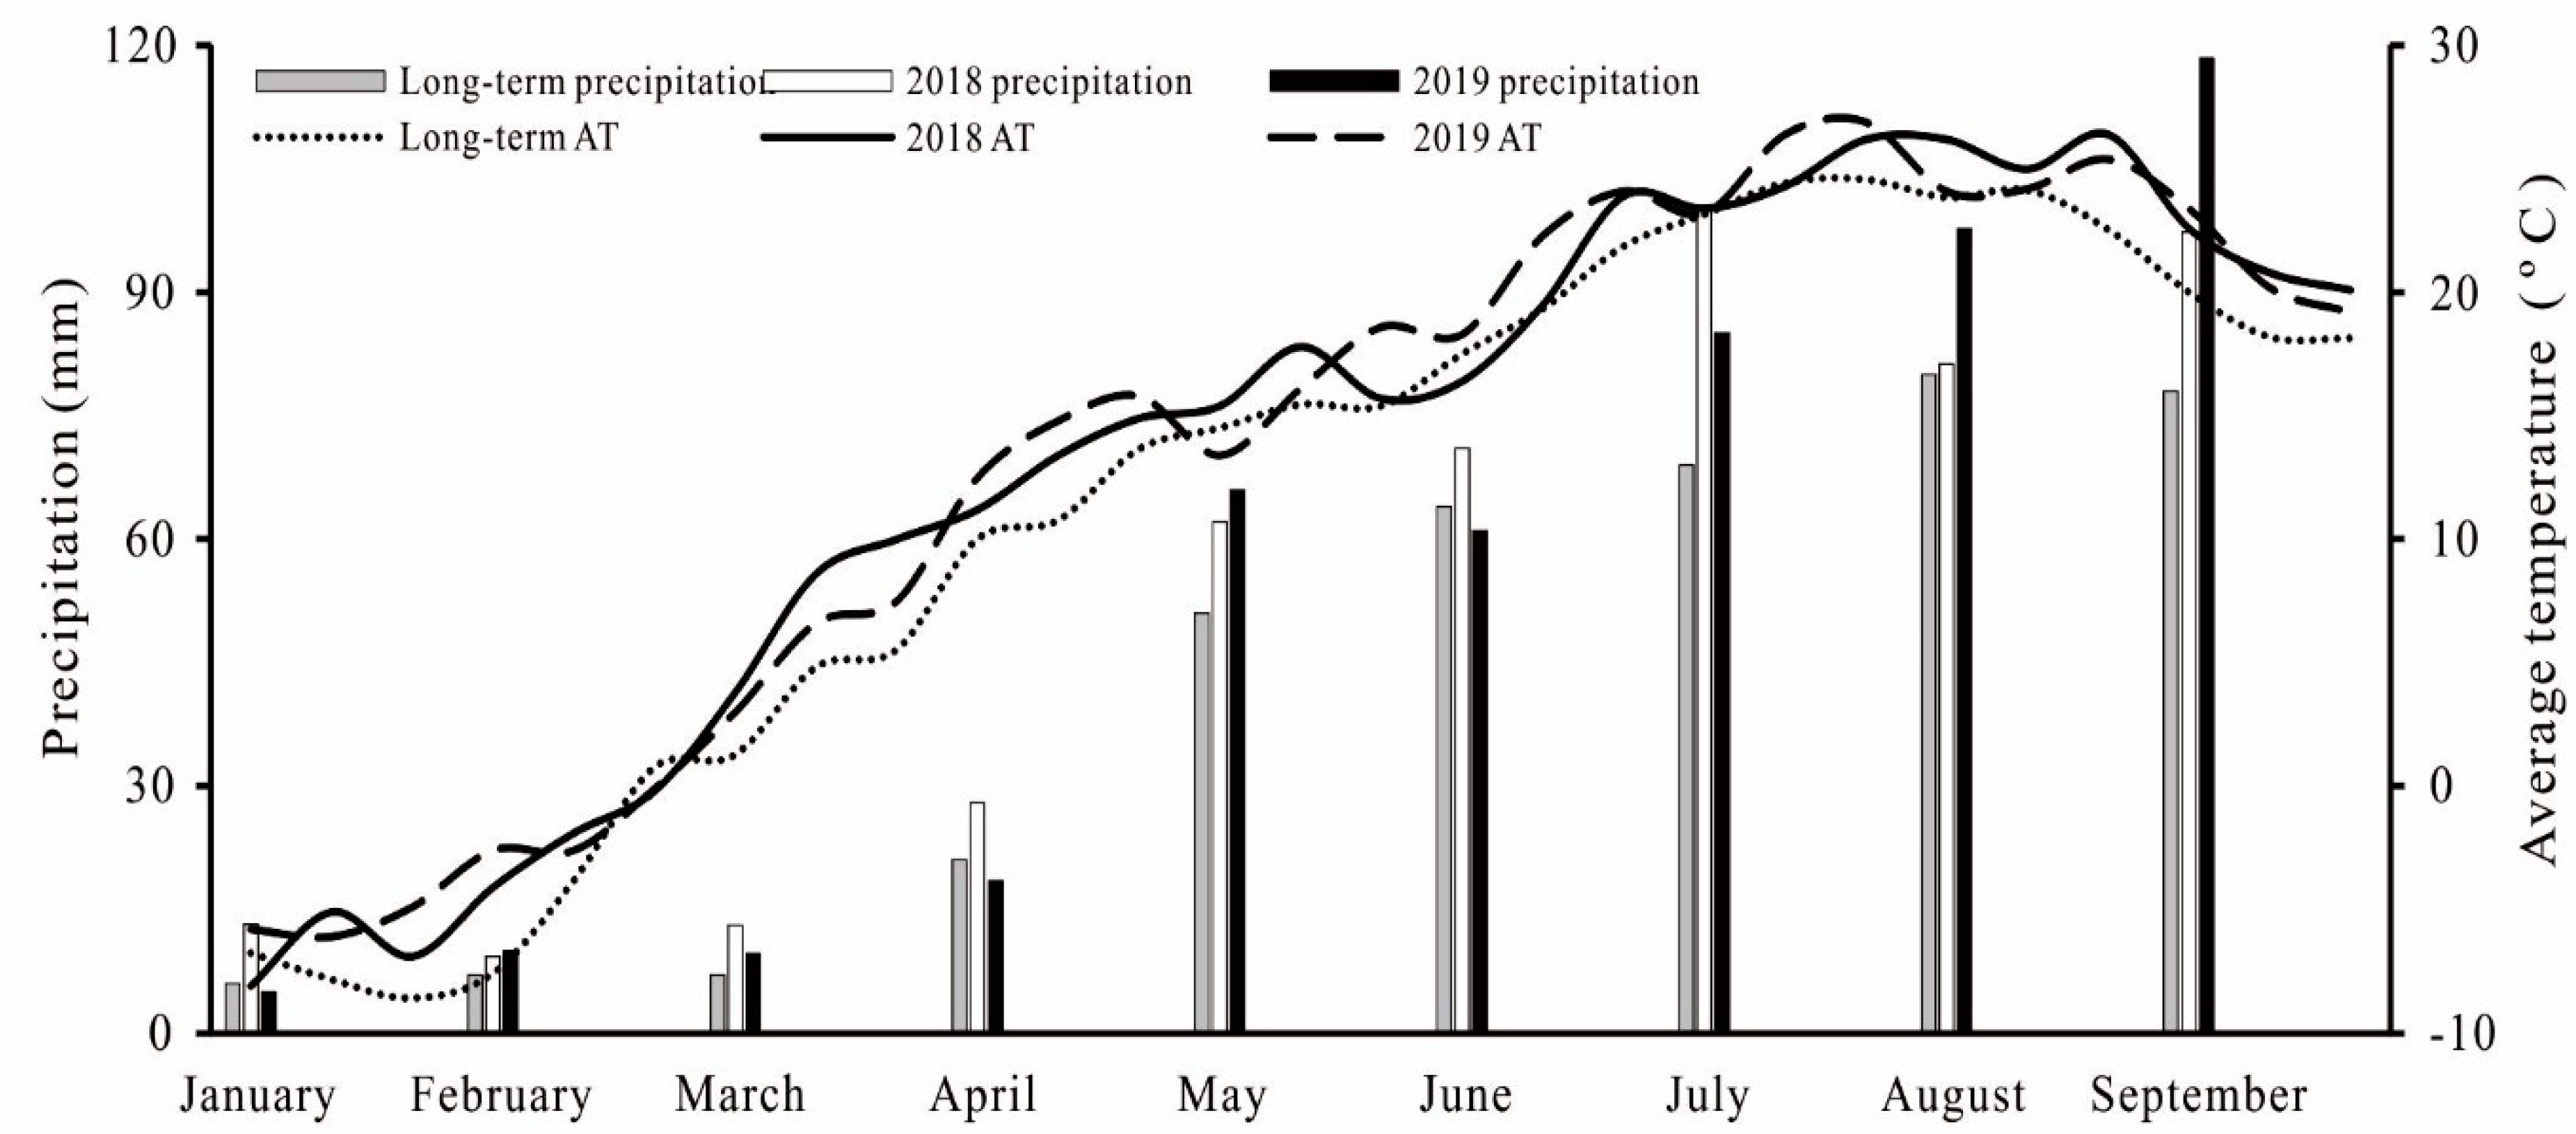
2.1. Experimental Site
2.2. Experimental Design
2.3. Lignan and Dietary Fiber Concentration Determination
2.4. Determination of Fe, Zn, Mn, and Cu Concentrations
2.5. Lignan, Dietary Fiber, Fe, Zn, Mn, and Cu Yields
2.6. Statistical Analysis
3. Results
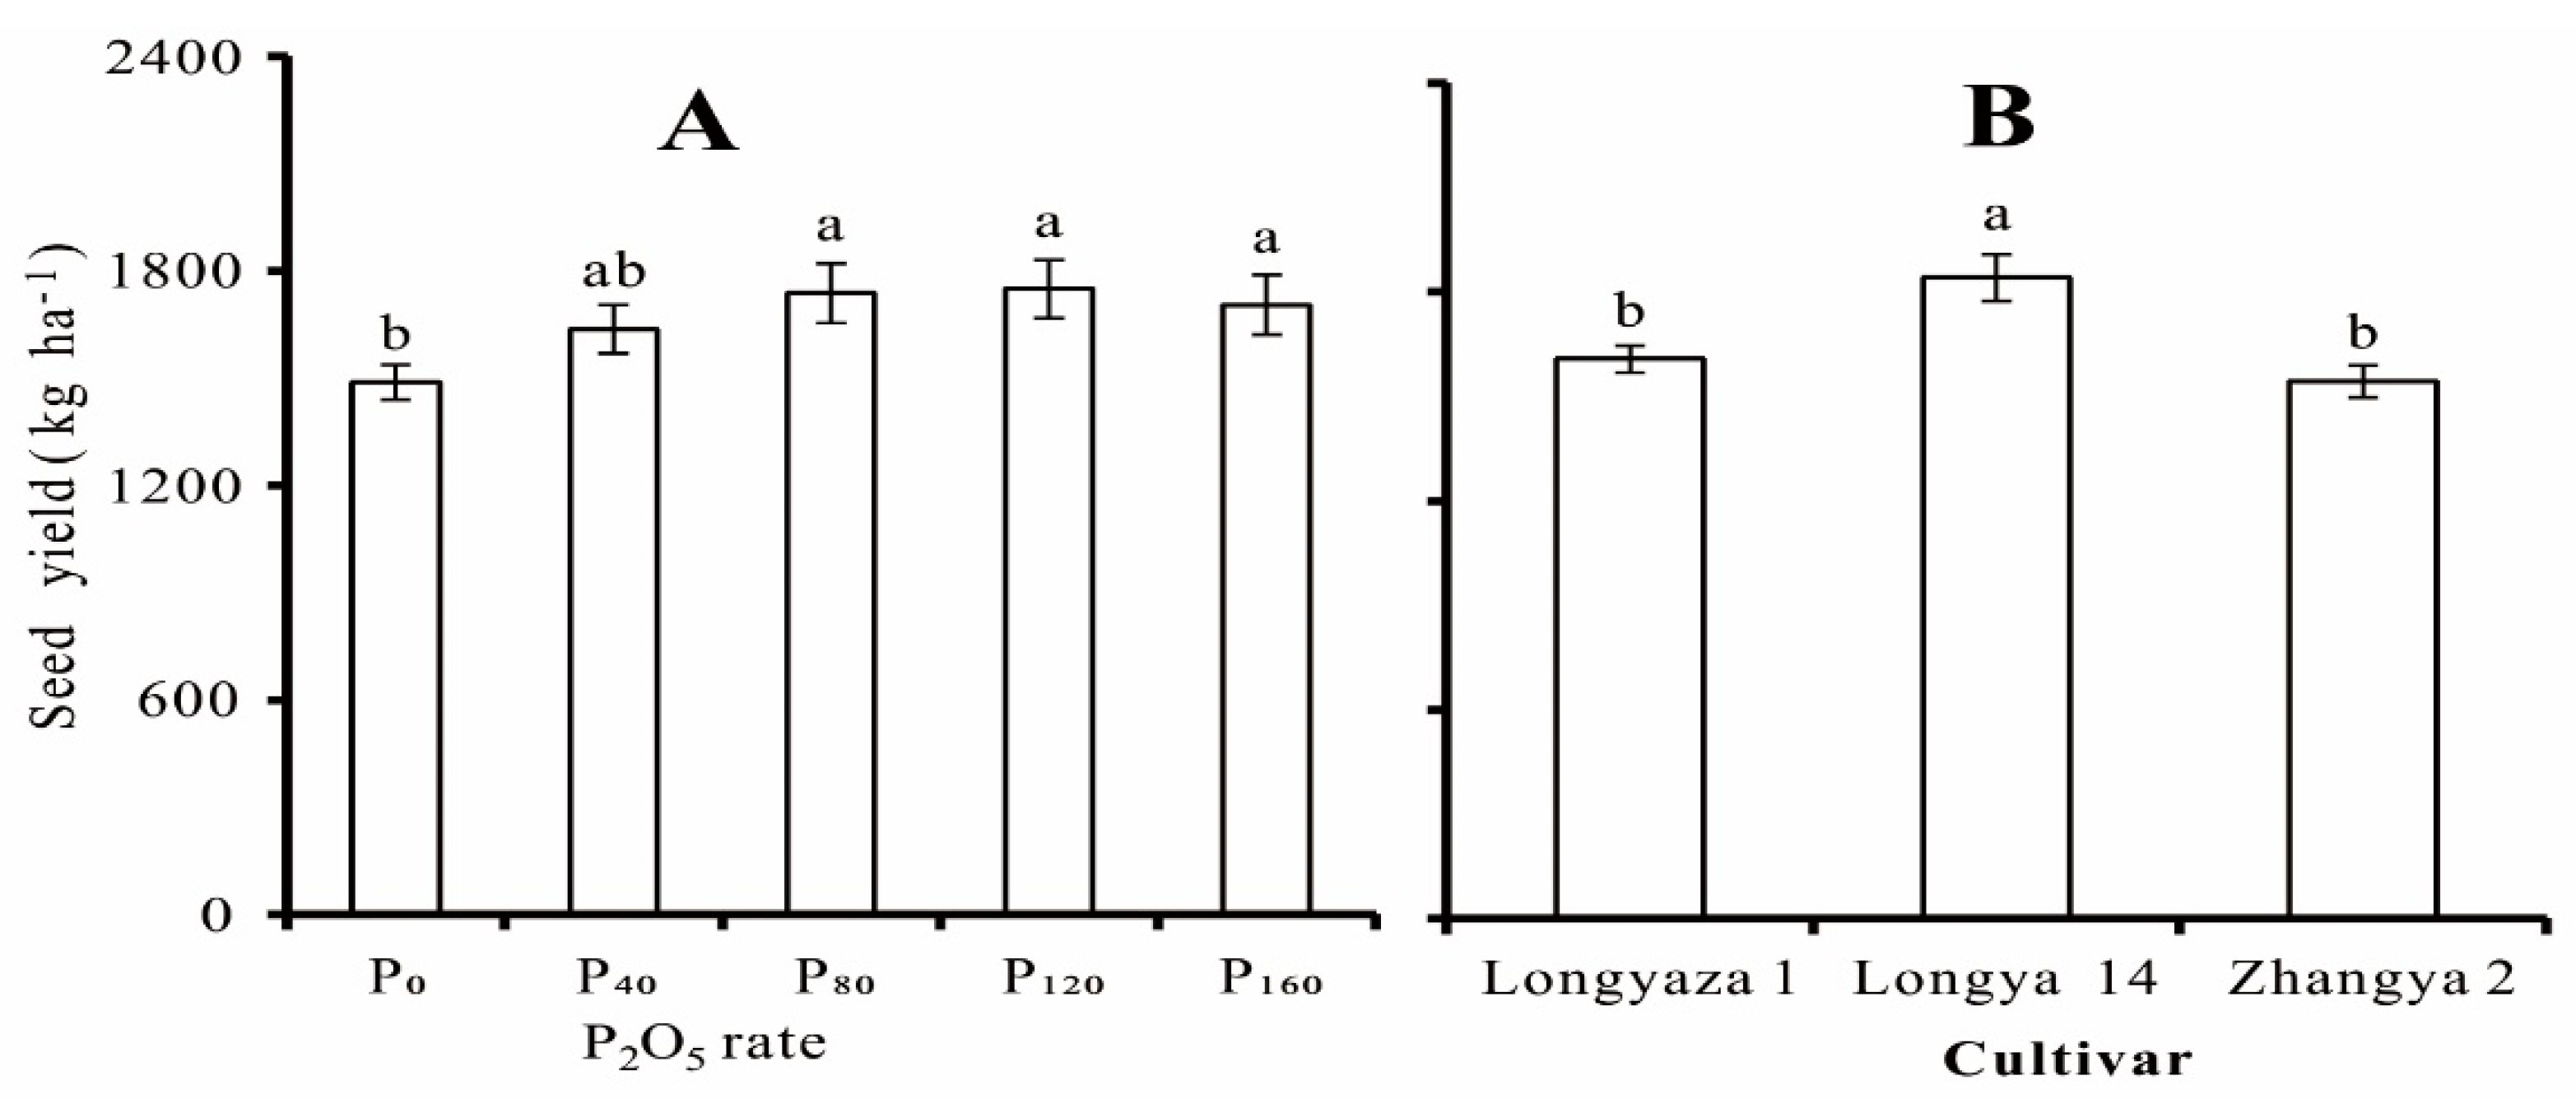
3.1. Seed Yield
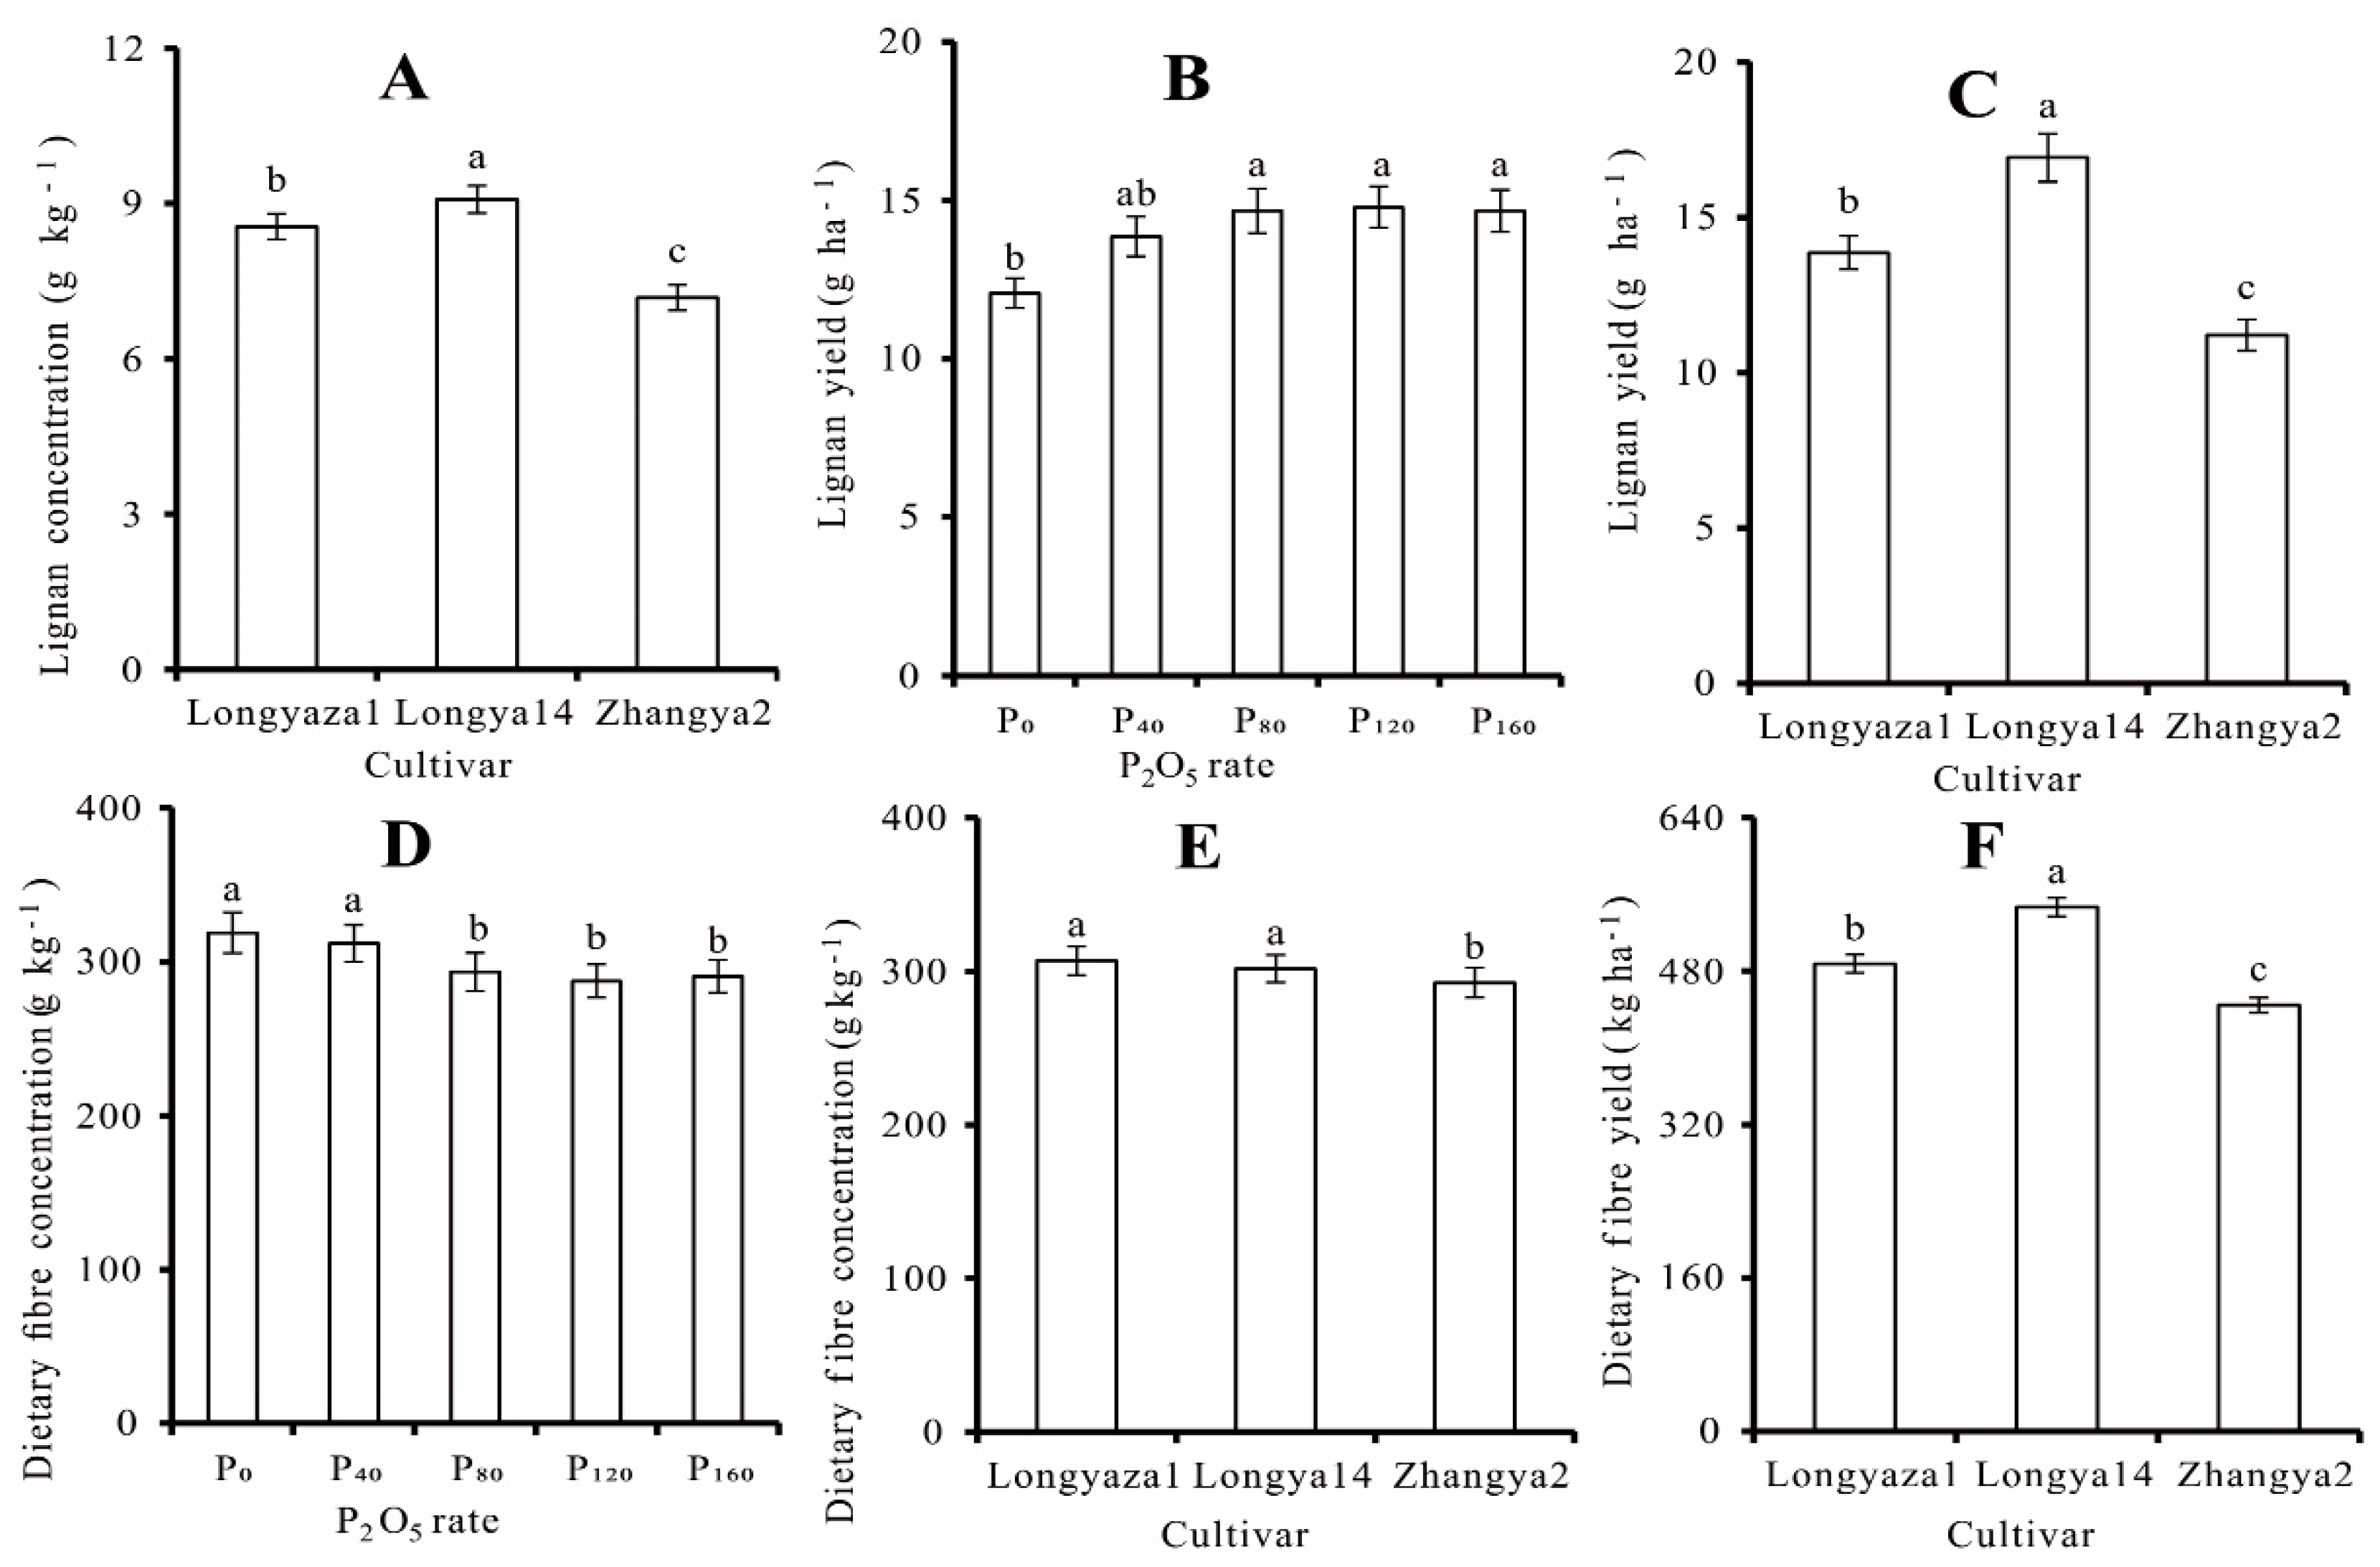
3.2. Lignan Concentration and Yield
3.3. Dietary Fiber Concentration and Yield
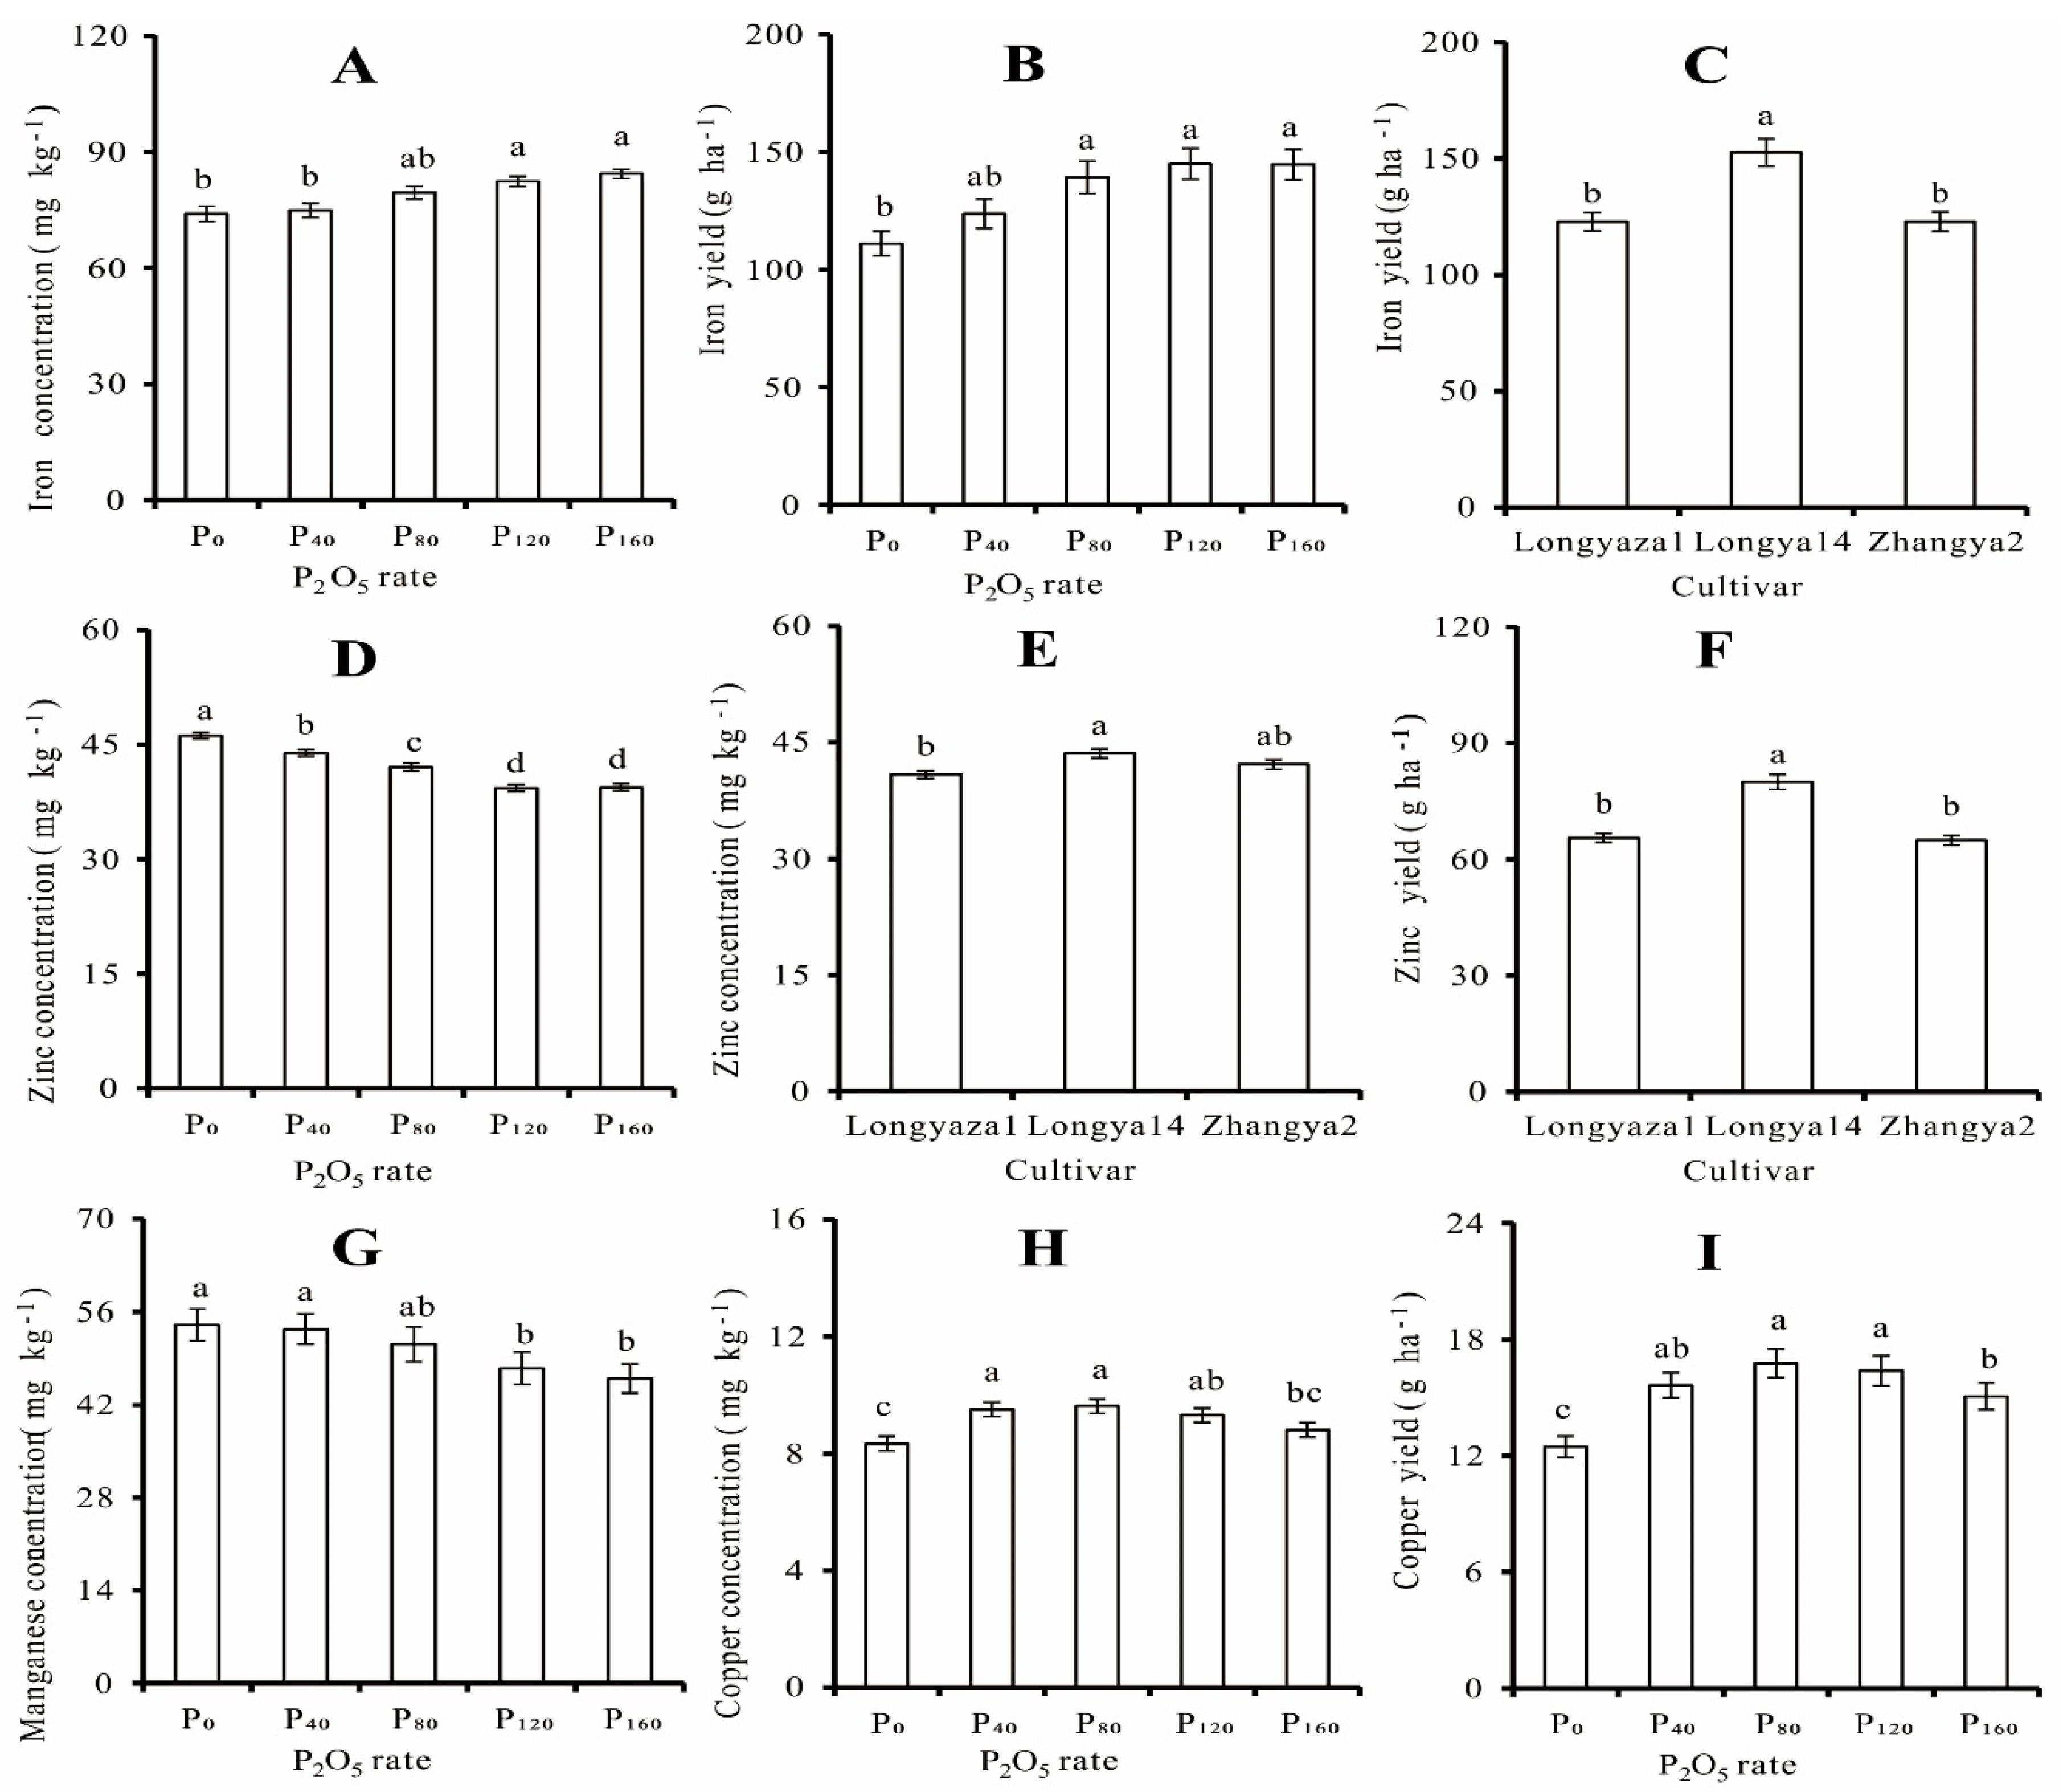
3.4. Iron Concentration and Yield
3.5. Zinc Concentration and Yield
3.6. Manganese Concentration and Yield
3.7. Copper Concentration and Yield
4. Discussion
4.1. The Effect of Years
4.2. Effects of the Phosphorus Rate
4.3. The Effect of Cultivar
5. Conclusions
Author Contributions
Funding
Data Availability Statement
Acknowledgments
Conflicts of Interest
References
- Mueed, A.; Shibli, S.; Jahangir, M.; Jabbar, S.; Deng, Z.Y. A comprehensive review of flaxseed (Linum usitatissimum L.): Health-affecting compounds, mechanism of toxicity, detoxification, anticancer and potential risk. Crit. Rev. Food Sci. Nutr. 2022. Published online: 14 July 2022. [Google Scholar] [CrossRef] [PubMed]
- Kaur, P.; Waghmare, R.; Kumar, V.; Rasane, P.; Kaur, S.; Gat, Y. Recent advances in utilization of flaxseed as potential source for value addition. Oilseeds Fats Crop. Lipids 2018, 25, A304. [Google Scholar] [CrossRef]
- Mueed, A.; Shibli, S.; Korma, S.A.; Madjirebaye, P.; Esatbeyoglu, T.; Deng, Z. Flaxseed Bioactive Compounds: Chemical Composition, Functional Properties, Food Applications and Health Benefits-Related Gut Microbes. Foods 2022, 11, 3307. [Google Scholar] [CrossRef]
- Parikh, M.; Maddaford, T.G.; Austria, J.A.; Aliani, M.; Netticadan, T.; Pierce, G.N. Dietary flaxseed as a strategy for improving human health. Nutrients 2019, 11, 1171. [Google Scholar] [CrossRef]
- Zheng, J.; Fan, J.L.; Zhang, F.C.; Yan, S.C.; Wu, Y.; Lu, J.S.; Guo, J.J.; Cheng, M.H.; Pei, Y.F. Through fall and stem flow heterogeneity under the maize canopy and its effect on soil water distribution at the row scale. Sci. Total Environ. 2019, 660, 1367–1382. [Google Scholar] [CrossRef] [PubMed]
- Dhaliwal, S.S.; Sharma, V.; Shukla, A.K.; Verma, V.; Kaur, M.; Shivay, Y.S.; Nisar, S.; Gaber, A.; Brestic, M.; Barek, V.; et al. Biofortification-A Frontier Novel Approach to Enrich Micronutrients in Field Crops to Encounter the Nutritional Security. Molecules 2022, 27, 1340. [Google Scholar] [CrossRef]
- Huang, S.; Wang, P.; Yamaji, N.; Ma, J.F. Plant nutrition for human nutrition: Hints from rice research and future perspectives. Mol. Plant 2020, 13, 825–835. [Google Scholar] [CrossRef]
- Esmail, A.O.; Yasin, H.S.; Mahmood, B.J. Effect of levels of phosphorus and iron on growth, yield and quality of flax. J. Agric. Vet. Sci. 2014, 7, 7–11. [Google Scholar] [CrossRef]
- Xie, Y.P.; Yan, Z.L.; Niu, Z.X.; Coulter, J.A.; Niu, J.Y.; Zhang, J.P.; Wang, B.; Yan, B.; Zhao, W.; Wang, L.M. Yield, oil content, and fatty acid profile of flax (Linum usitatissimum L.) as affected by phosphorus rate and seeding rate. Ind. Crop. Prod. 2020, 145, 112087. [Google Scholar] [CrossRef]
- Muhammad, H.; Ahmad, A.; Tahir, M. Response of different phosphorus levels and application methods on the growth yield and quality of linseed crop. Biol. Clin. Sci. Res. J. 2020, 2020, 19. [Google Scholar] [CrossRef]
- Yin, X.; Bellaloui, N.; Mcclure, A.M.; Tyler, D.D.; Mengistu, A. Phosphorus fertilization differentially influences fatty acids, protein, and oil in soybean. Am. J. Plant Sci. 2016, 7, 1975–1992. [Google Scholar] [CrossRef]
- Gao, Y.M.; Ma, B.L. Nitrogen, phosphorus, and zinc supply on seed and metal accumulation in canola grain. J. Plant Nutr. 2015, 38, 473–483. [Google Scholar] [CrossRef]
- Zhang, Y.Q.; Deng, Y.; Chen, R.Y.; Cui, Z.L.; Chen, X.P.; Yost, R.; Zhang, F.S.; Zou, C.Q. The reduction in zinc concentration of wheat grain upon increased phosphorus fertilization and its mitigation by foliar zinc application. Plant Soil. 2012, 361, 143–152. [Google Scholar] [CrossRef]
- Zhang, W.; Zhang, W.; Wang, X.; Liu, D.Y.; Zou, C.Q.; Chen, X.P. Quantitative evaluation of the grain zinc in cereal crops caused by phosphorus fertilization. A meta-analysis. Agron. Sustain. Dev. 2021, 41, 6. [Google Scholar] [CrossRef]
- Zhang, W.; Chen, X.; Liu, Y.; Liu, D.; Du, Y.; Chen, X.; Zou, C. The role of phosphorus supply in maximizing the leaf area, photosynthetic rate, coordinated to grain yield of summer maize. Field Crop. Res. 2018, 219, 113–119. [Google Scholar] [CrossRef]
- Grant, C.A.; Monreal, M.A.; Irvine, R.B.; Mohr, R.M.; McLaren, D.L.; Khakbazan, M. Preceding crop and phosphorus fertilization affect cadmium and zinc concentration of flaxseed under conventional and reduced tillage. Plant Soil. 2010, 333, 337–350. [Google Scholar] [CrossRef]
- Ryan, M.H.; McInerney, J.K.; Record, I.R.; Angus, J.F. Zinc bioavailability in wheat grain in relation to phosphorus fertiliser, crop sequence and mycorrhizal fungi. J. Sci. Food Agr. 2008, 88, 1208–1216. [Google Scholar] [CrossRef]
- Zhang, W.; Liu, D.Y.; Li, C.; Chen, X.P.; Zou, C.Q. Accumulation, partitioning, and bioavailability of micronutrients in summer maize as affected by phosphorus supply. Eur. J. Agron. 2017, 86, 48–59. [Google Scholar] [CrossRef]
- Zhang, W.; Zou, C.Q.; Chen, X.X.; Liu, Y.M.; Liu, D.Y.; Yang, H.Y.; Deng, Y.; Chen, X.P. Phosphorus Application Decreased Copper Concentration but Not Iron in Maize Grain. Agronomy 2020, 10, 1716. [Google Scholar] [CrossRef]
- FAO. World Reference Base For Soil Resources 2014. 2015. World Soil Resources Reports No. 106. Rome. Available online: http://www.fao.org (accessed on 3 September 2021).
- Lithourgidis, A.S.; Matsi, T.; Barbayiannis, N.; Dordas, C.A. Effect of liquid cattle manure on corn yield, composition, and soil properties. Agron. J. 2007, 99, 1041–1047. [Google Scholar] [CrossRef]
- Ozturk, L.; Eker, S.; Torun, B.; Cakmak, I. Variation in phosphorus efficiency among 73 bread and durum wheat genotypes grown in a phosphorus-deficient calcareous soil. Plant Soil. 2005, 269, 69–80. [Google Scholar] [CrossRef]
- Recena, R.; Fernández-Cabanás, V.M.; Delgado, A. Soil fertility assessment by Vis-NIR spectroscopy: Predicting soil functioning rather than availability indices. Geoderma 2019, 337, 368–374. [Google Scholar] [CrossRef]
- Andargie, M.; Vinas, M.; Rathgeb, A.; Möller, E.; Karlovsky, P. Lignans of Sesame (Sesamum indicum L.): A Comprehensive Review. Molecules 2021, 26, 883. [Google Scholar] [CrossRef]
- Stoughton-Ens, M.D.; Hatcher, D.W.; Wang, N.; Warkentin, T.D. Influence of genotype and environment on the dietary fiber content of field pea (Pisum sativum L.) grown in Canada. Food Res. Int. 2009, 43, 547–552. [Google Scholar] [CrossRef]
- Singh, S.K.; Barnaby, J.Y.; Reddy, V.R.; Sicher, R.C. Varying response of the concentration and yield of soybean seed mineral elements, carbohydrates, organic acids, amino acids, protein, and oil to phosphorus starvation and CO2 enrichment. Front. Plant Sci. 2016, 7, 1967–1980. [Google Scholar] [CrossRef] [PubMed]
- Zhao, Q.Y.; Xu, S.J.; Zhang, W.S.; Zhang, Z.; Yao, Z.; Chen, X.P.; Zou, C.Q. Identifying key drivers for geospatial variation of grain micronutrient concentrations in major maize production regions of China. Environ. Pollut. 2020, 266, 115114. [Google Scholar] [CrossRef]
- Zhang, M.Y.; Wang, W.J.; Bai, S.H.; Liu, S.; Chen, C.; Xu, Z.H.; Guo, X.M. Intensive management of phosphorus fertilization in Camellia oleifera Abel. to minimize phosphorus losses to the environment. Ind. Crop. Prod. 2021, 170, 113824. [Google Scholar] [CrossRef]
- Li, P.; Yu, J.; Feng, N.; Weng, J.; Rehman, A.; Huang, J.; Tu, S.; Niu, Q. Physiological and Transcriptomic Analyses Uncover the Reason for the Inhibition of Photosynthesis by Phosphate Deficiency in Cucumis melo L. Int. J. Mol. Sci. 2022, 23, 12073. [Google Scholar] [CrossRef]
- Dordas, C.A. Variation of physiological determinants of yield in linseed in response to nitrogen fertilization. Ind. Crop. Prod. 2010, 31, 455–465. [Google Scholar] [CrossRef]
- Mirzaie, A.; Mohammadi, K.; Parvini, S.; Khoramivafa, M.; Saeidi, M. Yield quantity and quality of two linseed (Linum usitatissimum L.) cultivars as affected by sowing date. Ind. Crop. Prod. 2020, 158, 112947. [Google Scholar] [CrossRef]
- Saastamoinen, M.; Pihlava, J.M.; Eurola, M.; Klemola, A.; Jauhiainen, L.; Hietaniemi, V. Yield, SDG lignan, cadmium, lead, oil and protein contents of linseed (Linum usitatissimum L.) cultivated in trials and at different farm conditions in the south-western part of Finland. Agr. Food Sci. 2013, 22, 296–306. [Google Scholar] [CrossRef]
- Zimmermann, R.; Bauermann, U.; Morales, F. Effects of growing site and nitrogen fertilization on biomass production and lignan content of linseed (Linum usitatissimum L.). J. Sci. Food Agr. 2006, 86, 415–419. [Google Scholar] [CrossRef]
- Zhang, J.P.; Xie, Y.P.; Miao, C.Q.; Wang, L.M.; Zhao, W.; Li, W.J.; Qi, Y.N.; Dang, Z. Secoisolariciresinol diglycoside (SDG) lignan content of oil flax: Genotypic and environmental variations and association with other traits. Oil. Crop. Sci. 2022, 7, 1–8. [Google Scholar] [CrossRef]
- Garros, L.; Drouet, S.; Corbin, C.; Decourtil, C.; Fidel, T.; Lebas de Lacour, J.; Leclerc, E.A.; Renouard, S.; Tungmunnithum, D.; Doussot, J.; et al. Insight into the Influence of Cultivar Type, Cultivation Year, and Site on the Lignans and Related Phenolic Profiles, and the Health-Promoting Antioxidant Potential of Flax (Linum usitatissimum L.) Seeds. Molecules 2018, 23, 2636. [Google Scholar] [CrossRef] [PubMed]
- Kim, S.U.; Oh, K.W.; Lee, M.H.; Lee, B.K.; Pae, S.B.; Hwang, C.D.; Kim, M.S.; Baek, I.Y.; Lee, J.D. Variation of lignan content for sesame seed across origin and growing environments. Korean J. Crop. Sci. 2014, 59, 151–161. [Google Scholar] [CrossRef]


| Year | Organic Matter | Alkali- Hydrolyzable Nitrogen | Available P a | Available Potassium | pH | DTPA -Fe | DTPA -Zn | DTPA -Mn | DTPA -Cu |
|---|---|---|---|---|---|---|---|---|---|
| g kg−1 | mg kg–1 | mg kg–1 | |||||||
| 2018 | 9.8 | 53.9 | 8.0 | 178.3 | 7.5 | 3.95 | 067 | 4.37 | 1.50 |
| 2019 | 7.6 | 48.2 | 8.7 | 141.6 | 8.2 | 3.12 | 0.54 | 4.01 | 1.20 |
| Dependent Variable | Y a | P | C | Y × P | Y × C | P × C | Y × P × C |
|---|---|---|---|---|---|---|---|
| F-value | |||||||
| Seed yield | 51.21 * | 24.58 ** | 23.51 * | 1.40 | 5.19 * | 2.72 | 1.36 |
| Lignan concentration | 284.19 ** | 1.28 | 150.28 ** | 1.64 | 0.86 | 0.70 | 0.39 |
| Lignan yield | 52.21 * | 10.11 * | 18.70 * | 1.98 | 11.13 ** | 1.74 | 1.17 |
| Dietary fiber concentration | 1040.64 * | 9.66 * | 28.27 * | 1.61 | 0.24 | 0.87 | 2.54 * |
| Dietary fiber yield | 133.71 * | 3.18 | 175.57 ** | 1.64 | 0.61 | 2.98 | 0.94 |
| Iron concentration | 36.31 * | 11.53 * | 4.74 | 1.52 | 2.78 | 1.11 | 3.88 ** |
| Iron yield | 42.18 * | 167.46 ** | 8.79 * | 0.14 | 5.91 * | 0.68 | 4.92 ** |
| Zinc concentration | 1.34 | 13.28 * | 22.39 * | 2.76 | 0.59 | 0.73 | 3.98 ** |
| Zinc yield | 44.70 * | 2.16 | 30.69 * | 1.41 | 2.01 | 1.22 | 3.30 ** |
| Manganese concentration | 62.17 * | 15.04 * | 2.59 | 0.27 | 3.50 | 1.06 | 8.34 ** |
| Manganese yield | 44.03 * | 2.75 | 0.31 | 0.60 | 7.27 * | 1.52 | 5.83 ** |
| Copper concentration | 13.91 * | 63.53 ** | 1.79 | 0.36 | 12.99 ** | 3.13 | 0.48 |
| Copper yield | 44.93 * | 34.59 ** | 3.02 | 2.01 | 13.67 ** | 5.39 * | 0.42 |
| Treatments | Lignan Concentration | Lignan Yield | Dietary Fiber Concentration | Dietary Fiber Yield | ||||
|---|---|---|---|---|---|---|---|---|
| 2018 | 2019 | 2018 | 2019 | 2018 | 2019 | 2018 | 2019 | |
| g kg−1 | g ha−1 | g kg−1 | kg ha−1 | |||||
| P0 | 9.01 | 7.01 | 14.45 b | 9.69 b | 265.3 a | 372.4 a | 425.09 | 512.97 |
| P40 | 9.15 | 7.09 | 16.75 b | 10.95 b | 264.9 ab | 359.1 a | 458.80 | 545.34 |
| P80 | 9.40 | 7.18 | 18.03 a | 11.29 a | 244.0 c | 343.0 b | 464.57 | 546.61 |
| P120 | 9.46 | 7.46 | 17.52 a | 12.04 a | 244.2 c | 330.9 b | 465.46 | 529.16 |
| P160 | 9.48 | 7.49 | 17.65 a | 11.68 a | 247.9 bc | 333.2 b | 465.77 | 515.03 |
| Lonyaza 1 | 9.54 b † | 7.58 a | 16.38 b | 11.36 b | 260.4 a | 341.5 | 446.42 b | 528.79 b |
| Longya 14 | 10.20 a | 7.96 a | 20.56 a | 13.29 a | 255.4 ab | 348.2 | 512.84 a | 580.11 a |
| Zhangya 2 | 8.16 c | 6.20 b | 13.69 c | 8.74 c | 243.9 b | 353.5 | 408.55 c | 480.57 c |
| Treatment | Dietary Fiber c a | Iron (Fe) c | Fe Yield | Zinc (Zn) c | Zn Yield | Manganese (Mn) c | Mn Yield |
|---|---|---|---|---|---|---|---|
| Longyaza 1-2018-P0 | 274.10 ef† | 78.93 defg | 126.43 efg | 44.51 bcd | 71.31 def | 66.27 a | 56.15 g |
| Longyaza 1-2018-P40 | 277.87 e | 79.50 cdef | 135.79 def | 43.24 cdef | 73.85 de | 60.23 abcd | 57.40 g |
| Longyaza 1-2018-P80 | 249.37 efg | 80.27 cdef | 140.61 cde | 40.03 fghi | 70.10 defg | 62.44 abc | 57.55 g |
| Longyaza 1-2018-P120 | 253.03 efg | 82.80 bcde | 147.37 cd | 39.40 hijk | 70.07 defg | 50.90 fghi | 58.62 g |
| Longyaza 1-2018-P160 | 247.60 efg | 84.47 abcd | 146.99 cd | 40.32 fghi | 70.16 defg | 58.69 bcde | 60.53 g |
| Longya 14-2018-P0 | 270.60 ef | 86.63 abc | 145.60 cd | 46.38 abc | 77.92 cd | 56.39 cdef | 62.44 g |
| Longya 14-2018-P40 | 261.67 efg | 86.56 abc | 168.39 b | 46.08 abc | 89.70 ab | 62.46 abc | 64.23 g |
| Longya 14-2018-P80 | 236.40 g | 88.70 ab | 192.70 a | 44.23 bcde | 96.15 a | 60.88 abcd | 64.68 g |
| Longya 14-2018-P120 | 246.50 gf | 91.00 a | 197.55 a | 42.73 defg | 92.75 ab | 55.20 defg | 65.14 g |
| Longya 14-2018-P160 | 261.87 efg | 91.61 a | 192.42 a | 40.46 fghi | 84.92 bc | 56.27 cdef | 67.26 g |
| Zhangya 2-2018-P0 | 251.17 efg | 77.67 efgh | 117.90 fghi | 46.25 abc | 70.21 defg | 65.25 ab | 67.36 g |
| Zhangya 2-2018-P40 | 255.10 efg | 76.86 fghi | 124.62 efgh | 44.16 bcde | 71.60 def | 64.56 ab | 67.76 g |
| Zhangya 2-2018-P80 | 246.13 gf | 86.52 l | 149.77 bcd | 40.60 fghi | 70.29 defg | 58.66 bcde | 68.50 g |
| Zhangya 2-2018-P120 | 233.07 g | 86.14 abcd | 151.55 bcd | 39.56 ghijk | 69.61 defg | 62.69 abc | 69.66 g |
| Zhangya 2-2018-P160 | 234.13 g | 88.50 ab | 155.85 bc | 40.65 fghi | 71.59 def | 53.02 efgh | 70.79 g |
| Longyaza 1-2019-P0 | 380.00 a | 62.59 l | 85.56 m | 44.15 bcde | 60.53 ghi | 49.21 ghij | 90.60 f |
| Longyaza 1-2019-P40 | 375.67 ab | 62.63 l | 91.70 klm | 41.07 efgh | 60.19 ghi | 44.12 ijkl | 93.37 f |
| Longyaza 1-2019-P80 | 350.33 abcd | 68.62 jkl | 107.40 hijk | 40.30 fghi | 63.04 fgh | 43.46 jklm | 94.70 ef |
| Longyaza 1-2019-P120 | 328.33 d | 78.37 efg | 122.52 efgh | 38.33 ijk | 59.89 ghi | 36.65 mno | 99.03 ef |
| Longyaza 1-2019-P160 | 333.00 cd | 81.90 bcde | 125.55 efgh | 37.01 k | 56.71 hi | 39.50 lmno | 101.64 ef |
| Longya 14-2019-P0 | 363.33 abc | 70.29 hijk | 101.45 jklm | 48.44 a | 69.91 defg | 38.88 lmno | 102.10 ef |
| Longya 14-2019-P40 | 355.67 abcd | 73.92 ghijk | 124.72 efgh | 44.49 bcd | 75.05 cde | 41.27 klmn | 102.84 def |
| Longya 14-2019-P80 | 349.00 bcd | 76.03 fghi | 132.76 def | 42.69 defg | 77.88 cd | 32.97 o | 104.60 cdef |
| Longya 14-2019-P120 | 334.33 cd | 76.30 fghi | 133.22 def | 37.69 jk | 65.86 efgh | 35.77 no | 106.21 bcdef |
| Longya 14-2019-P160 | 338.67 cd | 80.14 cdef | 137.74 cde | 40.62 fghi | 69.86 defg | 34.08 o | 109.36 bcde |
| Zhangya 2-2019-P0 | 374.00 ab | 68.39 kl | 90.26 lm | 47.34 ab | 62.47 fgh | 48.63 ghij | 110.34 bcde |
| Zhangya 2-2019-P40 | 346.00 bcd | 70.08 ijk | 98.09 jklm | 44.51 bcd | 62.31 ghi | 48.05 hijk | 118.13 abcd |
| Zhangya 2-2019-P80 | 329.67 d | 77.19 efgh | 113.03 ghij | 44.57 bcd | 62.49 fgh | 48.48 ghij | 119.79 abc |
| Zhangya 2-2019-P120 | 330.00 d | 80.11 cdef | 118.77 fghi | 38.23 ijk | 56.72 hi | 43.96 ijkl | 121.60 ab |
| Zhangya 2-2019-P160 | 328.00 d | 80.08 cdef | 110.36 ghij | 37.55 jk | 51.79 i | 49.57 ghij | 132.40 a |
| Treatments | Fe a Concentration | Fe Yield | Zn Concentration | Zn Yield | ||||
|---|---|---|---|---|---|---|---|---|
| 2018 | 2019 | 2018 | 2019 | 2018 | 2019 | 2018 | 2019 | |
| mg kg−1 | g ha−1 | mg kg−1 | g ha−1 | |||||
| P0 | 81.08 b † | 67.09 d | 129.98 b | 92.42 c | 45.71 a | 46.64 a | 73.14 b | 59.45 b |
| P40 | 80.97 b | 68.88 cd | 142.93 ab | 104.84 bc | 44.49 a | 43.36 b | 75.56 b | 60.83 b |
| P80 | 85.16 ab | 73.95 bc | 161.03 a | 117.73 ab | 41.62 b | 42.52 b | 77.48 a | 64.30 ab |
| P120 | 86.64 a | 78.26 ab | 165.49 a | 124.83 a | 40.56 b | 38.08 c | 78.38 a | 65.85 ab |
| P160 | 88.19 a | 80.71 a | 165.08 a | 124.55 a | 40.48 b | 38.39 c | 78.85 a | 67.80 a |
| Longyaza 1 | 81.19 b | 70.87 | 139.44 b | 106.55 b | 41.50 b | 40.17 | 71.10 b | 60.07 b |
| Longya 14 | 88.90 a | 75.17 | 179.33 a | 125.98 a | 43.98 a | 43.16 | 88.29 a | 71.71 a |
| Zhangya 2 | 83.14 b | 75.34 | 139.94 b | 106.10 b | 42.24 ab | 42.07 | 70.66 b | 59.16 b |
| Treatments | Mn a Concentration | Mn Yield | Cu Concentration | Cu Yield | ||||
|---|---|---|---|---|---|---|---|---|
| 2018 | 2019 | 2018 | 2019 | 2018 | 2019 | 2018 | 2019 | |
| mg kg−1 | g ha−1 | mg kg−1 | g ha−1 | |||||
| P0 | 62.64 a† | 45.57 a | 99.98 | 62.58 | 9.01 b | 7.68 b | 14.39 b | 10.57 b |
| P40 | 62.42 a | 44.48 a | 104.53 | 67.20 | 10.20 a | 8.83 a | 17.89 a | 13.41 a |
| P80 | 60.66 ab | 41.64 b | 106.91 | 65.37 | 10.35 a | 8.90 a | 19.43 a | 14.16 a |
| P120 | 56.26 b | 38.79 b | 109.68 | 61.66 | 9.87 ab | 8.78 a | 18.77 a | 14.05 a |
| P160 | 50.99 b | 41.05 b | 114.47 | 62.55 | 9.50 ab | 8.13 ab | 17.65 a | 12.52 ab |
| Longyaza 1 | 59.71 | 42.59 b | 102.22 b | 63.55 ab | 9.96 a | 9.16 a | 17.12 | 13.76 a |
| Longya 14 | 58.24 | 36.59 c | 117.32 a | 60.88 a | 9.29 b | 8.14 b | 18.78 | 13.65 a |
| Zhangya 2 | 60.84 | 47.74 a | 101.80 b | 67.18 a | 10.11 a | 8.09 b | 16.99 | 11.42 b |
| Treatment | Seed Yield | Lignan Yield | Iron Yield | Manganese Yield | Copper Concentration | Copper Yield |
|---|---|---|---|---|---|---|
| Lonyaza 1-2018 | 1409.33 c† | 16.38 b | 139.44 b | 102.22 b | 9.96 ab | 17.12 a |
| Lonyaza 1-2019 | 1499.33 c | 20.56 a | 179.33 a | 117.32 a | 9.29 ab | 18.78 a |
| Longya 14-2018 | 1668.67 b | 13.69 c | 139.94 b | 101.80 b | 10.11 a | 16.99 a |
| Longya 14-2019 | 1678.03 b | 11.36 d | 106.55 c | 63.55 c | 9.16 b | 13.76 b |
| Zhangya 2-2018 | 1716.37 b | 13.29 c | 125.98 b | 60.88 c | 8.14 c | 13.65 b |
| Zhangya 2-2019 | 2014.16 a | 8.74 e | 106.10 c | 67.18 c | 8.09 c | 11.42 c |
Publisher’s Note: MDPI stays neutral with regard to jurisdictional claims in published maps and institutional affiliations. |
© 2022 by the authors. Licensee MDPI, Basel, Switzerland. This article is an open access article distributed under the terms and conditions of the Creative Commons Attribution (CC BY) license (https://creativecommons.org/licenses/by/4.0/).
Share and Cite
Xie, Y.; Li, Y.; Qi, Y.; Wang, L.; Zhao, W.; Li, W.; Dang, Z.; Zhang, J.; Wang, X.; Zhang, Y.; et al. Effects of Phosphorus Supply on Seed Yield and Quality in Flax. Agronomy 2022, 12, 3225. https://doi.org/10.3390/agronomy12123225
Xie Y, Li Y, Qi Y, Wang L, Zhao W, Li W, Dang Z, Zhang J, Wang X, Zhang Y, et al. Effects of Phosphorus Supply on Seed Yield and Quality in Flax. Agronomy. 2022; 12(12):3225. https://doi.org/10.3390/agronomy12123225
Chicago/Turabian StyleXie, Yaping, Yang Li, Yanni Qi, Limin Wang, Wei Zhao, Wenjuan Li, Zhao Dang, Jianping Zhang, Xingzhen Wang, Yanjun Zhang, and et al. 2022. "Effects of Phosphorus Supply on Seed Yield and Quality in Flax" Agronomy 12, no. 12: 3225. https://doi.org/10.3390/agronomy12123225
APA StyleXie, Y., Li, Y., Qi, Y., Wang, L., Zhao, W., Li, W., Dang, Z., Zhang, J., Wang, X., Zhang, Y., Wang, X., Cui, Z., Shi, L., & Lv, Z. (2022). Effects of Phosphorus Supply on Seed Yield and Quality in Flax. Agronomy, 12(12), 3225. https://doi.org/10.3390/agronomy12123225