Article

Litchi Detection in a Complex Natural Environment Using the YOLOv5-Litchi Model

1
College of Electronic Engineering (College of Artificial Intelligence), South China Agricultural University, Guangzhou 510642, China
2
Guangdong Laboratory for Lingnan Modern Agriculture, Guangzhou 510640, China
3
Guangdong Engineering Research Center for Monitoring Agricultural Information, Guangzhou 510642, China
4
College of Engineering, South China Agricultural University, Guangzhou 510642, China
*
Author to whom correspondence should be addressed.
Agronomy 2022, 12(12), 3054; https://doi.org/10.3390/agronomy12123054
Submission received: 9 November 2022 / Revised: 29 November 2022 / Accepted: 1 December 2022 / Published: 2 December 2022
(This article belongs to the Special Issue Precision Operation Technology and Intelligent Equipment in Farmland)

Abstract

:
Detecting litchis in a complex natural environment is important for yield estimation and provides reliable support to litchi-picking robots. This paper proposes an improved litchi detection model named YOLOv5-litchi for litchi detection in complex natural environments. First, we add a convolutional block attention module to each C3 module in the backbone of the network to enhance the ability of the network to extract important feature information. Second, we add a small-object detection layer to enable the model to locate smaller targets and enhance the detection performance of small targets. Third, the Mosaic-9 data augmentation in the network increases the diversity of datasets. Then, we accelerate the regression convergence process of the prediction box by replacing the target detection regression loss function with CIoU. Finally, we add weighted-boxes fusion to bring the prediction boxes closer to the target and reduce the missed detection. An experiment is carried out to verify the effectiveness of the improvement. The results of the study show that the mAP and recall of the YOLOv5-litchi model were improved by 12.9% and 15%, respectively, in comparison with those of the unimproved YOLOv5 network. The inference speed of the YOLOv5-litchi model to detect each picture is 25 ms, which is much better than that of Faster-RCNN and YOLOv4. Compared with the unimproved YOLOv5 network, the mAP of the YOLOv5-litchi model increased by 17.4% in the large visual scenes. The performance of the YOLOv5-litchi model for litchi detection is the best in five models. Therefore, YOLOv5-litchi achieved a good balance between speed, model size, and accuracy, which can meet the needs of litchi detection in agriculture and provides technical support for the yield estimation and litchi-picking robots.

1. Introduction

China is an important litchi-growing region. The annual production of litchi in China can reach more than 2 million tons, accounting for over half of the world’s total production [1,2]. Calculated according to the area of the Chinese National Litchi and Longan Industrial Technology System, the litchi planting area in China has already reached 500,000 hm2, accounting for about 70% of the world’s total [3]. In recent years, the planting area of litchi trees has been increasing constantly, and most of the yield reaches the market at the same time, leading to the litchi market supply exceeding the demand [4]. Yield estimation of litchis can help farmers to prepare well, such as by contacting buyers in a timely manner or preparing enough storage space to reduce losses [5,6,7].
The traditional method of estimating fruit tree yield relies on roughly counting the number of fruits under the tree manually and multiplying this by the average weight of the fruits, but this method requires a high level of experience, and is labor intensive and low in efficiency [8,9,10]. With improved computer performance, deep learning technology has developed rapidly and is now being applied in agriculture, for example, to identify pests and disease, classify crops, automatically pick the yield, and estimate the yield [11,12,13,14]. Currently, the key to yield estimation for fruit trees is the rapid and accurate detection of fruits on the tree [15,16].
Fu et al. [17], by adding two 3 × 3 and 1 × 1 convolutional kernels to the fifth and sixth convolutional layers of YOLOv3-tiny, proposed a DY3TNet network to quickly and accurately detect kiwifruit under all-day field conditions. Sozzi et al. [18] proposed a convolutional neural network recognition algorithm for real-time bunch detection and counting in grapes using the YOLOv5 network. The accuracy of the graph was about 80%. Peng et al. [19] improved the SSD algorithm by replacing VGG16 with ResNet-101 to accurately recognize a variety of fruits, and the recognition accuracy of four fruits in the test set reached 90%. Tian et al. [20] used DenseNet to improve the YOLOv3 algorithm, and as per the test results, the improved model was able to recognize trees at different periods of apple development. Gao et al. [21] proposed a multiclass apple detection method based on fast regional convolutional neural networks. Dorj et al. [22] used image processing techniques to detect and count citrus fruits on trees. Bargoti et al. [23] used multiscale multilayered perceptrons (MLPs) and convolutional neural networks (CNNs) to detect and count fruits using image data. Zhou et al. [24] proposed an SSD network with two backbones, MobileNetV2 and InceptionV3. Because of the lightweight backbone, they developed an Android APP for smartphones to detect kiwifruit and estimate their yield. Apolo-Apolo et al. [25] used the Faster-RCNN model to train a citrus dataset that was captured from an unmanned aerial vehicle (UAV)e. The error between actual and estimated yields for each citrus tree was about 1 kg. Mekhalfi et al. [26] used an optical sensor to design a system for kiwifruit yield estimation based on computer vision. Yang et al. [27] added the convolutional block attention module (CBAM) to YOLOv4, which can be used to detect wheat and calculate the amount. Youssef et al. [28] proposed a yield estimation module that combines YOLO with DeepSORT and uses a video to detect and track fruits.
Numerous studies have been carried out on the target detection of fruit, including targets blocked by leaves or other fruits. However, the mainstream research objects are fruits such as kiwifruit, oranges, and mangoes, where the target size is large and there is a low level of obscuration. Few scholars have studied fruits of the Sapindaceae family, such as litchi and longan, because of their small target size and severe obscuration. To detect litchis in a complex background, Peng et al. [29] proposed a novel network model called YOLOv3-Litchi that uses the feature pyramid to retain the shallow features of litchis and cuts down the model size, but the YOLOv3-Litchi model is suitable only for small fields of view and cannot be used for yield estimation. Wu et al. [30] proposed a litchi detection algorithm based on the YOLOv4 network, using the K--means++ algorithm to select the appropriate size for litchis, and changed the feature map to account for the small and dense litchi targets, but the improved algorithm still missed detection in large scenes. Wang et al. [31] improved YOLOv3 by changing the prediction scale and cutting down the network layer. Though this provided a better network for litchi detection, the mAP of the improved network was only 77.46% and the model size was 76.9 Mb, making it too large to deploy on a smartphone or a Raspberry Pi. Peng et al. [32] improved the SSD model by adding the efficient spatial pyramid block module and the IPANet feature fusion module to it. The proposed MFEFF-SSD model for detecting litchi pictures from UAV obtained an average accuracy rate of 55.79%, which is substantially better than that of the original SSD, but the missed and false detection rates were high and farmers may find it difficult and demanding to use UAV to collect data for yield estimation.
In the algorithms proposed in the above studies, there is still space for improving the detection accuracy. The accuracy of litchi detection directly affects the error in yield estimation and the accuracy of automatic picking. More importantly, most studies were based on small fields of view, not suitable for large scenes, with which it is difficult to meet the needs of yield estimation. For the above situation, we proposed a YOLOv5-litchi network for litchi detection in complex natural environments. In this paper, we report our methods for providing technical support for litchi yield prediction and to help litchi-picking robots, as follows: (1) We added CBAM to each C3 module in the backbone of the network to enhance the ability of the network to extract important feature information. (2) We added a small-object detection layer to enable the model to adapt to smaller targets and enhance its ability to detect small targets. (3) The Mosaic-9 data augmentation used in the network increased the diversity of datasets and the background. (4) By replacing the target detection regression loss function with CIoU, we accelerated the regression convergence process of the prediction box. (5) Weighted-boxes fusion was added to bring the prediction boxes closer to the target and reduce the missed detection. Compared with the existing detection algorithms, the YOLOv5-litchi model proposed in this study is a better detection algorithm, which means a higher detection accuracy, lower false and missed detection rates, and stronger robustness. It is conducive for litchi detection in different complex environments, and helps in better litchi yield estimation and automatic picking.

2. Materials and Methods

2.1. Materials

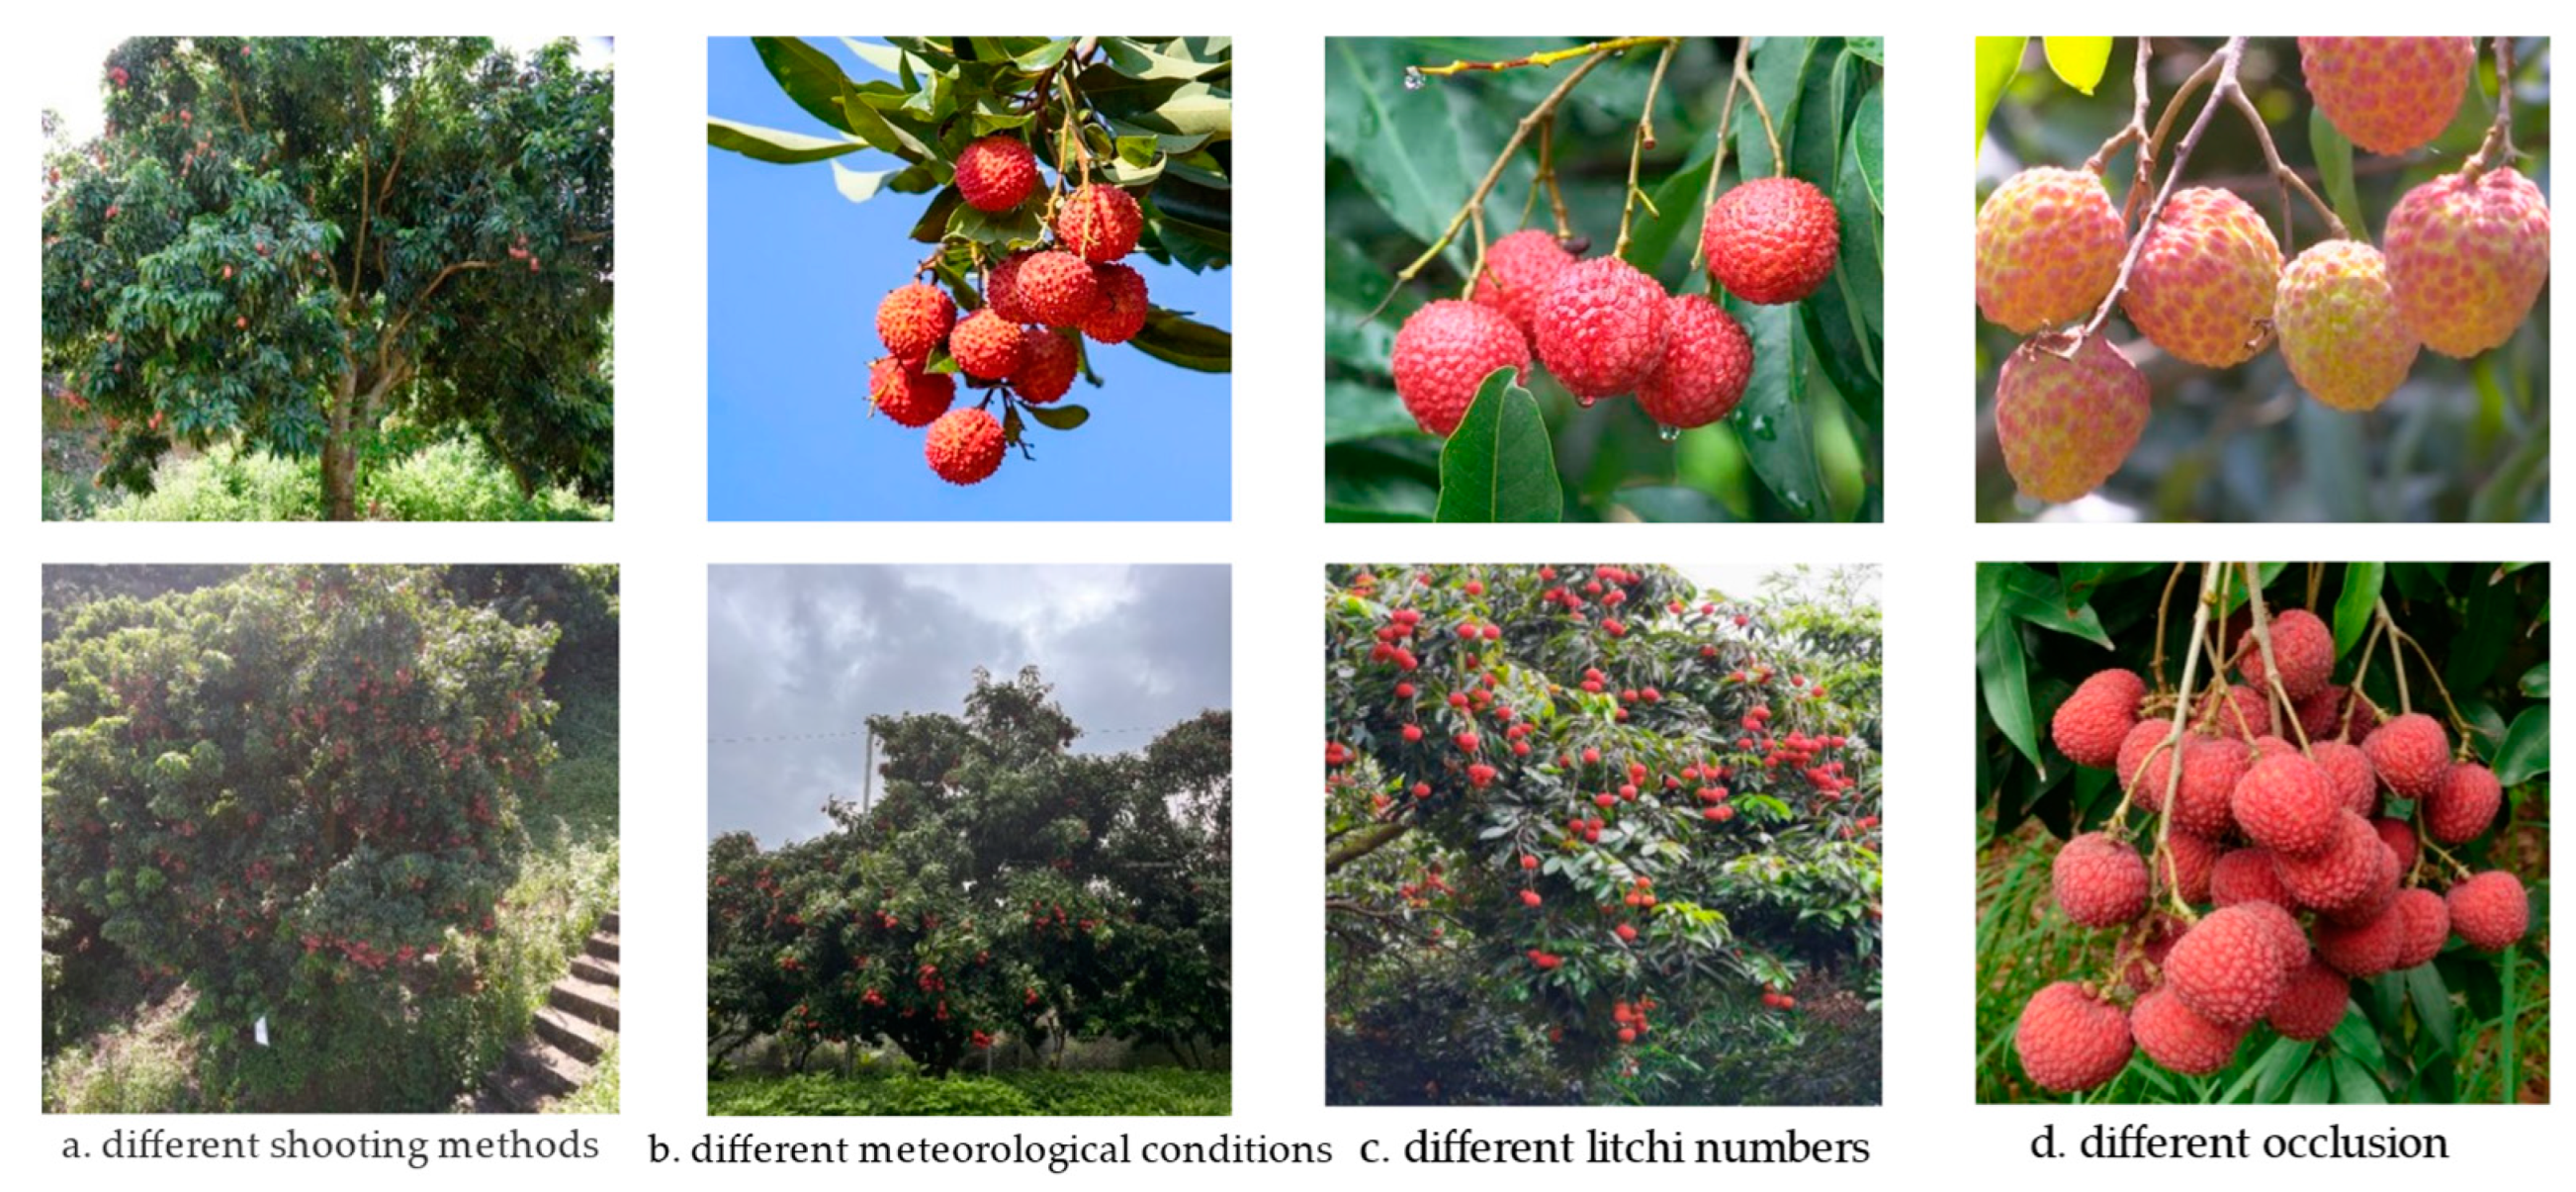
2.1.1. Data Collection

The dataset in this study can be divided into three parts. The first part consists of photos collected from one litchi orchard in the State Key Laboratory of South China Agricultural University, Guangdong Province, in July 2021, and the category was Nuomici. The second part consists of images collected in June 2022 from Matouling farm and Surijin litchi orchard, Maoming, Guangdong Province. The variety was GuiWei. The shooting equipment included a Nikon D3400 SLR camera, an iPhone 13 smartphone, and a DJI Mavic Air 2 UAV. The third part consists of litchi images downloaded from the Internet search engine, which were used to expand the diversity of the dataset. A total of 1200 litchi images met the needs of this paper. The dataset covers various occasions of litchis under natural environment and different kinds of weather conditions, such as sunny, cloudy, and rainy, and natural light and backlight conditions. The images are of single litchis, multiple litchis, and even whole litchi trees. Figure 1 presents the composition of the dataset.

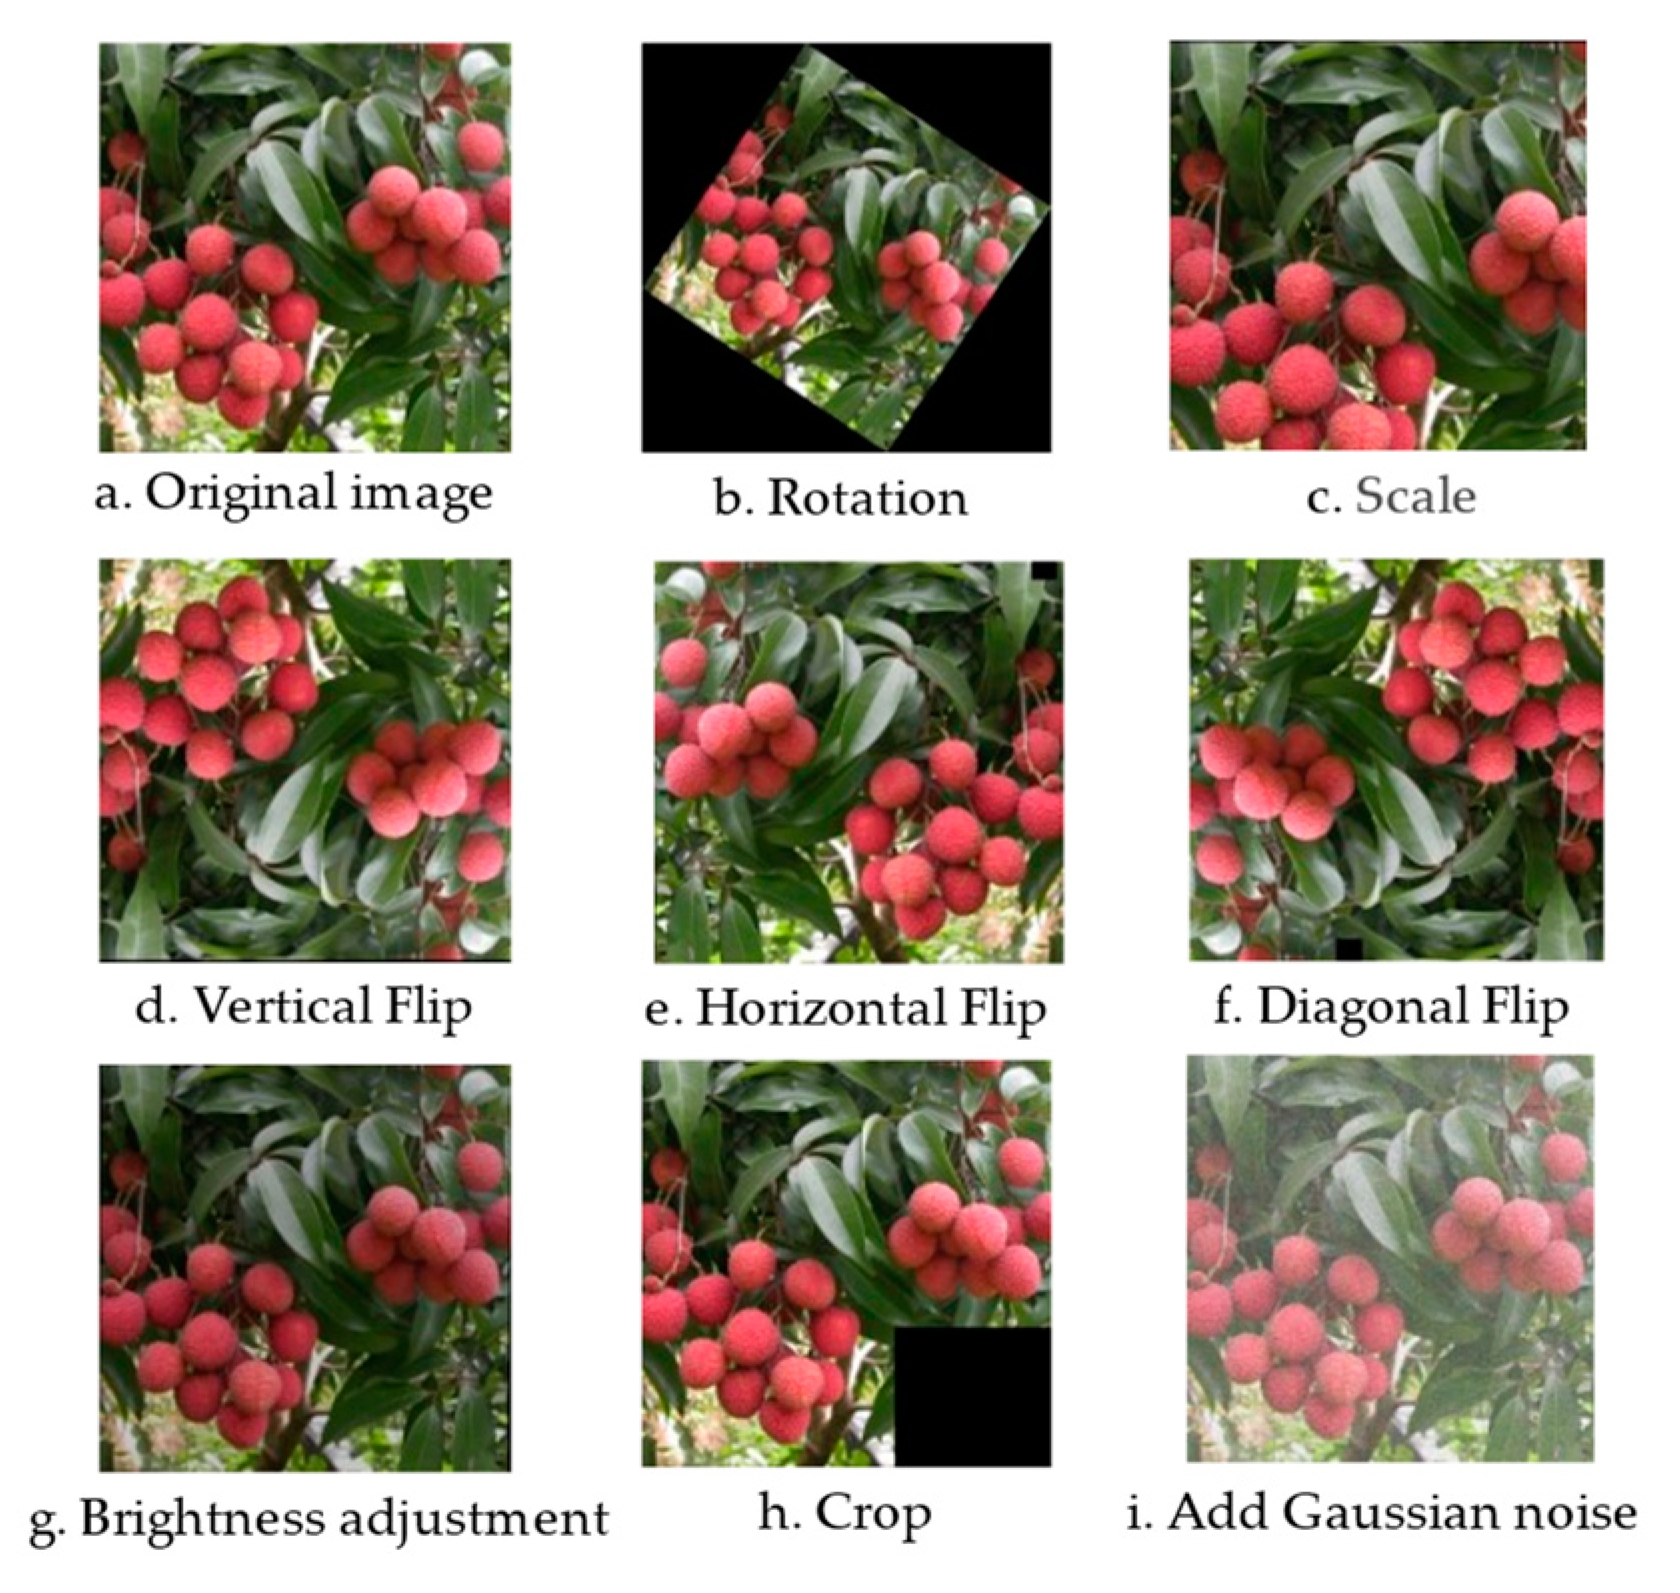
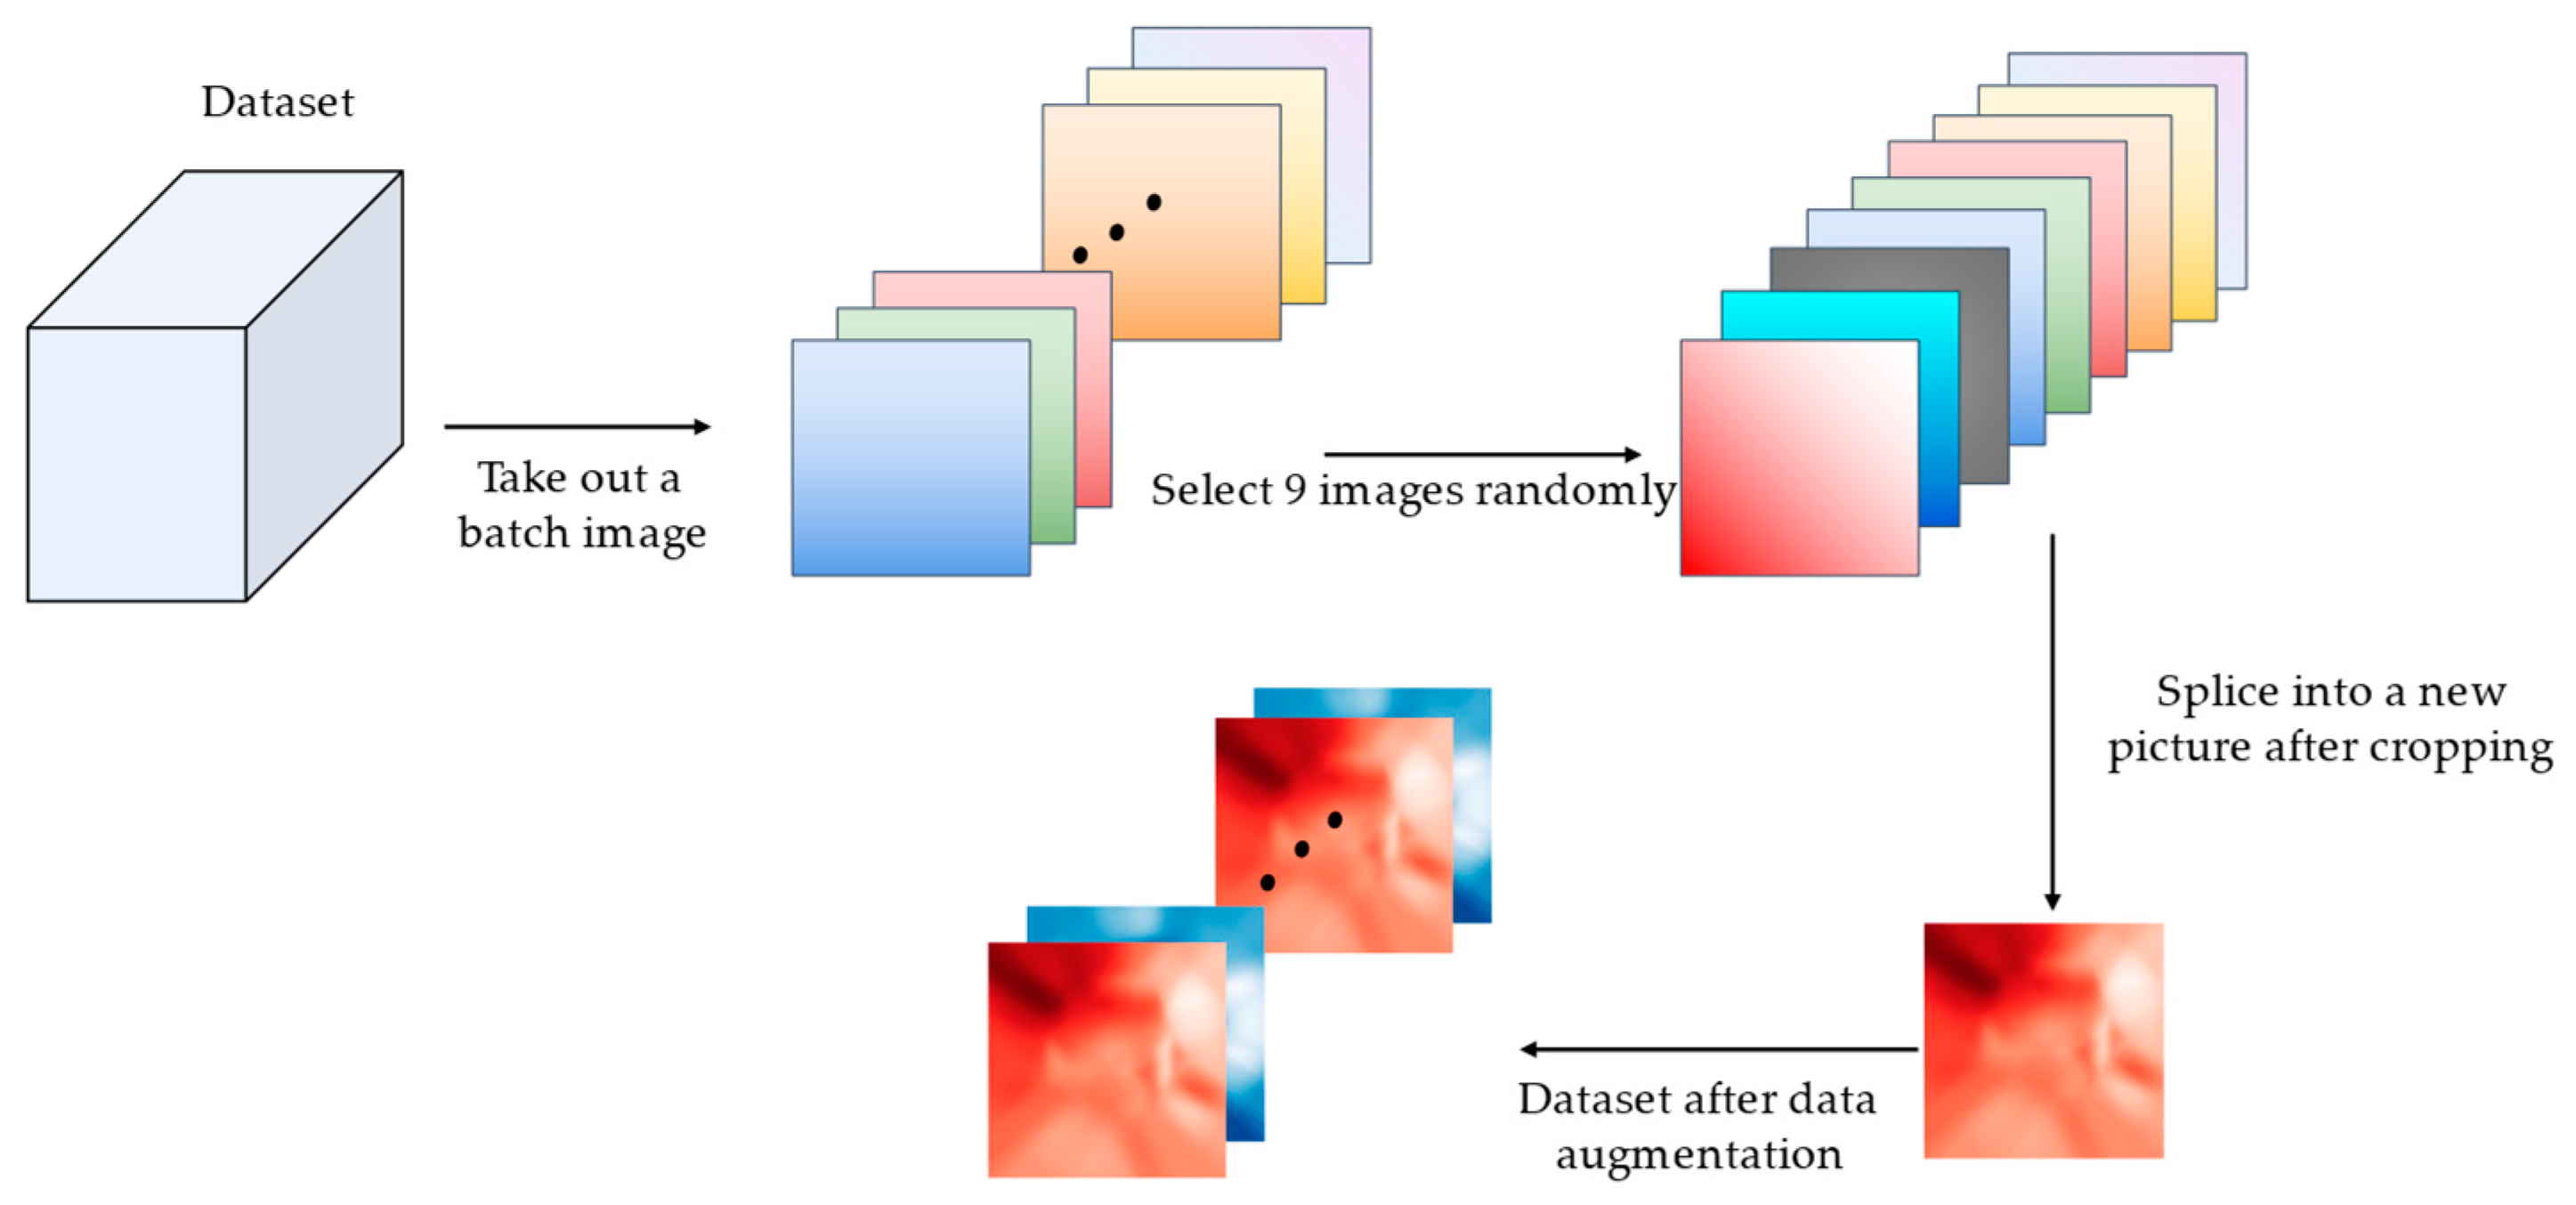
2.1.2. Data Augmentation

To improve the performance of the model and reduce overfitting during training due to insufficient size of the dataset, we expanded the original dataset by eight different data enhancement methods: changing the brightness, adding Gaussian noise, randomly cropping, scaling the image, rotating the image by random angular rotation (−45° to +45°), performing vertical flipping, performing diagonal flipping, and performing mirror flipping. Each image was randomly processed by using one or more of the above data enhancement methods, and the dataset was enhanced from the original 1200 images to 12,000 images. Figure 2 displays the enhancement methods for the litchi dataset. The dataset was randomly divided into a training set (9600 images), a validation set (1200 images), and a test set (1200 images) in the ratio 8∶1∶1.

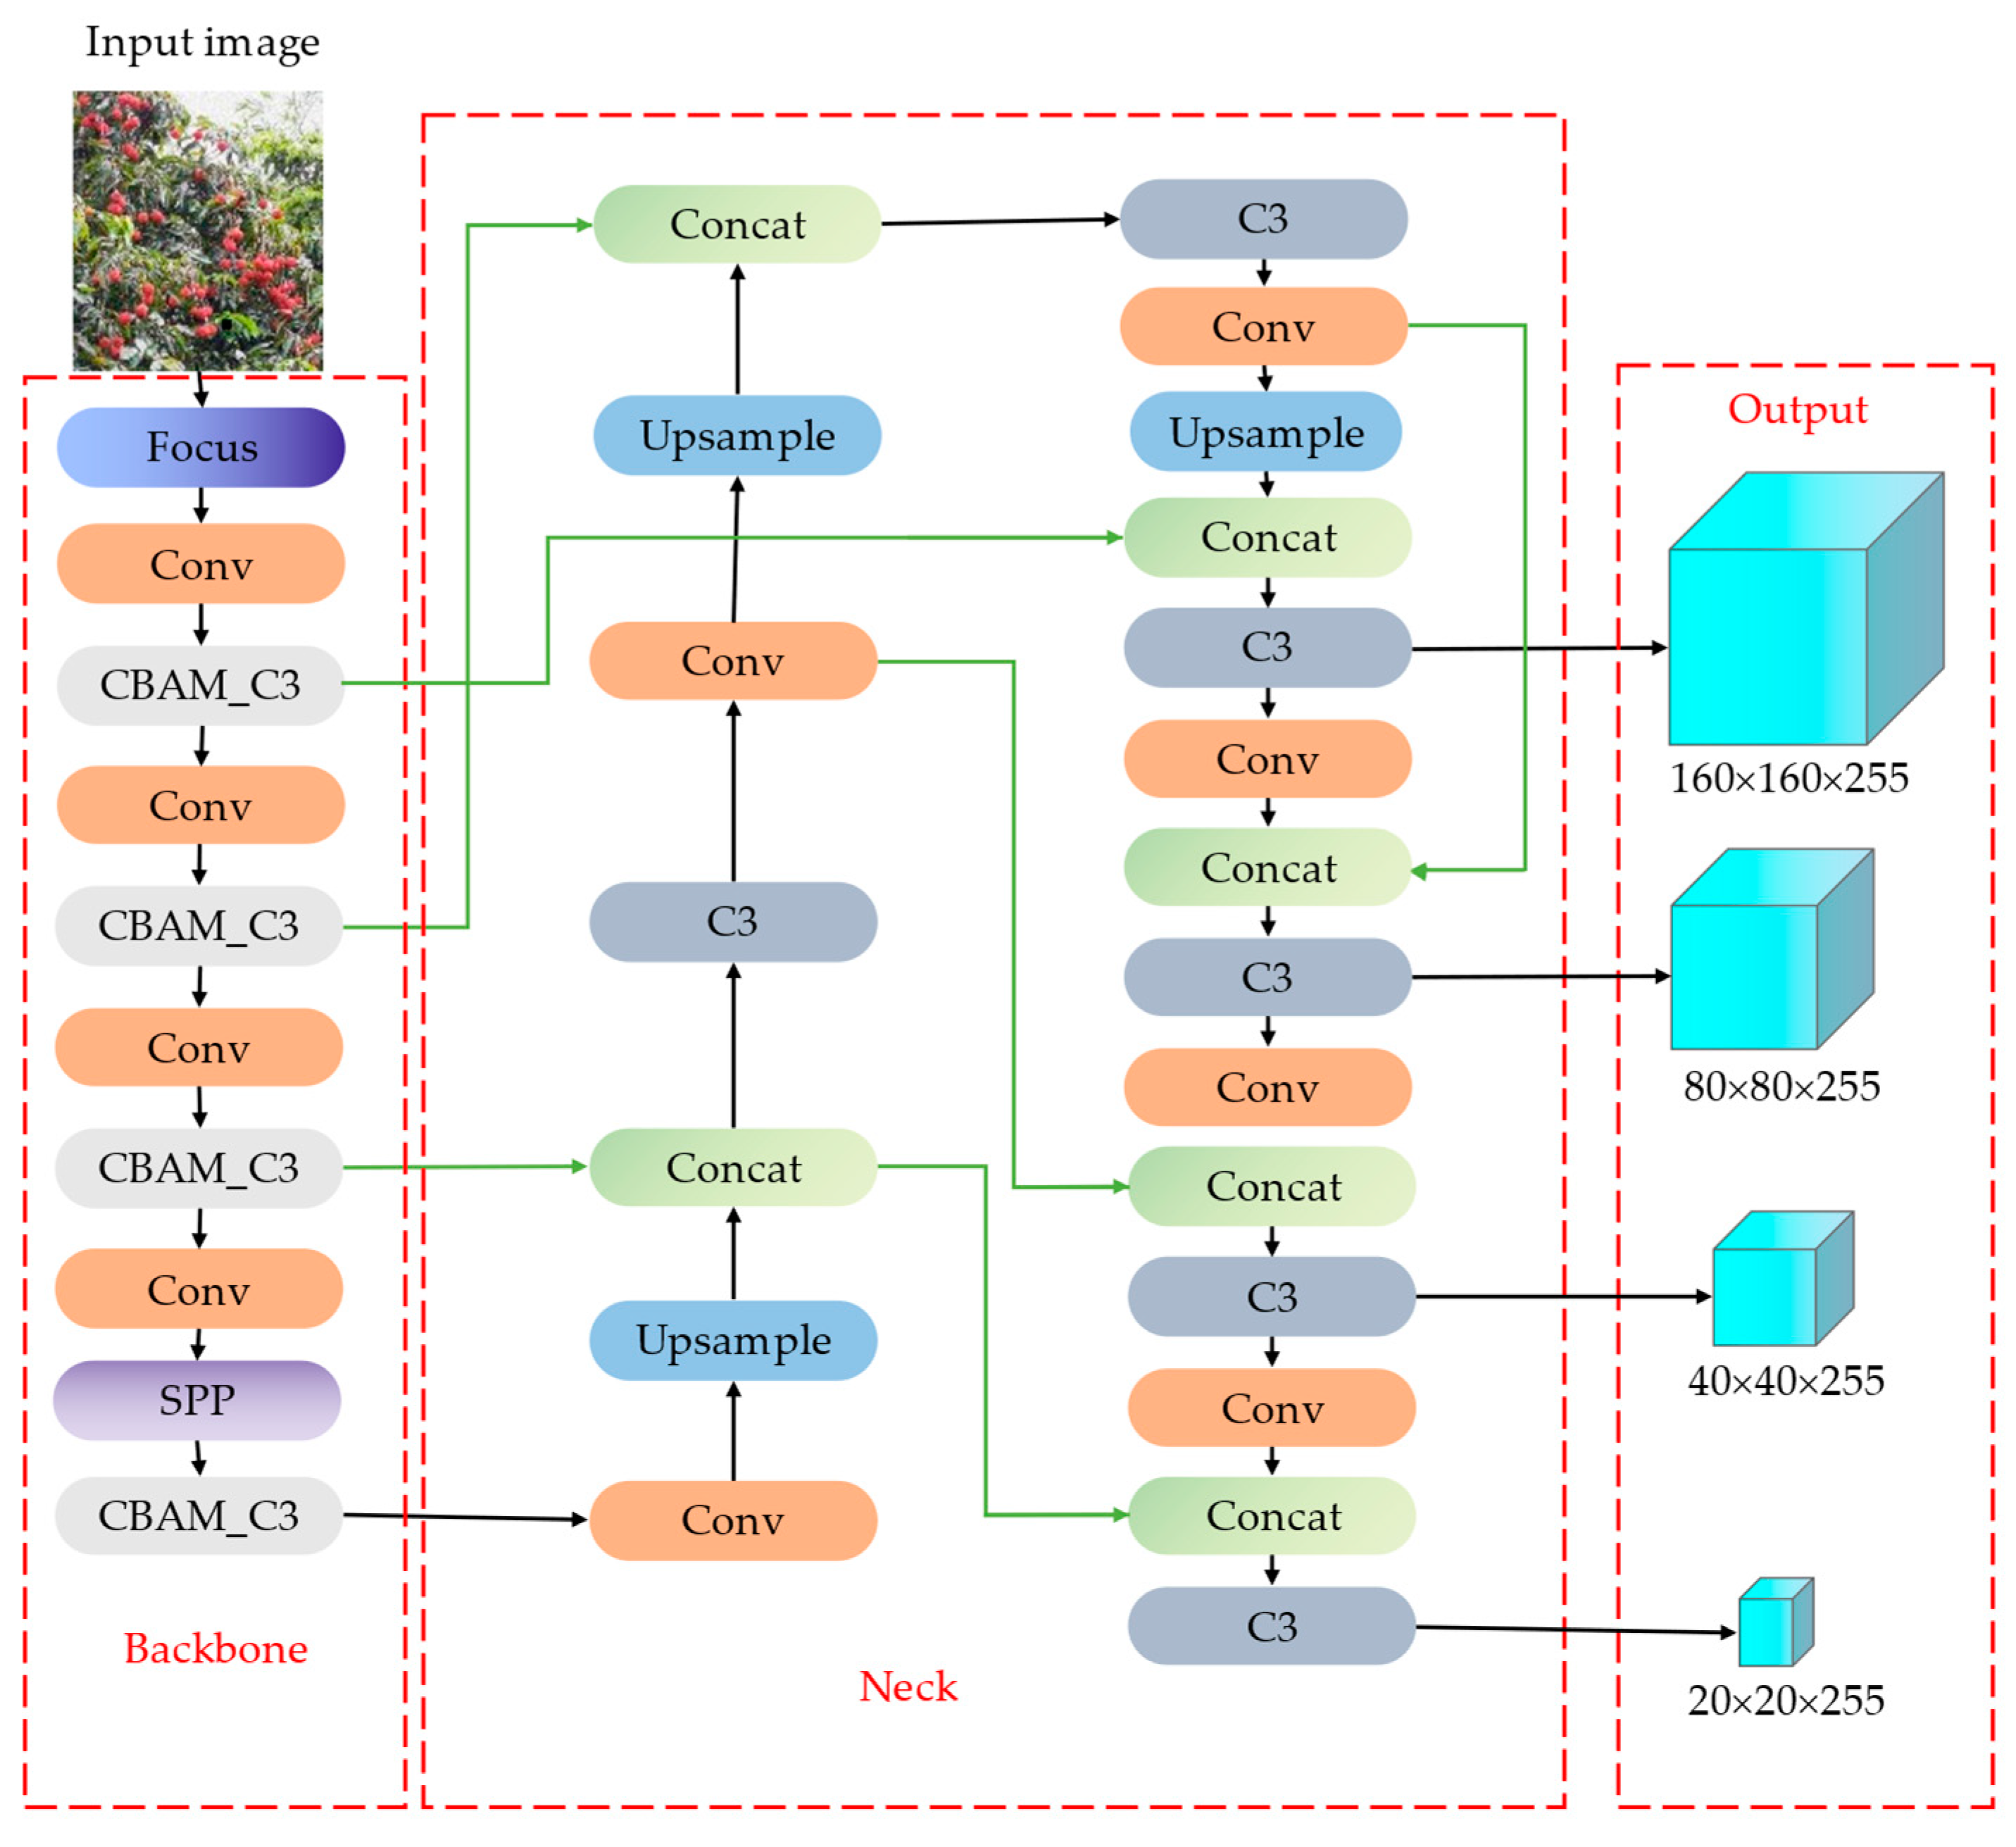
2.2. YOLOv5-Litchi Construction

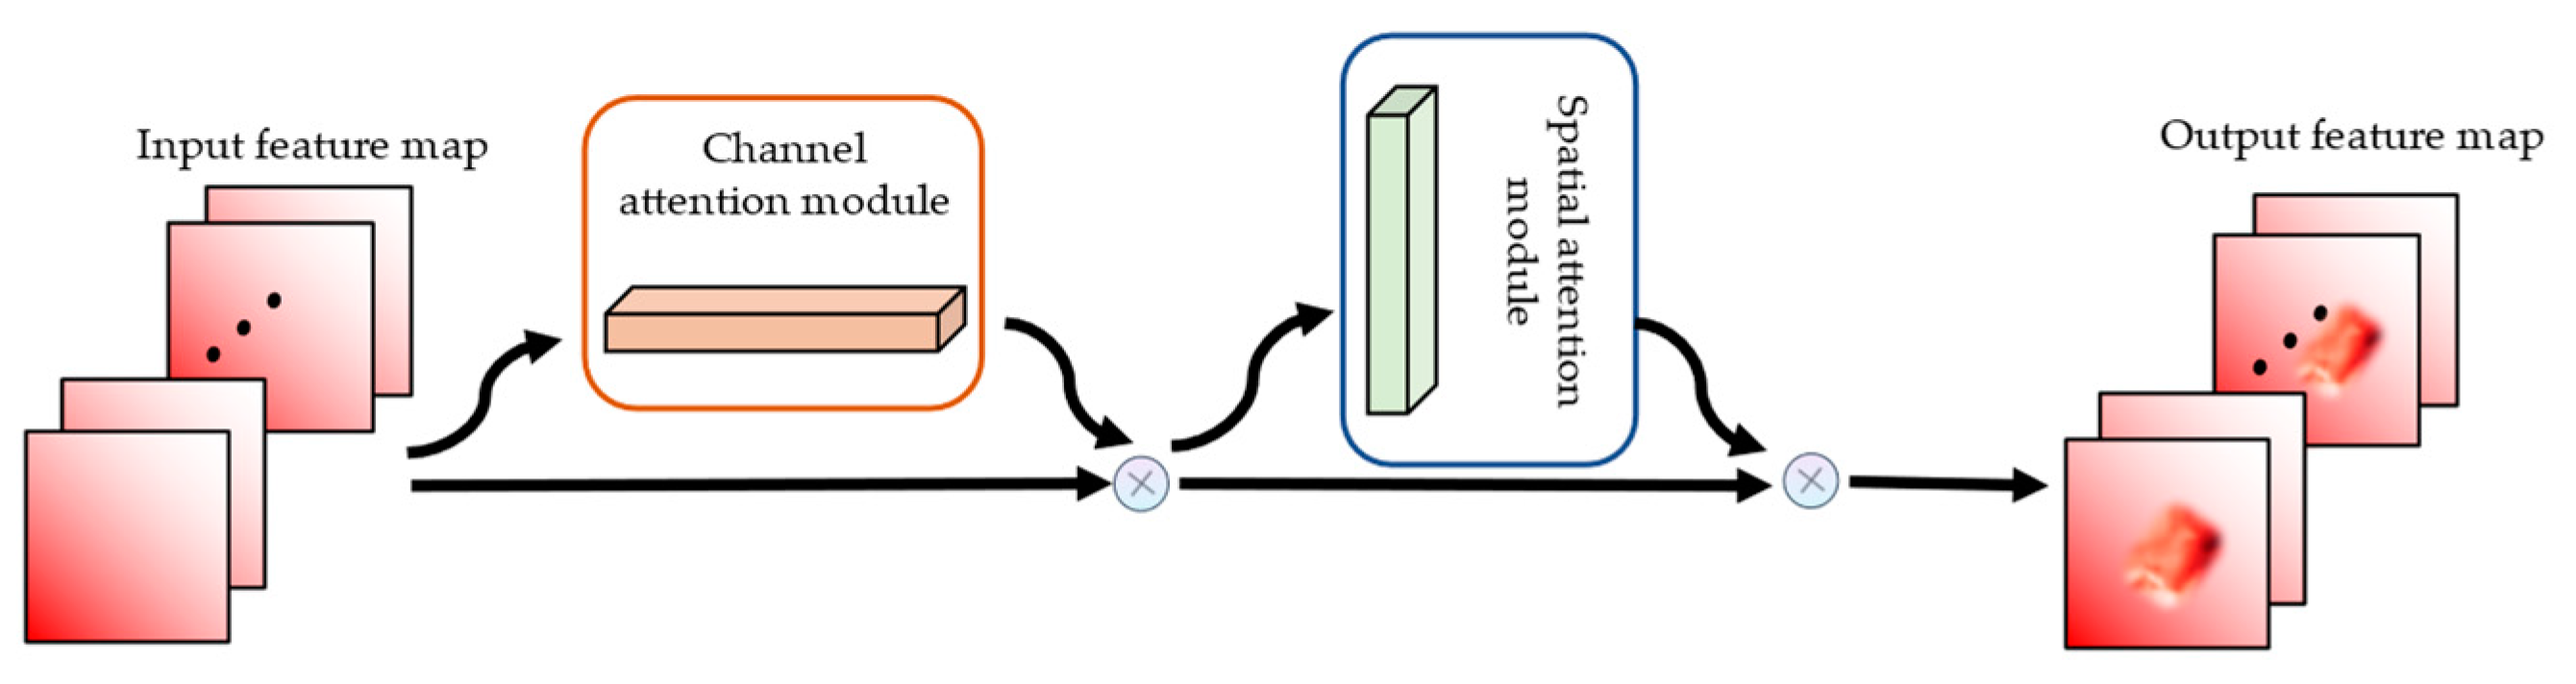
2.2.1. Convolutional Block Attention Module

Currently, the mainstream attention mechanisms used in the field of object detection can be divided into three categories: spatial attention mechanism (SAM), channel attention mechanism (CAM), and CBAM. The spatial transformer network (STN) was the representative of SAM. The CAM uses the Squeeze-and-Excitation Net (SENet). The CBAM combines spatial and channel attention [33]. Compared with the SENet, which only uses maximum pooling, the CBAM combines maximum pooling and mean pooling with an additional spatial attention module to produce a more accurate and efficient result. Figure 3 displays a schematic diagram of the CBAM we used in this paper.
In this paper, litchi was the target detection object, and the dataset includes litchi images in complex natural environments. The size of the litchi in the dataset was small, and there was severe occlusion by fruits or leaves. Therefore, to improve the performance of YOLOv5-litchi, we added the CBAM to each C3 module in the backbone network, which allowed important areas to receive more attention, provided more feature details, and reduced the influence of complex backgrounds, improving small-target detection [34].

2.2.2. Small-Object Detection Layer

The original YOLOv5 network, including the backbone network and feature fusion, output three feature maps of different scales: 20 × 20, 40 × 40, and 80 × 80. They were used to detect target size of large, medium, and small targets, respectively [35]. In a litchi orchard, litchis are randomly distributed in different locations of the litchi tree. With an increase in the distance between the litchi and the camera, the size of the litchi in the dataset also differs. For example, if the litchis are far from the camera, each target may occupy fewer than 8 pixels in the entire image. In addition, the background is complex, so the network finds it hard to extract the target feature information of litchis in the training process, which directly affects the detection performance of the network. At the same time, the size of the feature map of the original YOLOv5 model can only reach 80 × 80 pixels, and it is difficult to detect targets less than 8 × 8 pixels in size.
Therefore, we added a small-target detection layer to the original network to improve the model. The improved model can obtain a maximum feature map size of 160 × 160 pixels after the sampling, which allows the network to detect objects 4 × 4 pixels in size, improving the detection effect of small targets. After the addition of the feature map, YOLOv5-litchi showed superior performance in detecting small targets. Figure 4 presents the structure of the YOLOv5-litchi network.

2.2.3. Mosaic-9 Data Enhancement

Mosaic data enhancement is a new data enhancement method developed on the basis of cutting and mixing. Compared with the traditional method of cutting and mixing, Mosaic data enhancement randomly crops four different images and splices them into a new image [36].
Because the dataset of litchis is from a complex natural environment with similar backgrounds, in order to improve the diversity of the dataset and reduce the impact of high image background similarity on network training, in this paper, we proposed Mosaic-9 to replace the Mosaic data enhancement method in YOLOv5-litchi. Mosaic-9 selected nine different images from the training set, processed them randomly, for example, by cutting and scaling, and arranged them in order from left to right. After placement, these nine images were composed into a new image. When images are processed by Mosaic-9 data enhancement, it can reduce the demand for GPU memory under the training of the same equipment. Figure 5 displays the Mosaic-9 data enhancement process.

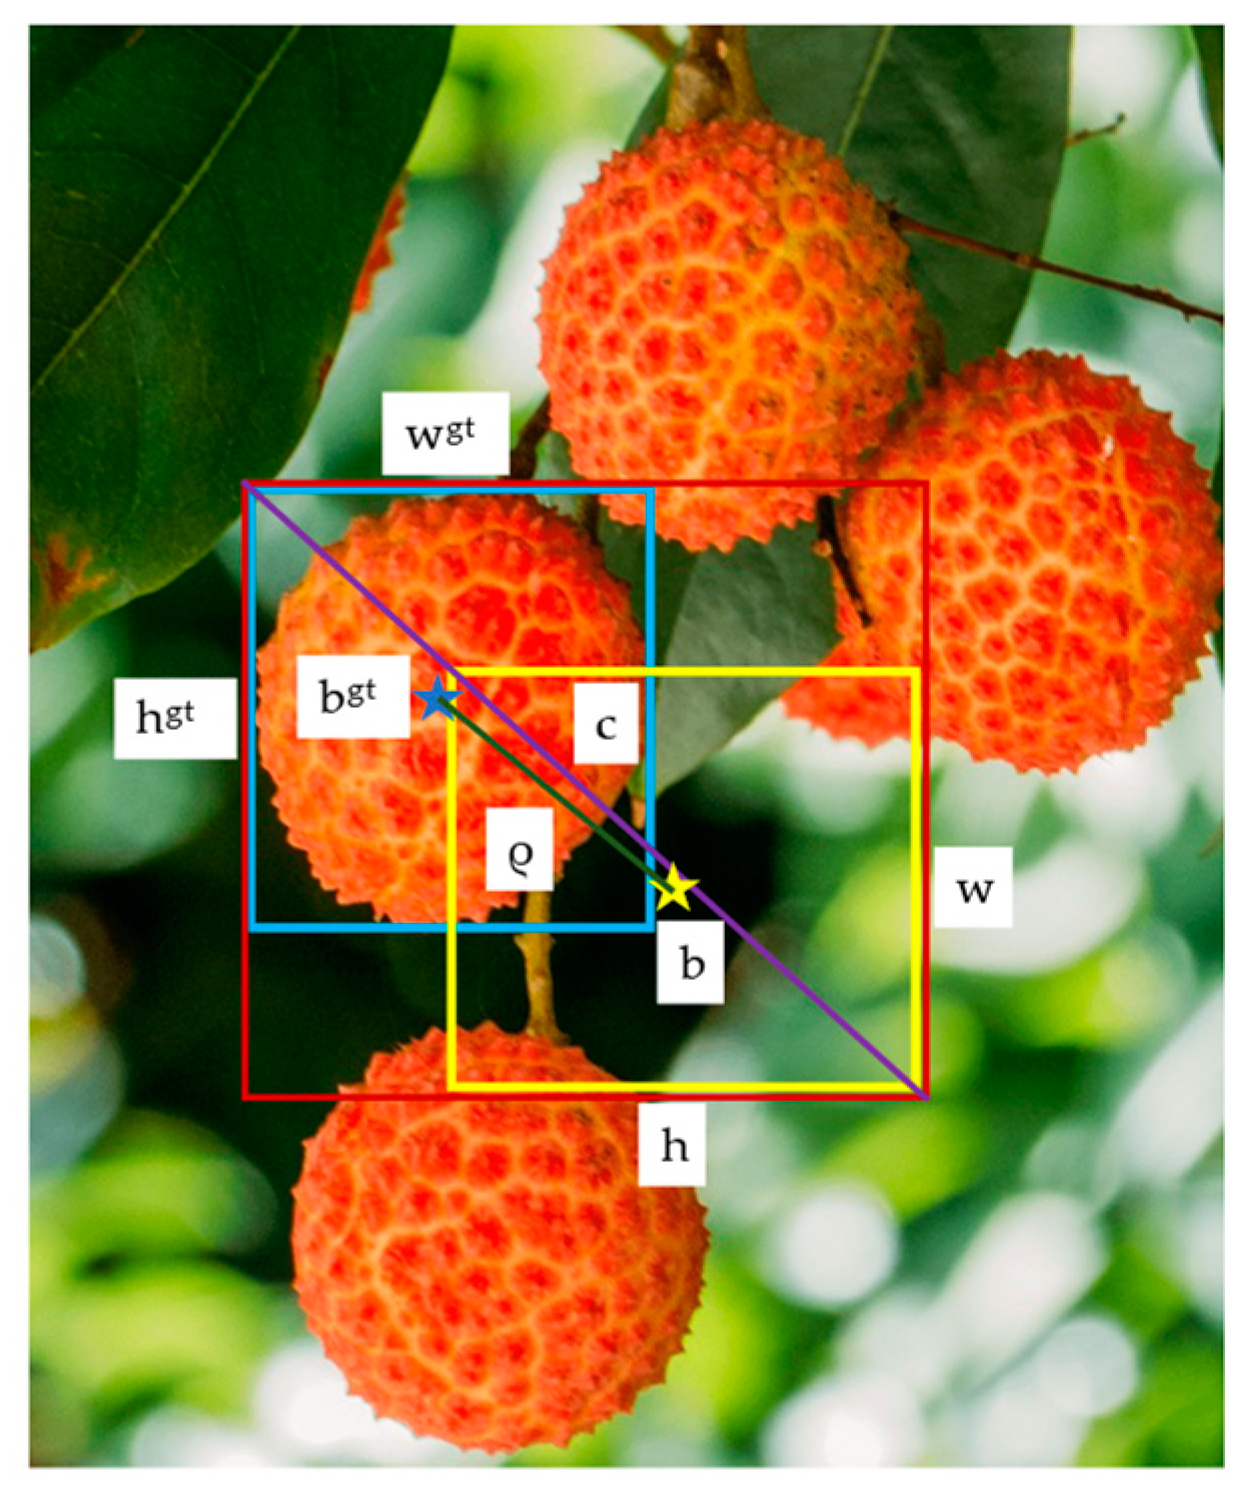
2.2.4. Complete Intersection over Union Loss Function

At present, many target detection algorithms use Intersection over Union (IoU) as the loss function. The value of IoU represents the error between the prediction boxes and the ground truth boxes, and directly affects the prediction effect. The higher the value of the loss function, the larger the error between the prediction boxes and the ground truth boxes. Some researchers have proposed the use of Generalized Intersection over Union (GIoU) to solve the problem that the loss function cannot be correctly reflected when there is no intersection of the prediction boxes and the ground truth boxes [37]. To bring the prediction boxes closer to the ground truth boxes, we proposed the use of Complete Intersection over Union (CIoU) as the loss function in the litchi detection model. Figure 6 shows a diagram of the CIoU loss function.
In the diagram, the blue rectangle represents the ground truth box, the yellow rectangle represents the prediction box, and the red rectangle is their smallest circumscribed rectangle. wgt is the width and hgt is the height of the ground truth box, and w is the width and h is the height of the prediction box. bgt is the center position of the ground truth box, and b is the center position of the prediction box. ρ is the distance between the two center positions measured by Euclidean distance, and c represents the distance between the prediction box and the smallest circumscribed rectangle. The CIoU loss function is primarily composed of three parts:
(1) The aspect ratio of the prediction boxes is added as a penalty point to the loss function [38], and the penalty point of the loss function is as follows:
R C I o U = ρ 2 ( b , b g t ) c 2 + a v  
(2) The v is used to measure the consistency of the ratio between the prediction boxes and the ground truth boxes, α is the weighting factor, and the relevant formulas are as follows:
v = 4 π 2 ( arctan w g t h g t arctan w h )   2
a = v ( 1 I o U ) + v
(3) The CIoU loss function is obtained as follows:
L C I o U = 1 I o U + ρ 2 ( b , b g t ) c 2 + a v
The CIoU loss function improves YOLOv5, bringing the prediction boxes closer to the ground truth boxes, accelerating the inference speed, and improving the accuracy of the model for litchi detection in complex natural environments.

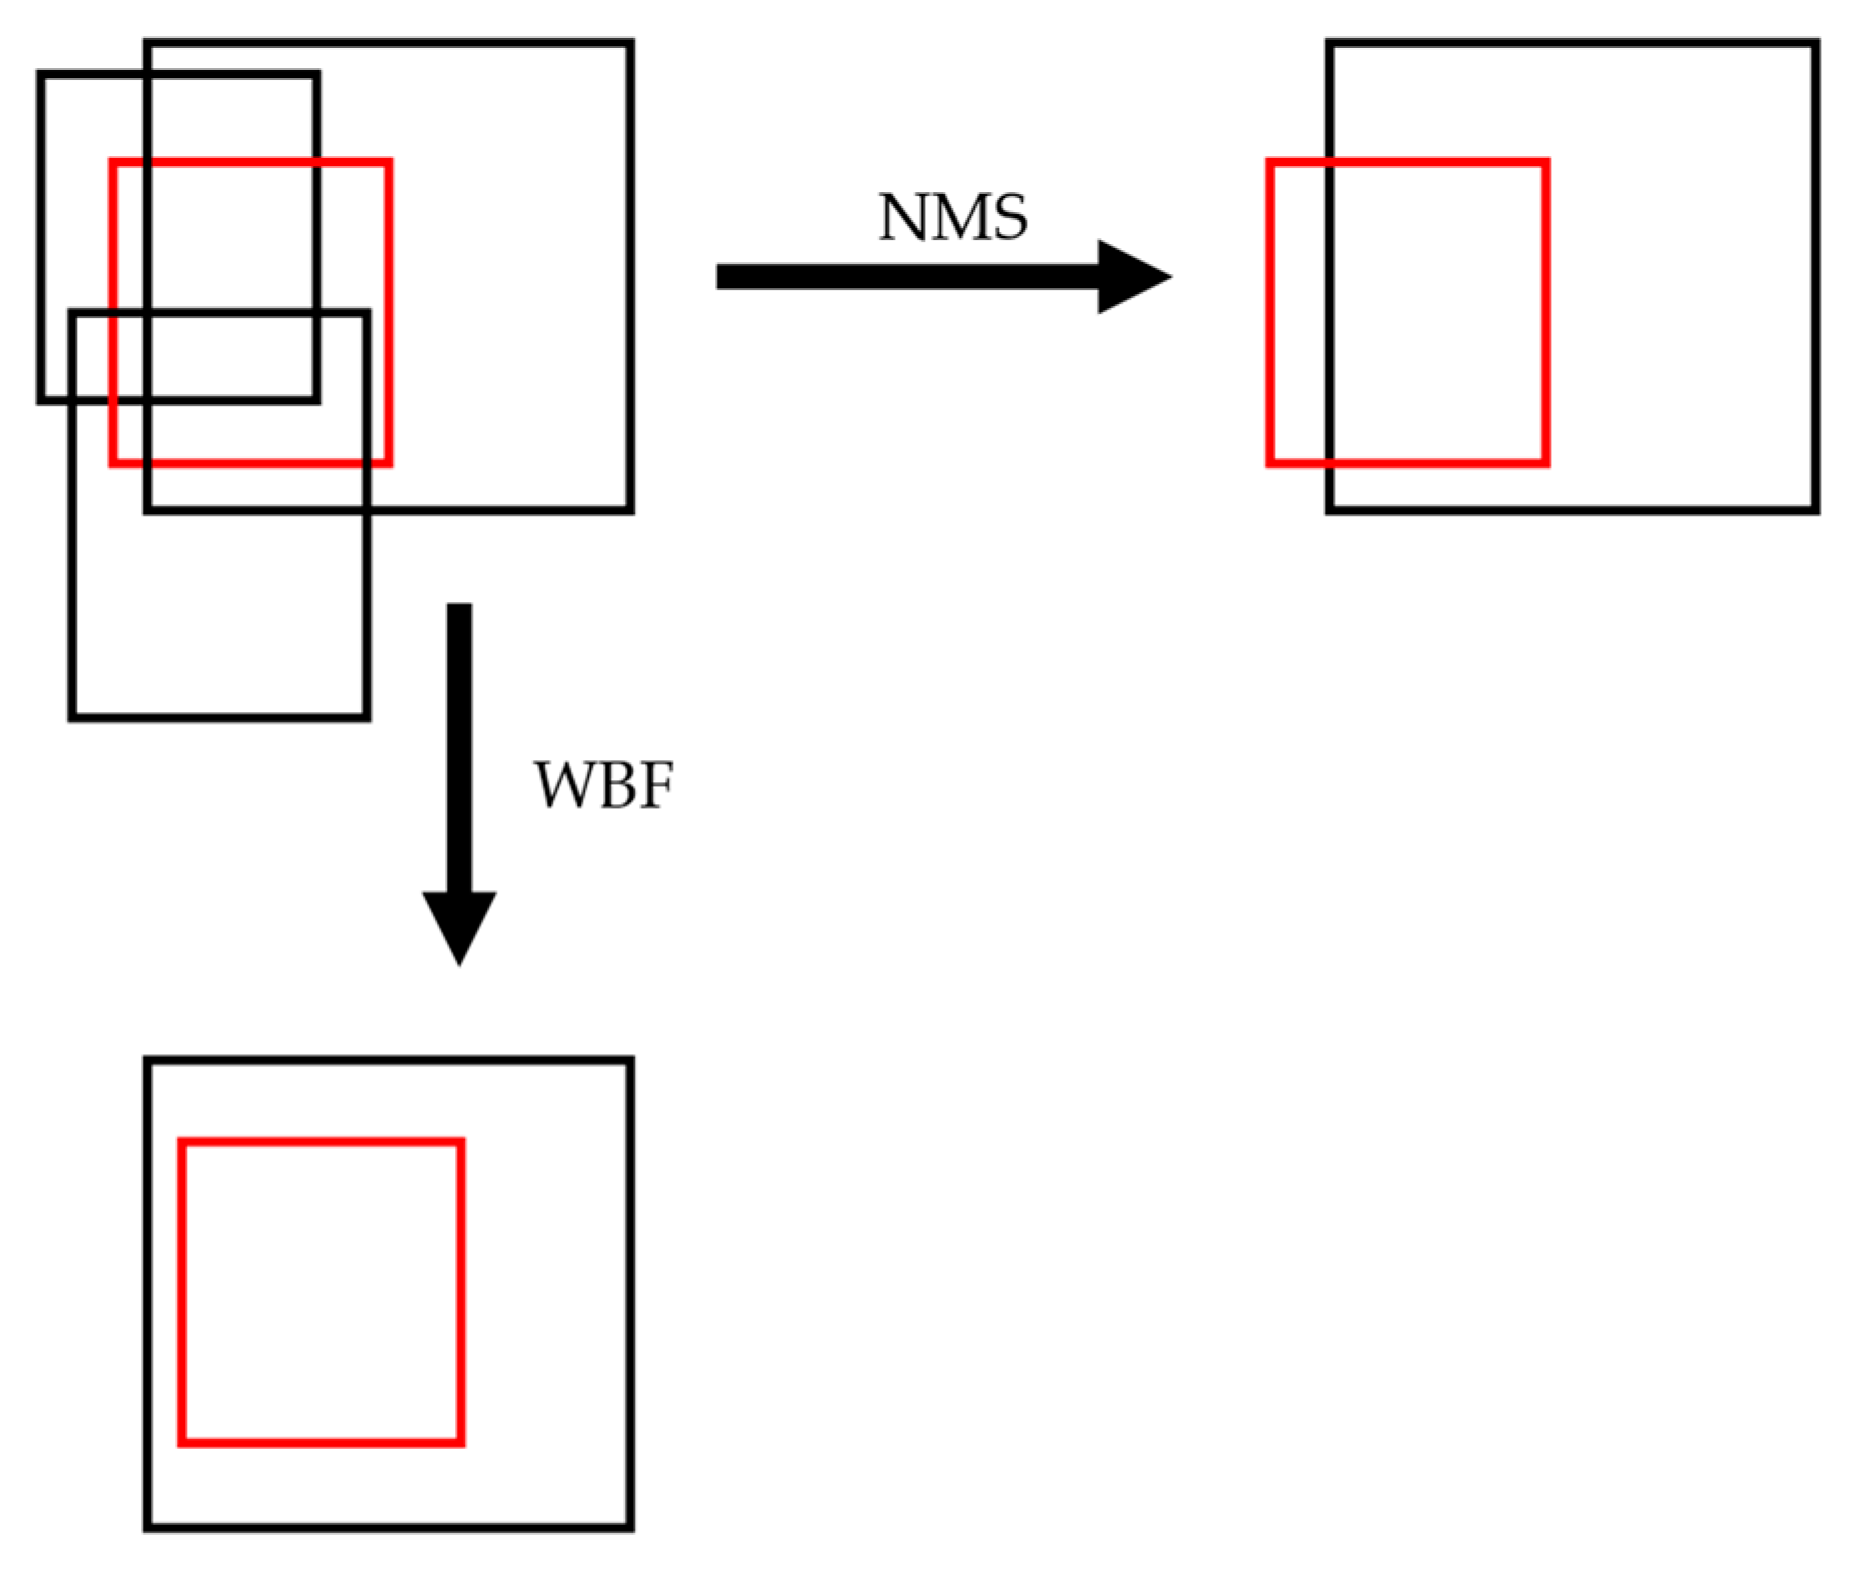
2.2.5. Weighted-Boxes Fusion

The YOLOv5 algorithm uses non-maximum suppression (NMS) as a fusion method for prediction boxes. In orchards, there are many cases of severe occlusion of targets by other litchis or leaves, and the value of the IoU directly affects the detection results. When NMS is used as a fusion method for detection results, the model can remove the prediction boxes with low confidence. The model misclassifies multiple targets with a high level of overlap as one target, retaining only the highest-confidence prediction boxes and resulting in a large number of missed detections. At the same time, a high confidence value does not mean that the location is accurate. To reduce the cases of missed detection, we used weighted-boxes fusion (WBF) as the fusion method for detection [39]. Figure 7 provides a comparison of the weighting fusion algorithm and the non-maximum suppression algorithm. The red rectangle represents the ground truth box, the black rectangles represent the prediction box.

2.3. Training Equipment and Methods

In this paper, all the experiments were completed on the workstation. The workstation processor included Intel (R) Xeon (R) Gold 6240 [email protected] GHz with 36 cores, with dual-channel Nvidia GeForce GTX 3090. The GPU memory was 48 GB, and the SSD had a capacity of 2 TB. The operating system was Windows 10. PyTorch 1.7 was used as the deep learning framework, and the programing language was Python 3.8. The size of the input image was treated uniformly as 640 × 640 pixels, the batch size was set as 16, and the number of epochs were 150. Stochastic Gradient Descent (SGD) was used as the optimizer for model training. Table 1 presents the experimental environment.
Considering that, in this paper, we compare the performance of various algorithms in detecting litchis in complex natural environments, the detection accuracy was prioritized. In this paper, precision, recall, average precision, and mAP were used to evaluate the detection performance of the YOLOv5-litchi network, and the relevant formulas are as follows:
P = TP TP + FP × 100 %
R = TP TP + FN × 100 %
F 1 = 2 P R P + R × 100 %
AP = 0 1 P ( R ) d R
m AP = 1 N i = 1 N AP i × 100 %
In the above formulas, TP stands for true positive and represents the number of positive samples in the test set that were correctly detected by the model, FP stands for false positive and represents the number of negative samples that were incorrectly detected by the model, and FN stands for false negative and represents the number of positive samples missed by the model.

3. Results

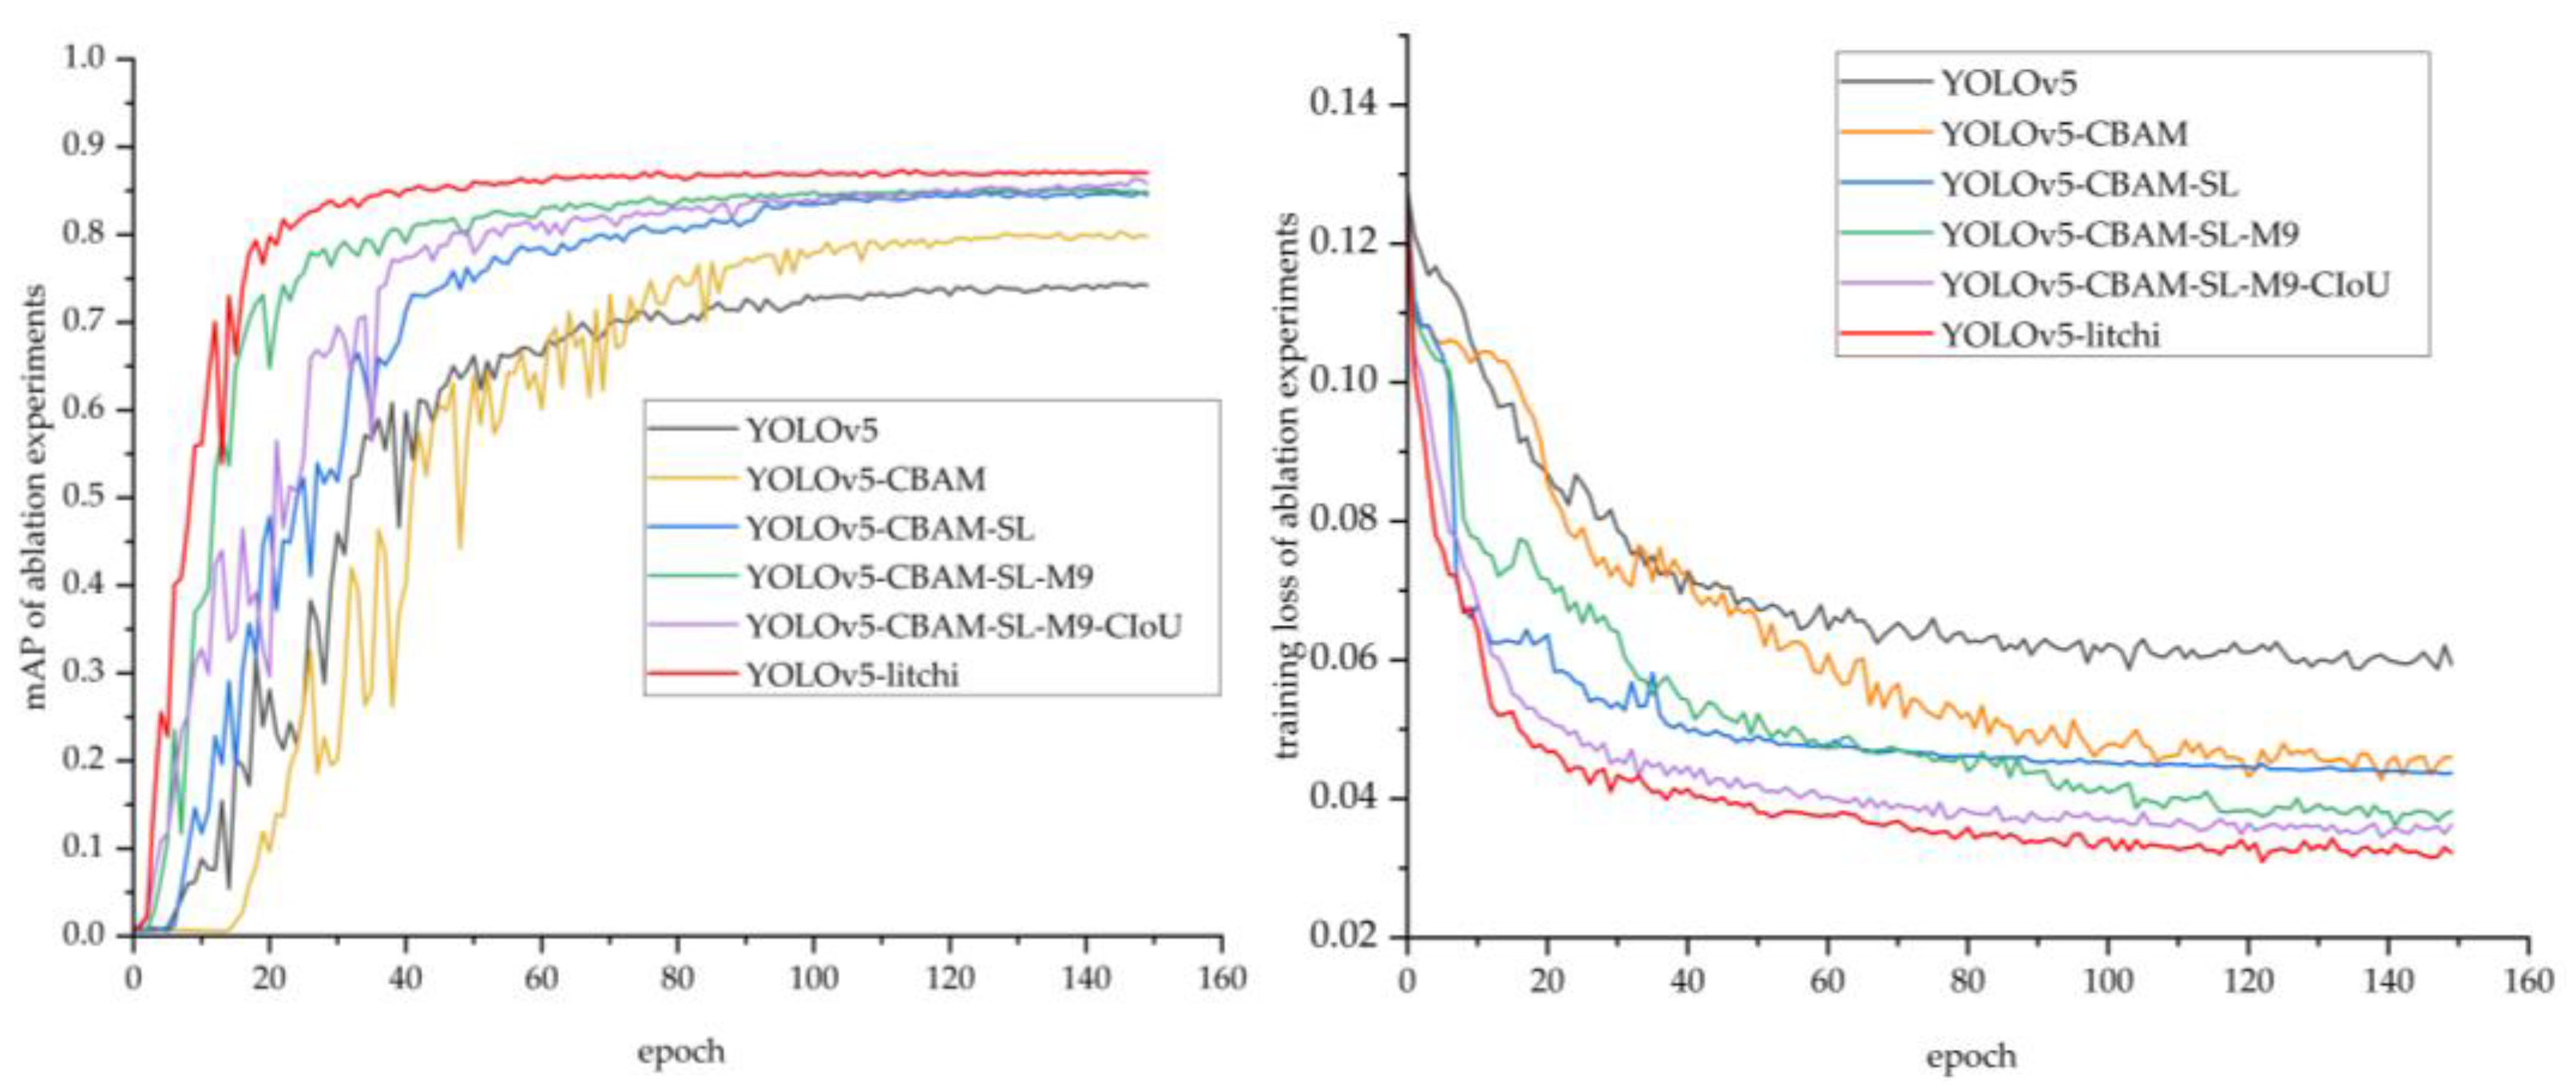
3.1. Ablation Experiments

To verify the effectiveness of the improvement methods, we conducted a series of ablation experiments. The same dataset was used for training, the same test platform was selected, and the same parameters were set, and the improvements are shown in Table 2. YOLOv5 represents the original network model. YOLOv5-M9 is an improved model that uses Mosaic-9 to replace the mosaic data enhancement in the original model. YOLOv5-CIoU is also an improved model using CIoU as the loss function. YOLOv5-WBF indicates the model that introduced a weighted-boxes fusion algorithm for target fusion. YOLOv5-CBAM represents an improved model after the addition of the CBAM. YOLOv5-SL is the model after adding the small-object detection layer. YOLOv5-CBAM-SL represents the model that used both the CBAM and the small-object detection layer. In YOLOv5-CBAM-SL-M9, Mosaic-9 was added as the data enhancement method on the basis of the former. In YOLOv5-CBAM-SL-M9-CIoU, the CIoU loss function was further added to the YOLOv5-CBAM-SL-M9 network. YOLOv5-litchi is the final improved model and includes all five improvements.
In the table, the ablation experiment results of YOLOv5 for precision, F1 score, train loss, recall, and mAP were 84.6%, 0.74, 0.059, 66.1%, and 74.2%, respectively. YOLOv5-M9 obtained a higher mAP, of 75.7%. YOLOv5-CIoU provided a 2.1% and 3.1% increase in precision and mAP, respectively. After the addition of WBF, the recall rate of YOLOv5-WBF reached 70%, the mAP was 77.5%, and the F1-score was 0.03 higher than before. YOLOv5-CBAM can strengthen the focus on the target information, thus obtaining better detection performance. In the ablation test, the mAP was increased from 74.2% before use to 80.1%. The precision was increased from 84.6% to 87.2%, the F1-score value was increased from 0.74 to 0.80, and the loss value of the training set was decreased from 0.059 to 0.046, indicating a good improvement effect on the original network. The mAP of the YOLOv5-SL increased from 74.2% to 80.2%, and the F1 increased from 0.74 to 0.80. In the improved model, the mAP of the test set improved from 74.2% to 80.5%, with a 2.7% increase in precision and a 0.06 increase in the F1 score, proving that the addition of the small-object detection layer improved litchi detection. The ablation test results showed that all five different improvement methods also had a positive effect on the YOLOv5 network and the detection performance of the improved model was significantly better than that of the original network.
Figure 8 shows the curve of the mAP in the test set and the loss value in the train set of models in the ablation test. It can be seen from Figure 8 that the fluctuation in the loss value of the YOLOv5 model at around the 38th round of training was more serious than that of the YOLOV5 model. At the same time, the convergence speed of the loss value of the unimproved model in training was the slowest, and finally the loss value was stable, at 0.059, at around the 150th round. The mAP was 74.2%, which was the worst among the six groups of comparison tests. As can be seen from the figure, the addition of the convolutional attention mechanism module can help focus more attention on target feature information, leading to better detection results in complex image backgrounds. The figures also reflect that the model with the addition of the CBAM had a smaller loss value and a higher mAP in the test set. The addition of a small-target detection layer enabled the network to detect objects as small as 4 × 4 pixels, which was a significant improvement in the detection of small targets. The graph clearly shows that the model dropped faster in the loss value in the training set after the introduction of the CIoU loss function, and the loss value of YOLOv5-litchi using all improvements was only 0.032, which was the smallest value of the six models; the mAP was also the highest, at 87.1%.

3.2. Comparison of Different Network Models

To compare the effectiveness of the YOLOv5-litchi algorithm, proposed in this study, with that of the mainstream models Faster-RCNN (faster region convolutional neural networks), SSD (single-shot multibox detector), YOLOv4, and original YOLOv5, we used the same litchi dataset. The model size, the precision, the mAP, the recall, and the detection time are shown in Table 3. The table shows that the main performance indexes of the YOLOv5-litchi model were significantly better than those of other models. In terms of the mAP for litchi, YOLOv5-litchi achieved a value of 87.1%, an obvious improvement over that of the original YOLOv5, YOLOv4 (at 72.6%), Faster-RCNN (at 76.5%), and SSD (at 70.1%). In terms of recall, the YOLOv5-litchi model obtained a value of over 81%, higher than the rest of the other models. There was a slight increase in the size of the YOLOv5-litchi model due to the use of the target frame weighting fusion algorithm, the small-object detection layer, and the CBAM. The size of the YOLOv5-litchi model was 44.8 Mb, which was only larger than that of the original network, but much smaller than that of Faster-RCNN and YOLOv4. The average detection time of the YOLOv5-litchi in the test set was 25 ms, which was much faster than that of Faster-RCN and YOLOv4. It can basically meet the real-time requirements in the agricultural field.

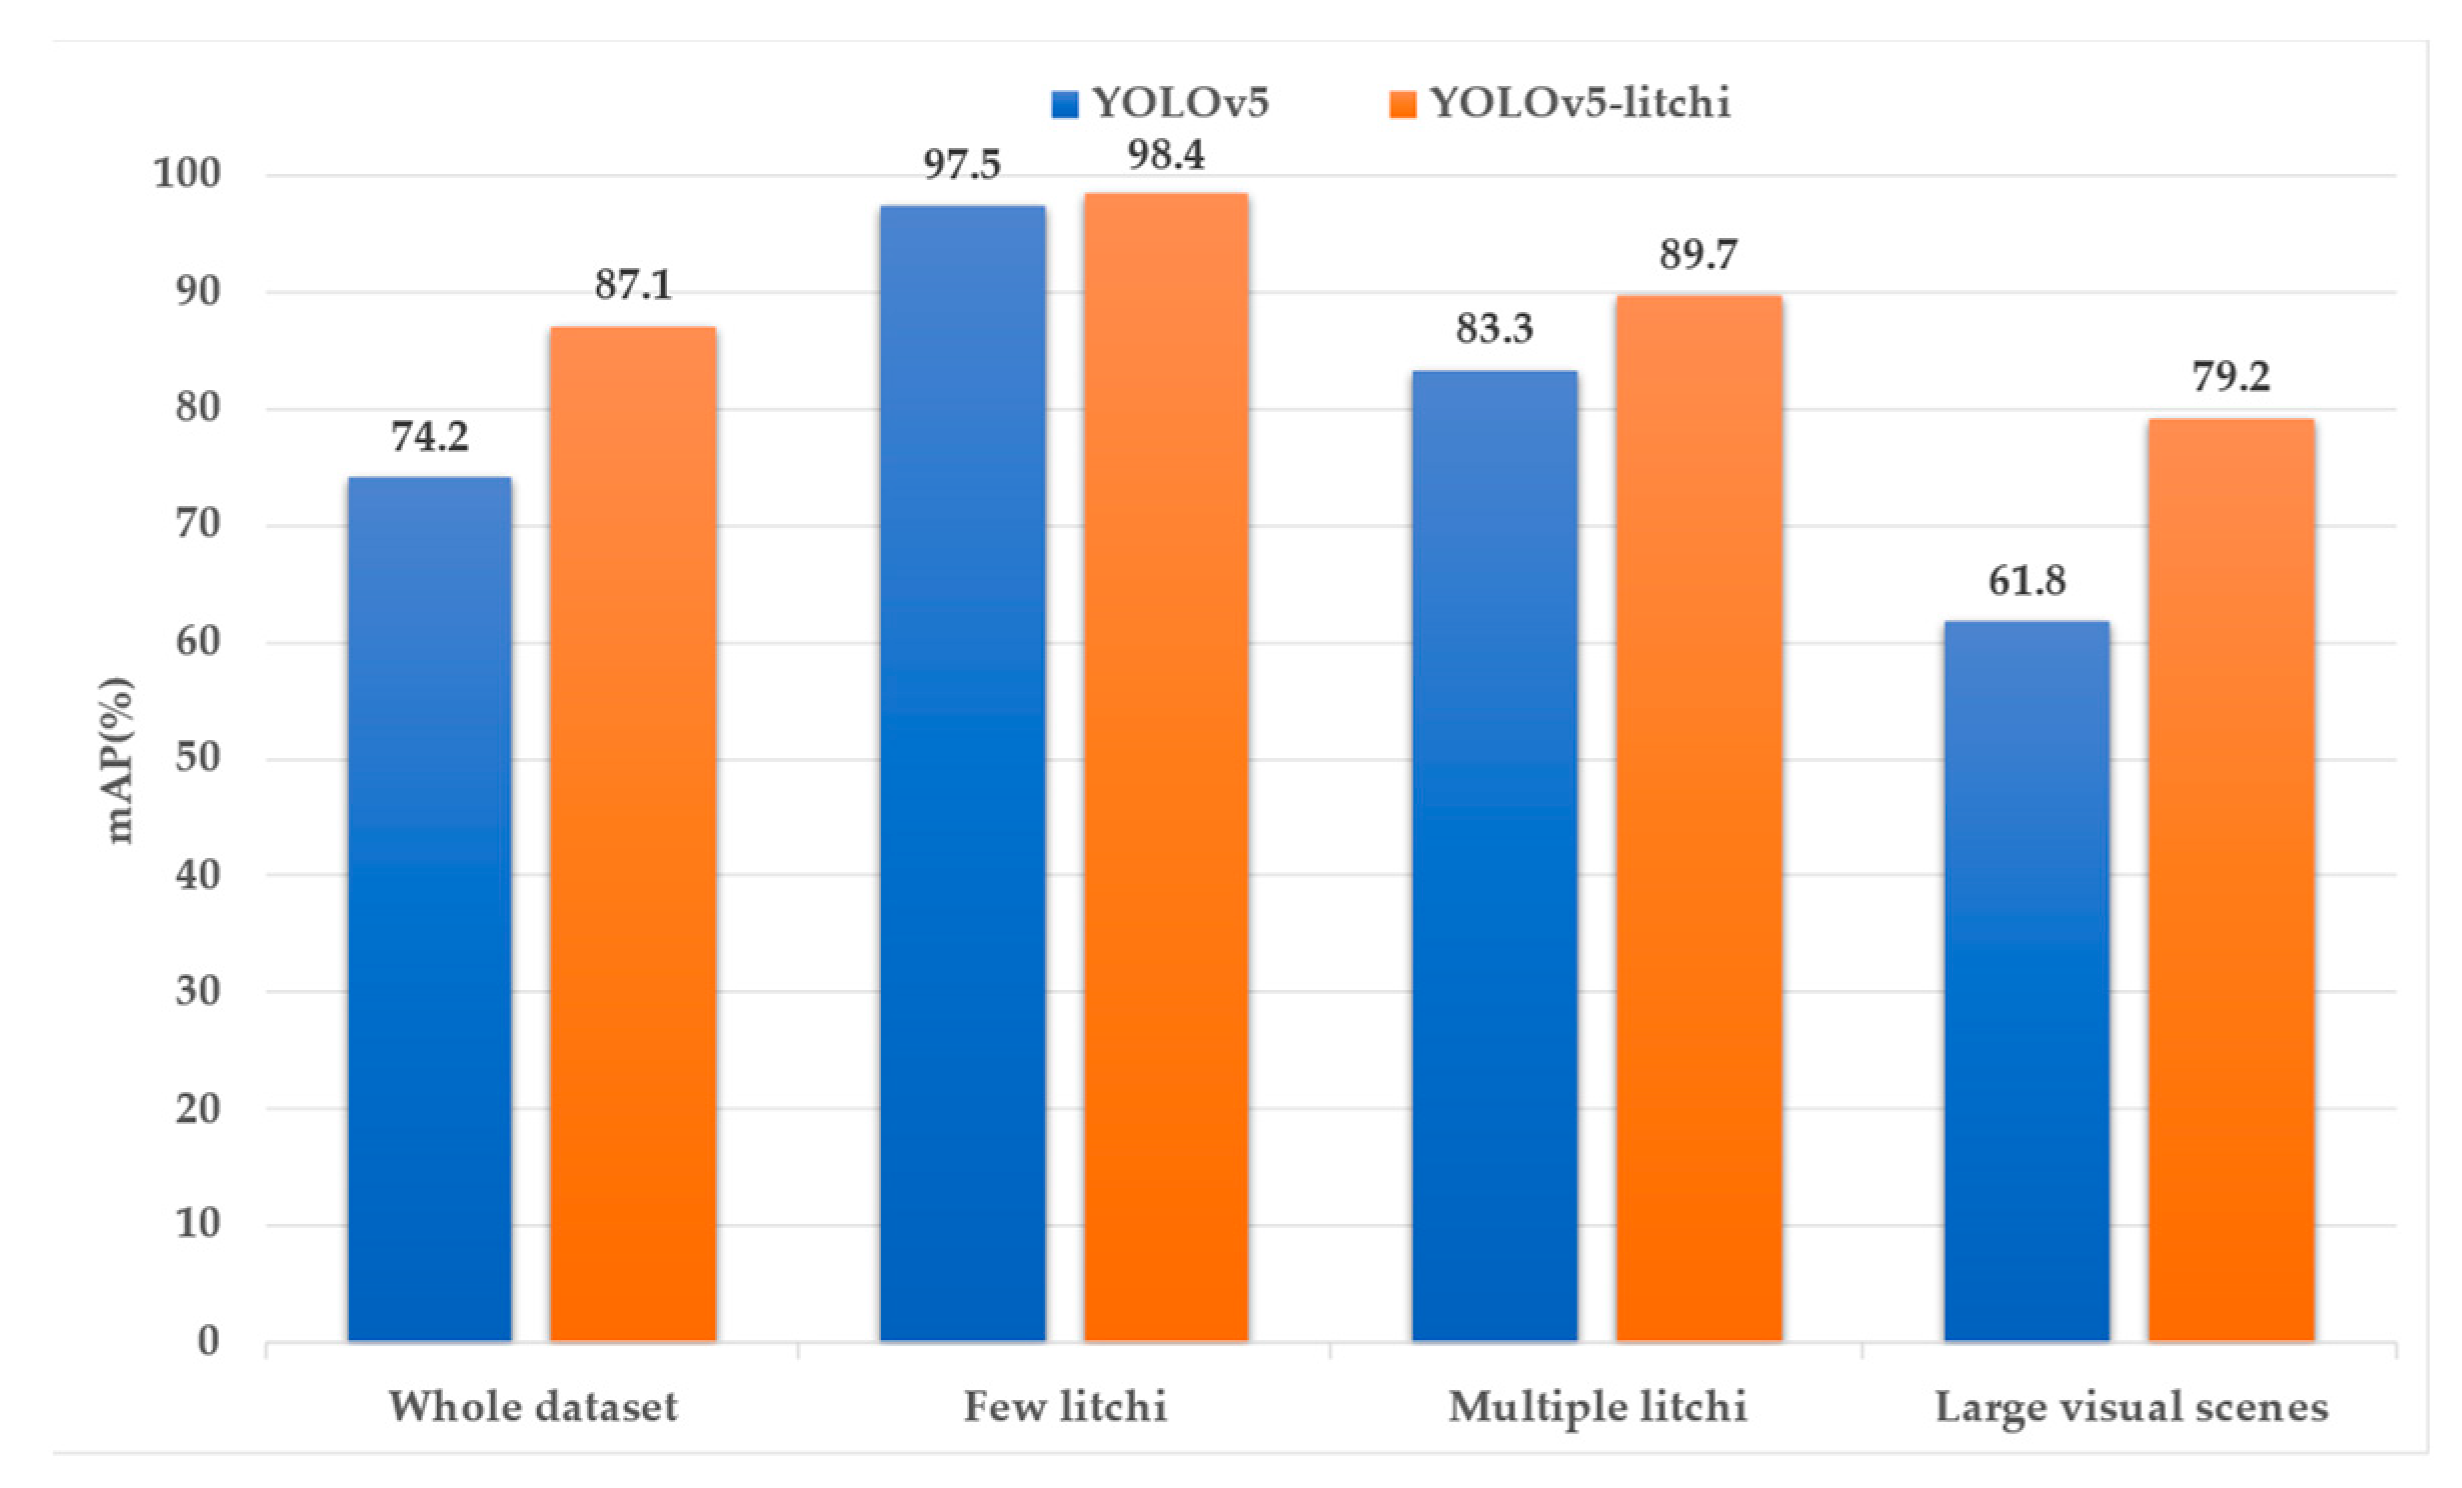
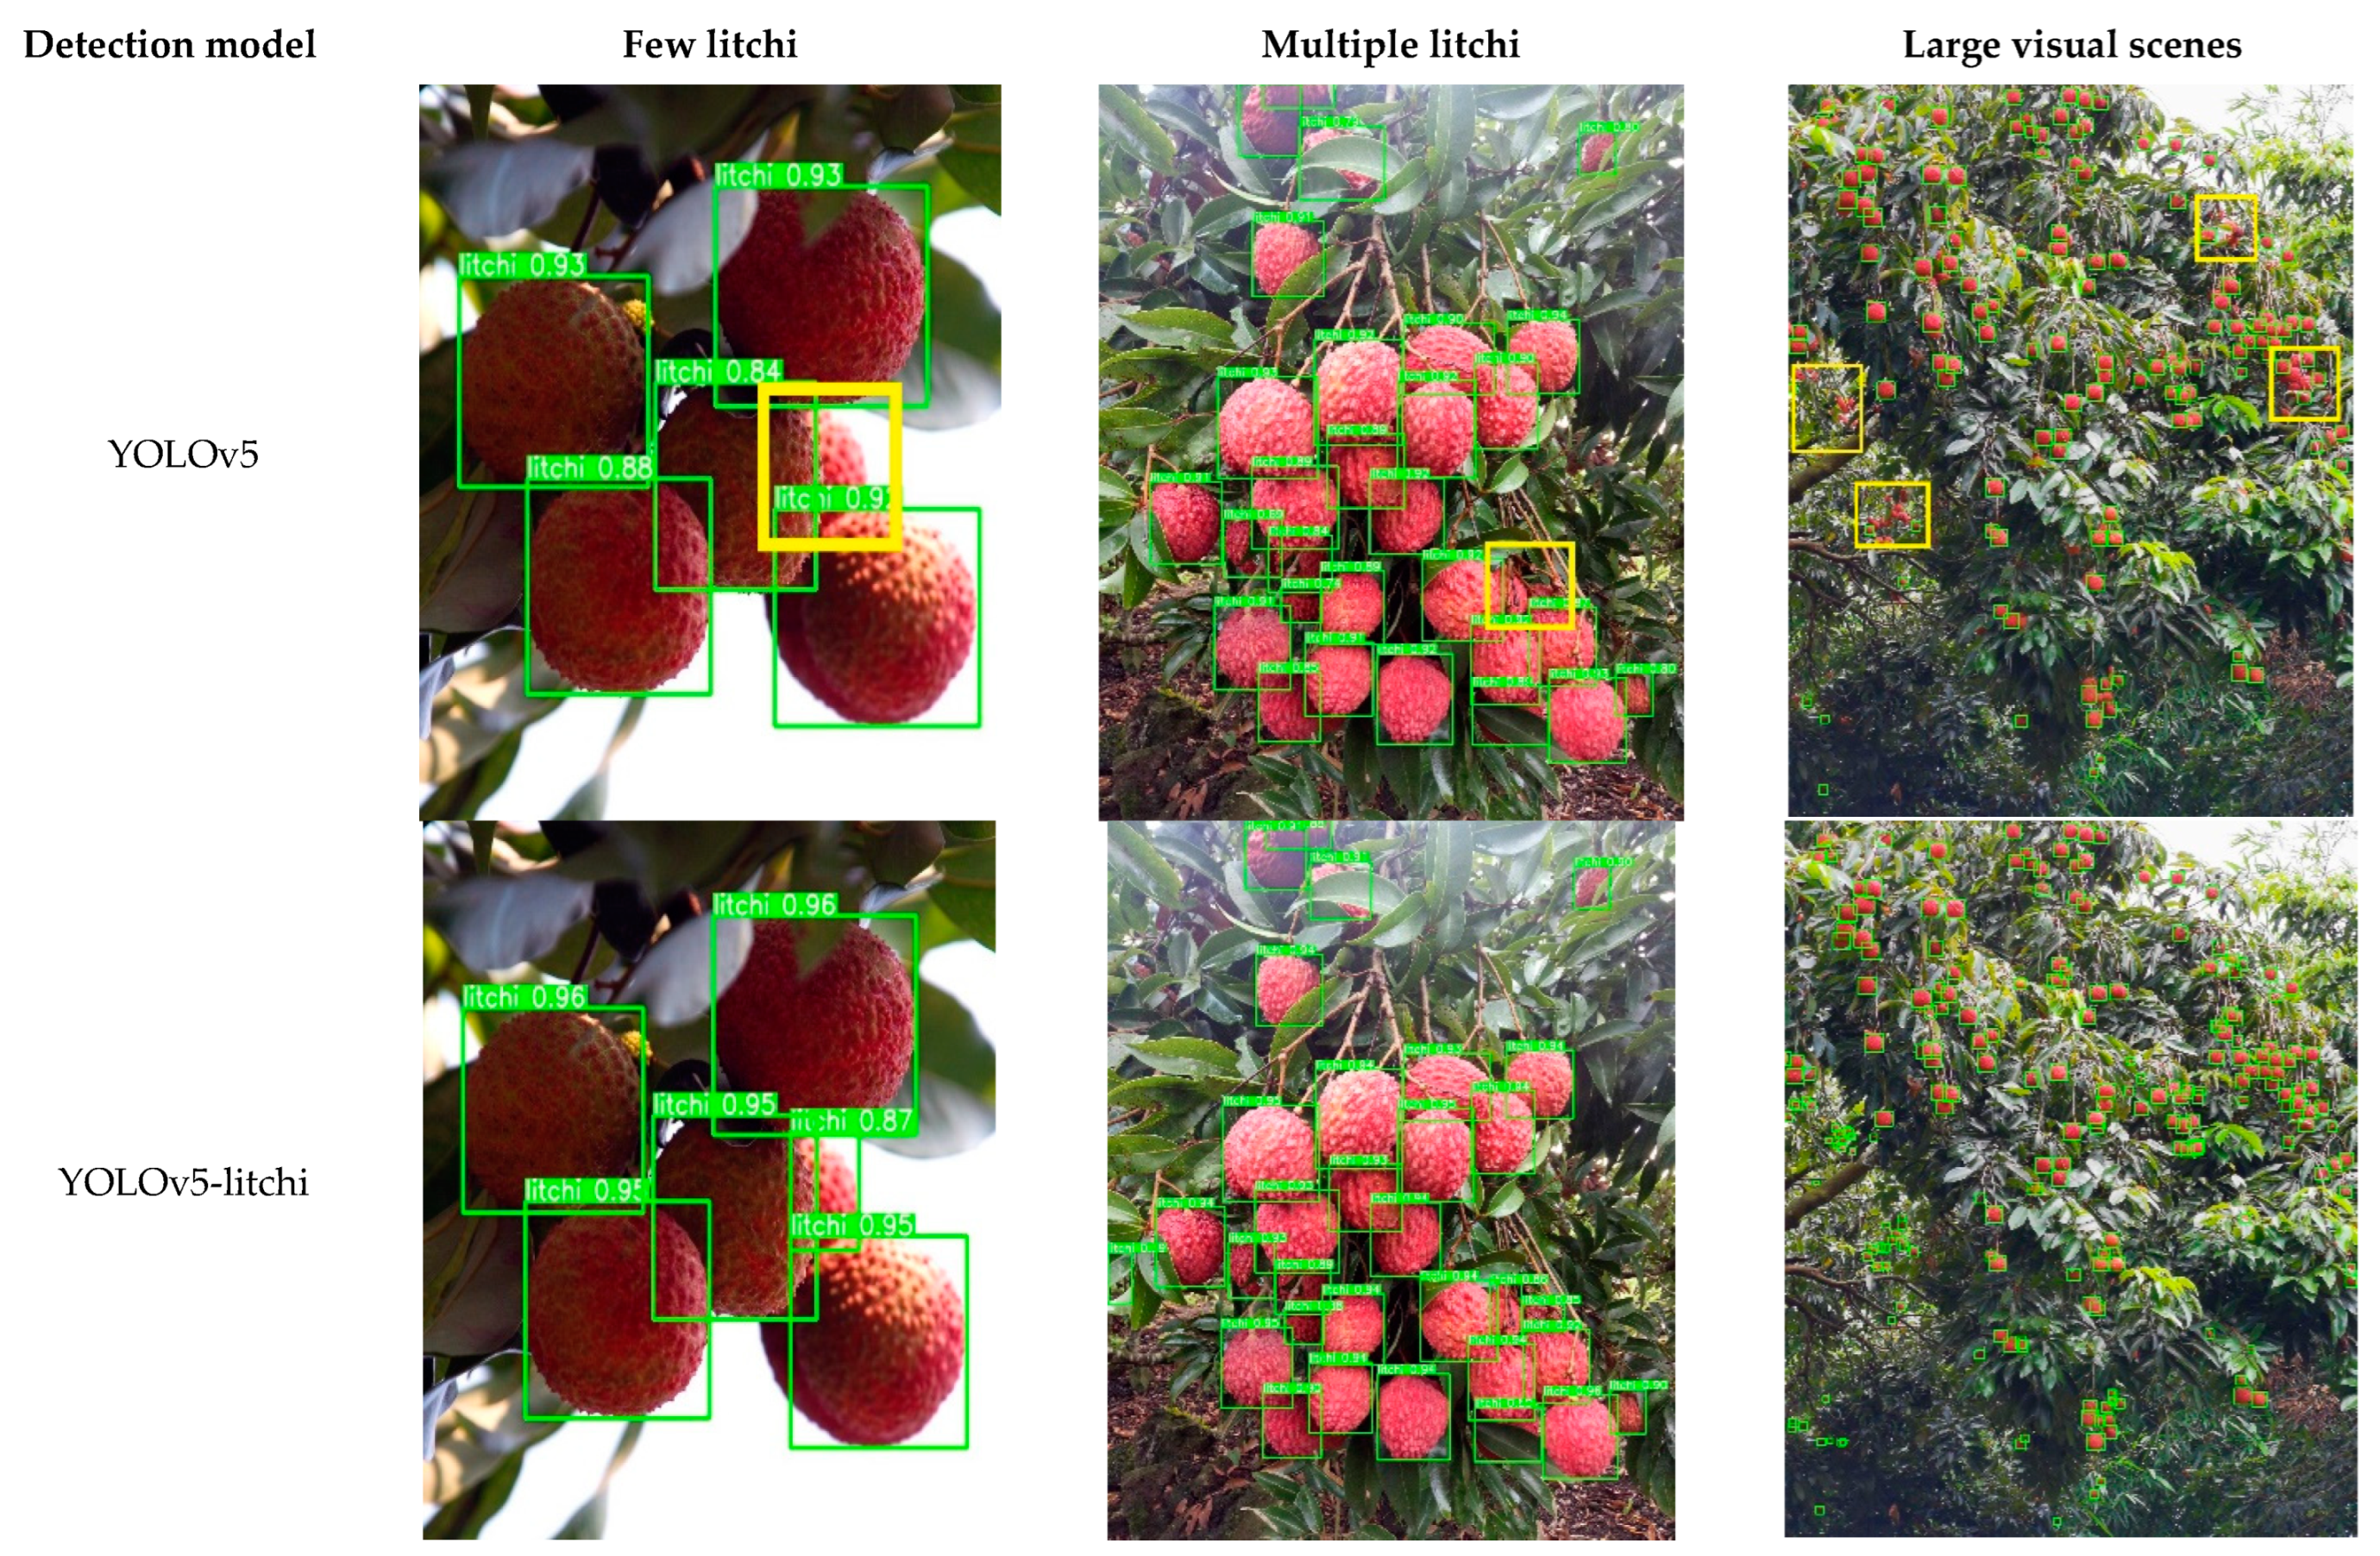
3.3. Comparison of Different Amounts of Litchis

In natural environments, litchis have different degrees of occlusion and overlap. To verify the robustness and practicability of the improved network model, a comparative test was carried out for different amounts of litchis. According to the amount of litchis in each image, the experiments were divided into three groups: few litchis, multiple litchis, and large visual scenes. The few-litchi group contained no more than 10 litchis in each image, and there were few cases of serious occlusion or overlap. The multiple-litchi group contained more than 10 litchis in each image, and the target had different levels of overlap or occlusion. The group of large visual scenes represented the photos shot by UAV or cameras from a long distance. The number of targets in each image was between 100 and 600. In addition, there were a lot of serious overlaps between the branches, leaves, and litchis. At the same time, due to the long shooting distance, the detection difficulty was much harder than that of the other datasets. The above datasets were used to test and compare the performance of the YOLOv5-litchi for different amounts of litchis. Figure 9 presents the results.
As can be seen from the comparison test results in Figure 9, in the whole dataset, YOLOv5-litchi increased mAP by 12.9%. In the group of few-litchi, image had few targets, and the shape and color features of the litchis in the image were not affected by occlusion or overlap, so the litchis were relatively easy to detect. The detection accuracy of the improved algorithm for litchis was increased by 0.9%. This was because the number of litchi fruits in the image did not belong to small objects in the whole image. As the detection effect of the original YOLOv5 model was sufficient, there was little space for the YOLOv5-litchi algorithm to make further improvements. As can be seen from the data in the table, when the number of litchis in each image increased, along with the increasing degree of occlusion and overlap, the YOLOv5-litchi model had a more obvious improvement effect than the original YOLOv5 and the mAP was increased by 6.4%. However, when the test set was under the condition of large visual scenes, the improved YOLOv5 model was able to reach a mAP of 79.2%, which was significantly improvement compared with the original network, with a mAP of 61.8%. Figure 10 shows the detection results of litchis under different conditions before and after the improvement of YOLOv5.
In the comparative test with a small amount of litchis, the unimproved YOLOv5 model missed a target in the image (inside the yellow box in the left in Figure 10). This is because the litchi in the yellow box is largely blocked by the litchis in front of it. At the same time, there are a few conditions, such as strong light, in the dataset that also led the network to miss that litchi. Due to the introduction of Mosaic-9, the improved YOLOv5 increased the richness of images in each round of training, improving the generalization ability of the model, and the problem of insufficient data was solved. In the comparative test with a large amount of litchis, the two targets in the yellow boxes in the middle image represent the target missed by the unimproved model due to a high level of overlap between the litchis and the relative darkness of the image. When the CBAM was added, the improved YOLOv5 could pay more attention to previously missed areas, avoiding missed detection in the figure. Under the condition of large visual scenes, the mAP values of the two networks for litchi detection were somewhat lower than those of the previous two groups of comparison tests. This is because compared with the previous two groups, the target in this group was far away from cameras. However, the improved YOLOv5 model still achieved good detection results. For the original network, it was difficult to detect litchi fruits less than 8 × 8 pixels in size in images of large visual scenes. However, the YOLOv5-litchi model had fewer instances of missed detection in the field due to the addition of a small-object detection layer. At the same time, combined with the other four improved methods, the CBAM enabled the network to focus on the target and reduced the impact of the complex background in the litchi orchard. In addition, the weighted-boxes fusion algorithm of the target box and the use of CIoU as the loss function could accelerate the inferenced speed of the prediction boxes and improved the detection accuracy. Under the condition of large visual scenes, the mAP of the YOLOv5-litchi network was 79.2%, 17.4% higher than that of the unimproved network.

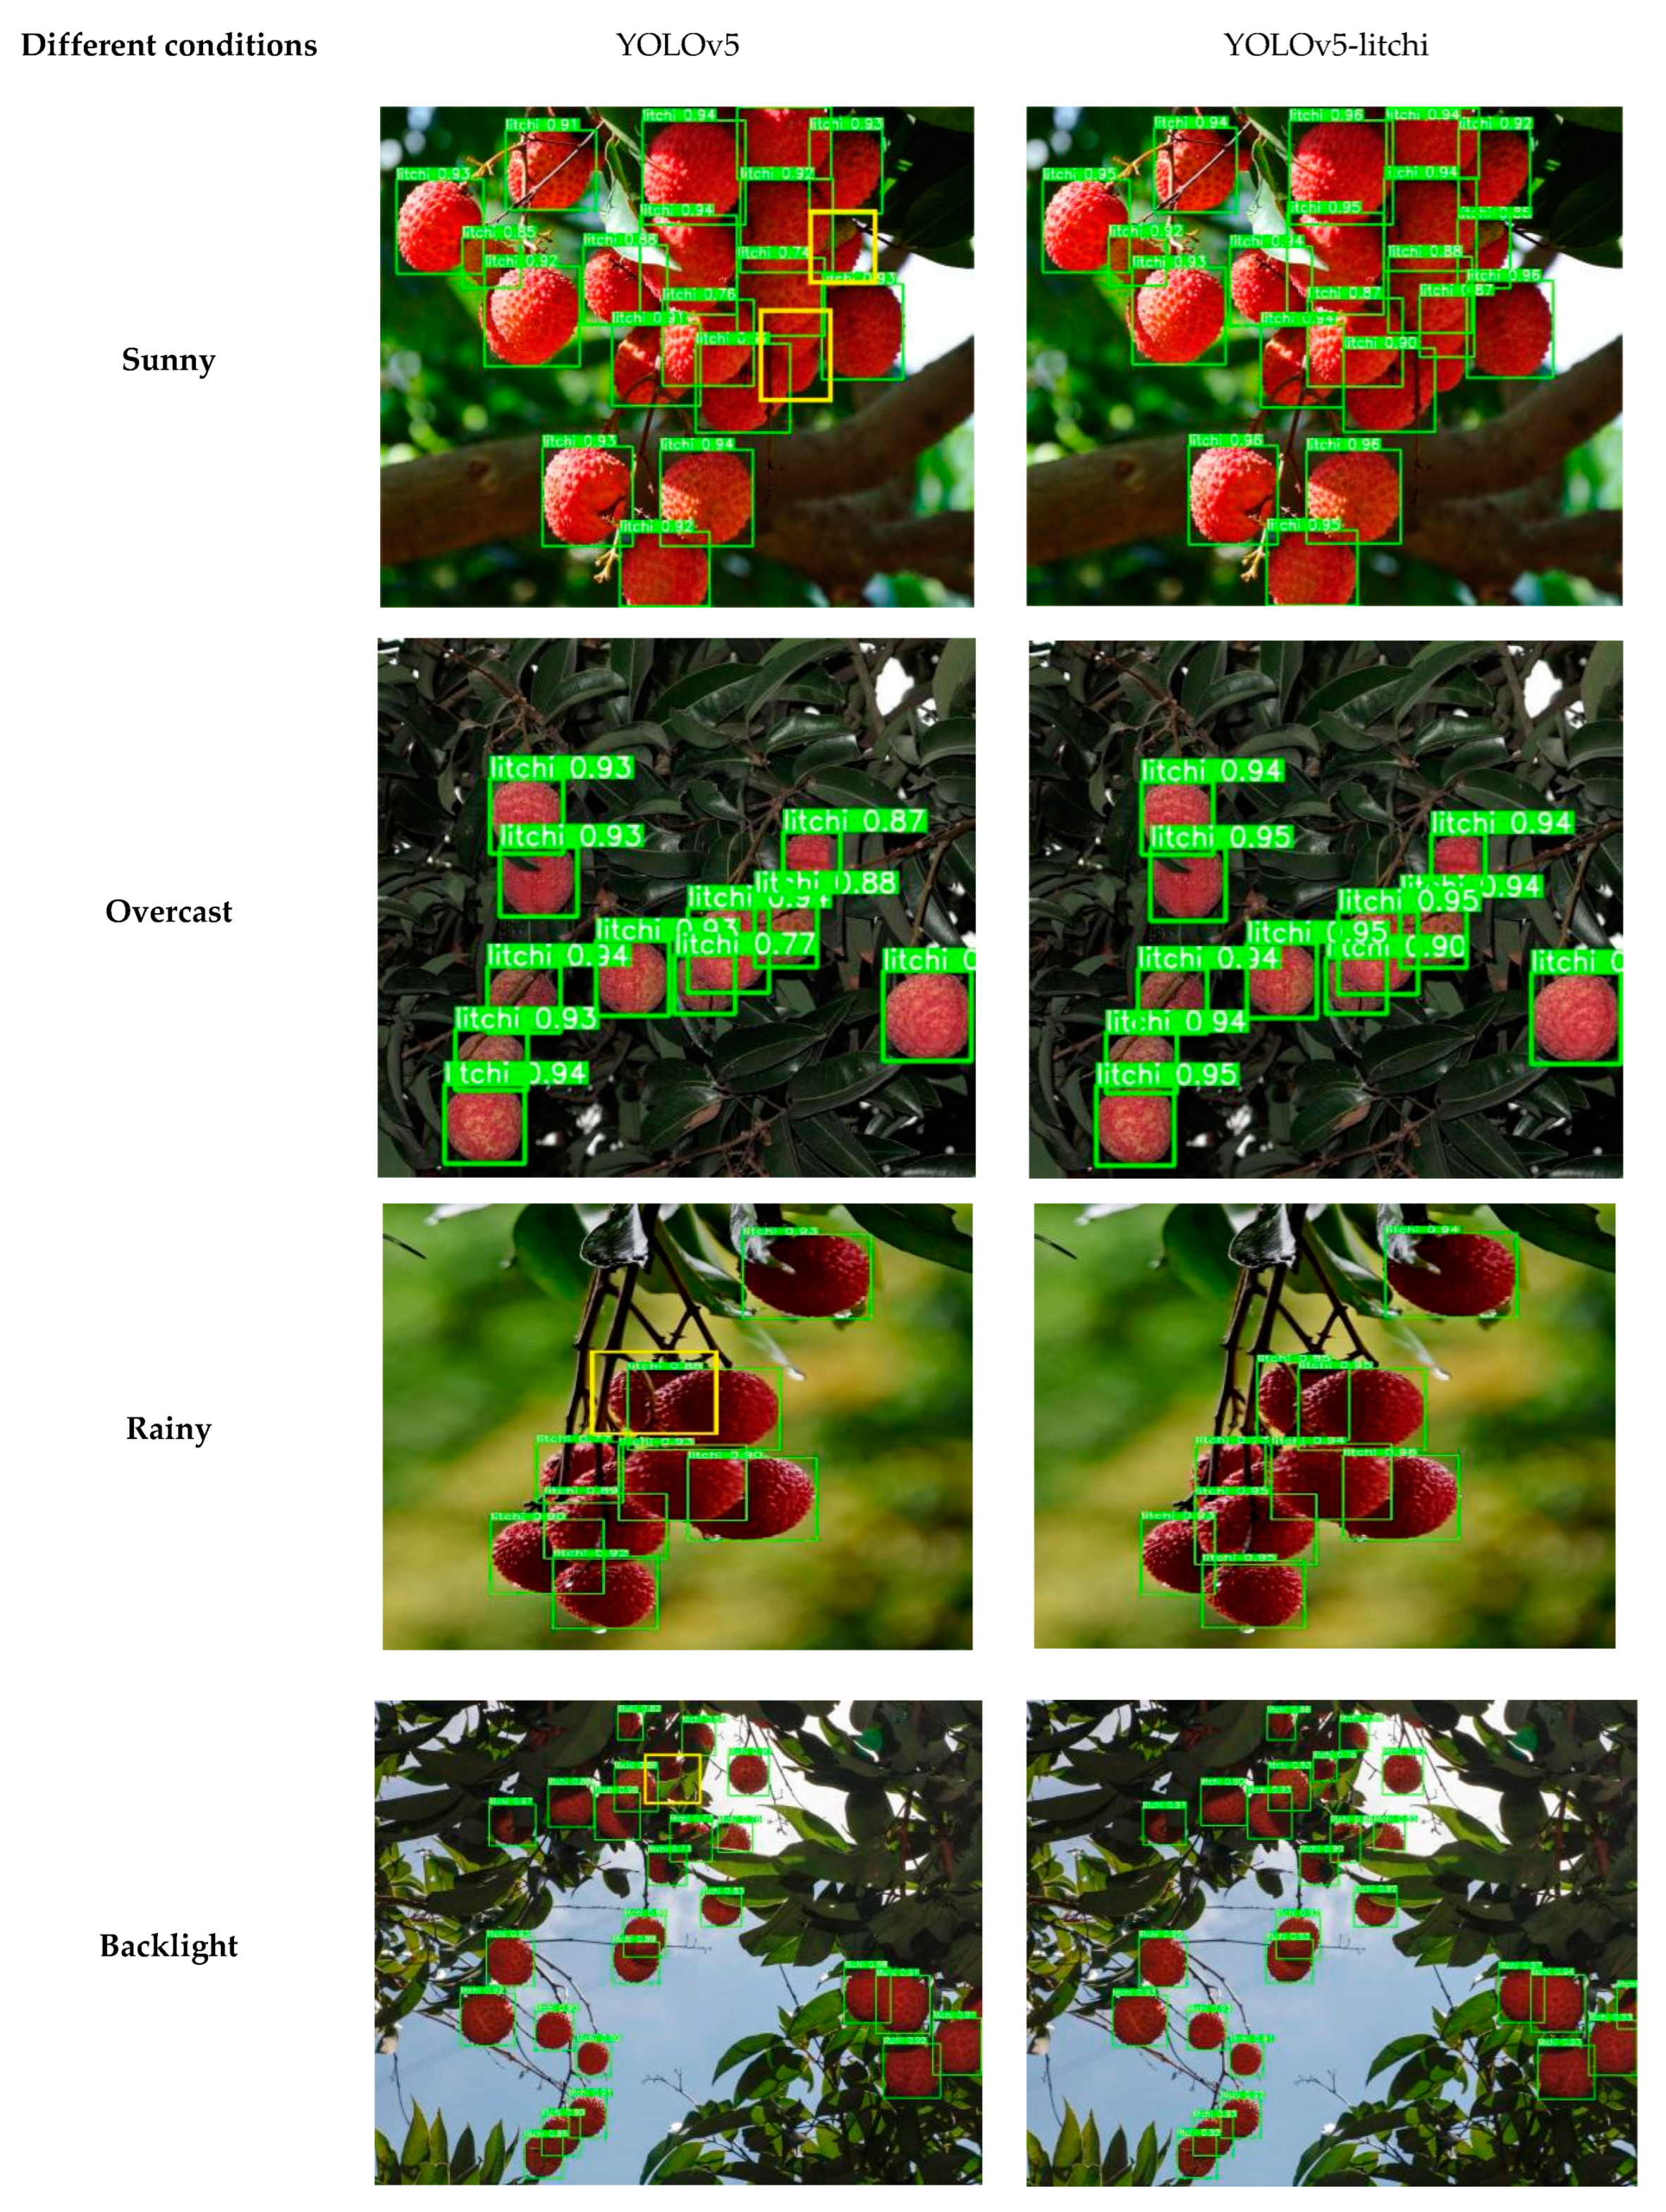
3.4. Comparison of Different Weather Conditions

Different weather conditions had a great influence on the detection effect of litchis. For example, under backlight and overcast conditions, the light was relatively insufficient, resulting in a dark image and more blurring between litchis and the background, which increased the difficulty of extracting feature information in the network training and reduced the precision of the model in detecting litchis. To compare the generalization ability of the YOLOv5-litchi model under different weather conditions, we selected the litchi images from sunny days, overcast days, rainy days, and backlight environments. Table 4 presents a comparison of the detection results and the average confidence obtained after the test, and Figure 11 shows the test results.
In Figure 11, the conditions shown are a sunny day, an overcast day, a rainy day, and a backlight environment, shown by images from the top to the bottom, respectively. The image on the left shows the detection effect of YOLOv5, and the image on the right shows the detection effect of the YOLOv5-litchi model. The yellow boxes represent the litchis missed by YOLOv5, and the green boxes represent the model prediction boxes. Under the condition of sunshine, a high level of overlap between the litchis caused several false predictions by the YOLOv5 model, but the YOLOv5-litchi model showed significantly reduced amounts of false detections and improved the confidence of the detection box. Under the conditions of overcast and rainy days, the YOLOv5-litchi model correctly detected all litchi targets, but the unimproved YOLOv5 model showed one false detection. In the backlight environment, the YOLOv5-litchi model had a lower false detection rate and a higher average confidence of detection than the unimproved model.
The results of all the above tests demonstrate that the YOLOv5-litchi model had obvious advantages in litchi detection in complex natural environments, and the detection effect of the YOLOv5-litchi model was better than that of the original network. In the whole test set, the mAP of the YOLOv5-litchi model could reach a value of 87.1%, which was 12.9% higher than that of the original model. Especially in the case of large visual scenes and large amounts of litchi, the improvement was more significant. The improved model had strong practicability and robustness, with fewer missed detections and false detections. At this stage, the main trend method of fruit tree yield estimation is conducted according to the number of fruits counted by the detection algorithm, and by calculating the average weight of each fruit to give a yield prediction. The improvements mean that the field detection is more accurate and it can produce better yield estimation because of the lower missed detection rate and higher accuracy.

4. Discussion

In this paper, litchis in a complex natural environment were taken as the research objects. Aiming at improving on the shortcomings of the YOLOv5 algorithm, by adding a small-object detection layer, adding a CBAM to each C3, improving Mosaic data enhancement to Mosaic-9, using CIoU as the loss function, and introducing weighted-boxes fusion for prediction boxes, we proposed a YOLOv5-litchi network model for litchi detection in litchi orchards. The performance of the model in detecting litchis in a complex natural environment was effectively improved. The main conclusions of this paper are as follows:
(1) At present, the main research objects of fruit detection in agriculture are apples, citrus fruits, and mangoes, which are large in size and have no severe occlusion. Since there are few studies on litchis, in this paper, we proposed a kind of litchi detection algorithm called YOLOv5-litchi. It is proposed for litchi detection in different complex natural environments. In the ablation tests, after the improvement, the mAP of the YOLOv5-litchi network in the test set was increased by 12.9%, the recall was increased by 15%, the precision reached 90.9%, the F1-score value was 0.86, and the loss value in the training set was only 0.032. It is clear that all the major indicators were significantly better in the improved model than in the original YOLOv5 network. The YOLOv5-litchi model had fewer missed detections and higher accuracy than other models, which means that the YOLOv5-litchi can provide a more reliable support for litchi detection.
(2) According to the natural environment of litchi orchards, a variety of equipment were used to shoot litchis in the complex natural environment to produce a litchi dataset for this paper. The YOLOv5-litchi model was compared with traditional networks, such as SSD, YOLOv4, unimproved YOLOv5, and Faster-RCNN. The results of the tests showed that the improved YOLOv5 had gained a good balance in model size, precision, and detection time. The mAP and recall values for litchi detection in the test set were 87.1% and 81.1%, respectively. The two most important indicators were also the best among the five different network models. The average detection time in the test set was 25 ms for each image, which is significantly better than the average detection times of Faster-RCNN and YOLOv4 and basically meets the demand of real-time detection in agriculture by providing technical support for automatic robot picking.
(3) With the development of intelligent orchards, deep learning has been used to predict crop yield. The most important step of yield prediction is to count the number of fruits. In this paper, YOLOv5-litchi was improved on the basis of growth conditions and the characteristics of litchis. YOLOv5-litchi can solve the problems of the missed detection and false detection of litchis in a complex natural environment in some ways. The mAP of the YOLOv5-litchi for litchi detection under the condition of large visual scenes was 79.2%. At this stage, the YOLOv5-litchi model can provide technical support for litchi yield estimation.

Author Contributions

Conceptualization, J.X. and J.P.; methodology, J.X. and J.P.; software, J.P.; validation, J.X. and J.P.; formal analysis, B.C. and T.J.; investigation, J.X. and J.P.; resources, J.X. and J.P.; data curation, T.J. and R.Y.; writing—original draft preparation, J.X. and J.P.; writing—review and editing, J.X. and D.S.; visualization, J.W. and J.P.; supervision, P.G. and J.L. (Jianqiang Lu); project administration, W.W. and J.L. (Jun Li). All authors have read and agreed to the published version of the manuscript.

Funding

This research was funded by Independent Research and Development Projects of Maoming Laboratory (No. 2021ZZ002). It was also partly supported by Co-constructing Cooperative Project on Agricultural Sci-tech of New Rural Development Research Institute of South China Agricultural University (No. 2021XNYNYKJHZGJ032); China Agriculture Research System of MOF and MARA (No. CARS-32-14); Guangdong Province Rural Revitalization Strategy Projects (No. TS-1-4); Laboratory of Lingnan Modern Agriculture Project (No. NT2021009); Guangdong Science and Technology Innovation Cultivation Special Fund Project for College Students (“Climbing Program” Special Fund)(No. pdjh2023a0074 and No. pdjh2021b0077); and National College Students’ innovation and entrepreneurship training program (No. 202110564044).

Data Availability Statement

The data presented in this study are available on request from the corresponding author. The data are not publicly available due to the privacy policy of the organization.

Acknowledgments

The authors would like to thank the anonymous reviewers for their critical comments and suggestions for improving the manuscript.

Conflicts of Interest

The authors declare no conflict of interest.

References

  1. Xiong, J.; Lin, R.; Liu, Z.; He, Z.; Tang, L.; Yang, Z.; Zou, X. The Recognition of Litchi Clusters and the Calculation of Picking Point in a Nocturnal Natural Environment. Biosyst. Eng. 2018, 166, 44–57. [Google Scholar] [CrossRef]
  2. Liang, C.; Xiong, J.; Zheng, Z.; Zhong, Z.; Li, Z.; Chen, S.; Yang, Z. A Visual Detection Method for Nighttime Litchi Fruits and Fruiting Stems. Comput. Electron. Agric. 2020, 169, 105192. [Google Scholar] [CrossRef]
  3. Qi, X.; Dong, J.; Lan, Y.; Zhu, H. Method for Identifying Litchi Picking Position Based on YOLOv5 and PSPNet. Remote Sens. 2022, 14, 2004. [Google Scholar] [CrossRef]
  4. Xie, J.; Chen, Y.; Gao, P.; Sun, D.; Xue, X.; Yin, D.; Han, Y.; Wang, W. Smart Fuzzy Irrigation System for Litchi Orchards. Comput. Electron. Agric. 2022, 201, 107287. [Google Scholar] [CrossRef]
  5. Ramos, P.J.; Prieto, F.A.; Montoya, E.C.; Oliveros, C.E. Automatic Fruit Count on Coffee Branches Using Computer Vision. Comput. Electron. Agric. 2017, 137, 9–22. [Google Scholar] [CrossRef]
  6. Aquino, A.; Millan, B.; Diago, M.-P.; Tardaguila, J. Automated Early Yield Prediction in Vineyards from On-the-Go Image Acquisition. Comput. Electron. Agric. 2018, 144, 26–36. [Google Scholar] [CrossRef]
  7. Chen, M.; Tang, Y.; Zou, X.; Huang, Z.; Zhou, H.; Chen, S. 3D Global Mapping of Large-Scale Unstructured Orchard Integrating Eye-in-Hand Stereo Vision and SLAM. Comput. Electron. Agric. 2021, 187, 106237. [Google Scholar] [CrossRef]
  8. de Castro, F.; Gladston, A. Detection of Small Oranges Using YOLOv3 Feature Pyramid Mechanism. Int. J. Nat. Comput. Res. 2021, 10, 23–37. [Google Scholar] [CrossRef]
  9. Maheswari, P.; Raja, P.; Apolo-Apolo, O.E.; Pérez-Ruiz, M. Intelligent Fruit Yield Estimation for Orchards Using Deep Learning Based Semantic Segmentation Techniques—A Review. Front. Plant Sci. 2021, 12, 684328. [Google Scholar] [CrossRef]
  10. Yu, H.; Song, S.; Ma, S.; Sinnott, R.O. Estimating Fruit Crop Yield through Deep Learning. In Proceedings of the 6th IEEE/ACM International Conference on Big Data Computing, Applications and Technologies, Auckland, New Zealand, 2 December 2019; Association for Computing Machinery: New York, NY, USA, 2019; pp. 145–148. [Google Scholar]
  11. Zhuang, J.; Hou, C.; Tang, Y.; He, Y.; Guo, Q.; Zhong, Z.; Luo, S. Computer Vision-Based Localisation of Picking Points for Automatic Litchi Harvesting Applications towards Natural Scenarios. Biosyst. Eng. 2019, 187, 1–20. [Google Scholar] [CrossRef]
  12. Fu, L.; Yang, Z.; Wu, F.; Zou, X.; Lin, J.; Cao, Y.; Duan, J. YOLO-Banana: A Lightweight Neural Network for Rapid Detection of Banana Bunches and Stalks in the Natural Environment. Agronomy 2022, 12, 391. [Google Scholar] [CrossRef]
  13. Koirala, A.; Walsh, K.B.; Wang, Z.; McCarthy, C. Deep Learning–Method Overview and Review of Use for Fruit Detection and Yield Estimation. Comput. Electron. Agric. 2019, 162, 219–234. [Google Scholar] [CrossRef]
  14. Fu, L.; Gao, F.; Wu, J.; Li, R.; Karkee, M.; Zhang, Q. Application of Consumer RGB-D Cameras for Fruit Detection and Localization in Field: A Critical Review. Comput. Electron. Agric. 2020, 177, 105687. [Google Scholar] [CrossRef]
  15. Chen, Y.; Lee, W.S.; Gan, H.; Peres, N.; Fraisse, C.; Zhang, Y.; He, Y. Strawberry Yield Prediction Based on a Deep Neural Network Using High-Resolution Aerial Orthoimages. Remote Sens. 2019, 11, 1584. [Google Scholar] [CrossRef] [Green Version]
  16. Wang, Z.; Walsh, K.; Koirala, A. Mango Fruit Load Estimation Using a Video Based MangoYOLO—Kalman Filter—Hungarian Algorithm Method. Sensors 2019, 19, 2742. [Google Scholar] [CrossRef] [PubMed] [Green Version]
  17. Fu, L.; Feng, Y.; Wu, J.; Liu, Z.; Gao, F.; Majeed, Y.; Al-Mallahi, A.; Zhang, Q.; Li, R.; Cui, Y. Fast and Accurate Detection of Kiwifruit in Orchard Using Improved YOLOv3-Tiny Model. Precis. Agric. 2021, 22, 754–776. [Google Scholar] [CrossRef]
  18. Sozzi, M.; Cantalamessa, S.; Cogato, A.; Kayad, A.; Marinello, F. Automatic Bunch Detection in White Grape Varieties Using YOLOv3, YOLOv4, and YOLOv5 Deep Learning Algorithms. Agronomy 2022, 12, 319. [Google Scholar] [CrossRef]
  19. HongXing, P.; Bo, H.; YuanYuan, S.; ZeSen, L.; ChaoWu, Z.; Yan, C.; JunTao, X. General improved SSD model for picking object recognition of multiple fruits in natural environment. Trans. Chin. Soc. Agric. Eng. 2018, 34, 155–162. [Google Scholar]
  20. Tian, Y.; Yang, G.; Wang, Z.; Wang, H.; Li, E.; Liang, Z. Apple Detection during Different Growth Stages in Orchards Using the Improved YOLO-V3 Model. Comput. Electron. Agric. 2019, 157, 417–426. [Google Scholar] [CrossRef]
  21. Gao, F.; Fu, L.; Zhang, X.; Majeed, Y.; Li, R.; Karkee, M.; Zhang, Q. Multi-Class Fruit-on-Plant Detection for Apple in SNAP System Using Faster R-CNN. Comput. Electron. Agric. 2020, 176, 105634. [Google Scholar] [CrossRef]
  22. Dorj, U.-O.; Lee, M.; Yun, S. An Yield Estimation in Citrus Orchards via Fruit Detection and Counting Using Image Processing. Comput. Electron. Agric. 2017, 140, 103–112. [Google Scholar] [CrossRef]
  23. Bargoti, S.; Underwood, J.P. Image Segmentation for Fruit Detection and Yield Estimation in Apple Orchards. J. Field Robot. 2017, 34, 1039–1060. [Google Scholar] [CrossRef] [Green Version]
  24. Zhou, Z.; Song, Z.; Fu, L.; Gao, F.; Li, R.; Cui, Y. Real-Time Kiwifruit Detection in Orchard Using Deep Learning on AndroidTM Smartphones for Yield Estimation. Comput. Electron. Agric. 2020, 179, 105856. [Google Scholar] [CrossRef]
  25. Apolo-Apolo, O.E.; Martínez-Guanter, J.; Egea, G.; Raja, P.; Pérez-Ruiz, M. Deep Learning Techniques for Estimation of the Yield and Size of Citrus Fruits Using a UAV. Eur. J. Agron. 2020, 115, 126030. [Google Scholar] [CrossRef]
  26. Mekhalfi, M.L.; Nicolò, C.; Ianniello, I.; Calamita, F.; Goller, R.; Barazzuol, M.; Melgani, F. Vision System for Automatic On-Tree Kiwifruit Counting and Yield Estimation. Sensors 2020, 20, 4214. [Google Scholar] [CrossRef]
  27. Yang, B.; Gao, Z.; Gao, Y.; Zhu, Y. Rapid Detection and Counting of Wheat Ears in the Field Using YOLOv4 with Attention Module. Agronomy 2021, 11, 1202. [Google Scholar] [CrossRef]
  28. Osman, Y.; Dennis, R.; Elgazzar, K. Yield Estimation and Visualization Solution for Precision Agriculture. Sensors 2021, 21, 6657. [Google Scholar] [CrossRef]
  29. Peng, H.; Xue, C.; Shao, Y.; Chen, K.; Liu, H.; Xiong, J.; Chen, H.; Gao, Z.; Yang, Z. Litchi Detection in the Field Using an Improved YOLOv3 Model. Int. J. Agric. Biol. Eng. 2022, 15, 211–220. [Google Scholar] [CrossRef]
  30. Wu, J.; Zhang, S.; Zou, T.; Dong, L.; Peng, Z.; Wang, H. A Dense Litchi Target Recognition Algorithm for Large Scenes. Math. Probl. Eng. 2022, 2022, 4648105. [Google Scholar] [CrossRef]
  31. Wang, H.; Dong, L.; Zhou, H.; Luo, L.; Lin, G.; Wu, J.; Tang, Y. YOLOv3-Litchi Detection Method of Densely Distributed Litchi in Large Vision Scenes. Math. Probl. Eng. 2021, 2021, 8883015. [Google Scholar] [CrossRef]
  32. Peng, H.; Li, J.; Xu, H.; Chen, H.; Xing, Z.; He, H.; Xiong, J. Litchi detection based on multiple feature enhancement and feature fusion SSD. Trans. Chin. Soc. Agric. Eng. 2022, 38, 169–177. [Google Scholar]
  33. Woo, S.; Park, J.; Lee, J.-Y.; Kweon, I.S. CBAM: Convolutional Block Attention Module. In Proceedings of the European Conference on Computer Vision (ECCV), Munich, Germany, 8–14 September 2018; pp. 3–19. [Google Scholar]
  34. Xue, Z.; Lin, H.; Wang, F. A Small Target Forest Fire Detection Model Based on YOLOv5 Improvement. Forests 2022, 13, 1332. [Google Scholar] [CrossRef]
  35. Liu, H.; Sun, F.; Gu, J.; Deng, L. SF-YOLOv5: A Lightweight Small Object Detection Algorithm Based on Improved Feature Fusion Mode. Sensors 2022, 22, 5817. [Google Scholar] [CrossRef] [PubMed]
  36. Zhang, B.; Sun, C.-F.; Fang, S.-Q.; Zhao, Y.-H.; Su, S. Workshop Safety Helmet Wearing Detection Model Based on SCM-YOLO. Sensors 2022, 22, 6702. [Google Scholar] [CrossRef]
  37. Zhang, L.; Li, Y.; Chen, H.; Wu, W.; Chen, K.; Wang, S. Anchor-Free YOLOv3 for Mass Detection in Mammogram. Expert Syst. Appl. 2022, 191, 116273. [Google Scholar] [CrossRef]
  38. Xue, J.; Cheng, F.; Li, Y.; Song, Y.; Mao, T. Detection of Farmland Obstacles Based on an Improved YOLOv5s Algorithm by Using CIoU and Anchor Box Scale Clustering. Sensors 2022, 22, 1790. [Google Scholar] [CrossRef]
  39. Solovyev, R.; Wang, W.; Gabruseva, T. Weighted Boxes Fusion: Ensembling Boxes from Different Object Detection Models. Image Vis. Comput. 2021, 107, 104117. [Google Scholar] [CrossRef]
Figure 1. The composition of the dataset.
Agronomy 12 03054 g001
Figure 2. Data augmentation of the dataset.
Agronomy 12 03054 g002
Figure 3. A chart of the convolutional block attention module.
Agronomy 12 03054 g003
Figure 4. YOLOv5-litchi network structure.
Agronomy 12 03054 g004
Figure 5. A flow chart of Mosaic-9 data augmentation.
Agronomy 12 03054 g005
Figure 6. A diagram of the CIoU loss function.
Agronomy 12 03054 g006
Figure 7. A comparison of the results of NMS and WBF.
Agronomy 12 03054 g007
Figure 8. The mAP (left) and training loss (right) of the ablation experiments.
Agronomy 12 03054 g008
Figure 9. Comparison of different conditions.
Agronomy 12 03054 g009
Figure 10. The detection effects of different amounts of litchis before and after improvement.
Agronomy 12 03054 g010
Figure 11. A comparison of litchi detection under different weather conditions before and after improvement.
Agronomy 12 03054 g011
Table 1. Experimental environment.
ConfigurationParameter
CPUIntel (R) Xeon (R) Gold 6240 [email protected] GHz
GPUNvidia RTX 3090*2
Operating systemWindows 10
Development environmentPycharm professional edition
LibraryPython 3.8, PyTorch 1.7
Table 2. Comparison of the ablation experiments.
ModelPrecision (%)F1 ScoreTraining LossRecall (%)mAP(%)
YOLOv584.60.740.05966.174.2
YOLOv5-M984.70.750.05767.975.7
YOLOv5-CIoU86.70.770.05668.977.3
YOLOv5-WBF85.00.770.05470.077.5
YOLOv5-CBAM87.20.800.04672.880.1
YOLOv5-SL87.30.800.04473.180.5
YOLOv5-SL-CBAM87.70.830.04178.484.5
YOLOv5-SL-CBAM-M988.80.830.03978.384.9
YOLOv5-SL-CBAM-M9-CIoU89.50.840.03679.885.9
YOLOv5-litchi90.90.860.03281.187.1
Table 3. Comparison of five detection models.
Detection ModelBackbone NetworkModel Size (Mb)mAP(%)Recall (%)Detection Time (ms)
SSDVGG16157.070.1%59.8%14.5
Faster-RCNNResNet-50315.076.5%76.2%93.8
YOLOv4CSPDarknet53244.072.6%65.2%43.2
YOLOv5CSPDarknet5340.474.2%66.1%15.8
YOLOv5-litchiCSPDarknet5344.887.1%81.1%25.0
Table 4. The test results under different weather conditions.
Weather ConditionDetection AlgorithmReal NumbersPredicted NumbersAverage Confidence (%)
SunnyYOLOv5211889.5%
YOLOv5-litchi212092.7%
OvercastYOLOv5111190.8%
YOLOv5-litchi111194.1%
RainyYOLOv59889.0%
YOLOv5-litchi9991.1%
BacklightYOLOv5282486.3%
YOLOv5-litchi282690.7%
Publisher’s Note: MDPI stays neutral with regard to jurisdictional claims in published maps and institutional affiliations.

