Article

Carbon Dioxide Efflux of Bare Soil as a Function of Soil Temperature and Moisture Content under Weather Conditions of Warm, Temperate, Dry Climate Zone

1
Faculty of Agricultural and Food Sciences and Environmental Management, Institute of Land Use, Engineering, and Precision Farming Technology, University of Debrecen, H-4032 Debrecen, Hungary
2
Faculty of Economics and Business, Institute of Statistics and Methodology, University of Debrecen, H-4032 Debrecen, Hungary
3
Karcag Research Institute, Hungarian University of Agriculture and Life Sciences, H-5300 Karcag, Hungary
4
Kálmán Kerpely Doctoral School, University of Debrecen, H-4032 Debrecen, Hungary
*
Author to whom correspondence should be addressed.
Agronomy 2022, 12(12), 3050; https://doi.org/10.3390/agronomy12123050
Submission received: 15 September 2022 / Revised: 23 November 2022 / Accepted: 29 November 2022 / Published: 1 December 2022

Abstract

:
It is difficult to estimate the contribution of individual sources to the total CO2 efflux from soil with vegetation. Long-term experiments with bare soil will provide useful conclusions. In this study, we aimed to mathematize the effect of soil temperature and soil moisture content on bare soil CO2 efflux in a four-season semiarid region to assess the adequacy of different models and to enable future predictions by seasons. We proved that the exponential model adequately described the relationship between the CO2 efflux and the soil temperature. The model calculations showed no significant relationship in the case of an additional quadratic exponential function, while, in the case of the linear model, the homoscedasticity criteria were not met, and the accuracy of the estimation was found to be dependent on the level of CO2 efflux. When the soil moisture content with either an exponential function or power was added to the exponential formula, the models did not provide more accurate results. Our findings confirm that the best-fitting models are dependent on the local environmental conditions, and there are areas in which the moisture content does not significantly affect the CO2 efflux of bare soil. Using trends in historical hourly temperature data in the exponential model, the CO2 emission was estimated to be in the range 772–898 g m−2 y−1 in 2050 in the location we used. Trends in climate change are expected to have considerable effects on the processes that govern the CO2 emissions of soil.

1. Introduction

Soil carbon dioxide efflux results from microbial production and gas diffusion. The gas exchange of sterilized soil at normal temperatures is not significant in comparison with the respiration [1]. Under field conditions, it is difficult to separately investigate root respiration and rhizomicrobial respiration and determine the effects of roots on the decompositions of soil organic matter. The flux of plant-derived CO2 masks the contribution of soil–organic matter-derived CO2 [2]. At the global scale, the mean soil CO2 efflux of bare soil was calculated to be 282–476 g C m−2 y−1 [3].
In general, the CO2 efflux correlates with precipitation and temperature. However, the overall effect of the soil moisture content and temperature differs by climate zone and seasons. For example, in a short laboratory experiment, rewetting dry soil in a tropical forest did not affect the soil respiration rate [4]. Similarly, at the field scale, the CO2 flux rate did not change significantly under the simulated rain conditions [5]. In dry areas, however, the soil’s microbiological activity quickly responds to changes in the soil moisture content, e.g., under laboratory conditions, the microbial biomass carbon level was found to be approximately two-fold higher within 3 h after rewetting soils in a hot, rain-free season [6]. Similarly, in a semiarid region, after a simulation of 24 mm of rainfall in the summer, the soil CO2 efflux was 2.5 times higher [7]. The significance of the effect of the soil moisture content on the CO2 efflux of bare soil can be assumed to be highly dependent on the climatic conditions.
Generally, increasing the temperature accelerates microbial activity. By screening soils from the Arctic to the Amazon, the microbial response to increasing the air temperature was mostly found to enhance the temperature sensitivity of soil microbial respiration [8]. The influence of precipitation was proven to be secondary to that of the temperature when viewed at the global scale [3]. However, in a subarctic region, the response of CO2 production in bare soil to increases in the soil temperature was found to be more sensitive in wet soils [9]. In a study, variations in the soil water content were proven to have a stronger effect when the soil temperature was higher. The soil temperature was found to become a limiting factor of CO2 efflux out of the growing season and in the dry season [10]. In a semiarid region, the soil temperature and moisture content were found to have greater impacts on soil respiration in the winter [11]. Based on these examples, it is shown that the contribution of the two differs by regions and seasons. When soil moisture is limited, soil respiration decreases considerably, and soil moisture exerts control over the CO2 efflux [12]. A longer period with a relatively high moisture content can ensure more favorable living conditions for microbes. Sudden water input, i.e., natural precipitation and irrigation causing a sudden increase in the soil moisture content, generally does not result in the sudden propagation of soil microbes and, hence, does not increase CO2 emissions in the short term [13].
Several studies [14,15] aimed to investigate the effect of the soil temperature and moisture content on soil CO2 efflux as the main controlling factors. An advantage of these parameters is that they can be continuously monitored in high time resolutions, providing adequate datasets for model calculations. The data gained under different environmental and experimental conditions have been described using many different mathematical models with variable results. For example, based on global, monthly climate data, a log-transformed and an untransformed model were suggested in which terrestrial soil CO2 emissions significantly and linearly correlated with the published estimates of annual fluxes [3]. In another study, correlations between the CO2 flux and soil temperature were found, but significant correlations in each year were not shown [11]. Some researchers concluded that the exponential and linear relationships between the soil temperature and soil respiration rate do not provide unbiased estimates [16]. In a further study, the soil CO2 efflux was described using an exponential function of the soil temperature, and the temperature-normalized CO2 fluxes were found to relate to the soil water content with a positive linear relationship [17]. When the correlation of soil respiration with the soil temperature and moisture contents was described by a two-variable exponential–power model, the soil respiration’s sensitivity to moisture was reported to increase with the increasing soil temperature [14]. In the winter period, the temperature sensitivity negatively correlated with the average soil temperature and moisture, described by exponential and power functions, respectively [11]. Under some circumstances, no significant correlation could be found between the soil CO2 emissions and the soil temperature (e.g., [15]). In a further study, it was shown that exponential and Lloyd and Taylor functions relating CO2 efflux to the soil temperature could be used to predict soil respiration when the soil water content was above 1/3 of the water-holding capacity. When combining the two parameters into one integrated model, four types of regression equations were successfully established for use in estimating the seasonal changes in CO2 efflux [12].
Mathematical descriptions of the contribution of bare soil to the overall CO2 efflux in different climate zones are necessary to draw realistic conclusions. Furthermore, the systematic comparison of the adequacy of different models, as highlighted decades ago [16], remains of scientific interest. In addition, to the best of our knowledge, seasonal predictions of future CO2 emissions using historical, long-term, daily weather data have not yet been published.
Based on this, our objectives were (1) to investigate the explanatory force of the soil temperature and soil moisture contents as variants to the CO2 efflux of bare soil using long-term field data gained under natural environmental conditions in a continental region with a four-season climate in Hungary; (2) to assess the adequacy of different mathematical models appearing in the literature, such as linear, exponential, quadratic exponential, and exponential combined with power function; and (3) to provide estimations of CO2 emissions of bare soil using the model found adequate for use in this region.

2. Materials and Methods

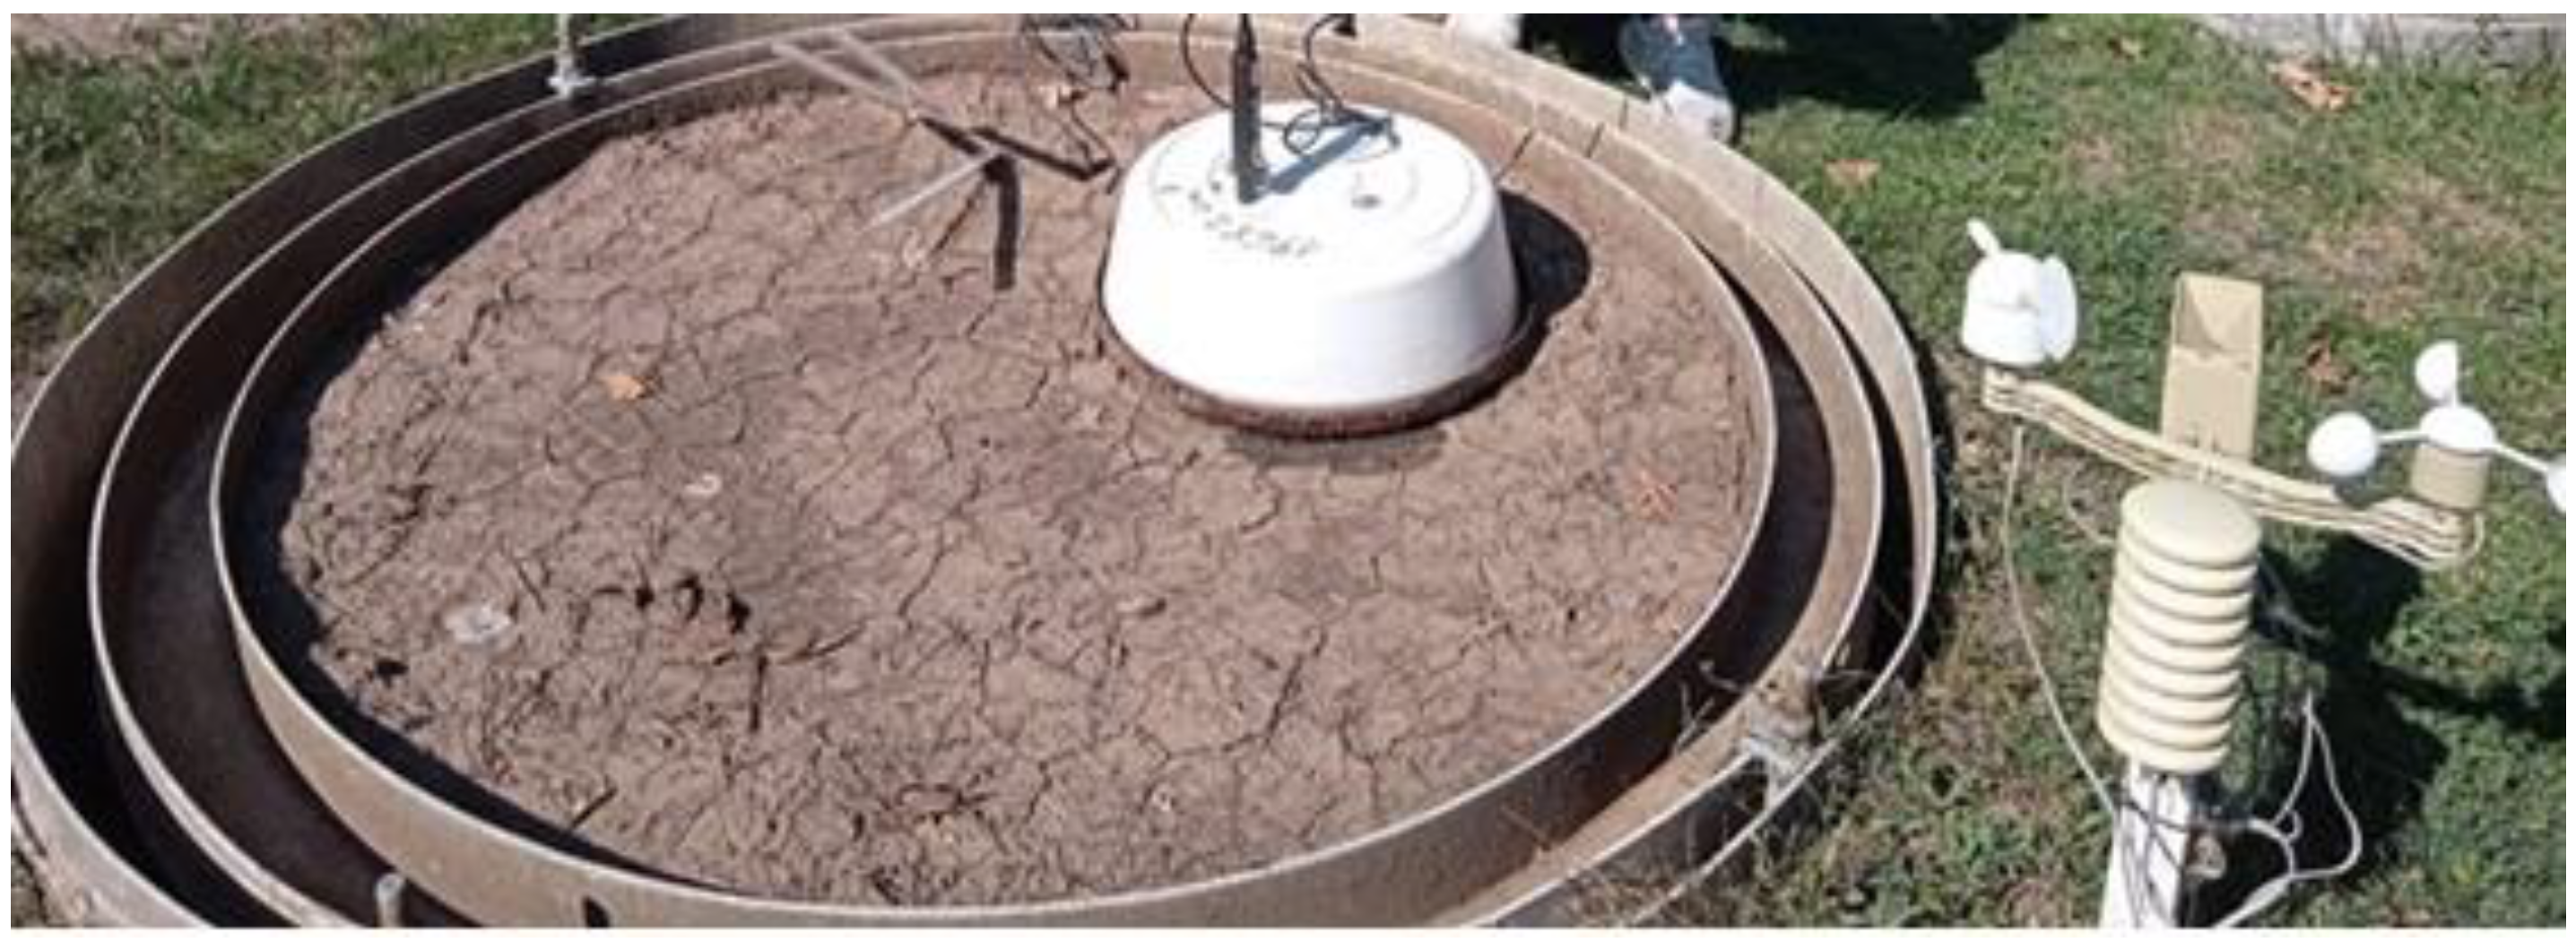
2.1. Experimental Site and Measurement Techniques

In our investigation, we aimed to describe the CO2 efflux of undisturbed bare soil under field conditions in an area with a warm, dry, temperate climate zone. The experimental site was situated in Karcag in one of the driest areas of Hungary with high fluctuations in the temperature and the most continental characteristic. The summers are dry and warm with low cloud cover. The total number of annual sunshine hours is in the range of 1970–2020. The annual mean temperature is 10.2 °C. The annual mean precipitation is 503 mm. For the characterization of the weather conditions in the years we investigated, the comparison of the monthly mean air temperature and precipitation to the 50-year averages is shown in Figure 1 and Figure 2, respectively.
The soil type, according to the Hungarian classification, was meadow chernozem and solonetzic in the deeper layers (Vertisol by WRB taxonomy), which is typical in the Great Hungarian Plain, Carpathian Basin, East–Central Europe. The main soil properties are summarized in Table 1. The soil was undisturbed during the experimental period, except for shallow cultivations when they were sealed due to rainfall.
The soil CO2 efflux, the soil moisture content, and the temperature were monitored at the lysimeter station (47°17′29.3″ N, 20°53′23.3″ E) at the Research Institute of Karcag (RIK), Hungarian University of Agriculture and Life Sciences between June of 2018 and March of 2022. Measurements were carried out weekly, providing data for a total of 170 dates. Using the lysimeter controlled and precisely determined the factors affecting the CO2 efflux from the soil under field conditions.
The CO2 efflux was measured with the method developed and described by Zsembeli et al. [18]. The tool consisted of a plastic bowl that was 8000 cm3 and a metal frame that was 40 cm in diameter and 8 cm in height (Figure 3). The CO2 concentration was measured using a Testo 535 infrared gas analyzer after an incubation time of 10 min.
Simultaneously, the soil temperature, as well as the soil moisture content, were measured by using an SMT 100 sensor from Umwelt-Geräte-Technik GmbH (Germany) with the sensitivity of 0.01 °C and 0.1 v/v%.
The measured CO2 concentration was converted to g m−2 h−1 based on the unified gas law (Equation (1)) with transformation according to Equation (2) to obtain the efflux in gram per unit area (m−2) and time (h−1).
p V = n R T
where p is the pressure (Pa), V is the volume (m3), n is the amount of chemical substance of the gas (mol), R is the universal gas constant (8.314 J mol−1 K−1), and T is the absolute temperature (Kelvin).
F C O 2 = Δ C   l   p   M Δ t   R   T
where FCO2 is the CO2 efflux (g m−2 h−1), ΔC is the change in CO2 concentration (mol mol−1), l is the height of the measuring cylinder (m), M is the molar mass of CO2 (44.01 g mol−1), and Δt is the measurement time (h).
The means and standard deviations of the raw data relating to the CO2 concentration, soil temperature, and soil moisture content used for modeling are summarized in Table S1.

2.2. Model Calculations

First, the adequacy of different mathematical formulas was examined for the estimation of the effect of the soil temperature on the CO2 efflux. The linear and the exponential models with quadratic function, which are the simplest and the most complex models, were used for the evaluation of the contribution of the environmental factors (Equations (3) and (4), respectively). The latter was used in a study for the evaluation of the maximum substrate-limited respiration rate of litter but not for bare soil [19].
F C O 2 = a T + b
F C O 2 = a e b T + c T 2
where FCO2 is the CO2 efflux (g m−2 h−1), T is the soil temperature (°C); and a, b, and c are the regression coefficients determined by a true nonlinear regression analysis using the method of least squares.
The model that was found to be adequate in terms of the field conditions was extended with the soil moisture content. The combined effect of the soil temperature and soil moisture content on the soil CO2 efflux was analyzed using linear and nonlinear regression analyses. The adequacies of both the exponential and the power functions of the soil moisture content were examined.
The goodness of the models was assessed based on the corrected determination coefficient (R2), the root mean square error (RMSE), and the Akaike Information Criterion (AIC) (Equation (5)). The minimal AIC value represents the optimal model.
AIC = n ln(SSres/n) + 2p
where n is the number of samples, SSres is the residual sum of squares, and p is the number of parameters (also the constant).
For the prediction of CO2 emissions, historical seasonal trends in the air temperature were analyzed by using local hourly meteorological data of the period 1990–2019 from the database of the National Meteorological Service of Hungary. The standard error (SE) of the trend in the changes was used to calculate the 95% confidence interval by seasons (SE × z95%). Scenarios of the estimated minimum and maximum levels of temperature increase were considered for the prediction of CO2 efflux in 2050. The hourly CO2 efflux was estimated by using the best-fitting model based on hourly temperature data, and this was aggregated to obtain the daily and yearly emissions for a given area.
Statistical analyses were performed using R version 4.0.2.

3. Results

3.1. Linear Model for the Description of CO2 Efflux as a Function of Soil Temperature

Linear models are the simplest models and generally have the lowest prediction errors. Their adequacy, however, should be examined. Statistical parameters describing the linear model of CO2 efflux from bare soil as a function of the soil temperature in the study area during the experimental time period are given in Table 2.
Accordingly, the soil temperature alone influences the CO2 efflux by nearly 40%. The residual standard error was found to be 0.05737. Figure S1 shows the linear model fitted to the soil temperature and the CO2 efflux, while Figure 4 shows the CO2 efflux by time.
The validation of the linear model showed that the residues were not normally distributed (Figure S2). The results of the Shapiro–Wilk test were as follows: W = 0.854; p-value = 9.853 × 10⁻¹². Those of the studentized Breusch–Pagan test were BP = 8.5147; df = 1; p-value = 0.00352. The homoscedasticity criteria were not met in the regression analysis. However, the estimation by using the linear model was unbiased, and the expected value of the residues was zero.
The variance in the residues was not found to be constant. Increasing the variance with increasing the CO2 efflux resulted in a greater error in the estimation at a higher level of CO2 efflux. The accuracy of the estimation was found to be dependent on the level of CO2 efflux. The linear model outputs were negative when the soil temperature was low.

3.2. Quadratic Exponential Model for the Description of CO2 Efflux as a Function of Soil Temperature

The results of the nonlinear regression are summarized in Table 3. The residual standard error was found to be 0.05664. The coefficient of the quadratic factor was not found to be significant, suggesting the simplification of the formula.

3.3. Exponential Model for the Description of CO2 Efflux as a Function of Soil Temperature

The model calculations showed that there was a significant relationship for soil temperature when the quadratic exponential model was simplified (Equation (6)). The model parameters are given in Table 4.
F C O 2 = a e b T
where FCO2 is the CO2 efflux (g m−2 h−1), T is the air temperature (°C), and a and b are the regression coefficients.
The residual standard error was 0.05667. Equations (4) and (6) have comparable fitted error functions. Figure S3 shows the exponential relationship between the soil temperature and the CO2 efflux, while Figure 5 shows the CO2 efflux by time.

3.4. Combined Exponential and Powered Model for the Description of CO2 Efflux as a Function of Air Temperature and Soil Moisture Content

To include the soil moisture content, Equation (6) was extended with this variable raised to power, as shown in Equation (7). The statistical parameters are summarized in Table 5.
F C O 2 = a e b T W E T c
where T is the air temperature; WET is the soil moisture content in vol%; and a, b, and c are constants.
The residual standard error was found to be 0.05667. The constants of the soil temperature were found to be significant, but that of the moisture content was not. Under the given set of circumstances during the experiment, the effect of the soil moisture content on the soil CO2 efflux was not shown.

3.5. Extended Exponential Model for the Description of CO2 Efflux as a Function of Air Temperature and Soil Moisture Content

In a further model, both variables were considered exponentially. Equation (6) was extended, as shown in Equation (8). The statistical parameters are summarized in Table 6.
F C O 2 = a e b T + c W E T
where T is the air temperature; WET is the soil moisture content in vol%; and a, b, and c are constants.
The residual standard error was found to be 0.05667. Similar to the combined model with the moisture content of the power function, only the constants of the soil temperature were found to be significant. Figure 6 shows the extended exponential model fitted for the experimental data by time for the period of 2018–2022.

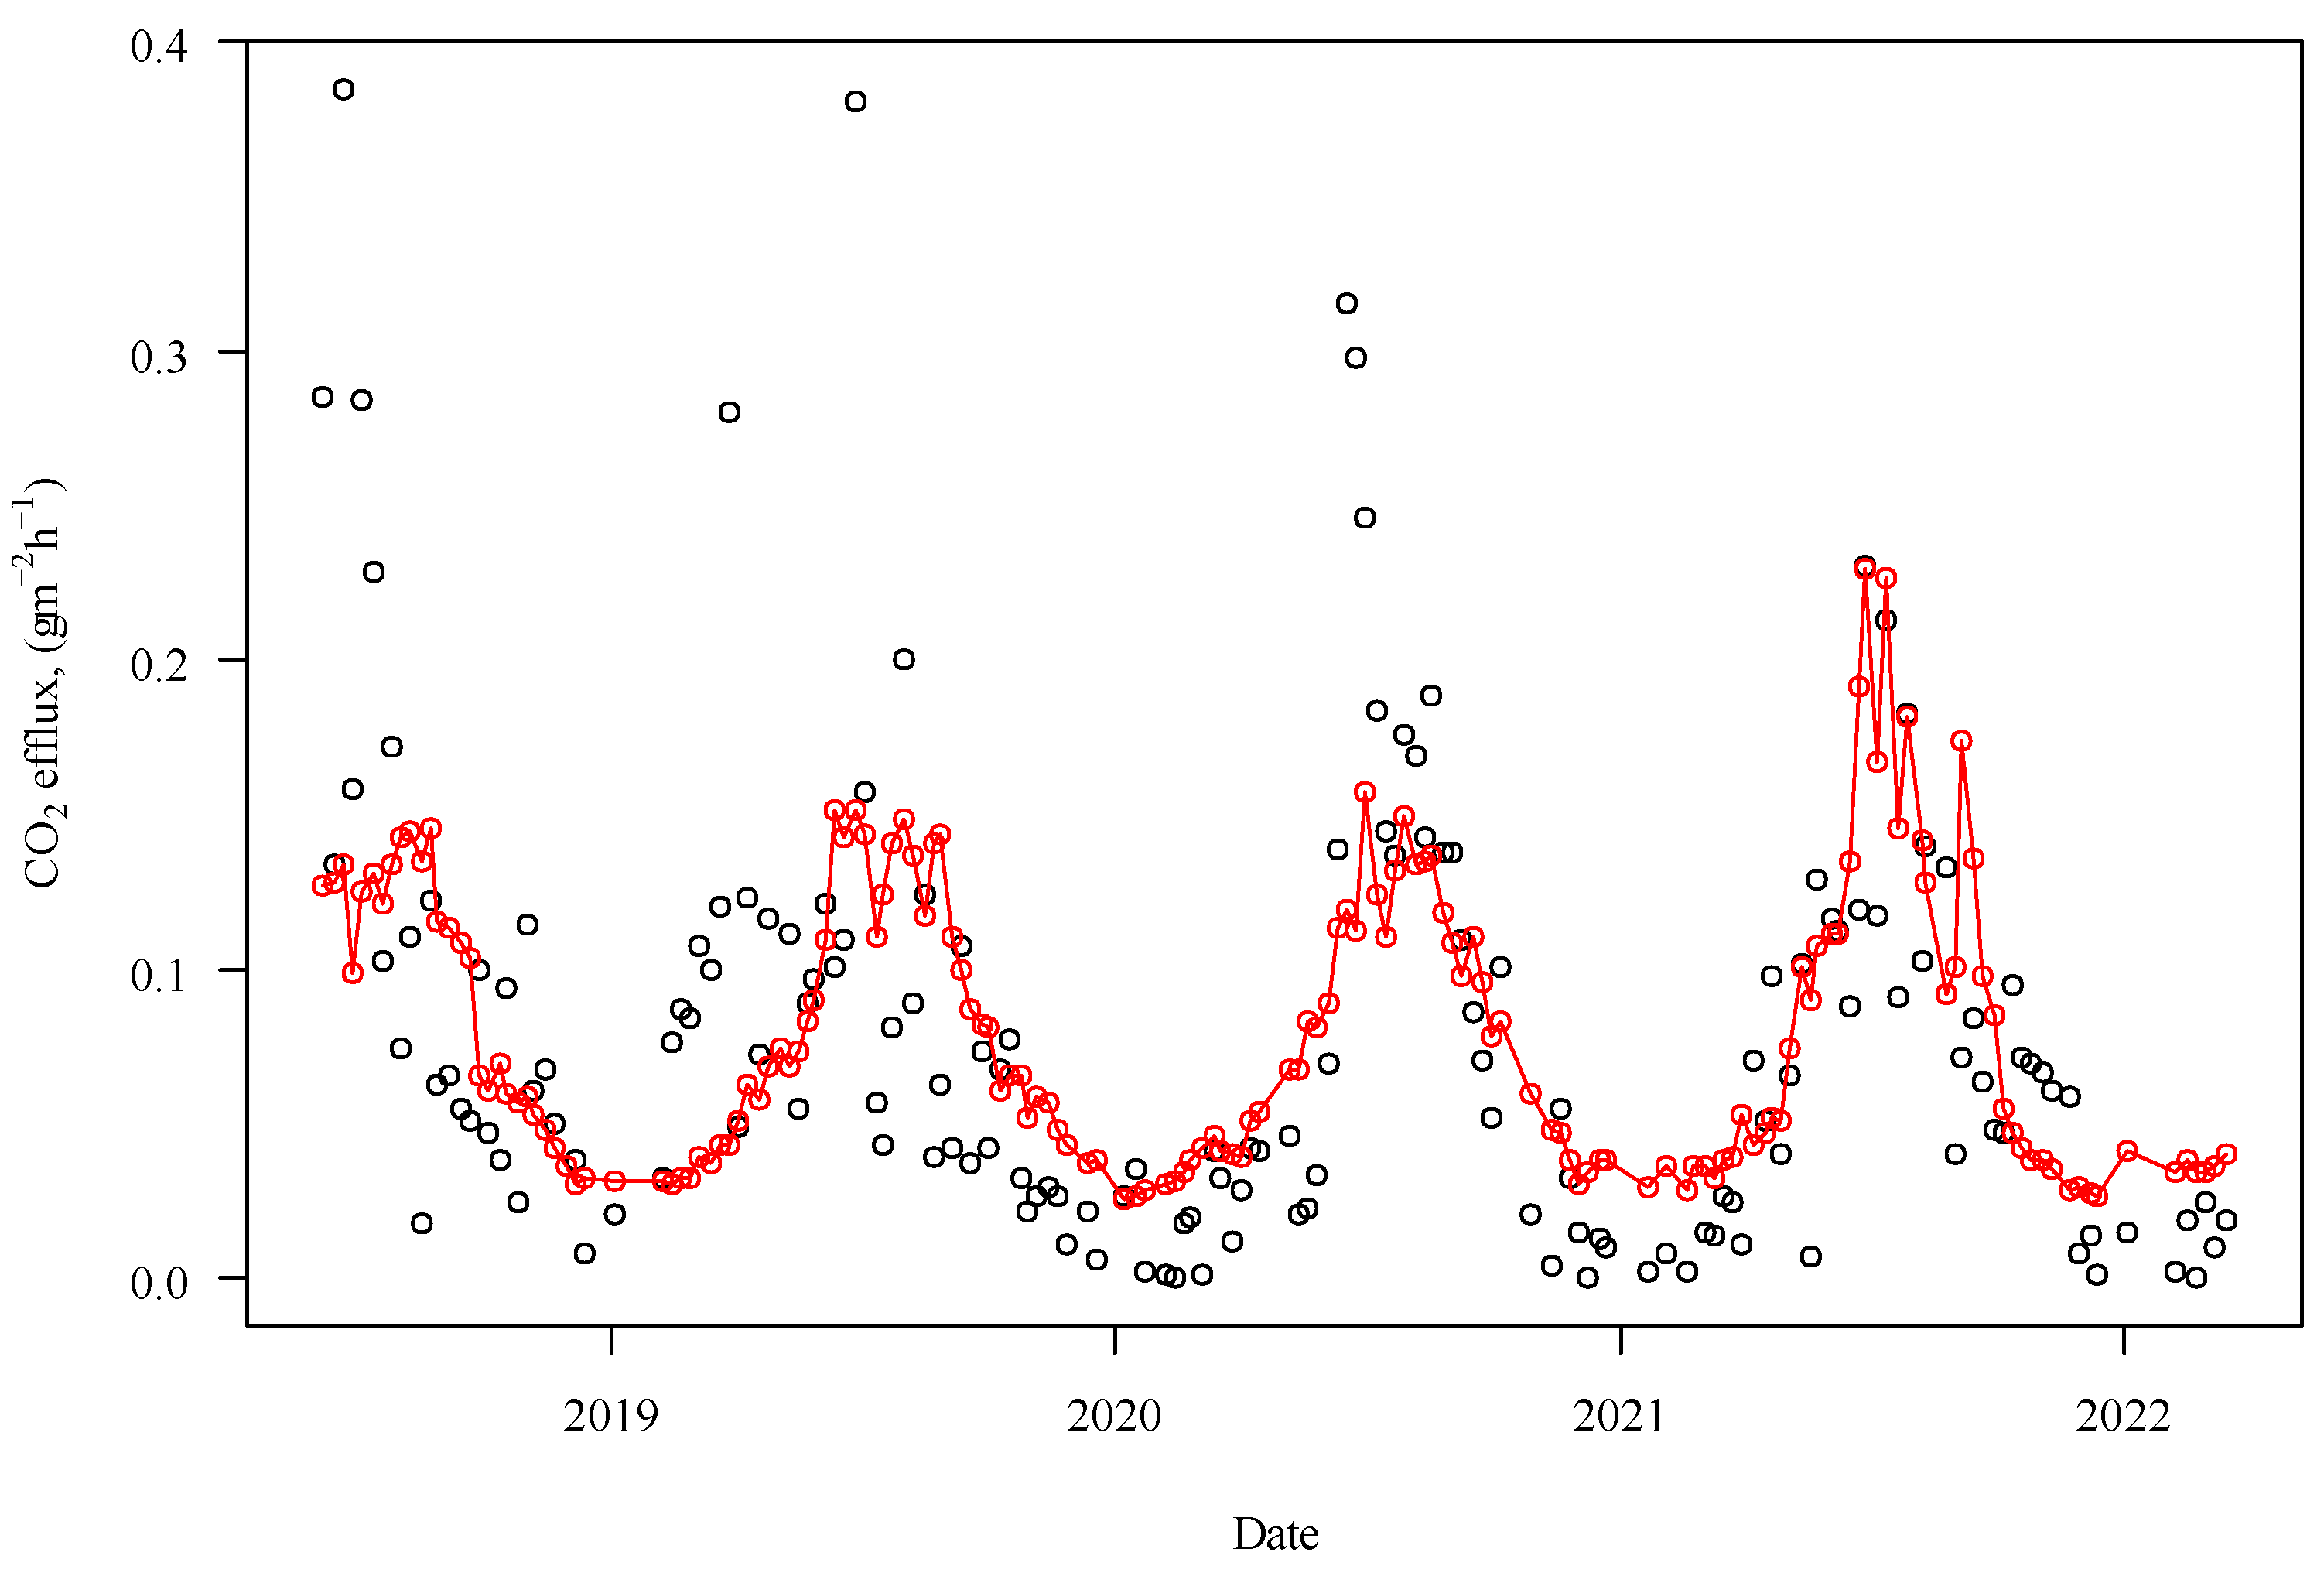
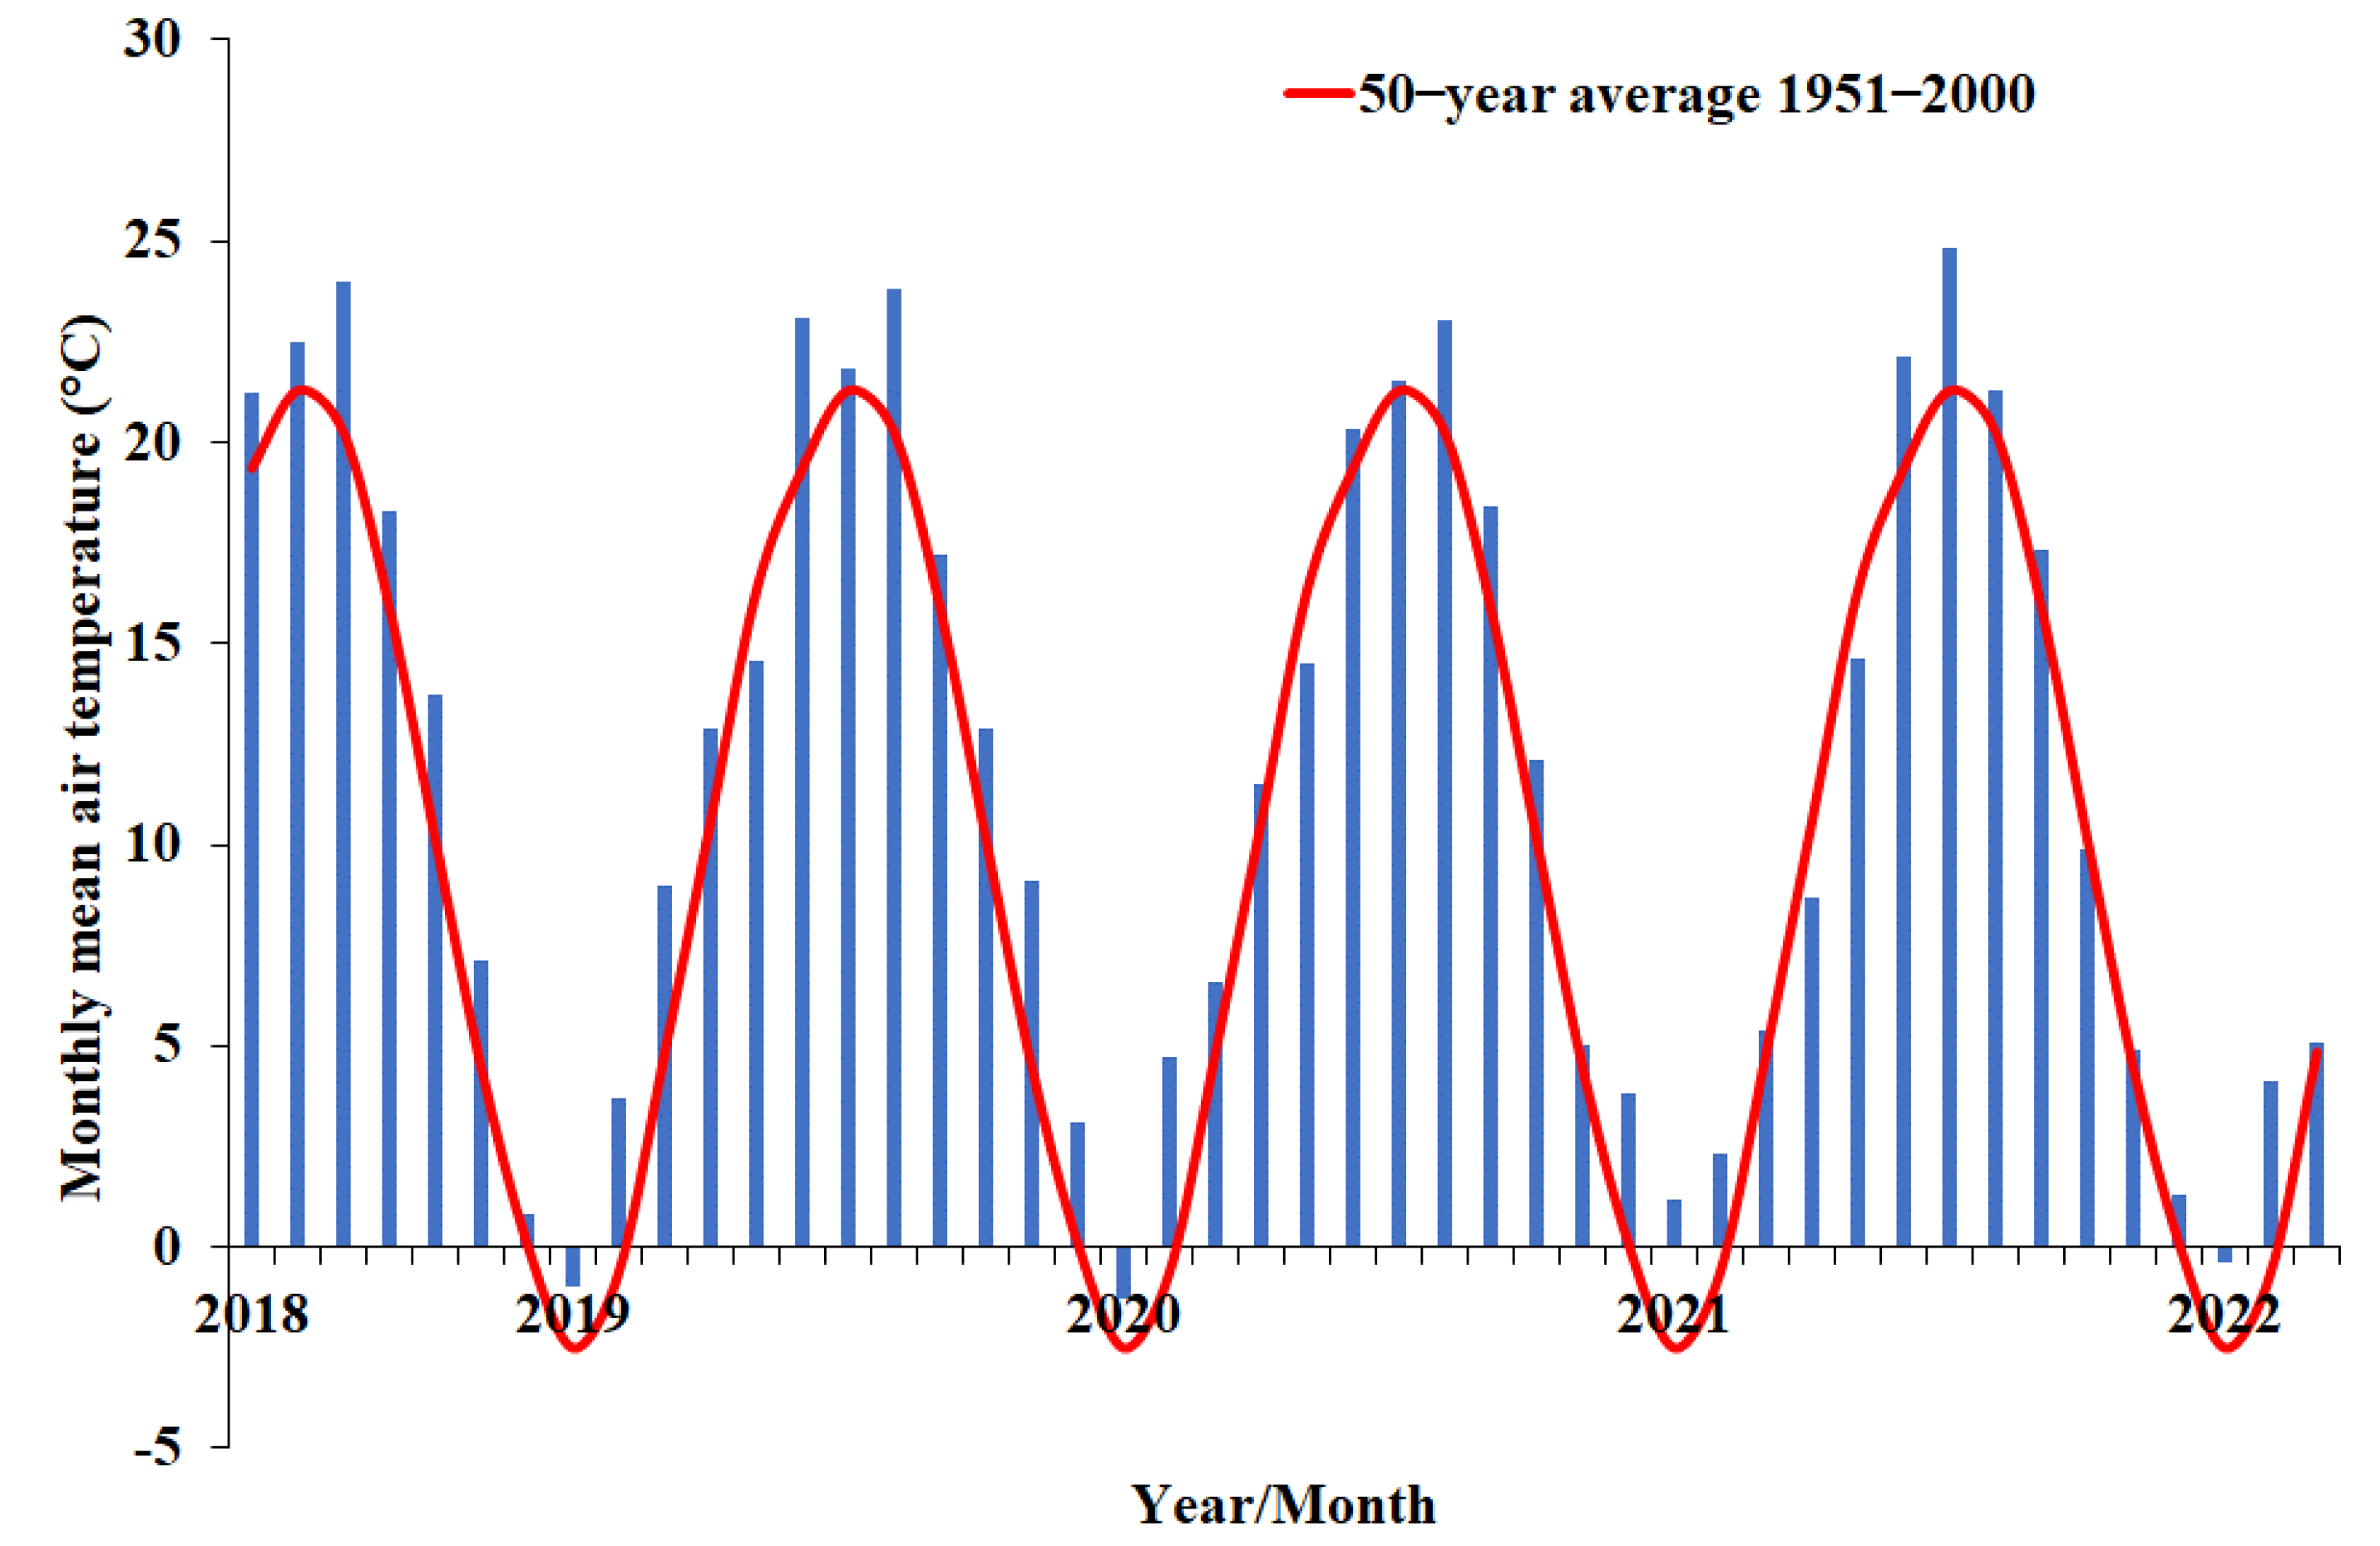
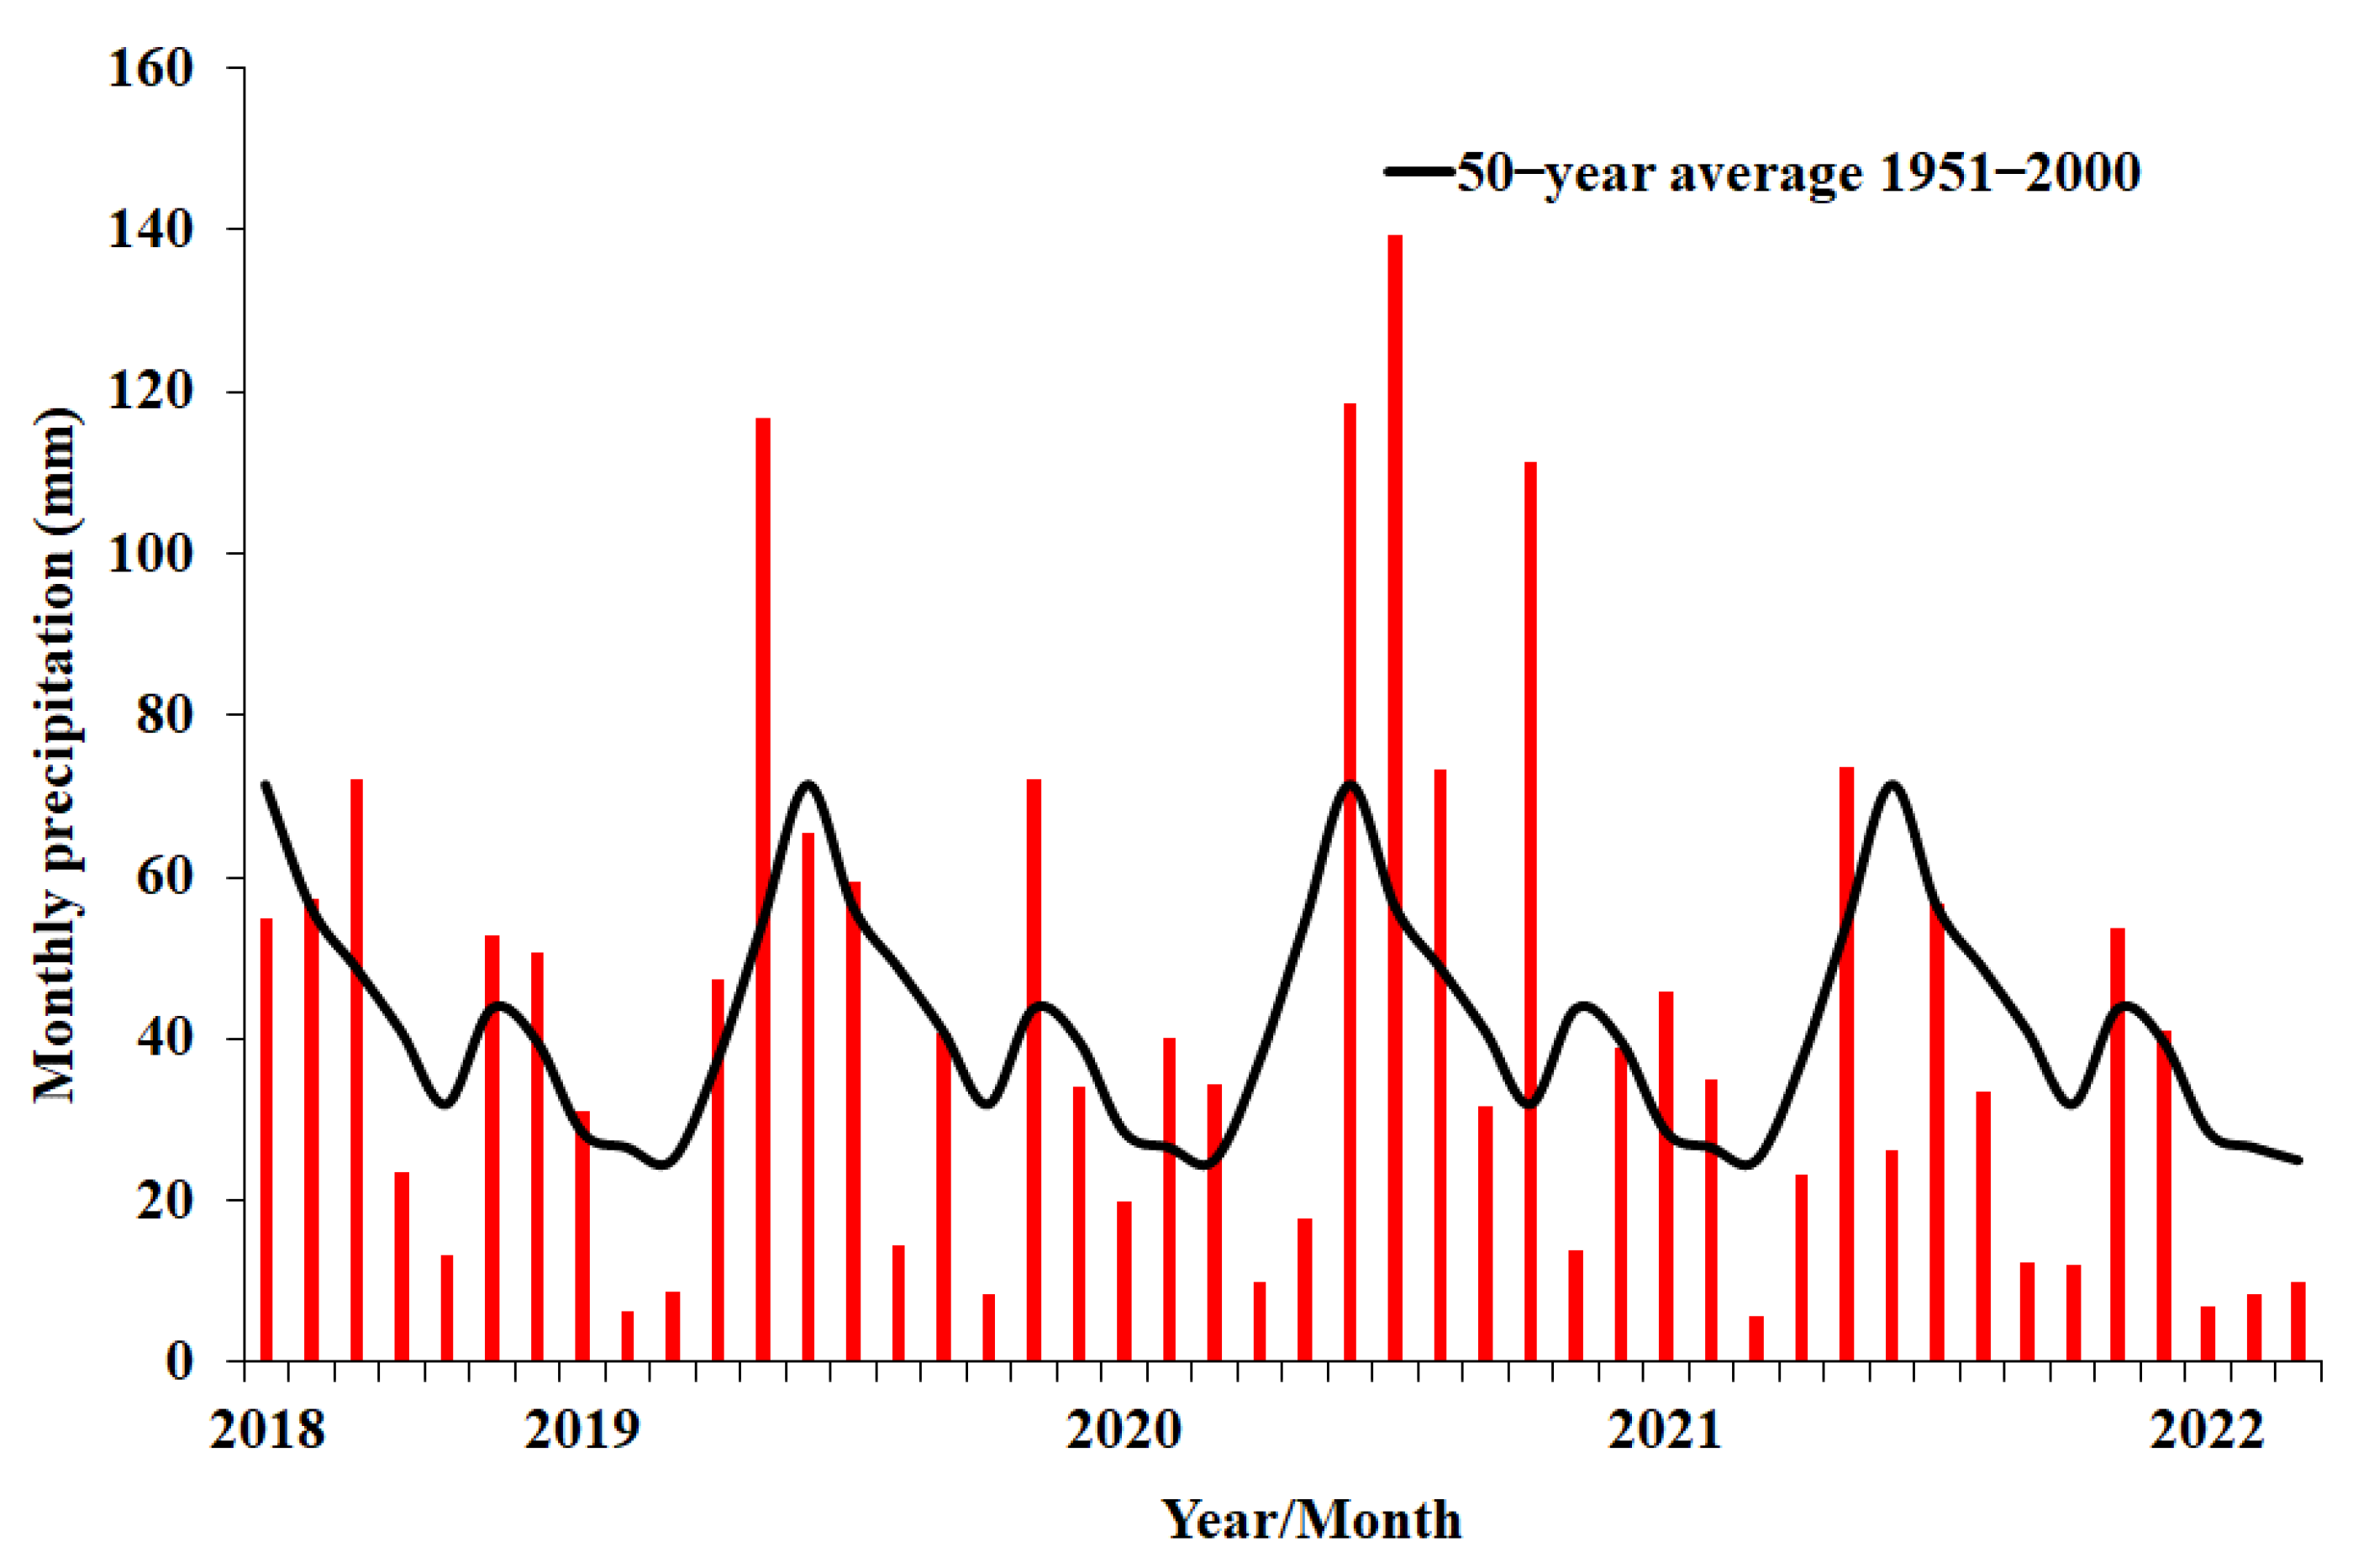
3.6. CO2 Efflux Predictions of Bare Soil for the Year 2050

The statistical parameters of the models tested by using our dataset are summarized in Table 7. The RSE values of all four models were the same or very similar to each other, suggesting that they described the CO2 efflux with the same level of accuracy. The best model was the simplest, with the least variables. In our case, this was the exponential formula with the lowest AIC, in which only the soil temperature was considered as a variable.
Exponential model outputs at hourly and daily resolutions are represented in Figure S4 and Figure 7, respectively. Based on the estimations, bare soil in Karcag, Hungary, emitted 483 ± 21 g CO2 m−2 y−1 (452 ± 29 g CO2 m−2 y−1) within the period 2018–2021, which means bare soil contributed nearly 4.5–5 tons per hectare to CO2 emissions yearly.
Based on a database of meteorological data at an hourly resolution, the yearly mean temperature at the location of the experiment increased within the 30 years between 1990 and 2019. Additionally, trends differed by season. The calculated temperature increases, and the estimated changes until 2050 compared to the mean temperature in 2019 are summarized in Table 8.
The increase in the temperature was found to be more intensive in the winter than in the summer in the region. The highest variation was also found in the winter. This is advantageous, as the CO2 efflux exponentially increases with the increasing temperature. By aggregating the hourly data calculated by using the exponential model, the mean CO2 efflux is estimated to reach 834 g m−2 y−1 in 2050. With the consideration of the 95% confidence interval, the range was calculated as 772–898 g m−2 y−1 (Figure 8).
By 2050, in Karcag, Hungary, located in a warm, temperate, dry zone, soil is expected to contribute approximately 8.3 Mg ha−1 y−1 (7.7–9.0 Mg ha−1 y−1 with a 95% confidence interval) to the overall CO2 emissions, which will result from soil respiration alone, with the assumption that the soil organic carbon content will remain constant. Its decrease by time will lower the level of emissions.
It should also be noted that trends in climate change are expected to have considerable effects on the processes that govern CO2 emissions from soil. Resulting from the chaotic character of weather parameters, estimations for future trends hold high uncertainty, e.g., with the consideration of 19 scenarios for a 1% year−1 CO2 concentration increase, the global temperature change was estimated for 2050 within the range 0.7–2.7, approximately [20]. At the global scale, alterations in CO2 concentrations and temperature resulting from climate change alter the soil respiration, soil carbon dynamics, and microbial community structures [21]. Microbial variables such as enzymatic activities, hyphal lengths, and bacterial substrate assimilation have been proven to significantly and substantially increase under elevated CO2 conditions [22].

4. Discussion

Many reports have discussed bare soil CO2 efflux based on laboratory measurements, as well as field experiments over periods varying from a few months to several years. Specifically, they have been carried out in different climatic zones [5,7,9,10,11,12,23,24].
Among the environmental factors, CO2 efflux is mainly determined by the soil status and weather conditions. CO2 efflux can be expected to closely correlate with the preserved soil moisture content. In a crop year, before and after the vegetation period, and even at the beginning and end of the period, bare soils experience higher evaporation loss due to the lack of soil surface cover. In such a period, the soil moisture content is often a limiting factor in soil respiration [13]. A longer period with a relatively high moisture content could ensure more favorable living conditions for microbes. Generally, sudden water input such as precipitation, which causes a sudden increase in the soil moisture content, does not result in the sudden propagation of soil microbes; hence, it does not increase CO2 emissions in the short term. Soil moisture does not correlate strongly with the rates of soil respiration [4]. Contrary to this, under optimal circumstances for microbiological activity, when neither the soil temperature nor water content are limiting factors, high soil CO2 emissions can be observed [24]. In experiments, weather conditions showed high fluctuations in the temperature and the unequal distribution of rain. At our experimental site, however, the soil moisture content was found to be very low and varied in a relatively narrow range (Table S1), resulting from both the local weather- and soil-type characteristics. Under these circumstances, soil microbes could be expected to be less responsive to any changes in the moisture content measured in the field [25].
The contribution of the different environmental variables has been mathematized by several researchers using different sites, with special interest in the soil temperature and the soil moisture content.
In a study covering a wide range of ecosystems, neither the exponential nor the linear model provided an unbiased estimate for the soil CO2 efflux when the soil temperature was considered alone [16]. For bare soils, however, exponential models have been widely used for the description of the relationship between soil CO2 efflux and soil temperature. Some studies did not prove a direct relationship (e.g., [9,15]), while others did, e.g., [11,12,14,17,23]. For example, in a dataset related to a semiarid area, the soil temperature as a variable explained 46% of the seasonal changes [11]. The R2 for bare soil was found to be similar to our findings. In a highland area, the R2 was found to be 0.44 and increased to 0.63 when drought-affected dates were excluded [12]. In our study, data representing the whole year included predominantly dry conditions (Table S1). Interestingly, at a seasonal scale in a similar location, the R2 was 0.124, 0.000, 0.447, and 0.002 in the spring, summer, autumn, and winter, respectively [14].
In a study carried out to describe the rate of respiration in the function of both soil temperature and moisture content, the CO2 efflux was given as the product of two exponential functions [19]. Some researchers combined the exponential and power functions of soil temperature and the soil water content, respectively. In one study, with the combination of the exponential function of soil temperature and the power function of the moisture content, the R2 was 0.82 in the case of bare soil [12]. For bare lands within a 11-year period, the R2 was 0.62 [14]. On a seasonal scale, for bare soil, the R2 was 0.24, 0.608, 0.59, and 0.11 in the spring, summer, autumn, and winter, respectively [14]. In one study, bare soil’s CO2 efflux was described by the product of the power functions of the two variables, and the R2 was found to be 0.79 [12]. In another study using the same model, the R2 was calculated as 0.553 [11]. As suggested, the moisture content can be expected to have significant effects above one-third of the water-holding capacity. This explains our findings in which the soil moisture did not improve the accuracy of the best-fitting model. Using the power function for the soil water content alone, some researchers found an R2 of 0.15 for bare soil [11], while others reported an R2 of 0.71 [12]. On a seasonal scale, the R2 was 0.005, 0.566, 0.062, and 0.11 in the spring, summer, autumn, and winter, respectively [14]. In one study, temperature-normalized CO2 fluxes were found to relate to the soil water content with a positive linear relationship [17]. Based on the findings of these case studies, the contribution of the soil moisture content to the overall effect of weather conditions on the CO2 efflux of bare soil differs widely, supporting the need for further field experiments, especially in situ, long-term studies continuously monitoring weather and soil parameters.

5. Conclusions

The CO2 emissions from bare soil remain of considerable scientific interest. Several physical, chemical, and biological properties; meteorological parameters (e.g., temperature and precipitation); and hydrologic parameters (e.g., soil moisture content) determine the spatial and temporal variability in CO2 emissions from bare soils. Nevertheless, bare soil surfaces with no vegetation provide suitable environments to study the microbiological activity of soil, because root respiration, as another source of CO2 emissions, is excluded. We determined the validity and accuracy of different mathematical models based on daily data regarding the soil carbon dioxide efflux and soil temperature and extended the best-fitting formula with the soil moisture content. The data were recorded within the period of June 2018–March 2022 under natural field conditions, characterizing undisturbed bare chernozem soil in Karcag, Hungary, a semiarid region with four seasons.
We proved that, for the description of the relationship between the CO2 efflux and the soil temperature, the linear model was not adequate, as the homoscedasticity criteria were not met. The exponential model with quadratic function did not provide more accurate results compared to those of the simplified exponential model. The addition of the soil moisture content to the simplified exponential formula did not improve the accuracy, suggesting that the moisture content under the given environmental circumstances within the investigated time period and location was not considerable. We have found further evidence that the best-fitting models are dependent on the local environmental conditions of the fields.
Based on the Akaike Information Criteria, the exponential model, including the soil temperature as a variable, was used to provide seasonal predictions of the CO2 efflux from undisturbed bare soil for the year 2050 by season, with the consideration of historical trends in the daily mean temperature in the last 30 years. Based on our calculations, in the future, an increase in the CO2 efflux of bare soil can be expected in the warm, dry, temperate climate zone.

Supplementary Materials

The following supporting information can be downloaded at: https://www.mdpi.com/article/10.3390/agronomy12123050/s1: Figure S1. Linear model fitted to the CO2 efflux (g m−2 h−1) from undisturbed bare soil as a function of the soil temperature. Measured and calculated data are represented by black and red circles, respectively; Figure S2. Residuals in the linear model describing the CO2 efflux (g m−2 h−1) from undisturbed bare soil as a function of the estimated results; Figure S3. Exponential model fitted to the CO2 efflux (g m−2 h−1) from undisturbed bare soil as a function of the soil temperature. Measured and calculated data are represented by black and red circles, respectively; Figure S4. Hourly CO2 efflux (g m−2 h−1) of undisturbed bare soil, calculated with the exponential model with the consideration of soil temperature, for the years of 2018—2021; Table S1. Mean and standard deviation of measured soil temperature, soil moisture content, and CO2 efflux data by years used as inputs for model calculations.

Author Contributions

Conceptualization, C.J. and J.Z.; methodology, J.Z. and L.H.; software, L.H.; validation, C.J., E.K., and J.Z.; formal analysis, L.H.; investigation, G.K., G.T., and L.S.; resources, J.Z.; data curation, G.K., G.T., and L.S.; writing—original draft preparation, E.K. and J.Z.; writing—review and editing, C.J. and J.Z.; visualization, L.H. and E.K.; supervision, J.Z.; project administration, E.K.; and funding acquisition, J.Z. All authors have read and agreed to the published version of the manuscript.

Funding

This work vas supported by the National Research, Development and Innovation Fund of Hungary (TKP2021-NKTA funding scheme, project no. TKP2021-NKTA-32).

Data Availability Statement

Not applicable.

Conflicts of Interest

The authors declare no conflict of interest.

References

  1. Bunt, J.S.; Rovira, A.D. Oxygen uptake and carbon dioxide evolution of heat-sterilized soil. Nature 1954, 173, 1242. [Google Scholar] [CrossRef]
  2. Kuzyakov, Y. Sources of CO2 efflux from soil and review of partitioning methods. Soil Biol. Biochem. 2006, 3, 425–448. [Google Scholar] [CrossRef]
  3. Raich, J.W.; Potter, C.S. Global patterns of carbon dioxide emissions from soils. Glob. Biogeochem. Cycles 1995, 9, 23–36. [Google Scholar] [CrossRef] [Green Version]
  4. Cleveland, C.C.; Nemergut, D.R.; Schmidt, S.K.; Townsend, A.R. Increases in soil respiration following labile carbon additions linked to rapid shifts in soil microbial community composition. Biogeochemistry 2007, 82, 229–240. [Google Scholar] [CrossRef]
  5. Deng, Q.; Hui, D.; Chu, G.; Han, X.; Zhang, Q. Rain-induced changes in soil CO2 flux and microbial community composition in a tropical forest of China. Sci. Rep. 2017, 7, 5539. [Google Scholar] [CrossRef] [PubMed] [Green Version]
  6. Lundquist, E.J.; Scow, K.M.; Jackson, L.E.; Uesugi, S.L.; Johnson, C.R. Rapid response of soil microbial communities from conventional, low input, and organic farming systems to a wet/dry cycle. Soil Biol. Biochem. 1999, 12, 1661–1675. [Google Scholar] [CrossRef]
  7. Maestre, F.T.; Cortina, J. Small-scale spatial variation in soil CO2 efflux in a Mediterranean semiarid steppe. Appl. Soil Ecol. 2003, 3, 199–209. [Google Scholar] [CrossRef]
  8. Karhu, K.; Auffret, M.; Dungait, J.; Hopkins, D.W.; Prosser, J.I.; Singh, B.K.; Subke, J.A.; Wookey, P.A.; Ågren, G.I.; Sebastià, M.T.; et al. Temperature sensitivity of soil respiration rates enhanced by microbial community response. Nature 2014, 513, 81–84. [Google Scholar] [CrossRef] [PubMed]
  9. Toma, Y.; Kimura, S.D.; Yamada, H.; Hirose, Y.; Fujiwara, K.; Kusa, K.; Hatano, R. Effects of environmental factors on temporal variation in annual carbon dioxide and nitrous oxide emissions from an unfertilized bare field on Gray Lowland soil in Mikasa, Hokkaido, Japan. Soil Sci. Plant Nutr. 2010, 56, 663–675. [Google Scholar] [CrossRef] [Green Version]
  10. Lopez, C.J.R.; Sánchez-Cañete, E.P.; Serrano-Ortiz, P.; López-Ballesteros, A.; Domingo, F.; Kowalski, A.S.; Oyonarte, C. From microhabitat to ecosystem: Identifying the biophysical factors controlling soil CO2 dynamics in a karst shrubland. Eur. J. Soil Sci. 2018, 69, 1018–1029. [Google Scholar] [CrossRef]
  11. Shi, W.Y.; Yan, M.J.; Zhang, J.G.; Guan, J.H.; Du, S. Soil CO2 emissions from five different types of land use on the semiarid Loess Plateau of China, with emphasis on the contribution of winter soil respiration. Atmos. Environ. 2014, 88, 74–82. [Google Scholar] [CrossRef]
  12. Li, H.-J.; Yan, J.-X.; Yue, X.-F.; Wang, M.-B. Significance of soil temperature and moisture for soil respiration in a Chinese mountain area. Agric. For. Meteorol. 2008, 148, 490–503. [Google Scholar] [CrossRef]
  13. Mancinelli, R.; Campiglia, E.; Di Tizio, A.; Marinari, S. Soil carbon dioxide emission and carbon content as affected by conventional and organic cropping systems in Mediterranean environment. Appl. Soil Ecol. 2010, 46, 64–72. [Google Scholar] [CrossRef]
  14. Yan, J.; Feng, Y.; Li, J.; Li, H.; Ding, G. Response of soil respiration and Q10 to temperature and moisture in naturally regenerated and bare lands based on an 11-year observation period. Catena 2022, 208, 105711. [Google Scholar] [CrossRef]
  15. La Scala, N., Jr.; Panosso, A.R.; Pereira, G.T. Modelling short-term temporal changes of bare soil CO2 emissions in a tropical agrosystem by using meteorological data. Appl. Soil Ecol. 2003, 24, 113–116. [Google Scholar] [CrossRef]
  16. Lloyd, J.; Taylor, J.A. On the temperature dependence of soil respiration. Funct. Ecol. 1994, 8, 315–323. [Google Scholar] [CrossRef]
  17. Xiao, X.; Kuang, X.; Sauer, T.J.; Heitman, J.L.; Horton, R. Bare soil carbon dioxide fluxes with time and depth determined by high-resolution gradient-based measurements and surface chambers. Soil Sci. Soc. Am. J. 2015, 79, 1073–1083. [Google Scholar] [CrossRef] [Green Version]
  18. Zsembeli, J.; Tuba, G.; Juhász, C.; Nagy, I. CO2 measurements in a soil tillage experiment. Cereal Res. Comm. 2005, 33, 137–140. [Google Scholar] [CrossRef]
  19. O’Connell, A.M. Microbial decomposition (respiration) of litter in eucalypt forests of South-Western Australia: An empirical model based on laboratory incubations. Soil Biol. Biochem. 1990, 22, 153–160. [Google Scholar] [CrossRef]
  20. Meehl, G.A.; Cubasch, U. Projections of Future Climate Change. Report Chapter 9, The Intergovernmental Panel on Climate Change; pp. 1–58. Available online: https://www.ipcc.ch/site/assets/uploads/2018/03/TAR-09.pdf (accessed on 10 September 2022).
  21. French, S.; Levy-Booth, D.; Samarajeewa, A.; Shannon, K.E.; Smith, J.; Trevors, J.T. Elevated temperatures and carbon dioxide concentrations: Effects on selected microbial activities in temperate agricultural soils. World J. Microbiol. Biotechnol. 2009, 25, 1887–1900. [Google Scholar] [CrossRef]
  22. Dhillion, S.S.; Roy, J.; Abrams, M. Assessing the impact of elevated CO2 on soil microbial activity in a Mediterranean model ecosystem. Plant Soil 1995, 187, 333–342. [Google Scholar] [CrossRef]
  23. Nakadai, T.; Yokozawa, M.; Ikeda, H.; Koizumi, H. Diurnal changes of carbon dioxide flux from bare soil in agricultural field in Japan. Appl. Soil Ecol. 2002, 19, 161–171. [Google Scholar] [CrossRef]
  24. Radicetti, E.; Osipitan, O.A.; Langeroodi, A.R.S.; Marinari, S.; Mancinelli, R. CO2 flux and C balance due to the replacement of bare soil with agro-ecological service crops in Mediterranean environment. Agriculture 2019, 9, 71. [Google Scholar] [CrossRef] [Green Version]
  25. Bian, H.; Li, C.; Zhu, J.; Xu, L.; Li, M.; Zheng, S.; He, N. Soil moisture affects the rapid response of microbes to labile organic C addition. Front. Ecol. Evol. 2022, 10, 857185. [Google Scholar] [CrossRef]
Figure 1. Monthly mean air temperature values during the investigated period (Karcag, 2018–2022).
Agronomy 12 03050 g001
Figure 2. Monthly precipitation values during the investigated period (Karcag, 2018–2022).
Agronomy 12 03050 g002
Figure 3. The setup of the frame–bowl method to measure the CO2 efflux from undisturbed soil under field conditions.
Agronomy 12 03050 g003
Figure 4. Outputs of the linear model for the CO2 efflux (g m−2 h−1) from undisturbed bare soil within the period of 2018–2022. Measured and calculated data are represented by black and red circles, respectively.
Agronomy 12 03050 g004
Figure 5. Outputs of the exponential model for the CO2 efflux (g m−2 h−1) from undisturbed bare soil within the period of 2018–2022. Measured and calculated data are represented by black and red circles, respectively.
Agronomy 12 03050 g005
Figure 6. Outputs of the extended exponential model for the CO2 efflux (g m−2 h−1) from undisturbed bare soil within the period of 2018–2022. Measured and calculated data are represented by black and red circles, respectively.
Agronomy 12 03050 g006
Figure 7. Daily CO2 efflux (g m−2 d−1) of undisturbed bare soil, calculated with the exponential model with the consideration of the soil temperature, for the years of 2018–2021.
Agronomy 12 03050 g007
Figure 8. Daily CO2 efflux (g m−2 d−1) expected in 2050 in Karcag, Hungary, calculated with the exponential model. With the consideration of the 95% confidence interval, the highest and the lowest estimations are indicated with blue and red lines, respectively.
Agronomy 12 03050 g008
Table 1. Main soil properties of the studied soil in Karcag, Hungary.
Depth cmpH (KCl)Salt Cont. m/m%CaCO3 %Organic Matter m/m%NO3-N mg/kgP2O5 mg/kgK2O mg/kg
0–205.210.02<0.053.229.786338
20–405.270.021.093.1718.540299
40–606.140.0210.882.688.533245
Particle size distribution (%)
Depth cm>0.25 mm0.25–0.050.05–0.020.02–0.010.01–0.0050.005–0.002<0.002 mm
0–200.56.411.415.413.611.541.2
20–400.25.87.216.314.110.645.9
40–600.13.59.013.416.011.047.0
Table 2. Parameters of the linear model describing the effects of soil temperature on the CO2 efflux from undisturbed bare soil under field conditions in Karcag, Hungary.
CoefficientEstimateStandard Errort ValuePr (>|t|)
Intercept0.0058750.0084190.6980.48615
Soil temperature0.0053200.00051510.330<20−16 ***
*** significance level p < 0.001.
Table 3. Parameters of the quadratic exponential model describing the effect of soil temperature on the CO2 efflux from undisturbed bare soil under field conditions in Karcag, Hungary.
ConstantEstimateStandard Errort ValuePr (>|t|)
a0.02859050.00492075.8103.08 × 10−8 ***
b0.05115630.01437763.5580.000487 ***
c0.00042160.00032501.2970.196298
*** significance level p < 0.001.
Table 4. Parameters of the exponential model describing the effect of soil temperature on the CO2 efflux from undisturbed bare soil under field conditions in Karcag, Hungary.
ConstantEstimateStandard Errort ValuePr (>|t|)
a0.0267430.0045835.8352.70 × 10−8 ***
b0.0674370.0074919.0024.63 × 10−16 ***
*** significance level p < 0.001.
Table 5. Parameters of the extended exponential model describing the CO2 efflux (g m−2 h−1) from undisturbed bare soil.
ConstantEstimateStandard Errort ValuePr (>|t|)
a0.0187900.0060623.1000.00227 **
b0.0656680.0074998.7572.15 × 10−15 ***
c0.1577380.1219441.2940.198
significance levels *** p < 0.001 and ** p < 0.01.
Table 6. Parameters of the extended exponential model describing the CO2 efflux (g m−2 h−1) from undisturbed bare soil.
ConstantEstimateStandard Errort ValuePr (>|t|)
a0.0234050.0045735.1188.40 × 10−7 ***
b0.0662500.0074608.8811.01 × 10−15 ***
c0.0123250.0091661.34530.181
*** significance level p < 0.001.
Table 7. Summary of the statistics of the models tested for the description of the CO2 efflux (g m−2 h−1) from undisturbed bare soil as a function of the soil temperature (1–3) and soil moisture contents (4,5).
ModelR2RSEAIC
Linear 10.370.058−964.89
Quadratic exponential 20.410.057−973.19
Exponential 30.400.057−973.28
Combined exponential and powered 40.410.057−973.06
Extended exponential 50.410.057−973.02
R2: determination coefficient; RSE: root mean square error; AIC: Akaike Information Criterion.
Table 8. Yearly seasonal increase in the temperature within the period 1990–2019 based on a linear model, and the estimated change until 2050 compared to the temperature in 2019 in Karcag, Hungary. Standard error (SE) × z95% indicates the 95% confidence interval.
SeasonTemperature Increase °C y−1 ± SE × z95%Estimated Change until 2050
Compared to 2019 °C
± SE × z95%
winter0.069 ± 0.0602.139 ± 1.860
spring0.063 ± 0.0331.953 ± 1.023
summer0.059 ± 0.0331.829 ±1.023
autumn0.069 ± 0.0372.139 ± 1.147
Publisher’s Note: MDPI stays neutral with regard to jurisdictional claims in published maps and institutional affiliations.

