

Association Mapping for Quantitative Trait Loci Controlling Superoxide Dismutase, Flavonoids, Anthocyanins, Carotenoids, γ-Oryzanol and Antioxidant Activity in Rice

 , ,
, , 
Abstract

1. Introduction
2. Materials and Methods
2.1. Seed Materials
2.2. Phenotyping for the Antioxidant Traits
2.3. Statistical Analysis
2.4. Genomic DNA Isolation, PCR Analysis, and Selection of SSR Markers
2.5. Molecular Data Analysis
3. Results
3.1. Phenotyping of the Population for the Six Antioxidant Traits
3.2. Genotype-by-Trait Biplot Analysis for the Six Antioxidant Traits in the Germplasm Lines
3.3. Nature of Association among the Antioxidant Traits
3.4. Genetic Diversity Parameters Analysis
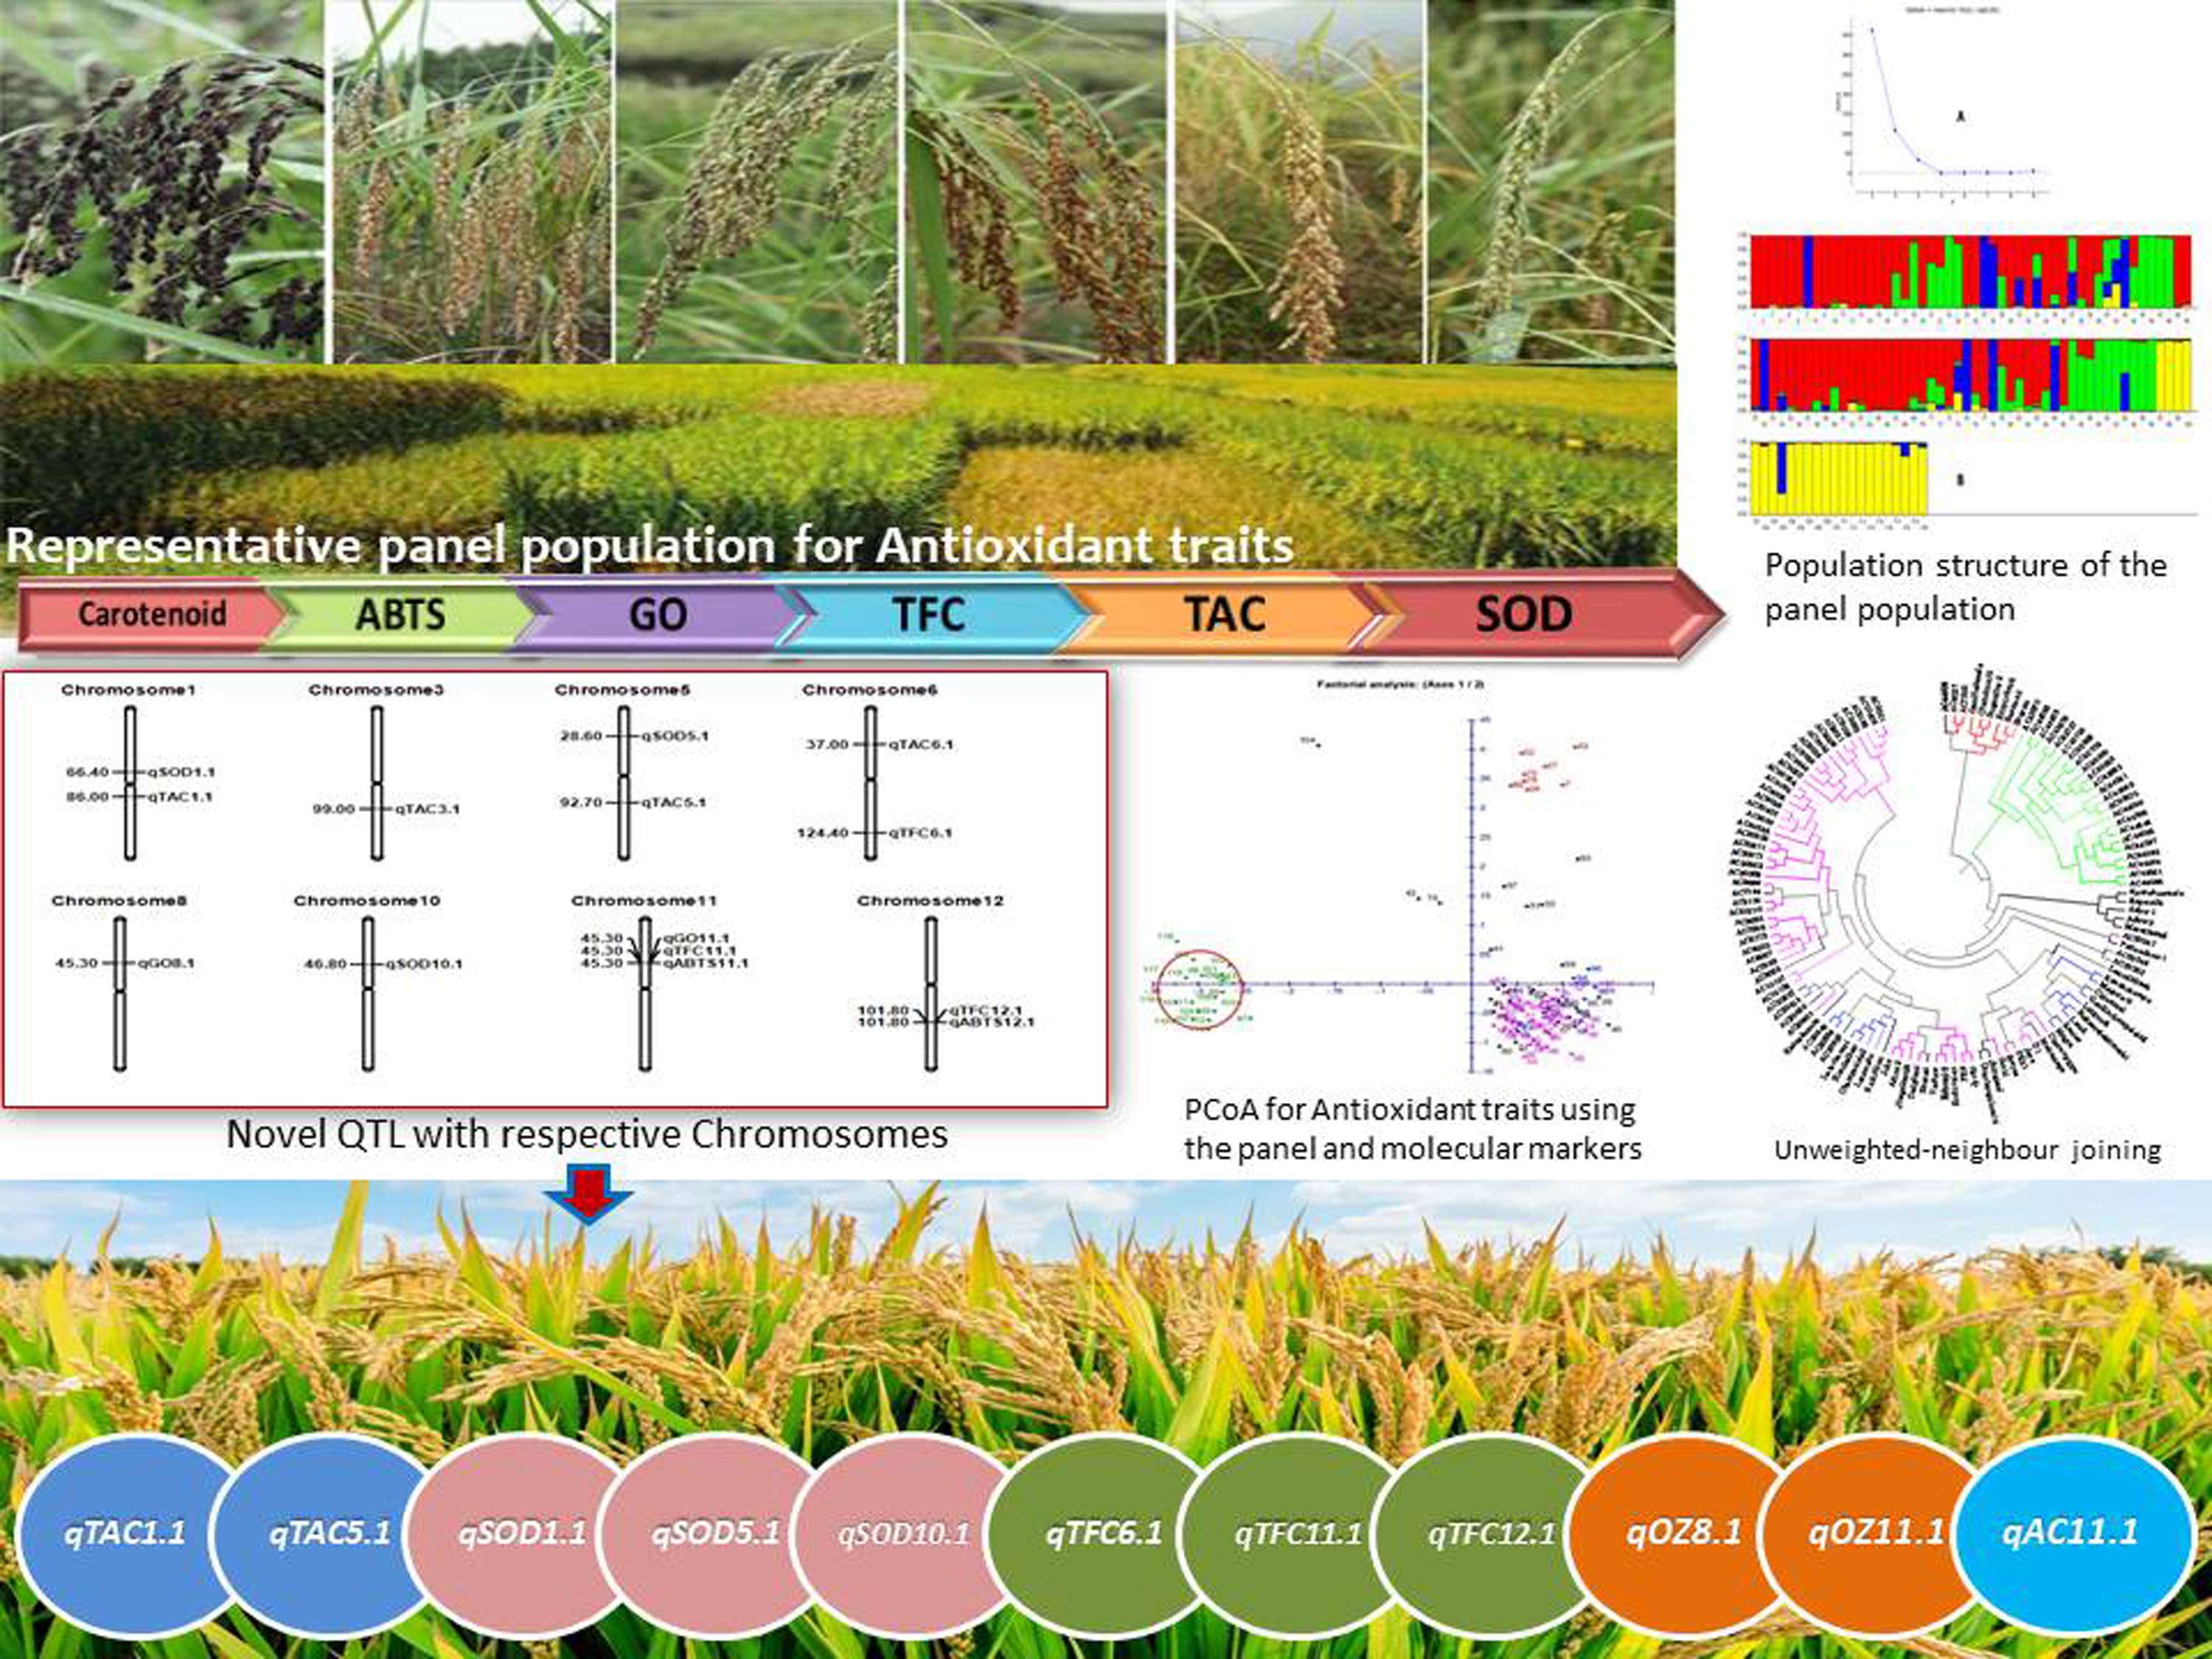
3.5. Population Genetic Structure Analysis
3.6. Molecular Variance (AMOVA) and LD Decay Plot Analysis
3.7. Principal Coordinates and Cluster Analyses for Genetic Relatedness among the Germplasm Lines
3.8. Marker–Trait Association for Antioxidant Traits in the Rice Panel Population
4. Discussion
5. Conclusions
Supplementary Materials
Author Contributions
Funding
Institutional Review Board Statement
Informed Consent Statement
Data Availability Statement
Acknowledgments
Conflicts of Interest
References
- Shridhar, G.; Rajendra, N.; Murigendra, H.; Shridevi, P.; Prasad, M.; Mujeeb, M.A.; Arun, S.; Neeraj, D.; Vikas, S.; Suneel, D.; et al. Modern Diet and its Impact on Human Health. J. Nutr. Food Sci. 2015, 5, 6. [Google Scholar] [CrossRef]
- Descalsota-Empleo, G.I.; Noraziyah, A.A.S.; Navea, I.P.; Chung, C.; Dwiyanti, M.S.; Labios, R.J.D.; Ikmal, A.M.; Juanillas, V.M.; Inabangan-Asilo, M.A.; Amparado, A.; et al. Genetic Dissection of Grain Nutritional Traits and Leaf Blight Resistance in Rice. Genes 2019, 10, 30. [Google Scholar] [CrossRef] [PubMed]
- Singh, S.P.; Gruissem, W.; Bhullar, N.K. Single genetic locus improvement of iron, zinc and β-carotene content in rice grains. Sci. Rep. 2017, 7, 6883. [Google Scholar] [CrossRef] [PubMed]
- Garg, M.; Sharma, N.; Sharma, S.; Kapoor, P.; Kumar, A.; Chunduri, V.; Arora, P. Biofortified crops generated by breeding; agronomy; and transgenic approaches are improving lives of millions of people around the world. Front. Nutr. 2018, 5, 12. [Google Scholar] [CrossRef] [PubMed]
- Pradhan, S.K.; Pandit, E.; Pawar, S.; Bharati, B.; Chatopadhyay, K.; Singh, S.; Dash, P.; Reddy, J.N. Association mapping reveals multiple QTLs for grain protein content in rice useful for biofortification. Mol. Genet. Genom. 2019, 294, 963–983. [Google Scholar] [CrossRef]
- Kumar, A.K.; Govindaraj, M.; Karthikeyan, A.; Shobhana, V.G.; Warkentin, T.D. Genomics-Integrated Breeding for Carotenoids and Folates in Staple Cereal Grains to Reduce Malnutrition. Front. Genet. 2020, 11, 414. [Google Scholar] [CrossRef]
- Zhu, C.; Kobayashi, K.; Loladze, I.; Zhu, J.; Jiang, Q.; Xu, X.; Liu, G.; Seneweera, S.; Ebi, K.L.; Drewnowski, A.; et al. Carbon dioxide (CO2) levels this century will alter the protein, micronutrients, and vitamin content of rice grains with potential health consequences for the poorest rice-dependent countries. Sci. Adv. 2018, 4, eaaq1012. [Google Scholar] [CrossRef]
- Pradhan, S.K.; Pandit, E.; Pawar, S.; Naveenkumar, R.; Barik, S.R.; Mohanty, S.P.; Nayak, D.K.; Ghritlahre, S.K.; Rao, D.S.; Reddy, J.N.; et al. Linkage disequilibrium mapping for grain Fe and Zn enhancing QTLs useful for nutrient dense rice breeding. BMC Plant Biol. 2020, 20, 57. [Google Scholar] [CrossRef]
- Sanghamitra, P.; Barik, S.R.; Bastia, R.; Mohanty, S.P.; Pandit, E.; Behera, A.; Mishra, J.; Kumar, G.; Pradhan, S.K. Detection of Genomic Regions Controlling the Antioxidant Enzymes, Phenolic Content, and Antioxidant Activities in Rice Grain through Association Mapping. Plants 2022, 11, 1463. [Google Scholar] [CrossRef]
- Shao, Y.; Jin, L.; Zhang, G.; Lu, Y.; Shen, Y.; Bao, J. Association mapping of grain color, phenolic content, flavonoid content and antioxidant capacity in dehulled rice. Theor. Appl. Genet. 2011, 122, 1005–1016. [Google Scholar] [CrossRef]
- Shao, Y.; Bao, J. Polyphenols in whole rice grain: Genetic diversity and health benefits. Food Chem. 2015, 180, 86–97. [Google Scholar] [CrossRef] [PubMed]
- Panda, S.K. Assay Guided Comparison for Enzymatic and Non-Enzymatic Antioxidant Activities with Special Reference to Medicinal Plant. In Antioxidant Enzyme; El-Missiry, A.M., Ed.; IntechOpen: London, UK, 2012; Chapter 15; pp. 381–400. [Google Scholar] [CrossRef]
- Govindaraj, M.; Masilamani, P.V.; Albert, A.; Bhaskaran, M. Role of antioxidant in seed quality—A review. Agric. Rev. 2017, 38, 180–190. [Google Scholar] [CrossRef]
- Ferreira, I.C.F.R.; Abreu, R.M.V. Stress oxidativo, antioxidantes e fitoquímicos. Bioanálise 2007, 2, 32–39. [Google Scholar]
- Rossatto, T.; de-Amaral, M.N.; Benitez, L.C.; Vighi, I.L.; Braga, E.; de Magalhães, J.; Maia, A.M.M.; da Silva, P.L. Gene expression and activity of antioxidant enzymes in rice plants, cv. BRS AG, under saline stress. Physiol. Mol. Biol. Plants 2017, 23, 865–875. [Google Scholar] [CrossRef] [PubMed]
- Islam, M.; Begum, H.; Ali, M.; Kamruzzaman, M.; Hoque, S.; Hoque, M. DNA fingerprinting and genetic diversities in some Bangladeshi aus rice (Oryza sativa L.) genotypes. SAARC J. Agric. 2017, 15, 123–137. [Google Scholar] [CrossRef]
- Sanghamitra, P.; Sah, R.P.; Bagchi, T.B.; Sharma, S.G.; Kumar, A.; Munda, S.; Sahu, R.K. Evaluation of variability and environmental stability of grain quality and agronomic parameters of pigmented rice (O. sativa L.). J. Food Sci. Technol. 2018, 55, 879–890. [Google Scholar] [CrossRef]
- Mbanjo, E.G.N.; Kretzschmar, T.; Jones, H.; Ereful, N.; Blanchard, C.; Boyd, L.A.; Sreenivasulu, N. The Genetic Basis and Nutritional Benefits of Pigmented Rice Grain. Front. Genet. 2020, 11, 229. [Google Scholar] [CrossRef]
- Xu, F.; Jinsong, B.; Tae-Sung, K.; Yong-Jin, P. Genome-wide Association Mapping of Polyphenol Contents and Antioxidant Capacity in Whole-Grain Rice. J. Agric. Food Chem. 2016, 64, 4695–4703. [Google Scholar] [CrossRef]
- Zhai, S.N.; Xia, X.C.; He, Z.H. Carotenoids in Staple Cereals: Metabolism, Regulation, and Genetic Manipulation. Front. Plant Sci. 2016, 7, 1197. [Google Scholar] [CrossRef]
- Ashraf, H.; Murtaza, I.; Nazir, N.; Wani, A.B.; Naqash, S.; Husaini, A.M. Nutritional profiling of pigmented and scented rice genotypes of Kashmir Himalayas. J. Pharmacogn. Phytochem. 2017, 6, 910–916. [Google Scholar]
- Petroni, K.; Landoni, M.; Tomay, F.; Calvenzani, V. Proximate composition, polyphenol content and anti-inflammatory properties of white and pigmented Italian rice varieties. Univ. J. Agric. Res. 2017, 5, 312–321. [Google Scholar] [CrossRef]
- Furukawa, T.; Maekawa, M.; Oki, T.; Suda, I.; Iida, S.; Shimada, H.; Takamure, I.; Kadowaki, K. The Rc and Rd genes are involved in proanthocyanidin synthesis in rice pericarp. Plant J. Cell Mol. Biol. 2006, 49, 91–102. [Google Scholar] [CrossRef] [PubMed]
- Sweeney, M.T.; Thomson, M.J.; Pfeil, B.E.; Mccouch, S. Caught red-handed: Rc encodes a basic Helix-Loop-Helix protein conditioning red pricarp in rice. Plant Cell. 2006, 18, 283–294. [Google Scholar] [CrossRef] [PubMed]
- Dong, Y.J.; Xu, J.L.; Xiao, K.; Zhang, Y.J.; Zhang, J.Z.; Luo, L.J.; Mastuo, M. Genomic regions associated with the degree of red coloration in pericarp of rice (Oryza sativa L.). J. Cereal Sci. 2008, 48, 556–560. [Google Scholar] [CrossRef]
- Yoshimura, A.; Ideta, O.; Iwata, N. Linkage map of phenotype and RFLP markers in rice. Plant Mol. Biol. 1997, 35, 49–60. [Google Scholar] [CrossRef] [PubMed]
- Kim, B.G.; Kim, J.H.; Min, S.Y.; Shin, K.H.; Kim, J.H.; Kim, H.Y.; Ryu, S.N.; Ahn, J.H. Anthocyanin content in rice is related to repeat protein from Medicagotruncatula is necessary for tissue-specific anthocyanin and proanthocyanidin biosynthesis but not for trichome development. Plant Physiol. 2007, 151, 1114–1129. [Google Scholar]
- Sun, X.; Zhang, Z.; Chen, C.; Wu, W.; Ren, N.; Jiang, C.; Yu, J.; Zhao, Y.; Zheng, X.; Yang, Q.; et al. The C–S–A gene system regulates hull pigmentation and reveals evolution of anthocyanin biosynthesis pathway in rice. J. Exp. Bot. 2018, 69, 1485–1498. [Google Scholar] [CrossRef] [PubMed]
- Oikawa, T.; Maeda, H.; Oguchi, T.; Yamaguchi, T.; Tanabe, N.; Ebana, K.; Yano, M.; Ebitani, T.; Izawa, T. The birth of a black rice gene and its local spread by introgression. Plant Cell 2015, 27, 2401–2414. [Google Scholar] [CrossRef]
- Yang, X.; Xia, X.; Zeng, Y.; Nong, B.; Zhang, Z.; Wu, Y.; Xiong, F.; Zhang, Y.; Liang, H.; Deng, G.; et al. Identification of candidate genes for gelatinization temperature, gel consistency and pericarp color by GWAS in rice based on SLAF-sequencing. PLoS ONE 2018, 13, e0196690. [Google Scholar] [CrossRef]
- Shao, Y.; Tang, F.; Huang, Y.; Xu, F.; Chen, Y.; Tong, C.; Chen, H.; Bao, J. Analysis of genotype × environment interactions for polyphenols and antioxidant capacity of rice by association mapping. J. Agric. Food Chem. 2014, 62, 5361–5368. [Google Scholar] [CrossRef]
- Tan, Y.F.; Sun, M.; Xing, Y.Z.; Hua, J.P.; Sun, X.L.; Zhang, Q.F.; Corke, H. Mapping quantitative trait loci for milling quality, protein content and color characteristics of rice using a recombinant inbred line population derived from an elite rice hybrid. Theor. Appl. Genet. 2001, 103, 1037–1045. [Google Scholar] [CrossRef]
- Jin, L.; Xiao, P.; Lu, Y.; Shao, Y.F.; Shen, Y.; Bao, J.S. Quantitative trait loci for brown rice color, total phenolics and, flavonoid contents and antioxidant capacity in rice grain. Cereal Chem. 2009, 86, 609–615. [Google Scholar] [CrossRef]
- Kato, T.; Matsukawa, T.; Horibata, A. Quantitative trait loci responsible for the difference in γ-oryzanol content in brown rice between japonica-type and indica-type rice cultivars. Plant Prod. Sci. 2017, 20, 459–466. [Google Scholar] [CrossRef]
- Sahoo, S.; Sanghamitra, P.; Nanda, N.; Pawar, S.; Pandit, E.; Bastia, R.; Muduli, K.C.; Pradhan, S.K. Association of molecular markers with physio-biochemical traits related to seed vigour in rice. Physiol. Mol. Biol. Plants 2020, 26, 1989–2003. [Google Scholar] [CrossRef]
- Shih, C.H.; Chu, H.; Tang, L.K.; Sakamoto, W.; Maekawa, M.; Chu, I.K.; Wang, M.; Lo, C. Functional characterization of key structural genes in rice flavonoid biosynthesis. Planta 2008, 228, 1043–1054. [Google Scholar] [CrossRef]
- Cai, Z.; He, F.; Feng, X.; Liang, T.; Wang, H.; Ding, S.; Tian, X. Transcriptomic Analysis Reveals Important Roles of Lignin and Flavonoid Biosynthetic Pathways in Rice Thermotolerance During Reproductive Stage. Front. Genet. 2020, 11, 562937. [Google Scholar] [CrossRef]
- Bai, C.; Capell, T.; Berman, J.; Medina, V.; Sandmann, G.; Christou, P.; Zhu, C. Bottlenecks in carotenoid biosynthesis and accumulation in rice endosperm are influenced by the precursor–product balance. Plant Biotechnol. J. 2016, 14, 195–205. [Google Scholar] [CrossRef]
- You, M.K.; Lee, Y.J.; Kim, J.K.; Baek, S.A.; Jeon, Y.A.; Lim, S.H.; Ha, S.H. The organ-specific differential roles of rice DXS and DXR, the first two enzymes of the MEP pathway, in carotenoid metabolism in Oryza sativa leaves and seeds. BMC Plant Biol. 2020, 20, 167. [Google Scholar] [CrossRef]
- Tian, Y.; Wang, B.; Peng, R.; Xu, J.; Li, T.; Fu, X.; Xiong, A.; Gao, J.; Yao, Q. Enhancing carotenoid biosynthesis in rice endosperm by metabolic engineering. Plant Biotechnol. J. 2019, 17, 849–851. [Google Scholar] [CrossRef]
- Xia, D.; Hao, Z.; Yipei, W.; Pingbo, L.; Pei, F.; Bian, W.; Yuqing, H. How rice organs are colored: The genetic basis of anthocyanin biosynthesis in rice. Crop J. 2021, 9, 598–608. [Google Scholar] [CrossRef]
- Goufo, P.; Trindade, H. Rice antioxidants: Phenolic acids, flavonoids, anthocyanins, proanthocyanidins, tocopherols, tocotrienols, γ-oryzanol, and phytic acid. Food Sci. Nutr. 2014, 2, 75–104. [Google Scholar] [CrossRef] [PubMed] [PubMed Central]
- Mackon, E.; Mackon, G.J.D.E.; Ma, Y.; Kashif, M.H.; Ali, N.; Usman, B.; Liu, P. Recent Insights into Anthocyanin Pigmentation, Synthesis, Trafficking, and Regulatory Mechanisms in Rice (Oryza sativa L.) Caryopsis. Biomolecules 2021, 11, 394. [Google Scholar] [CrossRef] [PubMed]
- Huchzermeyer, B.; Menghani, E.; Khardia, P.; Shilu, A. Metabolic Pathway of Natural Antioxidants, Antioxidant Enzymes and ROS Providence. Antioxidants 2022, 11, 761. [Google Scholar] [CrossRef] [PubMed]
- Pandit, E.; Tasleem, S.; Barik, S.R.; Mohanty, D.P.; Nayak, D.K.; Mohanty, S.P.; Das, S.; Pradhan, S.K. Genome-wide association mapping reveals multiple QTLs governing tolerance response for seedling stage chilling stress in indica rice. Front. Plant Sci. 2017, 8, 552. [Google Scholar] [CrossRef] [PubMed]
- Pawar, S.; Pandit, E.; Mohanty, I.C.; Saha, D.; Pradhan, S.K. Population genetic structure and association mapping for iron toxicity tolerance in rice. PLoS ONE 2021, 16, e0246232. [Google Scholar] [CrossRef] [PubMed]
- Davis, B.H. Carotenoids. In Chemistry and Biochemistry of Plant Pigments, 2nd ed.; Goodwin, T.W., Ed.; Academic Press Inc.: London, UK, 1976; pp. 38–165. [Google Scholar]
- Madamanchi, N.R.; Donahue, J.L.; Cramer, C.L.; Alscher, R.G.; Pedersen, K. Differential response of Cu, Zn SOD in two pea cultivars during a short term exposure to SO2. Plant Mol. Biol. 1994, 26, 95–103. [Google Scholar] [CrossRef]
- Fuleki, T.; Francis, F.J. Quantitative methods for anthocyanins, extraction and determination of total anthocyanin in cranberries. J. Food Sci. 1968, 33, 72–77. [Google Scholar] [CrossRef]
- Bucci, R.; Magri, A.D.; Magri, A.L.; Marini, F. Comparison of three spectrophotometric methods for the determination of gammaoryzanol in rice bran oil. Anal. Bioanal. Chem. 2003, 375, 1254–1259. [Google Scholar] [CrossRef]
- Eberhardt, M.V.; Lee, C.Y.; Liu, R.H. Antioxidant activity of fresh apples. Nature 2000, 405, 903–904. [Google Scholar] [CrossRef]
- Serpen, A.; Gokmen, V.; Pellegrini, N.; Fogliano, V. Direct measurement of the total antioxidant capacity of cereal products. J. Cereal Sci. 2008, 48, 816–820. [Google Scholar] [CrossRef]
- Murray, M.G.; Thompson, W.F. Rapid isolation of high molecular weight plant DNA. Nucleic Acids Res. 1980, 8, 4321–4325. [Google Scholar] [CrossRef] [PubMed]
- Barik, S.R.; Pandit, E.; Pradhan, S.K.; Singh, S.; Mohapatra, T. QTL mapping for relative water content trait at reproductive stage drought tolerance in rice. Ind. J. Genet. Plant Breed. 2018, 78, 401–408. [Google Scholar]
- Barik, S.R.; Pandit, E.; Pradhan, S.K.; Mohanty, S.P.; Mohapatra, T. Genetic mapping of morpho-physiological traits involved during reproductive stage drought tolerance in rice. PLoS ONE 2009, 14, e0214979. [Google Scholar] [CrossRef] [PubMed]
- Pradhan, S.K.; Pandit, E.; Pawar, S.; Baksh, S.Y.; Mukherjee, A.K.; Mohanty, S.P. Development of flash-flood tolerant and durable bacterial blight resistant versions of mega rice variety ‘Swarna’ through marker-assisted backcross breeding. Sci. Rep. 2019, 9, 12810. [Google Scholar] [CrossRef] [PubMed]
- Liu, K.; Muse, S.V. Power Marker: An integrated analysis environment for genetic marker analysis. Bioinformatics 2005, 21, 2128–2129. [Google Scholar] [CrossRef] [PubMed]
- Pritchard, J.K.; Stephens, M.; Donnelly, P. Inference of population structure using multilocus genotype data. Genetics 2000, 155, 945–959. [Google Scholar] [CrossRef] [PubMed]
- Evanno, G.; Regnaut, S.; Goudet, J. Detecting the number of clusters of individualsusingthe software STRUCTURE: A simulation study. Mol. Ecol. 2005, 14, 2611–2620. [Google Scholar] [CrossRef] [PubMed]
- Earl, D.A.; Vonholdt, B.M. Structure Harvester: A website and program for visualizing STRUCTURE output and implementing the Evannomethod. Conserv. Genet. Resour. 2012, 4, 359–361. [Google Scholar] [CrossRef]
- Nei, M. Genetic distance between populations. Am. Nat. 1972, 106, 283–292. [Google Scholar] [CrossRef]
- Perrier, X.; Jacquemoud-Collet, J.P. DARwin Software; Version 6.0.018; CIRAD: Montpellier, France, 2006; Available online: http://darwin.cirad.fr/darwin (accessed on 24 August 2022).
- Pandit, E.; Panda, R.K.; Sahoo, A.; Pani, D.R.; Pradhan, S.K. Genetic relationship and structure analyses of root growth angle for improvement of drought avoidance in early and mid-early maturing rice genotypes. Rice Sci. 2020, 27, 124–132. [Google Scholar] [CrossRef]
- Pradhan, S.K.; Barik, S.R.; Sahoo, A.; Mohapatra, S.; Nayak, D.K.; Mahender, A.; Meher, J.; Anandan, A.; Pandit, E. Population structure, genetic diversity and molecular marker-trait association analysis for high temperature stress tolerance in rice. PLoS ONE 2016, 11, 123. [Google Scholar] [CrossRef] [PubMed]
- Bradbury, P.J.; Zhang, Z.; Kroon, D.E.; Casstevens, T.M.; Ramdoss, Y.; Buckler, E.S. TASSEL: Software for association mapping of complex traits in diverse samples. Bioinform. Appl. Note 2007, 23, 2633–2635. [Google Scholar] [CrossRef] [PubMed]
- Sanghamitra, P.; Bagchi, T.B.; Sharma, S.G.; Sarkar, S.; Basak, N. Characterization of red and purple-pericarp rice (Oryzasativa L.) based on physico-chemical and antioxidative properties of grains. Oryza 2017, 54, 57–64. [Google Scholar]
- Sanghamitra, P.; Nanda, N.; Barik, S.; Sahoo, S.; Pandit, E.; Bastia, R.; Bagchi, T.B.; Pradhan, S.K. Genetic structure and molecular markers-trait association for physiological traits related to seed vigour in rice. Plant Gene 2021, 28. [Google Scholar] [CrossRef]
- Arjun, P.; Wagh, M.; Pawar, S.; Mohanty, I.C.; Pandit, E.; Meher, J.; Pradhan, S.K. Genetic Structure and Markers—Trait Association Analyses for Fe-Toxicity Tolerance, Grain-Fe Content and Yield Component Traits in Rice. J. Plant Biol. Crop Res. 2020, 3, 1022. [Google Scholar]
- Patra, B.C.; Dhua, S.R. Agro-morphological diversity scenario in upland rice germplasm of Jeypore tract. Genet. Resour. Crop Evol. 2003, 50, 825–828. [Google Scholar] [CrossRef]
- Barik, S.R.; Pandit, E.; Sanghamitra, P.; Mohanty, S.P.; Behera, A.; Mishra, J.; Nayak, D.K.; Bastia, R.; Moharana, A.; Sahoo, A.; et al. Unraveling the genomic regions controlling the seed vigour index, root growth parameters and germination per cent in rice. PLoS ONE 2022, 17, e0267303. [Google Scholar] [CrossRef]
- Huang, X.; Zhao, Y.; Wei, X.; Li, C.; Wang, A.; Zhao, Q.; Li, W.; Guo, Y.; Deng, L.; Zhu, C.; et al. Genome-wide association study of flowering time and grain yield traits in a worldwide collection of rice germplasm. Nat. Genet. 2011, 44, 32–39. [Google Scholar] [CrossRef] [PubMed]
- Oselebe, H.O.; Ogah, O.; Odo, M.I.; Ogbu, K.I. Determination of Phytochemical and Antioxidant Properties of Some Rice Varieties and Hybrids Grown in Ebonyi State, Nigeria. Nig. J. Biotechnol. 2013, 26, 60–67. [Google Scholar]
- Saini, A.; Rohila, J.S.; Govindan, G.; Li, Y.F.; Sunkar, R. Splice Variants of Superoxide Dismutases in Rice and Their Expression Profiles under Abiotic Stresses. Int. J. Mol. Sci. 2021, 22, 3997. [Google Scholar] [CrossRef] [PubMed] [PubMed Central]
- Reddy, A.R. Genetic and molecular analysis of the anthocyanin pigmentation pathway in rice. In Rice Genetics III. Proceedings of the Third International Rice Genetics Symposium; Khush, G.S., Ed.; International Rice Research Institute: Manila, Philippines, 2008; pp. 341–352. [Google Scholar]
- Reddy, A.M.; Reddy, V.S.; Scheffler, B.E.; Wienand, U.; Reddy, A.R. Novel transgenic rice overexpressing anthocyanidin synthase accumulates a mixture of flavonoids leading to an increased antioxidant potential. Metab. Eng. 2007, 9, 95–111. [Google Scholar] [CrossRef] [PubMed]
- Zhang, F.; Yang, L.; Huang, W.; Luo, X.; Xie, J.; Hu, B.; Chen, Y. Flavonoid Metabolic Profiles and Gene Mapping of Rice (Oryza sativa L.) Purple Gradient Grain Hulls. Rice 2022, 15, 43. [Google Scholar] [CrossRef] [PubMed]


| Sl. No. | Kernel Color | Genotype/Vernacular Name/Accession No. | Carotenoids | SOD | TAC | GO | TFC | ABTS |
|---|---|---|---|---|---|---|---|---|
| 1 | White | Ac. 5993 | 0.115 | 0.239 | 0.209 | 43.750 | 12.333 | 8.853 |
| 2 | White | Ac. 6221 | 0.423 | 0.101 | 0.159 | 47.375 | 13.333 | 8.952 |
| 3 | White | Ac. 6183 | 0.182 | 0.015 | 0.102 | 47.125 | 13.889 | 14.119 |
| 4 | White | Ac. 6170 | 1.165 | 0.176 | 0.090 | 52.250 | 13.333 | 11.063 |
| 5 | White | Ac. 6023 | 0.112 | 0.280 | 0.143 | 33.313 | 13.000 | 10.522 |
| 6 | White | Ac. 6172 | 0.297 | 0.181 | 0.225 | 34.125 | 13.444 | 7.569 |
| 7 | White | Ac. 6027 | 0.133 | 0.175 | 0.141 | 38.188 | 12.333 | 7.983 |
| 8 | White | Ac. 6007 | 0.287 | 0.192 | 0.027 | 32.125 | 13.111 | 7.983 |
| 9 | White | Ac. 9006 | 1.014 | 0.284 | 0.064 | 70.438 | 17.889 | 11.412 |
| 10 | White | Ac. 9021 | 0.444 | 0.199 | 0.083 | 76.313 | 22.000 | 11.769 |
| 11 | Red | Ac. 9028 | 0.776 | 0.216 | 0.250 | 87.500 | 45.556 | 36.976 |
| 12 | White | Ac. 9030 | 0.686 | 0.150 | 0.123 | 39.563 | 18.667 | 11.555 |
| 13 | White | Ac. 9035 | 0.262 | 0.196 | 0.117 | 49.500 | 17.667 | 11.698 |
| 14 | Red | Ac. 9038 | 0.371 | 0.241 | 0.459 | 28.438 | 47.000 | 41.341 |
| 15 | White | Ac. 9043 | 0.308 | 0.175 | 0.061 | 39.688 | 18.444 | 8.131 |
| 16 | White | Ac. 9044A | 0.713 | 0.221 | 0.048 | 49.938 | 17.556 | 15.906 |
| 17 | Red | Ac. 20920 | 1.264 | 0.312 | 0.325 | 54.125 | 43.889 | 26.061 |
| 18 | Red | Ac. 20907 | 0.919 | 0.308 | 0.551 | 64.750 | 52.444 | 26.501 |
| 19 | White | Ac. 20845 | 1.257 | 0.265 | 0.102 | 61.250 | 18.889 | 6.442 |
| 20 | Red | Ac. 20770 | 1.379 | 0.313 | 0.568 | 62.688 | 62.333 | 35.959 |
| 21 | Red | Ac. 20627 | 1.164 | 0.245 | 0.451 | 93.375 | 45.333 | 22.694 |
| 22 | White | Ac. 20686 | 0.968 | 0.290 | 0.073 | 43.188 | 21.778 | 4.539 |
| 23 | White | Ac. 20664 | 0.828 | 0.256 | 0.070 | 51.938 | 19.778 | 7.028 |
| 24 | Red | Ac. 20614 | 0.727 | 0.273 | 0.609 | 85.250 | 62.841 | 38.448 |
| 25 | White | Jhagrikartik | 0.080 | 0.209 | 0.167 | 39.688 | 15.222 | 10.623 |
| 26 | White | Dadghani | 0.411 | 0.206 | 0.130 | 51.875 | 16.000 | 12.606 |
| 27 | White | Shayam | 0.455 | 0.196 | 0.170 | 58.313 | 19.333 | 12.677 |
| 28 | White | Basumati-B | 0.091 | 0.177 | 0.124 | 55.750 | 20.667 | 15.935 |
| 29 | Red | Bharati | 0.108 | 0.235 | 0.442 | 41.250 | 35.667 | 33.669 |
| 30 | White | Joha | 0.094 | 0.248 | 0.155 | 41.688 | 17.000 | 11.402 |
| 31 | Red | Adira-1 | 0.350 | 0.137 | 0.943 | 46.750 | 114.222 | 39.115 |
| 32 | Red | Adira-2 | 0.511 | 0.094 | 0.901 | 54.313 | 80.111 | 38.316 |
| 33 | Red | Adira-3 | 0.472 | 0.039 | 2.996 | 48.750 | 79.667 | 38.099 |
| 34 | Red | PK6 | 0.217 | 0.112 | 1.168 | 46.125 | 62.222 | 33.091 |
| 35 | Red | Vachaw | 0.388 | 0.078 | 1.568 | 47.563 | 54.111 | 39.317 |
| 36 | Red | Kozhivalan | 0.476 | 0.007 | 0.684 | 51.500 | 67.667 | 27.279 |
| 37 | Red | Marathondi | 0.479 | 0.059 | 0.501 | 45.188 | 45.556 | 35.626 |
| 38 | Red | Ezhoml-2 | 0.234 | 0.035 | 0.801 | 46.688 | 85.667 | 33.512 |
| 39 | Red | Jyothi | 0.437 | 0.062 | 0.901 | 56.750 | 58.889 | 31.916 |
| 40 | Red | Kantakapura | 0.947 | 0.068 | 0.417 | 39.000 | 62.333 | 36.994 |
| 41 | Red | Kantakaamala | 1.202 | 0.116 | 0.451 | 34.875 | 60.111 | 31.503 |
| 42 | Red | Kapanthi | 0.989 | 0.177 | 0.451 | 10.813 | 41.444 | 41.757 |
| 43 | White | Karpurkanti | 1.052 | 0.155 | 0.079 | 44.625 | 18.333 | 12.645 |
| 44 | Red | Kathidhan | 0.087 | 0.143 | 0.601 | 25.750 | 35.222 | 28.107 |
| 45 | Red | Kundadhan | 0.489 | 0.008 | 0.876 | 30.063 | 56.556 | 39.595 |
| 46 | Red | Champaeisiali | 0.360 | 0.222 | 0.534 | 20.688 | 31.444 | 30.275 |
| 47 | White | Latamahu | 0.493 | 0.189 | 0.141 | 23.375 | 21.444 | 13.584 |
| 48 | Red | Latachaunri | 0.507 | 0.211 | 1.018 | 19.875 | 50.444 | 30.925 |
| 49 | White | Ac. 10608 | 0.427 | 0.087 | 0.108 | 43.125 | 12.333 | 10.414 |
| 50 | White | Ac. 10187 | 0.395 | 0.159 | 0.085 | 30.063 | 37.111 | 12.981 |
| 51 | Red | Ac. 10162 | 0.259 | 0.192 | 0.526 | 45.000 | 81.333 | 32.397 |
| 52 | White | Ac. 7282 | 0.136 | 0.047 | 0.084 | 37.063 | 20.667 | 10.335 |
| 53 | White | Ac. 7269 | 0.119 | 0.005 | 0.204 | 43.938 | 14.111 | 10.189 |
| 54 | White | Ac. 7134 | 0.418 | 0.144 | 0.118 | 46.438 | 17.333 | 6.841 |
| 55 | White | Ac. 7008 | 0.913 | 0.011 | 0.078 | 42.438 | 22.444 | 9.534 |
| 56 | White | Ac. 9093 | 0.357 | 0.215 | 0.061 | 45.750 | 17.000 | 11.270 |
| 57 | White | Ac. 9090 | 0.255 | 0.221 | 0.079 | 48.438 | 16.667 | 10.556 |
| 58 | White | Ac. 9076A | 0.899 | 0.159 | 0.048 | 43.688 | 22.889 | 12.126 |
| 59 | Red | Ac. 9065 | 0.353 | 0.176 | 0.359 | 44.875 | 61.778 | 30.485 |
| 60 | Red | Ac. 9063 | 0.860 | 0.235 | 0.375 | 110.563 | 52.222 | 23.538 |
| 61 | White | Ac. 9058 | 0.573 | 0.126 | 0.055 | 5.313 | 23.222 | 11.698 |
| 62 | White | Ac. 9053A | 0.154 | 0.159 | 0.053 | 42.000 | 17.333 | 9.415 |
| 63 | Red | Ac. 9050 | 0.395 | 0.191 | 0.388 | 28.313 | 54.889 | 32.411 |
| 64 | White | Ac. 9005 | 1.612 | 0.268 | 0.126 | 47.375 | 24.333 | 14.622 |
| 65 | White | Ac. 20389 | 1.247 | 0.279 | 0.035 | 66.250 | 19.333 | 10.102 |
| 66 | White | Ac. 20371 | 0.839 | 0.284 | 0.083 | 110.000 | 32.000 | 6.149 |
| 67 | Red | Ac. 20423 | 0.713 | 0.182 | 0.434 | 46.625 | 53.000 | 33.031 |
| 68 | White | Ac. 20362 | 0.811 | 0.312 | 0.077 | 68.750 | 19.222 | 10.688 |
| 69 | White | Ac. 20328 | 1.331 | 0.312 | 0.078 | 67.500 | 22.000 | 6.076 |
| 70 | White | Ac. 20317 | 0.870 | 0.332 | 0.102 | 79.063 | 23.444 | 10.542 |
| 71 | Red | Ac. 20282 | 1.118 | 0.201 | 1.043 | 84.500 | 76.889 | 42.167 |
| 72 | Red | Ac. 20246 | 1.083 | 0.279 | 2.846 | 67.875 | 69.333 | 41.947 |
| 73 | Red | Ac. 20347 | 1.188 | 0.292 | 0.272 | 57.313 | 23.778 | 27.906 |
| 74 | White | Palinadhan-1 | 0.094 | 0.342 | 0.150 | 38.313 | 21.000 | 14.589 |
| 75 | White | Chatuimuchi | 0.525 | 0.322 | 0.120 | 49.875 | 18.778 | 16.714 |
| 76 | White | Uttarbangalocal-9 | 0.098 | 0.296 | 0.060 | 51.500 | 18.333 | 15.439 |
| 77 | White | Gochi | 0.098 | 0.323 | 0.118 | 42.000 | 22.000 | 14.731 |
| 78 | White | Sugandha-2 | 0.273 | 0.278 | 0.127 | 57.125 | 19.444 | 11.615 |
| 79 | White | Jhingesal | 0.423 | 0.209 | 0.163 | 39.750 | 19.000 | 13.456 |
| 80 | Red | Cheruvirippu | 0.315 | 0.114 | 0.676 | 37.313 | 89.667 | 37.205 |
| 81 | Red | Mahamaga | 0.343 | 0.187 | 0.584 | 38.000 | 40.778 | 33.861 |
| 82 | White | Jaya | 0.091 | 0.079 | 0.093 | 43.688 | 14.778 | 16.255 |
| 83 | Red | D1 | 0.164 | 0.153 | 0.451 | 81.938 | 73.111 | 37.997 |
| 84 | Red | Pk-21 | 0.269 | 0.169 | 0.568 | 40.000 | 44.222 | 32.964 |
| 85 | White | Gandhakasala | 0.066 | 0.250 | 0.129 | 66.750 | 17.000 | 13.353 |
| 86 | Red | Sreyas | 0.217 | 0.148 | 0.618 | 57.375 | 119.889 | 31.495 |
| 87 | Red | Gondiachampeisiali | 0.762 | 0.213 | 0.626 | 24.750 | 54.556 | 24.855 |
| 88 | White | Chinamal | 0.748 | 0.300 | 0.111 | 18.313 | 22.222 | 9.104 |
| 89 | White | Magra | 0.146 | 0.311 | 0.119 | 19.875 | 17.111 | 9.971 |
| 90 | Red | Landi | 1.380 | 0.142 | 0.918 | 28.000 | 63.111 | 29.480 |
| 91 | White | Lalgundi | 0.353 | 0.289 | 0.124 | 10.563 | 22.222 | 11.272 |
| 92 | White | Balisaralaktimachi | 0.234 | 0.253 | 0.116 | 18.750 | 39.111 | 11.922 |
| 93 | White | Laxmibilash | 0.289 | 0.191 | 0.211 | 40.813 | 18.667 | 12.139 |
| 94 | Red | Kaniar | 1.027 | 0.214 | 0.651 | 39.000 | 16.778 | 21.532 |
| 95 | White | Kanakchampa | 0.129 | 0.272 | 0.159 | 39.313 | 16.444 | 15.795 |
| 96 | White | Magura-s | 0.210 | 0.295 | 0.134 | 43.063 | 16.000 | 13.512 |
| 97 | White | Ac. 44603 | 1.098 | 0.227 | 0.110 | 60.875 | 43.889 | 13.088 |
| 98 | Red | Ac. 44585 | 0.693 | 0.188 | 0.918 | 61.000 | 80.111 | 38.705 |
| 99 | White | Ac. 44598 | 1.938 | 0.124 | 0.224 | 59.313 | 28.889 | 11.618 |
| 100 | Red | Ac. 44592 | 1.032 | 0.118 | 2.320 | 64.938 | 242.000 | 50.515 |
| 101 | Red | Ac. 44646 | 1.025 | 0.251 | 10.407 | 63.938 | 316.889 | 58.750 |
| 102 | White | Ac. 44604 | 1.259 | 0.203 | 0.149 | 60.313 | 28.889 | 13.015 |
| 103 | White | Ac. 44597 | 1.735 | 0.075 | 0.116 | 54.875 | 40.654 | 13.015 |
| 104 | White | Ac. 44638 | 0.801 | 0.161 | 0.104 | 77.250 | 55.667 | 9.559 |
| 105 | Red | Ac. 44595 | 1.014 | 0.145 | 6.618 | 66.500 | 334.111 | 69.412 |
| 106 | Red | Ac. 44588 | 0.910 | 0.223 | 1.302 | 59.750 | 227.778 | 50.368 |
| 107 | Red | Ac. 44591 | 1.158 | 0.206 | 0.818 | 47.188 | 124.111 | 35.147 |
| 108 | Red | Ac. 44594 | 0.986 | 0.191 | 3.388 | 60.563 | 183.222 | 35.735 |
| 109 | Red | Ac. 43737 | 0.136 | 0.295 | 11.934 | 37.375 | 230.222 | 48.544 |
| 110 | White | Ac. 43660 | 1.197 | 0.292 | 0.220 | 41.250 | 26.778 | 12.955 |
| 111 | White | Ac. 43732 | 0.665 | 0.257 | 0.079 | 31.063 | 33.778 | 35.239 |
| 112 | White | Ac. 43661 | 0.164 | 0.281 | 0.107 | 43.000 | 50.778 | 24.600 |
| 113 | Red | Ac. 43738 | 0.164 | 0.274 | 11.274 | 47.500 | 246.000 | 53.566 |
| 114 | White | Ac. 43669 | 1.028 | 0.243 | 0.115 | 55.063 | 31.505 | 40.175 |
| 115 | White | Ac. 43663 | 0.154 | 0.269 | 0.217 | 40.625 | 62.667 | 15.429 |
| 116 | Red | Ac. 43658 | 0.325 | 0.269 | 19.796 | 38.688 | 79.778 | 52.475 |
| 117 | White | Ac. 43662 | 0.112 | 0.258 | 0.079 | 36.375 | 66.222 | 13.028 |
| 118 | Red | Ac. 43670 | 0.115 | 0.282 | 28.375 | 56.813 | 358.444 | 81.441 |
| 119 | White | Ac. 43675 | 0.168 | 0.238 | 0.115 | 40.875 | 24.444 | 32.678 |
| 120 | Red | Ac. 43676 | 0.161 | 0.186 | 10.280 | 34.188 | 226.333 | 46.288 |
| Mean | 0.586 | 0.200 | 1.924 | 48.209 | 61.059 | 20.678 | ||
| CV | 12.25 | 3.100 | 12.800 | 1.810 | 6.700 | 6.200 | ||
| LSD5% | 0.174 | 0.0582 | 0.389 | 3.523 | 7.833 | 2.421 |
| Sl. No | Marker | No. of Alleles | Range of Amplicon (bp) | Major Allele Frequency | Gene Diversity | Heterozygosity | PIC | Inbreeding Coefficient (f) |
|---|---|---|---|---|---|---|---|---|
| 1 | RM5310 | 4 | 140–190 | 0.783 | 0.367 | 0.033 | 0.343 | 0.910 |
| 2 | RM582 | 4 | 210–245 | 0.708 | 0.466 | 0.033 | 0.433 | 0.929 |
| 3 | RM13335 | 4 | 160–180 | 0.563 | 0.532 | 0.008 | 0.435 | 0.984 |
| 4 | RM6275 | 4 | 140–160 | 0.721 | 0.447 | 0.058 | 0.411 | 0.870 |
| 5 | RM50 | 4 | 190–205 | 0.400 | 0.689 | 0.025 | 0.630 | 0.964 |
| 6 | RM85 | 4 | 80–110 | 0.413 | 0.675 | 0.125 | 0.615 | 0.816 |
| 7 | RM222 | 4 | 210–250 | 0.629 | 0.557 | 0.025 | 0.519 | 0.956 |
| 8 | RM247 | 5 | 140–200 | 0.500 | 0.597 | 0.067 | 0.519 | 0.889 |
| 9 | RM328 | 3 | 185–200 | 0.567 | 0.580 | 0.000 | 0.513 | 1.000 |
| 10 | RM337 | 6 | 155–400 | 0.446 | 0.668 | 0.117 | 0.612 | 0.827 |
| 11 | RM340 | 5 | 100–220 | 0.713 | 0.454 | 0.100 | 0.415 | 0.781 |
| 12 | RM470 | 5 | 60–140 | 0.463 | 0.690 | 0.833 | 0.644 | −0.203 |
| 13 | RM472 | 3 | 290–410 | 0.513 | 0.508 | 0.092 | 0.387 | 0.821 |
| 14 | RM506 | 3 | 120–130 | 0.683 | 0.459 | 0.133 | 0.390 | 0.712 |
| 15 | RM1812 | 3 | 130–140 | 0.442 | 0.607 | 0.000 | 0.523 | 1.000 |
| 16 | RM3701 | 4 | 160–260 | 0.675 | 0.484 | 0.492 | 0.428 | −0.012 |
| 17 | RM6947 | 3 | 150–160 | 0.883 | 0.212 | 0.000 | 0.199 | 1.000 |
| 18 | RM14978 | 3 | 240–250 | 0.417 | 0.639 | 0.000 | 0.563 | 1.000 |
| 19 | RM18776 | 3 | 175–200 | 0.846 | 0.267 | 0.025 | 0.242 | 0.907 |
| 20 | RM22034 | 3 | 75–85 | 0.917 | 0.155 | 0.000 | 0.147 | 1.000 |
| 21 | RM24161 | 4 | 270–290 | 0.542 | 0.612 | 0.117 | 0.552 | 0.811 |
| 22 | RM223 | 5 | 110–170 | 0.654 | 0.536 | 0.058 | 0.504 | 0.892 |
| 23 | RM440 | 5 | 160–210 | 0.408 | 0.689 | 0.258 | 0.634 | 0.628 |
| 24 | RM201 | 4 | 150–160 | 0.467 | 0.645 | 0.217 | 0.581 | 0.666 |
| 25 | RM216 | 4 | 145–160 | 0.513 | 0.639 | 0.125 | 0.583 | 0.806 |
| 26 | RM258 | 3 | 140–150 | 0.383 | 0.652 | 0.000 | 0.576 | 1.000 |
| 27 | RM286 | 4 | 100–130 | 0.471 | 0.632 | 0.100 | 0.562 | 0.843 |
| 28 | RM3735 | 4 | 135–500 | 0.333 | 0.725 | 0.958 | 0.674 | −0.318 |
| 29 | RM1347 | 3 | 100–110 | 0.517 | 0.566 | 0.000 | 0.475 | 1.000 |
| 30 | RM7571 | 3 | 130–140 | 0.713 | 0.433 | 0.008 | 0.373 | 0.981 |
| 31 | RM14723 | 4 | 220–250 | 0.492 | 0.643 | 0.200 | 0.581 | 0.691 |
| 32 | RM103 | 3 | 255–330 | 0.492 | 0.559 | 0.767 | 0.461 | −0.369 |
| 33 | RM315 | 3 | 135–140 | 0.867 | 0.235 | 0.000 | 0.214 | 1.000 |
| 34 | RM225 | 3 | 135–150 | 0.525 | 0.547 | 0.183 | 0.449 | 0.667 |
| 35 | RM486 | 3 | 130–140 | 0.654 | 0.469 | 0.108 | 0.380 | 0.770 |
| 36 | RM256 | 3 | 110–150 | 0.721 | 0.411 | 0.058 | 0.339 | 0.859 |
| 37 | RM1113 | 3 | 150–180 | 0.671 | 0.457 | 0.058 | 0.373 | 0.873 |
| 38 | RM3423 | 3 | 125–140 | 0.500 | 0.575 | 0.000 | 0.484 | 1.000 |
| 39 | RM6100 | 3 | 170–180 | 0.442 | 0.643 | 0.033 | 0.569 | 0.949 |
| 40 | RM590 | 3 | 140–150 | 0.725 | 0.431 | 0.067 | 0.384 | 0.846 |
| 41 | RM5793 | 3 | 115–130 | 0.633 | 0.525 | 0.017 | 0.464 | 0.969 |
| 42 | RM405 | 3 | 100–110 | 0.675 | 0.491 | 0.000 | 0.441 | 1.000 |
| 43 | RM547 | 5 | 190–300 | 0.471 | 0.573 | 0.167 | 0.481 | 0.711 |
| 44 | RM7364 | 5 | 180–250 | 0.621 | 0.573 | 0.167 | 0.541 | 0.711 |
| 45 | RM205 | 3 | 130–180 | 0.621 | 0.532 | 0.025 | 0.467 | 0.953 |
| 46 | RM167 | 4 | 130–180 | 0.704 | 0.463 | 0.100 | 0.421 | 0.786 |
| 47 | RM229 | 5 | 120–140 | 0.358 | 0.710 | 0.133 | 0.657 | 0.814 |
| 48 | RM20A | 3 | 230–240 | 0.625 | 0.533 | 0.017 | 0.472 | 0.969 |
| 49 | RM235 | 5 | 100–145 | 0.396 | 0.719 | 0.175 | 0.671 | 0.758 |
| 50 | RM7003 | 4 | 100–110 | 0.667 | 0.502 | 0.083 | 0.453 | 0.835 |
| 51 | RM5436 | 4 | 155–190 | 0.442 | 0.621 | 0.058 | 0.545 | 0.907 |
| 52 | RM25181 | 5 | 130–160 | 0.379 | 0.710 | 0.167 | 0.660 | 0.767 |
| 53 | RM469 | 3 | 100–110 | 0.621 | 0.524 | 0.042 | 0.452 | 0.921 |
| 54 | RM6547 | 3 | 155–165 | 0.867 | 0.240 | 0.017 | 0.226 | 0.931 |
| 55 | RM152 | 4 | 145–155 | 0.508 | 0.628 | 0.017 | 0.565 | 0.974 |
| 56 | RM148 | 2 | 140–150 | 0.675 | 0.439 | 0.083 | 0.342 | 0.812 |
| 57 | RM421 | 3 | 250–260 | 0.458 | 0.631 | 0.000 | 0.555 | 1.000 |
| 58 | RM2634 | 3 | 100–120 | 0.379 | 0.658 | 0.025 | 0.584 | 0.962 |
| 59 | RM248 | 4 | 75–115 | 0.346 | 0.732 | 0.117 | 0.684 | 0.842 |
| 60 | RM7179 | 5 | 50–250 | 0.325 | 0.765 | 0.358 | 0.727 | 0.535 |
| 61 | RM215 | 3 | 155–165 | 0.617 | 0.491 | 0.017 | 0.392 | 0.966 |
| 62 | RM324 | 4 | 220–260 | 0.542 | 0.635 | 0.158 | 0.590 | 0.753 |
| 63 | RM317 | 3 | 150–160 | 0.725 | 0.403 | 0.000 | 0.328 | 1.000 |
| 64 | RM174 | 3 | 230–270 | 0.508 | 0.621 | 0.067 | 0.551 | 0.893 |
| 65 | RM556 | 3 | 190–210 | 0.842 | 0.279 | 0.033 | 0.260 | 0.881 |
| 66 | RM257 | 4 | 130–155 | 0.408 | 0.663 | 0.233 | 0.595 | 0.651 |
| 67 | RM502 | 3 | 260–265 | 0.808 | 0.318 | 0.000 | 0.281 | 1.000 |
| 68 | RM331 | 4 | 95–115 | 0.483 | 0.664 | 0.058 | 0.611 | 0.913 |
| 69 | RM403 | 4 | 110–130 | 0.596 | 0.570 | 0.083 | 0.515 | 0.855 |
| 70 | RM309 | 3 | 180–190 | 0.696 | 0.460 | 0.025 | 0.405 | 0.946 |
| 71 | RM6641 | 3 | 140–145 | 0.567 | 0.583 | 0.000 | 0.517 | 1.000 |
| 72 | RM3 | 3 | 110–120 | 0.383 | 0.663 | 0.033 | 0.589 | 0.950 |
| 73 | RM594 | 3 | 300–320 | 0.588 | 0.558 | 0.008 | 0.488 | 0.985 |
| 74 | RM3392 | 4 | 160–180 | 0.504 | 0.615 | 0.108 | 0.545 | 0.825 |
| 75 | RM1278 | 3 | 135–150 | 0.783 | 0.361 | 0.067 | 0.329 | 0.817 |
| 76 | RM168 | 3 | 95–125 | 0.625 | 0.510 | 0.150 | 0.431 | 0.708 |
| 77 | RM3375 | 3 | 190–200 | 0.567 | 0.576 | 0.033 | 0.506 | 0.943 |
| 78 | RM282 | 3 | 140–150 | 0.725 | 0.436 | 0.000 | 0.395 | 1.000 |
| 79 | RM26632 | 4 | 450–550 | 0.363 | 0.701 | 0.158 | 0.644 | 0.776 |
| 80 | RM1341 | 3 | 170–190 | 0.613 | 0.529 | 0.025 | 0.455 | 0.953 |
| 81 | RM4112 | 3 | 160–170 | 0.488 | 0.623 | 0.158 | 0.549 | 0.748 |
| 82 | RM20377 | 4 | 300–380 | 0.771 | 0.369 | 0.067 | 0.326 | 0.821 |
| 83 | RM210 | 5 | 130–180 | 0.363 | 0.734 | 0.700 | 0.687 | 0.051 |
| 84 | RM218 | 4 | 130–160 | 0.583 | 0.585 | 0.033 | 0.531 | 0.943 |
| 85 | RM494 | 5 | 130–180 | 0.383 | 0.717 | 0.025 | 0.670 | 0.965 |
| 86 | RM336 | 5 | 105–160 | 0.383 | 0.711 | 0.092 | 0.661 | 0.872 |
| 87 | RM3475 | 4 | 135–160 | 0.450 | 0.656 | 0.042 | 0.591 | 0.937 |
| 88 | RM480 | 4 | 190–210 | 0.538 | 0.618 | 0.025 | 0.561 | 0.960 |
| 89 | RM566 | 4 | 150–200 | 0.433 | 0.656 | 0.017 | 0.591 | 0.975 |
| 90 | RM11701 | 3 | 210–230 | 0.642 | 0.471 | 0.000 | 0.375 | 1.000 |
| 91 | RM220 | 6 | 85–130 | 0.358 | 0.745 | 0.183 | 0.703 | 0.756 |
| 92 | RM488 | 6 | 155–200 | 0.321 | 0.750 | 0.192 | 0.708 | 0.746 |
| 93 | RM6374 | 6 | 130–160 | 0.338 | 0.771 | 0.075 | 0.737 | 0.904 |
| 94 | RM233 | 5 | 130–160 | 0.350 | 0.727 | 0.233 | 0.680 | 0.681 |
| 95 | RM112 | 3 | 130–135 | 0.875 | 0.222 | 0.000 | 0.204 | 1.000 |
| 96 | RM13600 | 4 | 105–130 | 0.479 | 0.662 | 0.100 | 0.607 | 0.850 |
| 97 | RM495 | 3 | 145–165 | 0.600 | 0.560 | 0.033 | 0.499 | 0.941 |
| 98 | RM493 | 7 | 180–250 | 0.283 | 0.813 | 0.558 | 0.787 | 0.317 |
| 99 | RM444 | 5 | 180–240 | 0.321 | 0.773 | 0.158 | 0.737 | 0.797 |
| 100 | RM468 | 3 | 210–220 | 0.771 | 0.379 | 0.025 | 0.346 | 0.935 |
| 101 | RM6054 | 3 | 120–130 | 0.925 | 0.142 | 0.017 | 0.137 | 0.883 |
| 102 | RM509 | 3 | 165–170 | 0.758 | 0.395 | 0.000 | 0.360 | 1.000 |
| 103 | RM5638 | 6 | 190–240 | 0.613 | 0.587 | 0.133 | 0.558 | 0.775 |
| 104 | RM8044 | 6 | 240–300 | 0.279 | 0.761 | 0.233 | 0.721 | 0.695 |
| 105 | RM8271 | 5 | 180–250 | 0.404 | 0.723 | 0.133 | 0.679 | 0.817 |
| 106 | RM171 | 4 | 380–420 | 0.517 | 0.633 | 0.058 | 0.575 | 0.909 |
| 107 | RM16686 | 3 | 90–100 | 0.417 | 0.655 | 0.000 | 0.581 | 1.000 |
| 108 | RM434 | 4 | 250–280 | 0.567 | 0.595 | 0.025 | 0.537 | 0.958 |
| 109 | RM6091 | 4 | 70–80 | 0.817 | 0.318 | 0.000 | 0.299 | 1.000 |
| 110 | RM209 | 4 | 145–175 | 0.542 | 0.612 | 0.000 | 0.552 | 1.000 |
| 111 | RM245 | 4 | 145–155 | 0.583 | 0.577 | 0.000 | 0.518 | 1.000 |
| 112 | RM1089 | 4 | 210–260 | 0.417 | 0.637 | 0.067 | 0.565 | 0.896 |
| 113 | RM228 | 4 | 110–170 | 0.625 | 0.544 | 0.192 | 0.491 | 0.650 |
| 114 | RM401 | 3 | 250–300 | 0.754 | 0.398 | 0.058 | 0.360 | 0.855 |
| 115 | RM11 | 3 | 140–160 | 0.463 | 0.590 | 0.008 | 0.502 | 0.986 |
| 116 | RM3351 | 3 | 170–190 | 0.583 | 0.517 | 0.000 | 0.420 | 1.000 |
| 117 | RM5749 | 3 | 130–160 | 0.588 | 0.504 | 0.025 | 0.400 | 0.951 |
| 118 | RM335 | 2 | 100–110 | 0.721 | 0.402 | 0.075 | 0.321 | 0.815 |
| 119 | RM144 | 3 | 200–210 | 0.588 | 0.516 | 0.158 | 0.419 | 0.695 |
| 120 | RM300 | 3 | 125–145 | 0.867 | 0.238 | 0.017 | 0.221 | 0.930 |
| 121 | RM1132 | 4 | 90–125 | 0.358 | 0.724 | 0.033 | 0.674 | 0.954 |
| 122 | RM400 | 4 | 210–260 | 0.367 | 0.717 | 0.467 | 0.665 | 0.353 |
| 123 | RM471 | 3 | 100–120 | 0.800 | 0.338 | 0.000 | 0.309 | 1.000 |
| 124 | RM243 | 3 | 120–140 | 0.575 | 0.554 | 0.017 | 0.475 | 0.970 |
| 125 | RM467 | 3 | 200–210 | 0.558 | 0.575 | 0.000 | 0.502 | 1.000 |
| 126 | RM564 | 4 | 250–300 | 0.450 | 0.599 | 0.100 | 0.515 | 0.834 |
| 127 | RM8007 | 3 | 130–150 | 0.767 | 0.385 | 0.000 | 0.352 | 1.000 |
| 128 | RM441 | 4 | 160–200 | 0.475 | 0.627 | 0.567 | 0.557 | 0.100 |
| 129 | RM518 | 3 | 150–170 | 0.542 | 0.537 | 0.000 | 0.437 | 1.000 |
| 130 | RM253 | 4 | 130–170 | 0.554 | 0.594 | 0.083 | 0.530 | 0.861 |
| 131 | RM274 | 3 | 75–80 | 0.667 | 0.477 | 0.000 | 0.406 | 1.000 |
| 132 | RM242 | 4 | 200–240 | 0.575 | 0.591 | 0.017 | 0.536 | 0.972 |
| 133 | RM3231 | 4 | 170–550 | 0.346 | 0.703 | 0.650 | 0.645 | 0.080 |
| 134 | RM5687 | 4 | 160–500 | 0.417 | 0.687 | 0.650 | 0.630 | 0.059 |
| 135 | RM5626 | 3 | 165–180 | 0.583 | 0.512 | 0.733 | 0.411 | −0.430 |
| 136 | RM452 | 3 | 240–250 | 0.475 | 0.618 | 0.000 | 0.541 | 1.000 |
| Mean | 3.74 | –– | 0.561 | 0.555 | 0.116 | 0.496 | 0.793 |
| Sl. No. | Accession No./ Vernacular Name of Germplasm Line | Inferred Ancestry Value at K = 4 | Antioxidants Content in Each Germplasm Line | ||||
|---|---|---|---|---|---|---|---|
| Q1 | Q2 | Q3 | Q4 | Group | |||
| 1 | Ac. 5993 | 0.986 | 0.009 | 0.003 | 0.003 | SP1 | high SOD |
| 2 | Ac. 6221 | 0.984 | 0.006 | 0.003 | 0.007 | SP1 | Low |
| 3 | Ac. 6183 | 0.945 | 0.003 | 0.003 | 0.049 | SP1 | Low |
| 4 | Ac. 6170 | 0.994 | 0.002 | 0.002 | 0.002 | SP1 | high Carotenoid |
| 5 | Ac. 6023 | 0.978 | 0.009 | 0.002 | 0.012 | SP1 | high SOD |
| 6 | Ac. 6172 | 0.963 | 0.005 | 0.002 | 0.03 | SP1 | Low |
| 7 | Ac. 6027 | 0.012 | 0.002 | 0.983 | 0.002 | SP3 | Low |
| 8 | Ac. 6007 | 0.994 | 0.002 | 0.002 | 0.003 | SP1 | Low |
| 9 | Ac. 9006 | 0.973 | 0.006 | 0.009 | 0.012 | SP1 | high |
| 10 | Ac. 9021 | 0.927 | 0.053 | 0.005 | 0.015 | SP1 | Low |
| 11 | Ac. 9028 | 0.924 | 0.006 | 0.003 | 0.066 | SP1 | high GO& SOD |
| 12 | Ac. 9030 | 0.989 | 0.005 | 0.001 | 0.005 | SP1 | Low |
| 13 | Ac. 9035 | 0.959 | 0.021 | 0.017 | 0.003 | SP1 | Low |
| 14 | Ac. 9038 | 0.982 | 0.015 | 0.001 | 0.002 | SP1 | high SOD |
| 15 | Ac. 9043 | 0.95 | 0.046 | 0.002 | 0.002 | SP1 | Low |
| 16 | Ac. 9044 | 0.987 | 0.006 | 0.004 | 0.003 | SP1 | high SOD |
| 17 | Ac. 20920 | 0.51 | 0.48 | 0.007 | 0.004 | Admix | high SOD & Carotenoid |
| 18 | Ac. 20907 | 0.866 | 0.131 | 0.001 | 0.002 | SP1 | high SOD |
| 19 | Ac. 20845 | 0.087 | 0.907 | 0.001 | 0.005 | SP2 | high Carotenoid |
| 20 | Ac. 20770 | 0.966 | 0.025 | 0.008 | 0.002 | SP1 | high SOD & Carotenoid |
| 21 | Ac. 20627 | 0.378 | 0.619 | 0.001 | 0.002 | Admix | high Carotenoid & SOD |
| 22 | Ac. 20686 | 0.432 | 0.564 | 0.002 | 0.002 | Admix | high SOD |
| 23 | Ac. 20664 | 0.006 | 0.99 | 0.001 | 0.003 | SP2 | Medium |
| 24 | Ac. 20614 | 0.109 | 0.887 | 0.003 | 0.001 | SP2 | high SOD |
| 25 | Jhagrikarti | 0.97 | 0.02 | 0.002 | 0.008 | SP1 | high GO |
| 26 | Dadghani | 0.963 | 0.03 | 0.003 | 0.004 | SP1 | high SOD |
| 27 | Shayam | 0.004 | 0.002 | 0.993 | 0.002 | SP3 | Very low |
| 28 | Basumati | 0.128 | 0.005 | 0.862 | 0.005 | SP3 | Very low |
| 29 | Bharati | 0.551 | 0.444 | 0.004 | 0.001 | Admix | high SOD |
| 30 | Joha | 0.973 | 0.023 | 0.002 | 0.002 | SP1 | high SOD |
| 31 | Adira-1 | 0.586 | 0.02 | 0.364 | 0.03 | Admix | Medium |
| 32 | Adira-2 | 0.992 | 0.004 | 0.002 | 0.002 | SP1 | Medium |
| 33 | Adira-3 | 0.256 | 0.327 | 0.413 | 0.004 | Admix | Medium |
| 34 | PK6 | 0.985 | 0.002 | 0.01 | 0.003 | SP1 | Low |
| 35 | Vachaw | 0.803 | 0.154 | 0.041 | 0.002 | SP1 | Medium |
| 36 | Kozhivalan | 0.988 | 0.008 | 0.001 | 0.002 | SP1 | Low |
| 37 | Marathondi | 0.017 | 0.486 | 0.464 | 0.033 | Admix | Medium |
| 38 | Ezhoml-2 | 0.862 | 0.135 | 0.002 | 0.001 | SP1 | Medium |
| 39 | Jyothi | 0.973 | 0.025 | 0.001 | 0.001 | SP1 | Medium |
| 40 | Kantakopura | 0.521 | 0.476 | 0.002 | 0.001 | Admix | Medium |
| 41 | Kantakaamal | 0.055 | 0.585 | 0.207 | 0.153 | Admix | Medium |
| 42 | Kapanthi | 0.032 | 0.296 | 0.333 | 0.339 | Admix | Low |
| 43 | Karpurkanti | 0.001 | 0.042 | 0.956 | 0.001 | SP3 | Very low |
| 44 | Kathidhan | 0.426 | 0.475 | 0.005 | 0.094 | Admix | Medium |
| 45 | Kundadhan | 0.005 | 0.992 | 0.001 | 0.002 | SP2 | Low |
| 46 | Champaeisia | 0.005 | 0.991 | 0.002 | 0.002 | SP2 | high SOD |
| 47 | Latamahu | 0.016 | 0.977 | 0.002 | 0.005 | SP2 | Medium |
| 48 | Latachaunri | 0.028 | 0.966 | 0.002 | 0.005 | SP2 | high SOD |
| 49 | Ac. 10608 | 0.981 | 0.013 | 0.001 | 0.005 | SP1 | Low |
| 50 | Ac. 10187 | 0.944 | 0.005 | 0.002 | 0.049 | SP1 | Low |
| 51 | Ac. 10162 | 0.941 | 0.012 | 0.021 | 0.026 | SP1 | Low |
| 52 | Ac. 7282 | 0.003 | 0.002 | 0.995 | 0.001 | SP3 | Very low |
| 53 | Ac. 7269 | 0.994 | 0.003 | 0.001 | 0.002 | SP1 | Very low |
| 54 | Ac. 7134 | 0.749 | 0.032 | 0.21 | 0.009 | Admix | Low |
| 55 | Ac. 7008 | 0.94 | 0.057 | 0.001 | 0.002 | SP1 | Low |
| 56 | Ac. 9093 | 0.99 | 0.005 | 0.004 | 0.001 | SP1 | high SOD |
| 57 | Ac. 9090 | 0.958 | 0.022 | 0.016 | 0.004 | SP1 | high SOD |
| 58 | Ac. 9076A | 0.844 | 0.148 | 0.001 | 0.007 | SP1 | Low |
| 59 | Ac. 9065 | 0.923 | 0.012 | 0.061 | 0.004 | SP1 | Low |
| 60 | Ac. 9063 | 0.667 | 0.324 | 0.001 | 0.008 | Admix | GO & SOD |
| 61 | Ac. 9058 | 0.992 | 0.005 | 0.001 | 0.001 | SP1 | Low |
| 62 | Ac. 9053A | 0.852 | 0.007 | 0.014 | 0.127 | SP1 | Low |
| 63 | Ac. 9050 | 0.894 | 0.097 | 0.007 | 0.002 | SP1 | Low |
| 64 | Ac. 9005 | 0.985 | 0.009 | 0.003 | 0.004 | SP1 | high SOD |
| 65 | Ac. 20389 | 0.963 | 0.004 | 0.008 | 0.026 | SP1 | high Carotenoid & SOD |
| 66 | Ac. 20371 | 0.976 | 0.019 | 0.001 | 0.004 | SP1 | high GO & SOD |
| 67 | Ac. 20423 | 0.975 | 0.019 | 0.001 | 0.005 | SP1 | Medium |
| 68 | Ac. 20362 | 0.968 | 0.013 | 0.006 | 0.013 | SP1 | high SOD |
| 69 | Ac. 20328 | 0.804 | 0.172 | 0.014 | 0.009 | SP1 | high SOD |
| 70 | Ac. 20317 | 0.882 | 0.089 | 0.027 | 0.003 | SP1 | high SOD |
| 71 | Ac. 20282 | 0.536 | 0.339 | 0.009 | 0.116 | Admix | high GO & SOD |
| 72 | Ac. 20246 | 0.639 | 0.262 | 0.069 | 0.03 | Admix | high SOD & Carotenoid |
| 73 | Ac. 20347 | 0.927 | 0.029 | 0.002 | 0.042 | SP1 | high SOD & Carotenoid |
| 74 | Palinadhan- | 0.321 | 0.038 | 0.381 | 0.26 | Admix | high SOD |
| 75 | Chatuimuchi | 0.001 | 0.001 | 0.996 | 0.001 | SP3 | high SOD |
| 76 | Uttarbangal | 0.743 | 0.155 | 0.002 | 0.101 | Admix | high SOD |
| 77 | Gochi | 0.943 | 0.007 | 0.007 | 0.043 | SP1 | high SOD |
| 78 | Sugandha-2 | 0.003 | 0.002 | 0.995 | 0.001 | SP3 | high SOD |
| 79 | Jhingesal | 0.365 | 0.631 | 0.001 | 0.002 | Admix | high SOD |
| 80 | Cheruviripp | 0.852 | 0.142 | 0.002 | 0.004 | SP1 | Low |
| 81 | Mahamaga | 0.548 | 0.399 | 0.002 | 0.051 | Admix | Very low |
| 82 | Jaya | 0.928 | 0.064 | 0.001 | 0.007 | SP1 | Low |
| 83 | D1 | 0.89 | 0.042 | 0.019 | 0.049 | SP1 | Low |
| 84 | PK21 | 0.705 | 0.27 | 0.002 | 0.023 | Admix | Low |
| 85 | Gandhakasal | 0.002 | 0.086 | 0.908 | 0.004 | SP3 | high SOD |
| 86 | Sreyas | 0.909 | 0.085 | 0.003 | 0.002 | SP1 | Medium |
| 87 | Gondiachampeisiali | 0.011 | 0.986 | 0.002 | 0.002 | SP2 | high SOD |
| 88 | Chinamal | 0.229 | 0.761 | 0.008 | 0.002 | Admix | high SOD |
| 89 | Magra | 0.267 | 0.726 | 0.005 | 0.003 | Admix | high SOD |
| 90 | Landi | 0.011 | 0.986 | 0.002 | 0.002 | SP2 | Low |
| 91 | Lalgundi | 0.005 | 0.988 | 0.004 | 0.003 | SP2 | high SOD |
| 92 | Balisaralak | 0.004 | 0.99 | 0.002 | 0.003 | SP2 | VL, L, SOD |
| 93 | Laxmibilash | 0.005 | 0.465 | 0.527 | 0.003 | Admix | Very low |
| 94 | Kaniar | 0.03 | 0.958 | 0.006 | 0.007 | SP2 | high Carotenoid & SOD |
| 95 | Kanakchampa | 0.037 | 0.95 | 0.009 | 0.004 | SP2 | high SOD |
| 96 | Magura-S | 0.003 | 0.984 | 0.012 | 0.001 | SP2 | high SOD |
| 97 | Ac. 44603 | 0.014 | 0.017 | 0.001 | 0.967 | SP4 | high Carotenoid & SOD |
| 98 | Ac. 44585 | 0.005 | 0.003 | 0.012 | 0.981 | SP4 | Low |
| 99 | Ac. 44598 | 0.02 | 0.003 | 0.01 | 0.968 | SP4 | high Carotenoid |
| 100 | Ac. 44592 | 0.001 | 0.001 | 0.014 | 0.984 | SP4 | high Carotenoid, TFC, ABTS |
| 101 | Ac. 44646 | 0.002 | 0.001 | 0.001 | 0.996 | SP4 | High Carotenoid, TAC, TFC, SOD, ABTS |
| 102 | Ac. 44604 | 0.028 | 0.004 | 0.012 | 0.956 | SP4 | high Carotenoid & SOD |
| 103 | Ac. 44597 | 0.002 | 0.003 | 0.001 | 0.994 | SP4 | high TFC & Carotenoid |
| 104 | Ac. 44638 | 0.001 | 0.001 | 0.701 | 0.297 | Admix | Low |
| 105 | Ac. 44595 | 0.007 | 0.003 | 0.011 | 0.978 | SP4 | high SOD, Carotenoid, ABTS |
| 106 | Ac. 44588 | 0.002 | 0.001 | 0.001 | 0.995 | SP4 | High ABTS |
| 107 | Ac. 44591 | 0.002 | 0.002 | 0.001 | 0.995 | SP4 | high Carotenoid & SOD |
| 108 | Ac. 44594 | 0.011 | 0.006 | 0.002 | 0.981 | SP4 | high SOD |
| 109 | Ac. 43737 | 0.003 | 0.002 | 0.002 | 0.993 | SP4 | high TAC & SOD |
| 110 | Ac. 43660 | 0.003 | 0.003 | 0.001 | 0.993 | SP4 | high Caro, TAC, TFC, SOD, ABTS |
| 111 | Ac. 43732 | 0.002 | 0.001 | 0.001 | 0.995 | SP4 | high SOD & ABTS |
| 112 | Ac. 43661 | 0.006 | 0.004 | 0.001 | 0.989 | SP4 | high SOD |
| 113 | Ac. 43738 | 0.002 | 0.004 | 0.002 | 0.992 | SP4 | high SOD, ABTS, TAC |
| 114 | Ac. 43669 | 0.006 | 0.004 | 0.003 | 0.987 | SP4 | high Caro, TAC, TFC, SOD |
| 115 | Ac. 43663 | 0.002 | 0.002 | 0.002 | 0.994 | SP4 | high SOD |
| 116 | Ac. 43658 | 0.001 | 0.001 | 0.001 | 0.997 | SP4 | High TAC & SOD |
| 117 | Ac. 43662 | 0.004 | 0.002 | 0.027 | 0.967 | SP4 | High SOD |
| 118 | Ac. 43670 | 0.003 | 0.003 | 0.18 | 0.815 | SP4 | High SOD, ABTS, TAC |
| 119 | Ac. 43675 | 0.003 | 0.002 | 0.014 | 0.98 | SP4 | High TAC, SOD |
| 120 | Ac. 43676 | 0.007 | 0.015 | 0.043 | 0.935 | SP4 | High SOD |
| Source of Variation | AMOVA for the Four Subpopulations at K = 4 | |||
|---|---|---|---|---|
| Df. | Mean Sum of Squares | Variance Components | Percentage Variation | |
| Among populations | 4 | 551.634 | 2.575 | 6% |
| Among individuals (accessions) within population | 115 | 2983.721 | 0.000 | 0% |
| Within individuals (accessions) | 120 | 5027.000 | 41.892 | 94% |
| Total | 239 | 8562.354 | 44.467 | 100% |
| F-Statistics | Value | p-Value | ||
| Fst | 0.071 | 0.001 | ||
| FIS | −0.235 | 1.000 | ||
| FIT | −0.148 | 1.000 | ||
| FST max. | 0.501 | |||
| F′ST | 0.141 | |||
| Sl. No | Antioxidant Compounds | Marker | Position (cM) | GLM | MLM | |||||||
|---|---|---|---|---|---|---|---|---|---|---|---|---|
| Marker_F | Marker_p | Marker_R2 | q-Value | Marker | Marker_F | Marker_p | Marker_R2 | q-Value | ||||
| 1 | SOD | RM582 | 66.4–66.4 cM | 7.51326 | 0.00713 | 0.0617 | 0.0617 | RM582 | 10.35724 | 0.00169 | 0.09191 | 0.005571 |
| 2 | SOD | RM405 | 28.6–28.6 cM | 8.28345 | 0.00479 | 0.06759 | 0.06759 | RM405 | 12.0128 | 7.52 × 10⁻⁴ | 0.10661 | 0.005571 |
| 3 | SOD | RM467 | 46.8–46.8 cM | 9.70831 | 0.00233 | 0.07829 | 0.07829 | RM467 | 9.70377 | 0.00234 | 0.08612 | 0.005571 |
| 5 | TAC | RM440 | 92.7–92.7 cM | 10.07764 | 0.00194 | 0.06646 | 0.06646 | RM440 | 9.06064 | 0.00323 | 0.08013 | 0.005726 |
| 6 | TAC | RM5638 | 86–86 cM | 12.02036 | 7.47 × 10⁻⁴ | 0.07803 | 0.07803 | RM5638 | 11.04573 | 0.0012 | 0.09768 | 0.005571 |
| 7 | TAC | RM253 | 37–37 cM | 11.30677 | 0.00106 | 0.07443 | 0.07443 | RM253 | 10.51261 | 0.00157 | 0.09297 | 0.005571 |
| 8 | TAC | RM5626 | 99–99 cM | 9.36875 | 0.00276 | 0.06215 | 0.06215 | RM5626 | 9.35822 | 0.00278 | 0.08276 | 0.005571 |
| 9 | GO | RM3701 | 45.3–45.3 cM | 14.94433 | 1.87 × 10⁻⁴ | 0.11729 | 0.11729 | RM3701 | 9.33336 | 0.00282 | 0.08155 | 0.005571 |
| 10 | GO | RM502 | 121.8–121.8 cM | 21.52493 | 9.54 × 10⁻⁶ | 0.15935 | 0.15935 | RM502 | 8.35407 | 0.00463 | 0.073 | 0.006936 |
| 11 | TFC | RM3701 | 45.3–45.3 cM | 11.62841 | 9.06 × 10⁻⁴ | 0.06613 | 0.06613 | RM3701 | 8.95629 | 0.00341 | 0.07279 | 0.005782 |
| 12 | TFC | RM235 | 101.8–103.8 cM | 16.06018 | 1.11 × 10⁻⁴ | 0.08746 | 0.08746 | RM235 | 9.20885 | 0.003 | 0.07484 | 0.005571 |
| 13 | TFC | RM494 | 124.4–124.4 cM | 9.85164 | 0.00217 | 0.05638 | 0.05638 | RM494 | 9.64481 | 0.00241 | 0.07839 | 0.005571 |
| 14 | ABTS | RM3701 | 45.3–45.3 cM | 12.55463 | 5.79 × 10⁻⁴ | 0.08346 | 0.08346 | RM3701 | 10.97479 | 0.00125 | 0.09699 | 0.005571 |
| 15 | ABTS | RM235 | 101.8–103.8 cM | 8.08868 | 0.0053 | 0.05533 | 0.05533 | RM235 | 7.06457 | 0.00902 | 0.06243 | 0.009257 |
Publisher’s Note: MDPI stays neutral with regard to jurisdictional claims in published maps and institutional affiliations. |
© 2022 by the authors. Licensee MDPI, Basel, Switzerland. This article is an open access article distributed under the terms and conditions of the Creative Commons Attribution (CC BY) license (https://creativecommons.org/licenses/by/4.0/).
Share and Cite
Bastia, R.; Pandit, E.; Sanghamitra, P.; Barik, S.R.; Nayak, D.K.; Sahoo, A.; Moharana, A.; Meher, J.; Dash, P.K.; Raj, R.; et al. Association Mapping for Quantitative Trait Loci Controlling Superoxide Dismutase, Flavonoids, Anthocyanins, Carotenoids, γ-Oryzanol and Antioxidant Activity in Rice. Agronomy 2022, 12, 3036. https://doi.org/10.3390/agronomy12123036
Bastia R, Pandit E, Sanghamitra P, Barik SR, Nayak DK, Sahoo A, Moharana A, Meher J, Dash PK, Raj R, et al. Association Mapping for Quantitative Trait Loci Controlling Superoxide Dismutase, Flavonoids, Anthocyanins, Carotenoids, γ-Oryzanol and Antioxidant Activity in Rice. Agronomy. 2022; 12(12):3036. https://doi.org/10.3390/agronomy12123036
Chicago/Turabian StyleBastia, Ramakrushna, Elssa Pandit, Priyadarsini Sanghamitra, Saumya Ranjan Barik, Deepak Kumar Nayak, Auromira Sahoo, Arpita Moharana, Jitendriya Meher, Prasanta K. Dash, Reshmi Raj, and et al. 2022. "Association Mapping for Quantitative Trait Loci Controlling Superoxide Dismutase, Flavonoids, Anthocyanins, Carotenoids, γ-Oryzanol and Antioxidant Activity in Rice" Agronomy 12, no. 12: 3036. https://doi.org/10.3390/agronomy12123036
APA StyleBastia, R., Pandit, E., Sanghamitra, P., Barik, S. R., Nayak, D. K., Sahoo, A., Moharana, A., Meher, J., Dash, P. K., Raj, R., Jena, B. K., Pradhan, K. C., Lenka, D., Basak, N., Lenka, S., & Pradhan, S. K. (2022). Association Mapping for Quantitative Trait Loci Controlling Superoxide Dismutase, Flavonoids, Anthocyanins, Carotenoids, γ-Oryzanol and Antioxidant Activity in Rice. Agronomy, 12(12), 3036. https://doi.org/10.3390/agronomy12123036