Article

Bulb Yield Stability Study of Onion Lines over Locations and Seasons in Ghana and Mali

by
Jean Baptiste De La Salle Tignegre
1,
Alpha Sidy Traore
1,
Moumouni Konate
1,*,
Paul Alhassan Zaato
2,
Ba Germain Diarra
1,
Peter Hanson
2,
Fred Kizito
3,
Birhanu Zemadim Birhanu
4 and
Victor Afari-Sefa
2,5
1
World Vegetable Center, West and Central Africa—Dry Regions, Samanko, Bamako P.O. Box 320, Mali
2
World Vegetable Center, West and Central Africa—Coastal and Humid Regions, Cotonou BP 0932, Benin
3
International Institute of Tropical Agriculture, Tamale P.O. Box TL 6, Ghana
4
International Crops Research Institute for the Semi-Arid Tropics, Dar Es Salaam P.O. Box 34441, Tanzania
5
International Crops Research Institute for the Semi-Arid Tropics, Hyderabad 502324, India
*
Author to whom correspondence should be addressed.
Agronomy 2022, 12(12), 3037; https://doi.org/10.3390/agronomy12123037
Submission received: 17 September 2022 / Revised: 1 November 2022 / Accepted: 9 November 2022 / Published: 30 November 2022

Abstract

:
Onion is one of the most economically and nutritionally important vegetable crops in West Africa. Onions are very important for consumers due to the antioxidants and compounds they contain that may reduce inflammation, lower triglycerides and reduce cholesterol levels, resulting in lower risks of heart disease and blood clots. However, high-yielding varieties that are accessible to farmers remain scarce. The objective of the present study was to identify adapted onion genotypes for sustainable production in Northern Ghana and Southern Mali. Nine onion lines, including a check variety, were assessed for yield stability using a randomized complete block design. The trials were carried out in “technology parks” under the joint management of farmers and researchers. Onion bulb weight was recorded for each plot after harvest. Separate analyses of variances were performed for each location and season. Analysis of variance of combined locations, seasons and lines was performed to determine the most stable varieties using the line-superiority measure and ecovalence stability coefficients. Results indicated that the lines AVON1310 and AVON1325 were most stable for yield performance over locations and seasons (Wi = 2.20 and 11.60, respectively; Pi = 1.32 and 6.56, respectively). From the genotype main effects and genotype-by-environment interaction biplots, the best performing lines were AVON1310 (33.32 t.h−1), AVON1308 (28.81 t.h−1) and AVON1325 (31.68 t.h−1). The stability of these lines makes them potential candidates for commercial release in West Africa to contribute to sustainably intensifying onion production in the region.

1. Introduction

Onion (Allium cepa) is among the oldest cultivated crops and one of the most economically important vegetables worldwide [1]. This plant is a nutrient-rich crop [2], which has been used as both a food and a medicinal plant since ancient times [1,3,4]. Onions are thus used in the treatment and/or prevention of many illnesses, such as cancer, coronary heart disease, obesity, hypercholesterolemia, type 2 diabetes, hypertension, cataract and disturbances of the gastrointestinal tract [1,3,5,6]. Due to its shelf life and resilience during shipping, onion bulbs have been traded and consumed very widely across the world and have been accommodated with many dishes, traditions, and cultures [1,7,8]. In West Africa, onion has become a “must have” vegetable that is consumed daily in most households in variable forms and recipes [9,10]. Therefore, onion production can be very profitable, especially when the produce is stored until the off-season, when prices are the highest [11,12].
Onion-growing areas and productivity vary depending on countries and production systems. While production-intensive countries achieve yields of 50 t.h−1 or more, onion mean yield in West Africa remains on average below 10 t.h−1 [13]. In the sub-region, onion supply is highly subject to high seasonality, post-harvest losses of about 40%, and various production-side constraints [11], which make it hard to cover the year-round needs of consumers [9]. The low productivity of this important vegetable crop is often attributable to the poor application of appropriate farming techniques and poor access to agricultural inputs [12,14]. However, soils and climatic conditions during the crop-growing season (dry and cool) are very conducive to onion production [14]. Thus, Sahelian countries produce more onions than coastal and humid areas, and export to high-demand countries such as Cote d’Ivoire and Ghana [4,15]. Besides onion trade within the sub-region, huge quantities of onions continue to be imported from Northern Africa and Europe to face the demand [9,16]. Despite the economic and cultural importance of the onion, the second-most produced vegetable in West Africa after tomatoes [11,12,17,18], not many studies have been conducted to unravel its agronomic stability across the region.
Furthermore, important genetic diversity has been reported in West African onions [19]. However, the maintenance and management of genetic resources remains a major difficulty in national agricultural research systems [20], resulting in the continuous decline of on-farm diversity of cultivated onions over the years. Additionally, while usually offering a good level of resistance to biotic and/or abiotic stress, local onion varieties may present poor agronomic performance [18]. Yet, although some elite varieties may exist in private seed companies, their cost hinders accessibility to farmers. Therefore, it is crucial to develop and select high-yielding cultivars, which ought to be easily accessible and presenting with sufficient stability across West Africa to sustain onion production.
Crop trait stability is known to be influenced by factors including the environment (E), genotype (G) and the genotype-environment interaction (G × E) [21]. Previous studies reported that onion sowing date, seedling size at transplanting and fertilisation can significantly affect the bulb size at maturity [22,23,24]. Therefore, G × E interaction may result in significant variation in cultivar performance from one location to the other, which can mislead the plant breeder if an appropriate statistical tool is not used [25,26]. The assessment of G × E interaction is crucial to optimize the breeding strategy, leading to releasing cultivars adequately adapted to target environments [26,27]. In this way, multilocation yield trials analysed through the lenses of G × E interaction are very important to evaluate and support decisions in the process of selection and recommendation of crop varieties [26,28,29].
The AMMI (additive main effects and multiplicative interaction) tool is one of the many statistical tools commonly used to detect crop phenotypic stability over multiple locations [29,30]. This approach provides an estimate of the crop adaptability, especially for quantitative traits such as agronomic yields, which often present G × E interaction [25,31]. The common analysis of variance is known to highlight differentiation in fixed and random effects such as genotype, replication and environment [32]. However, this approach cannot discriminate between genotype variances in a non-additive manner, such as G × E interaction [21,27,33]. By combining ANOVA with principal component analysis (PCA), the AMMI model extirpates, first, the main effects of varieties and environments, and then presents the G × E interaction through a PCA [29,34]. From there, the performance of genotypes as well as the extent of divergence between varieties and optimum environments can be appreciated [25,30,31]. In practice, it appears that the GGE biplot and the AMMI graphs can be complementary in explaining the stability of genotypes and describing mega-environments [33,35].
Many studies have reported crop trait stability using GGE or AMMI [25,29,30,31,34]. However, not many such studies have been performed on onions in general, and specifically in Northern Ghana and Southern Mali on the yield stability of onion lines from the World Vegetable Center Allium program.
The objective of the present study was to identify adapted onion genotypes for sustainable production in Northern Ghana and Southern Mali. To this extent, onion lines from the World Vegetable Center Allium program were evaluated during the cool and dry season from September to March for three years to identify adapted onion lines suitable for sustainable intensification of production systems in Northern Ghana and Southern Mali. This evaluation was important to provide varieties suitable either for specific sites, or stable across the subregion. The results revealed two varieties that proved to be very stable across the study environments. Additionally, the top three performing varieties showed potential yields above 28 t.h−1. Such high-performing lines are potential candidates for release in Ghana and Mali to contribute to the sustainable intensification of onion production in West Africa.

2. Materials and Methods

2.1. Plant Material

To conduct the trials, eight onion lines from the World Vegetable Center Allium program and one commercial check (Table 1) were evaluated during the cool and dry season from September to March for three years (2018, 2019 and 2020) in Northern Ghana and Southern Mali. These lines included two varieties previously released in Mali (AVON1073 and AVON1074) and six lines newly introduced for testing in West Africa (AVON1023, AVON1308, AVON1310, AVON1314, AVON1317, and AVON1325) (Table 1). Onion seedlings were produced for forty days in 1 m × 5 m nurseries before transplantation into the experimental plots.

2.2. Trial Locations and Implementation

The trials were implemented in the Upper East and Northern Regions of Ghana and in two districts in the Sudan savannah zones of Mali (Bougouni and Koutiala) (Table 2). These locations in Ghana and in Mali were technology parks under the joint management of farmers and researchers. Eight onion lines and a hybrid check, ‘‘Gebugo’’ (Table 1), were assessed for yield stability in Ghana and/or Mali, and in at least in two locations or years from 2018 to 2020 (Table 2). The trial field was ploughed and harrowed, and a chemical fertilizer (NPK, 15–15–15) was applied at 200 kg/ha. Sulphate of ammonia (100 kg/ha) was applied as a top dressing 5–6 weeks after planting. Each experimental plot was 2 m × 2 m in size, containing 10 rows spaced by 20 cm. Seedlings planted on rows were spaced by 15 cm, resulting in about 133 plants per plot. Hand weeding was carried out two and five weeks after planting. Field planting and maintenance operations occurred each year from October to January.

2.3. Data Collection and Analyses

The only variable measured concerned the bulb yield of onion genotypes. Thus, bulbs harvested after plant maturity were weighted for each plot. All statistical analyses were performed using the GenStat software (VSN International, London, UK).
Separate analysis of variances was performed for each location and season. Then, analysis of variance of combined locations, seasons and lines (sites × year × genotypes) was performed to determine the most stable varieties using the AMMI model [21,26]. This model was also used to show the level of similarity between locations and interaction patterns between genotypes and locations. The AMMI model equation is:
Y i j = μ + G i + E j + λ k   α ik   δ jk   + R i j + ε
where Yij is the value of ith genotype in the j environment; μ is the grand mean; Gi is the deviation of the ith genotype from the grand mean; Ej is the deviation of the g environment from the grand mean; λk the singular value for PC axis k; αik and δjk are the PC scores for axis of k of the ith genotype and in the environment; and Rij and ε are the residual and error term [26].
To detect stability indices of genotypes and support decision-making for varietal selection, we further performed the Genotypes + Genotype × Environment interaction (GGE) biplot [36], which was computed as:
Y i j E j = λ k   α ik   δ jk   + R i j
where Yij is the value of ith genotype in the j environment; Ej is the effect of environment; = λk the singular value for PC axis k; αik and δjk are the PC scores for axis of k of the ith genotype and jth environment; and Rij is residual [36].
Furthermore, measures of ecovalence stability and line-superiority coefficients were computed to assess the consistency of genotypic performance [37]. The ecovalence stability coefficient, Wi, is a measure of genotype stability over locations and is computed as:
W i = j y i j Y i Y j + μ 2  
where yij is the mean performance of genotype i in the jth environment; Yi is means of ith genotype across environments, Yj is means of jth environment across all genotypes and μ is the grand mean [26].
To the same extent, line superiority index is evaluated with the formula:
P i = [ n X i     M 2 + ( j = 1 ( X i j   X i .   M j . + m ) 2 ) ] / 2 n
where Pi is superiority index of the ith genotype, Xij is the average response of the ith genotype in the jth environment, Xi is the mean deviation of the genotype I, Mj is the genotype with maximum response among all the genotypes in the jth environment, M is maximum response among all the genotypes over the environments, and n is the number of environments. A smaller value of Pi indicates less distance and maximum yield, resulting in better and stable genotypes [26].

3. Results

3.1. Additive Main Effect and Multiplicative Interaction

The ANOVA showed a significant variability among genotypes and significant interactions between years, locations, and varieties (p-value < 0.001, Table 3). That is, environments diverged for bulb yield of genotypes, which performed differently depending on environments. Five lines performed better than the commercial check (Gebugo) with average yields higher than 25.2 t ha−1. However, only one line, AVON1325, yielded (31.68 t ha−1) above the average of the trialled varieties (25.61 t ha−1) (Table 3).
To visualise the relationship between genotypes and environments, a biplot was generated from AMMI analysis for onion bulb production (Figure 1). This revealed that three genotypes (AVON1325, AVON1323 and AVON1317) were the most stable lines, since their scores of interactions with principal components 1 (PC1) and 2 (PC2) were the closest to zero (Figure 1). The principal components (PC1 and PC2) accounted for 65.78% and 14.02% of the variation, respectively, making a total of 79.80% of the variance among the stability factors (Figure 1).

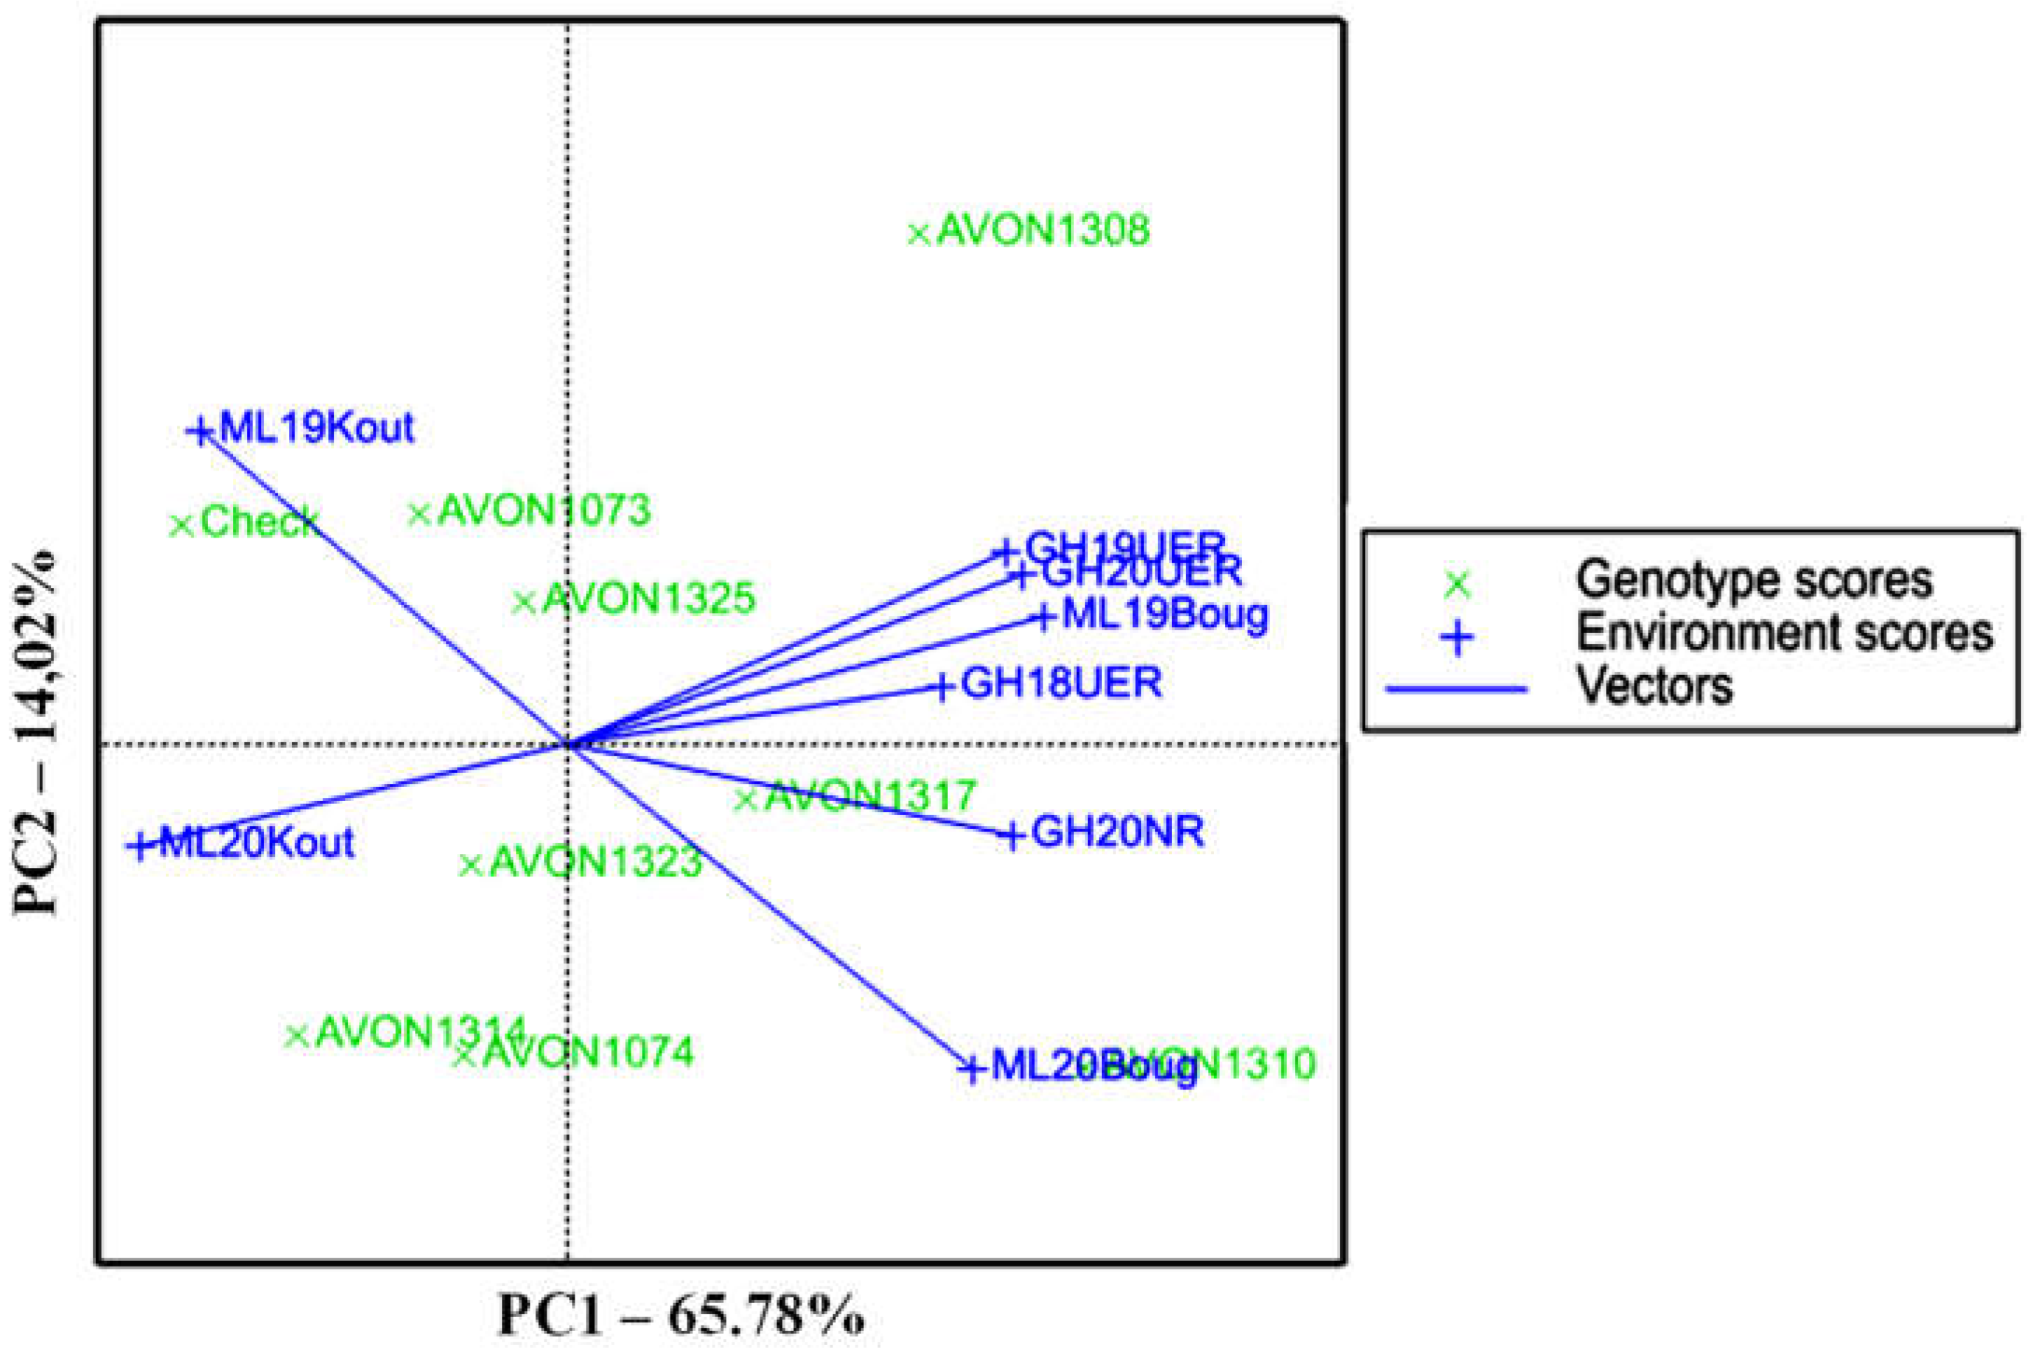
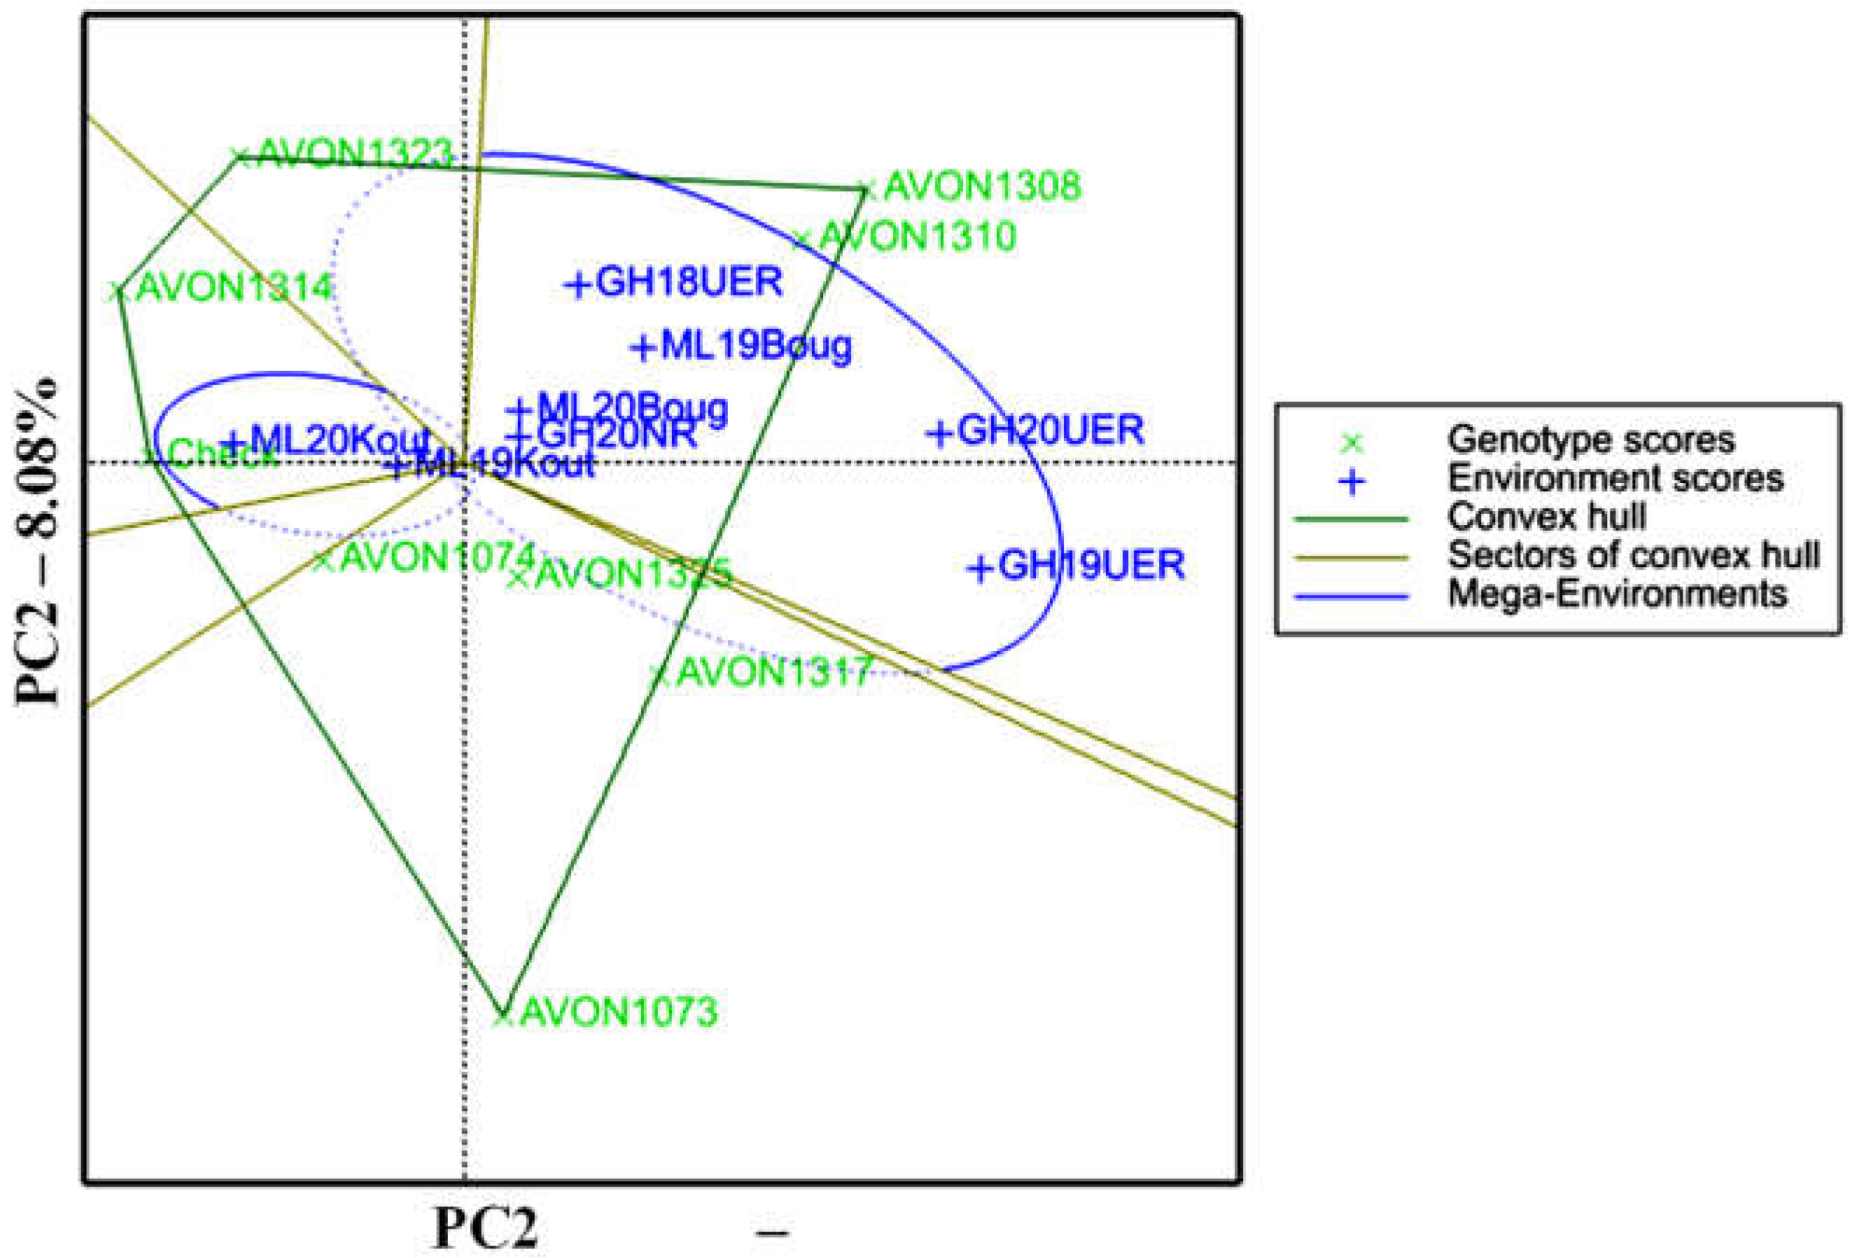
3.2. Genotype + G × E interaction (GGE) Biplot

Two mega-environments emerged from the GGE biplot model analysis of locations and years (Figure 2). Mega-environments represent the graph sectors comprising one or more locations. Irrespective of the year and counterintuitively, the first mega-environment included the two locations in Ghana and one of the locations in Mali (Bougouni), whereas the second mega-environment was represented by only one location in Mali (Koutiala). The locations forming the first mega-environment (Northern (NR) and Upper East (UER) regions in Ghana and Bougouni in Mali) were significantly and positively correlated (Figure 2). In this first mega-environment, AVON1308 produced the highest average yields (Figure 3a), and thus was the best-performing variety across locations and years. Onion lines AVON1074 and AVON1325 were considered as stable, due to their positions near the origin of the GGE bi-plot (Figure 2). AVON 1314 was the winning variety over two years in mega-environment 2 (Koutiala, Mali).
Furthermore, Wricke’s ecovalence stability coefficients revealed genotypes AVON1310, AVON1325, Gebugo (check) and AVON1317 as the most stable varieties due to their lowest Wi values (Table 4). Of these, AVON1310 (Figure 3b) and AVON1325 showed superior performance by yielding more than the average (25.61 t.ha−1). Additionally, based on the model of Lin and Binns’ superiority measure, genotypes AVON1310, AVON1308 and AVON1325 were the most stable varieties, with the smallest Wi values and the highest yields (Table 5).

4. Discussion

The present study was designed to identify high-yielding and stable onion varieties for production in Ghana, Mali, and possibly in West Africa at large, through the assessment of eight lines in different target environments. It appeared from AMMI analysis that the evaluated onion varieties were significantly influenced by location, probably due to the diversity of soil types, rainfall and other climatic conditions [22,23,24]. The differential response of onion genotypes to environments translated into significant G × E interactions (p < 0.001), which could influence about 80% varietal performances. Highly significant differences in locations, years, and genotypes may be due to variable climatic and edaphic conditions between locations [38] and the diversity of the genetic makeup of tested lines that may respond differently to locations [39,40]. Our result is consistent with many previous studies that reported significant G × E effects not only in onions [28], but also in many other crops [33,39,41]. However, the magnitude of G × E interactions was higher in the present study than in earlier works, probably due to the geographic distances between the trial sites in Ghana and Mali, some of which were about 1000 km apart. Indeed, the distance between locations has been usually correlated with the dissimilarity of both climatic and edaphic factors [38,42].
One aspect of this study that could be improved was the lack of consistent repetition of years over all locations for the set of varieties evaluated [35]. Yet, this was key not only to the delineation of mega-environments within the target region, but also to draw conclusions as to what extent a variety is stable [35]. Due to missing data across the years, the two mega-environments that emerged from this study need to be confirmed using more complete data sets, and thus provide a repeatable “which-won-where” pattern for reliable decision-making.
Two mega environments emerged from the GGE biplot analysis: the first one overlapping Ghana and Mali, and the second represented by a single location in Mali. Environmental conditions are not always under control and can thus affect cultivar performance, despite the standardisation of experimental design and conditions across locations (plant density, fertilisation, experimental design [43]). Nevertheless, it was counterintuitive to have locations this far apart within the first mega-environment. This may be attributable to two possible reasons: (1) agro-environmental conditions may be similar in the concerned locations, or (2) the top varieties boast adaptability to a wide range of environmental conditions, including soil types, fertility levels, moisture, temperature and even cropping systems [22,43,44]. The most stable genotypes in mega-environment 1 were AVON1308 and AVON1325, with yields above average (25.61 t.ha−1); whereas AVON1308 and AVON1310 were the best-performing and stable genotypes in mega-environment 2. These best-performing genotypes, viz. AVON1310 (33.32 t.h−1), AVON1308 (28.81 t.h−1) and AVON1325 (31.68 t.h−1), with such a wide adaptability, are ideal for distribution to increase production in the region. Since the GGE biplot was reported as the best approach to discovering mega-environments and winning cultivars [35], therefore, the lines that were identified through this approach can be confidently proposed for release in Ghana and Mali. Interestingly, the best lines discovered in this study outperformed most of the varieties released hitherto, and thus are suitable to contribute to sustainable intensification of onion production in the target environments.

5. Conclusions

This study revealed that the varieties AVON1310 and AVON1325 were the most stable for yield performance over locations and seasons. From the genotype main effects and GGE biplots, the same varieties and AVON1308 stood out as the top three best performing cultivars. These lines are therefore potential candidates for release in Ghana and Mali to contribute, in this way, to sustainably intensifying onion production in the region. Additionally, AVON1314 showed the best performance in environment 2 and may be deployed as an elite cultivar for production in that specific environment.
One of the aspects that could be investigated is the assessment of genotype response to biotic constraints, which are often key to the long-term success of newly released varieties. Additionally, it would be very informative to have other agronomic parameters to support these results, such as growth parameters and bulb dimensions. Furthermore, combining agronomy and crop breeding is essential to improve plant traits and adaptability before commercial release. Therefore, it is desirable that future varietal evaluations take into account the effect of farm management (M) options on crop performance, and so include G × E × M interaction in the decision-making process.

Author Contributions

Conceptualization, J.B.D.L.S.T.; methodology, J.B.D.L.S.T., A.S.T. and M.K.; formal analysis, J.B.D.L.S.T., A.S.T., M.K. and P.A.Z.; investigation, A.S.T., P.A.Z. and B.G.D.; writing—original draft preparation, J.B.D.L.S.T., A.S.T., M.K. and P.A.Z.; writing—review and editing, J.B.D.L.S.T., A.S.T., M.K., P.A.Z., F.K., P.H., B.Z.B. and V.A.-S.; supervision, B.G.D., A.S.T., J.B.D.L.S.T. and P.A.Z.; funding acquisition, J.B.D.L.S.T., F.K. and B.Z.B. All authors have read and agreed to the published version of the manuscript.

Funding

This research was funded by the United States Agency for International Development with grant number ARG#: AID-BFS-G-11-00002 and core donors to the World Vegetable Center. The researchers are grateful to the Africa RISING Project, the United States Agency for International Development (USAID), the Savannah Agricultural Research Institute (SARI) and the International Institute for Tropical Agriculture (IITA) in Ghana for hosting the research trials and providing personnel, logistics and facilities for data collection. We would also like to thank the World Vegetable Center for providing personnel and project management assistance.

Conflicts of Interest

The authors declare no conflict of interest.

References

  1. Teshika, J.D.; Zakariyyah, A.M.; Zaynab, T.; Zengin, G.; Rengasamy, K.R.R.; Pandian, S.K.; Fawzi, M.M. Traditional and modern uses of onion bulb (Allium cepa L.): A systematic review. Critical. Reviews. Food Sci. Nutr. 2019, 59, S39–S70. [Google Scholar] [CrossRef] [PubMed]
  2. Griffiths, G.; Trueman, L.; Crowther, T.; Thomas, B.; Smith, B. Onions—A global benefit to health. Phytother. Res. 2002, 16, 603–615. [Google Scholar] [CrossRef] [PubMed]
  3. Pareek, S.; Sagar, N.A.; Sharma, S.; Kumar, V. Onion (Allium cepa L.). Fruit Veg. Phytochem. Chem. Hum. Health 2017, 2, 1145–1162. [Google Scholar]
  4. Currah, L.; Cools, K.; Terry, L.A. Onions, shallots and garlic. Crop Post-Harvest. Sci. Technol. 2012, 3, 360–391. [Google Scholar]
  5. Lanzotti, V. The analysis of onion and garlic. J. Chromatogr. A 2006, 1112, 3–22. [Google Scholar] [CrossRef] [Green Version]
  6. Ye, C.-L.; Dai, D.-H.; Hu, W.-L. Antimicrobial and antioxidant activities of the essential oil from onion (Allium cepa L.). Food Control 2013, 30, 48–53. [Google Scholar] [CrossRef]
  7. Suleria, H.A.R.; Butt, M.S.; Anjum, F.M.; Saeed, F.; Khalid, N. Onion: Nature protection against physiological threats. Crit. Rev. Food Sci. Nutr. 2015, 55, 50–66. [Google Scholar] [CrossRef]
  8. Ben-Nun, L. Health Effects of Onions; BN Publication House: Beer-Sheva, Israel, 2018. [Google Scholar]
  9. Rouamba, A.; Currah, L. Onions in West Africa: State of research and future prospects. Trop. Sci. 2005, 45, 131–140. [Google Scholar] [CrossRef]
  10. Kuete, V. Chapter 14—Allium cepa. In Medicinal Spices and Vegetables from Africa; Kuete, V., Ed.; Academic Press: Amsterdam, Netherlands, 2017; pp. 353–361. [Google Scholar]
  11. Braimah, A. Boosting Onion Farmers’ Income in West Africa. Available online: https://www.proquest.com/openview/aad2febd422ff4a7ff3320378bd9d5f8/1?pq-origsite=gscholar&cbl=47429 (accessed on 6 September 2022).
  12. Rabiou, M.M.; Moussa, I.; Mella, M.; Sadou, H. Panorama of onion production in Tillabéri, a region of the far west of Niger. Eur. Sci. J. 2018, 14, 175–196. [Google Scholar]
  13. FAO. Food and Agricultural Commodities Production. Available online: http://faostat.fao.org/site/339/default.aspx (accessed on 15 April 2022).
  14. Sanon, M.; Rouamba, A.; Nicolas, H.; Baldy, C. Socioeconomic importance of onion production in West Africa: Constraints and prospects. Secheresse 1998, 9, 233–238. [Google Scholar]
  15. Suppiah, S.; John, F.A. Onion farming in Ghana. Econ. Bot. 1977, 31, 312–314. [Google Scholar]
  16. EPA Monitoring. Will Dutch Onion Companies Continue to Support West African Onion Sector Development or Push for the Elimination of Import Restrictions on EU Onions? Available online: https://epamonitoring.net/will-dutch-onion-companies-continue-to-support-west-african-onion-sector-development-or-push-for-the-elimination-of-import-restrictions-on-eu-onions/ (accessed on 10 March 2022).
  17. Bastian, M.L. Onions are my husband: Survival and accumulation by West African market women. Am. Ethnol. 1997, 24, 250–251. [Google Scholar] [CrossRef]
  18. Ricroch, A.; Rouamba, A.; Sarr, A. Valorisation de la production de l’oignon en afrique de l’ouest par la gestion dynamique de ses ressources génétiques. Acta Bot. Gall. 1996, 143, 101–106. [Google Scholar] [CrossRef] [Green Version]
  19. Rouamba, A.; Currah, L. Collections of short-day onion germplasm in West Africa: A survey. Genet. Resour. Crop Evol. 1998, 45, 81–85. [Google Scholar] [CrossRef]
  20. Abdou, R.; Bakasso, Y.; Saadou, M.; Baudoin, J.P.; Hardy, O.J. Genetic Diversity of Niger Onions (Allium Cepa L.) Assessed by Simple Sequence Repeat Markers (SSR); International Society for Horticultural Science (ISHS): Leuven, Belgium, 2016; pp. 77–90. [Google Scholar]
  21. Sabaghnia, N.; Sabaghpour, S.H.; Dehghani, H. The use of an AMMI model and its parameters to analyse yield stability in multi-environment trials. J. Agric. Sci. 2008, 146, 571–581. [Google Scholar] [CrossRef]
  22. Khokhar, K.; Kaska, N.; Hussain, S.; Qureshi, K.; Mahmood, T. Effect of different sowing dates, direct seeding and transplanting of seedling on maturation, bulb weight and yield in onion (Allium cepa) cultivars. Indian J. Agric. Sci. 1990, 60, 668–671. [Google Scholar]
  23. Mettananda, S.A.; Fordham, S. The effects of plant size and leaf number on the bulbing of tropical short-day onion cultivars (Allium cepa L.) under controlled environments in the United Kingdom and tropical field conditions in Sri Lanka. J. Hortic. Sci. Biotechnol. 1999, 74, 622–631. [Google Scholar] [CrossRef]
  24. Gateri, M.W. Onion (Allium Cepa L.) Growth, Yield and Storability as Influenced by Rate and Time of Nitrogen Application. Ph.D. Thesis, University of Nairobi, Nairobi, Kenya, 2019. [Google Scholar]
  25. Pour-Aboughadareh, A.; Barati, A.; Koohkan, S.A.; Jabari, M.; Marzoghian, A.; Gholipoor, A.; Shahbazi-Homonloo, K.; Zali, H.; Poodineh, O.; Kheirgo, M. Dissection of genotype-by-environment interaction and yield stability analysis in barley using AMMI model and stability statistics. Bull. Natl. Res. Cent. 2022, 46, 1–12. [Google Scholar] [CrossRef]
  26. Seife, A.; Tena, E. Genotype × environment interaction and yield stability analysis of sugarcane (Saccharum officinarum L.) genotypes. Int. J. Adv. Res. Biol. Sci. 2020, 7, 14–26. [Google Scholar]
  27. Fox, P.N.; Crossa, J.; Romagosa, I. Multi-environment testing and genotype × environment interaction. In Statistical Methods for Plant Variety Evaluation; Kempton, R.A., Fox, P.N., Cerezo, M., Eds.; Springer Netherlands: Dordrecht, The Netherlands, 1997; pp. 117–138. [Google Scholar]
  28. Khokhar, K.M. Environmental and genotypic effects on bulb development in onion—A review. J. Hortic. Sci. Biotechnol. 2017, 92, 448–454. [Google Scholar] [CrossRef]
  29. Maleia, M.P.; Raimundo, A.; Moiana, L.D.; Teca, J.O.; Chale, F.; Jamal, E.; Dentor, J.N.; Adamugy, B.A. Stability and adaptability of cotton (‘Gossypium hirsutum’ L.) genotypes based on AMMI analysis. Aust. J. Crop Sci. 2017, 11, 367–372. [Google Scholar] [CrossRef]
  30. Katsenios, N.; Sparangis, P.; Leonidakis, D.; Katsaros, G.; Kakabouki, I.; Vlachakis, D.; Efthimiadou, A. Effect of genotype × environment interaction on yield of maize hybrids in Greece using AMMI analysis. Agronomy 2021, 11, 479. [Google Scholar] [CrossRef]
  31. Shojaei, S.H.; Mostafavi, K.; Omrani, A.; Omrani, S.; Nasir Mousavi, S.M.; Illés, Á.; Bojtor, C.; Nagy, J. Yield stability analysis of maize (Zea mays L.) hybrids using parametric and AMMI methods. Scientifica 2021, 2021, 5576691. [Google Scholar] [CrossRef]
  32. Glass, G.V.; Peckham, P.D.; Sanders, J.R. Consequences of failure to meet assumptions underlying the fixed effects analyses of variance and covariance. Rev. Educ. Res. 1972, 42, 237–288. [Google Scholar] [CrossRef]
  33. Oladosu, Y.; Rafii, M.Y.; Abdullah, N.; Magaji, U.; Miah, G.; Hussin, G.; Ramli, A. Genotype × environment interaction and stability analyses of yield and yield components of established and mutant rice genotypes tested in multiple locations in Malaysia. Acta Agric. Scand. Sect. B—Soil Plant Sci. 2017, 67, 590–606. [Google Scholar] [CrossRef]
  34. Marjanović-Jeromela, A.; Nagl, N.; Gvozdanović-Varga, J.; Hristov, N.; Kondić-Špika, A.; Marinković, M.V.R. Genotype by environment interaction for seed yield per plant in rapeseed using AMMI model. Pesqui. Agropecuária Brasil. 2011, 46, 174–181. [Google Scholar] [CrossRef] [Green Version]
  35. Yan, W.; Kang, M.S.; Ma, B.; Woods, S.; Cornelius, P.L. GGE biplot vs. AMMI analysis of genotype-by-environment data. Crop Sci. 2007, 47, 643–653. [Google Scholar] [CrossRef] [Green Version]
  36. Yan, W.; Tinker, N.A. An integrated biplot analysis system for displaying, interpreting, and exploring genotype × environment interaction. Crop Sci. 2005, 45, 1004–1016. [Google Scholar] [CrossRef]
  37. Luthra, O.P.; Singh, R.K. A comparison of different stability models in wheat. Theor. Appl. Genet. 1974, 45, 143–149. [Google Scholar] [CrossRef]
  38. Rajakaruna, N.; Boyd, R.S. Edaphic factor. In Encyclopedia of Ecology; Jørgensen, S.E., Fath, B.D., Eds.; Academic Press: Oxford, UK, 2008; pp. 1201–1207. [Google Scholar]
  39. Khan, M.M.H.; Rafii, M.Y.; Ramlee, S.I.; Jusoh, M.; Al Mamun, M. AMMI and GGE biplot analysis for yield performance and stability assessment of selected Bambara groundnut (Vigna subterranea L. Verdc.) genotypes under the multi-environmental trails (mets). Sci. Rep. 2021, 11, 22791. [Google Scholar] [CrossRef]
  40. Horn, L.; Shimelis, H.; Sarsu, F.; Mwadzingeni, L.; Laing, M.D. Genotype-by-environment interaction for grain yield among novel cowpea (Vigna unguiculata L.) selections derived by gamma irradiation. Crop J. 2018, 6, 306–313. [Google Scholar] [CrossRef]
  41. Herawati, R.; Lestari, A.P.; Nurmegawati; Ganefianti, D.W.; Romeida, A. Comparative study on the stability & adaptability of different models to develop a high-yield inbred line from landrace rice varieties. Ann. Agric. Sci. 2021, 66, 184–192. [Google Scholar] [CrossRef]
  42. Malanson, G.P.; Cheney, A.B.; Kinney, M. Climatic and geographic relations of alpine tundra floras in western North America. Alp. Bot. 2015, 125, 21–29. [Google Scholar] [CrossRef]
  43. Fehr, W. Principles of Cultivar Development. Theory and Technique; Macmillian Publishing Company: New York, NY, USA, 1991; p. 550. [Google Scholar]
  44. Mohanty, B. Effect of planting time on the performance of onion cultivars. Veg. Sci. 2001, 28, 140–142. [Google Scholar]
Figure 1. Vector view of the AMMI biplot (PC1 and PC2) of onion yield showing the relationship between tested varieties and environments. GH19UER, Upper East Region, 2019; GH20UER, Upper East Region, 2020; GH20NR, Northern Region; ML19Kout, Koutiala 2019; ML20Kout, Koutiala 2020; ML19Boug, Bougouni 2019; ML20Boug, Bougouni 2020. Dotted vertical and horizontal lines indicate points where the PC1 and PC2 axes had respective values of zero.
Agronomy 12 03037 g001
Figure 2. Genotype + G × E interaction (GGE) biplot showing which genotypes performed best in which environment (“which won where”). Dotted vertical and horizontal lines indicate points where the PC1 and PC2 axes had respective values of zero. Vertices of the polygon indicate superior genotypes in each sector. See codes of genotypes in Table 1 and Table 4. GH19UER, Upper East Region, 2019; GH20UER, Upper East Region, 2020; GH20NR, Northern Region; ML19Kout, Koutiala 2019; ML20Kout, Koutiala 2020; ML19Boug, Bougouni 2019; ML20Boug, Bougouni 2020.
Agronomy 12 03037 g002
Figure 3. Photos of two high-performing and stable onion varieties. (a) Light-red-colored bulb of variety AVON1308; (b) red-colored bulb of variety AVON1310. Photo credit: World Vegetable Center.
Agronomy 12 03037 g003
Table 1. Onion varieties evaluated in northern Ghana and southern Mali, 2018–2020.
GenotypesDuration aOrigin
AVON1323125Bulk selection—Local
AVON1073142Released in WCA by WorldVeg
AVON1074137Released in WCA by WorldVeg
AVON1308120Bulk selection—Local
AVON1310130Bulk selection—Local
AVON1314125Bulk selection—Local
AVON1317120Bulk selection
AVON1325120Bulk selection
Check (Gebugo)90Local
a: Average number of days from planting to maturity.
Table 2. Climatic characteristics of trial locations.
LocationGPS CoordinatesAverage RainfallTemperature
CountryRegion/DistrictMin (°C)Max (°C)
GhanaNorthern Region (NR)9°24′3″ N;
0°50′21″ W
1034 mm2440
Upper East (UER)10°53′44″ N;
1°5′32″ W
1024 mm2342
MaliBougouni11°25′07.4″ N:
7°28′53.2″ W
1061 mm1838
Koutiala12°22′53.2″ N;
5°28′01.7″ W
889 mm1939
Table 3. G × E interaction (AMMI) for yield performance (t.ha−1) of onion varieties over years and locations in Ghana and Mali—2018–2020.
GhanaMali
UERNRKoutialaBougouni
Genotypes20182020202020202019202020192020MeanRank
AVON131032.3834.8133.6434.81----33.321
AVON132528.04----35.31--31.682
AVON130833.1633.8836.7333.8829.0027.8126.4710.3528.813
AVON107426.6531.5627.5631.5625.6735.0020.9311.9325.484
AVON131427.6930.7525.0830.7528.50-20.73-25.475
Gebugo (Check)28.0426.5023.3626.50-- -25.026
AVON107325.2628.1228.3428.1227.1728.7521.005.6224.297
AVON1323-27.8823.3127.8826.3331.5623.1310.5023.688
AVON1317-----27.19-12.1319.669
Mean28.7530.5028.2930.5027.3330.9422.4510.1025.61
SE1.470.910.690.910.871.200.840.73-
Year × Loc × Var. (p-value )<0.001 **
UER: Upper East Region, NR: Northern Region; SE: standard error; Loc: location; Var: varieties. **: Significant at P = 0.001.
Table 4. Wricke’s ecovalence stability of coefficients Wi.
GenotypeWiBulb Yield (t.h−1)
AVON13102.2033.32
AVON132511.6031.68
AVON130891.9428.81
AVON107436.9025.48
AVON131436.0125.47
Check13.9925.02
AVON107341.2824.29
AVON132329.4623.68
AVON131714.4519.66
Mean 25.61
Table 5. Lin and Binns’ superiority measure of genotype performance (Pi).
GenotypeStability Superiority Coefficient (Pi)Bulb Yield (t.ha−1)
AVON13101.3233.32
AVON13256.5631.68
AVON13083.7728.81
AVON107415.7825.48
AVON131432.0325.47
Check49.125.02
AVON107319.0924.29
AVON132325.9923.68
AVON131716.5019.66
Mean 25.61
Publisher’s Note: MDPI stays neutral with regard to jurisdictional claims in published maps and institutional affiliations.

