
Effect of the Sulfamethazine on Nitrogen Conversion in Alternate Wet and Dry Paddy Fields


Abstract
:1. Introduction
2. Materials and Methods
2.1. Experimental Design
2.2. Soil Sampling
2.3. Measurement of Soil Nitrogen
2.4. DNA Extraction, PCR, and Sequencing of the Nitrogen Conversion Functional Genes
2.5. Statistical Analysis
3. Results
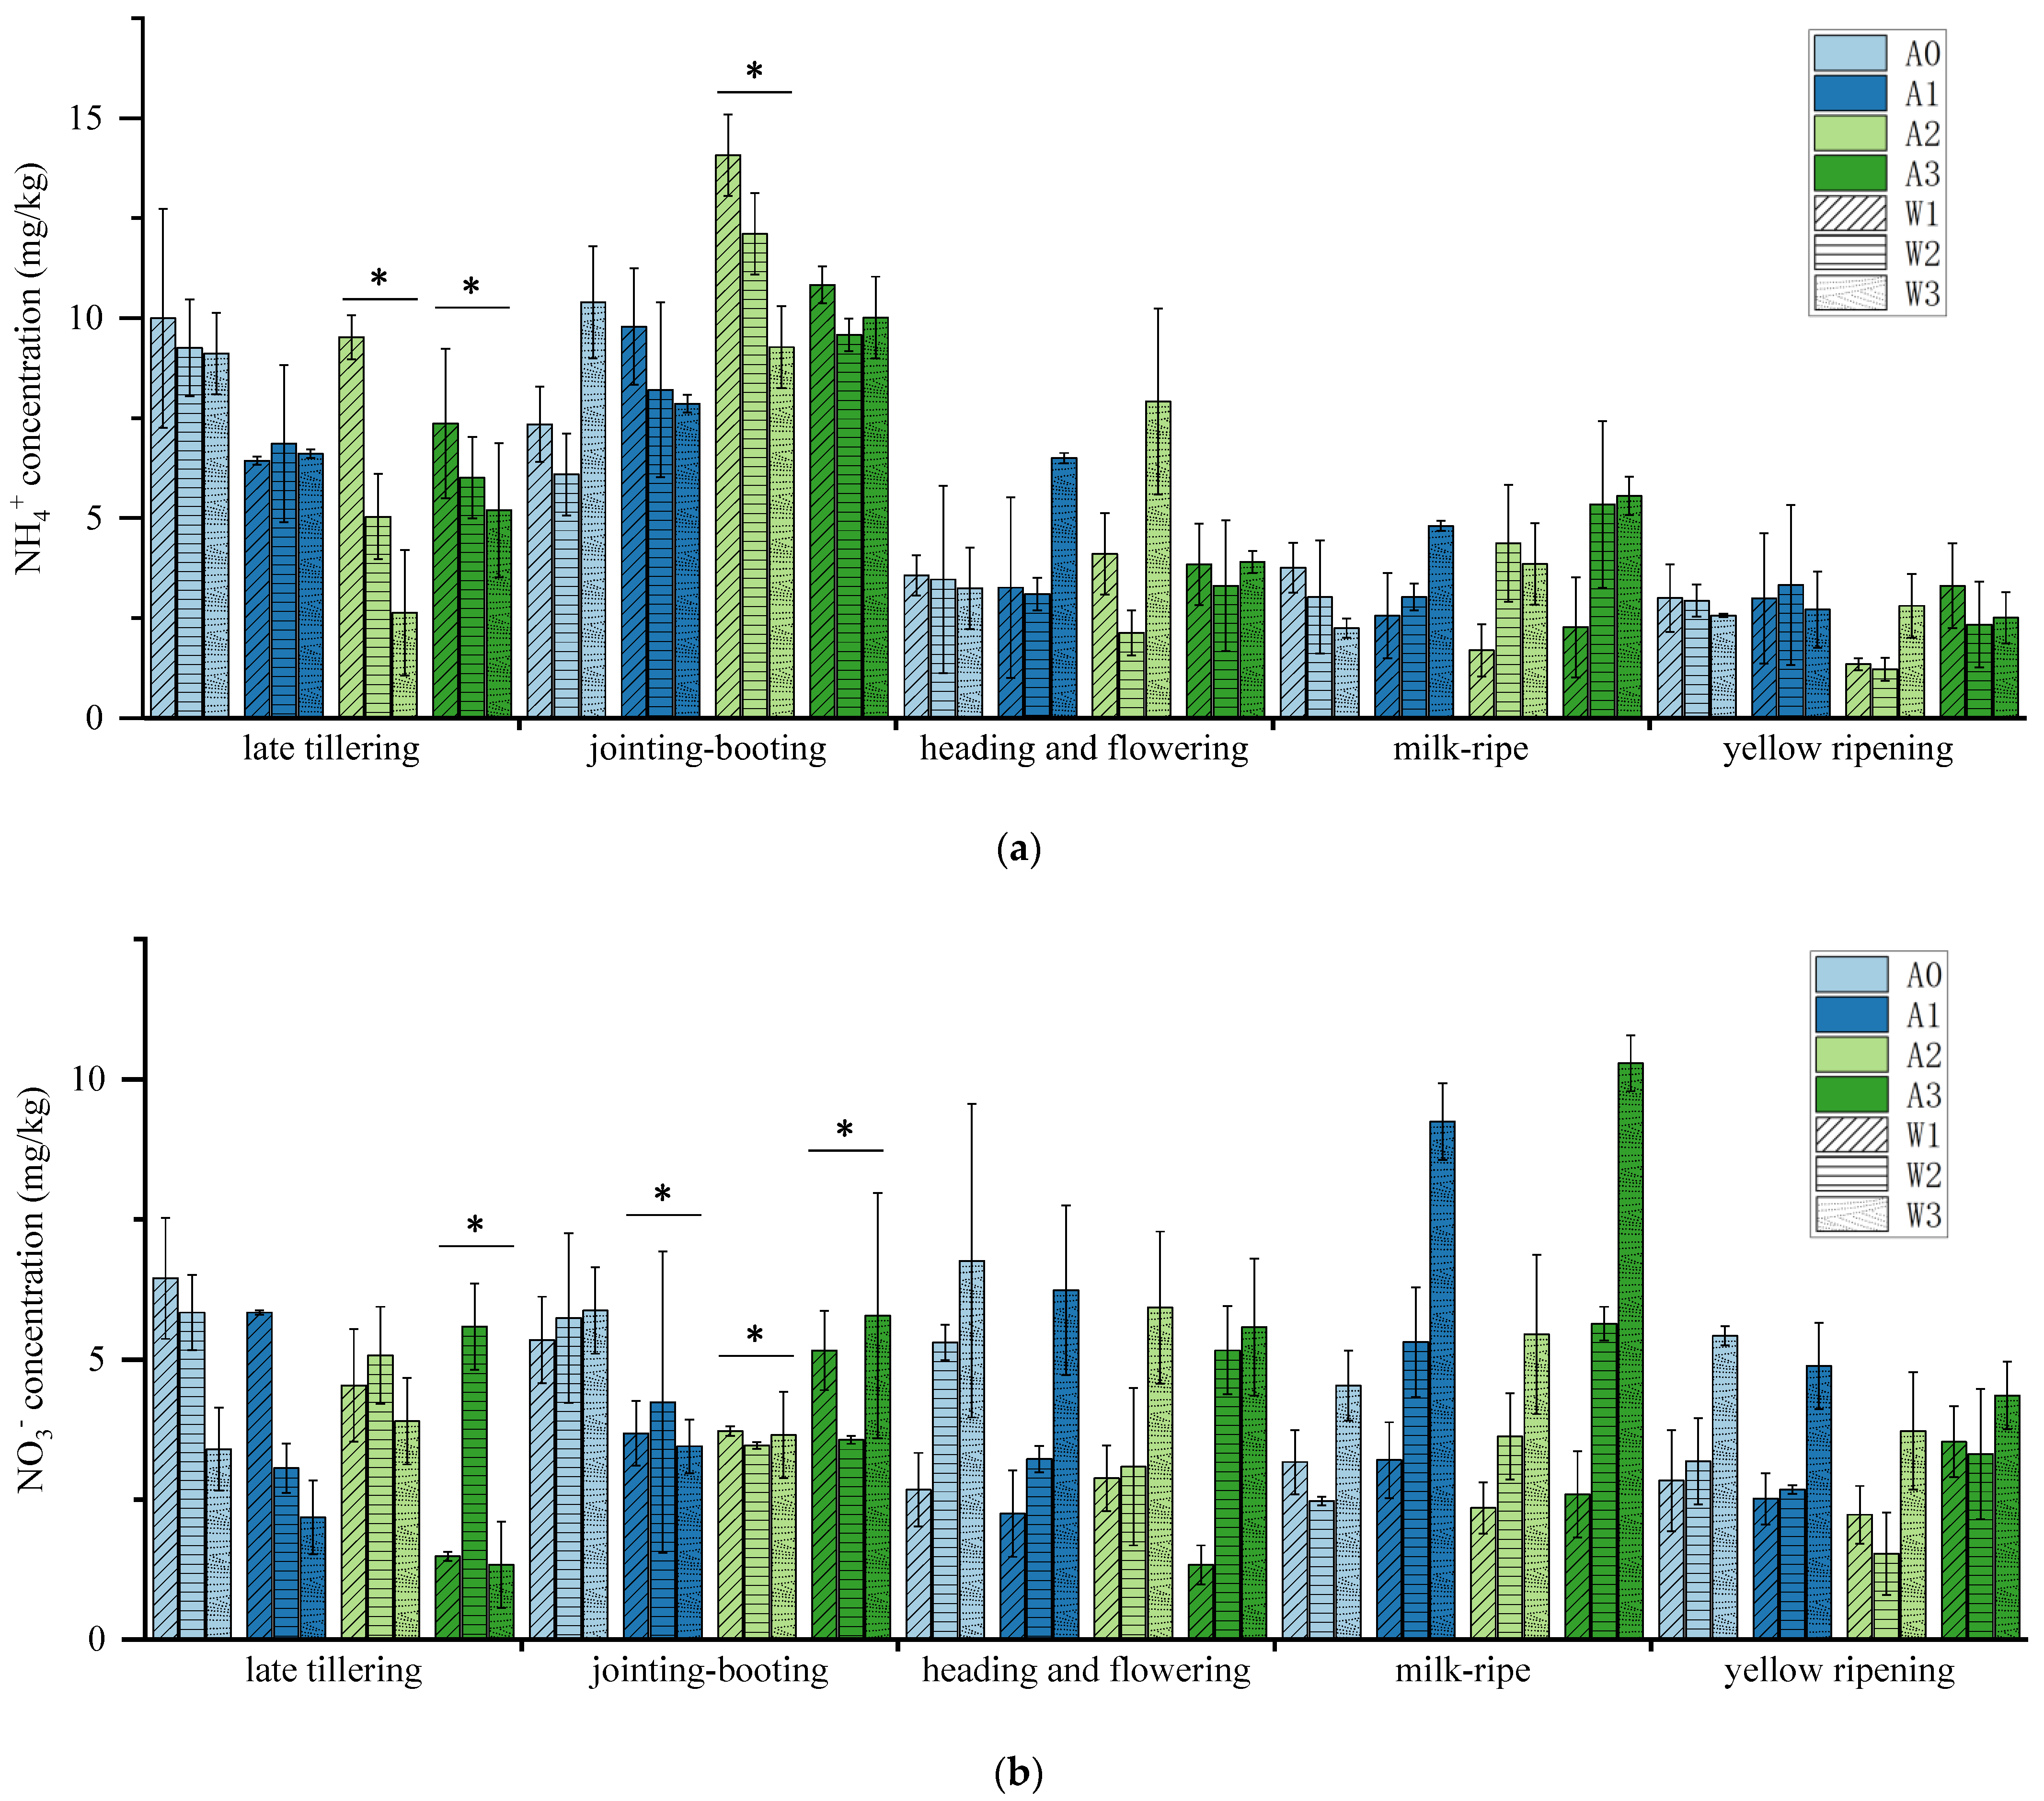
3.1. NH4+ and NO3− Concentration at Each Stage
3.2. Absolute Abundance and Diversity of Nitrogen Conversion Genes
3.3. Alpha Diversity of Nitrogen Conversion Genes Communities
3.4. Community Structure of Nitrogen Conversion Genes
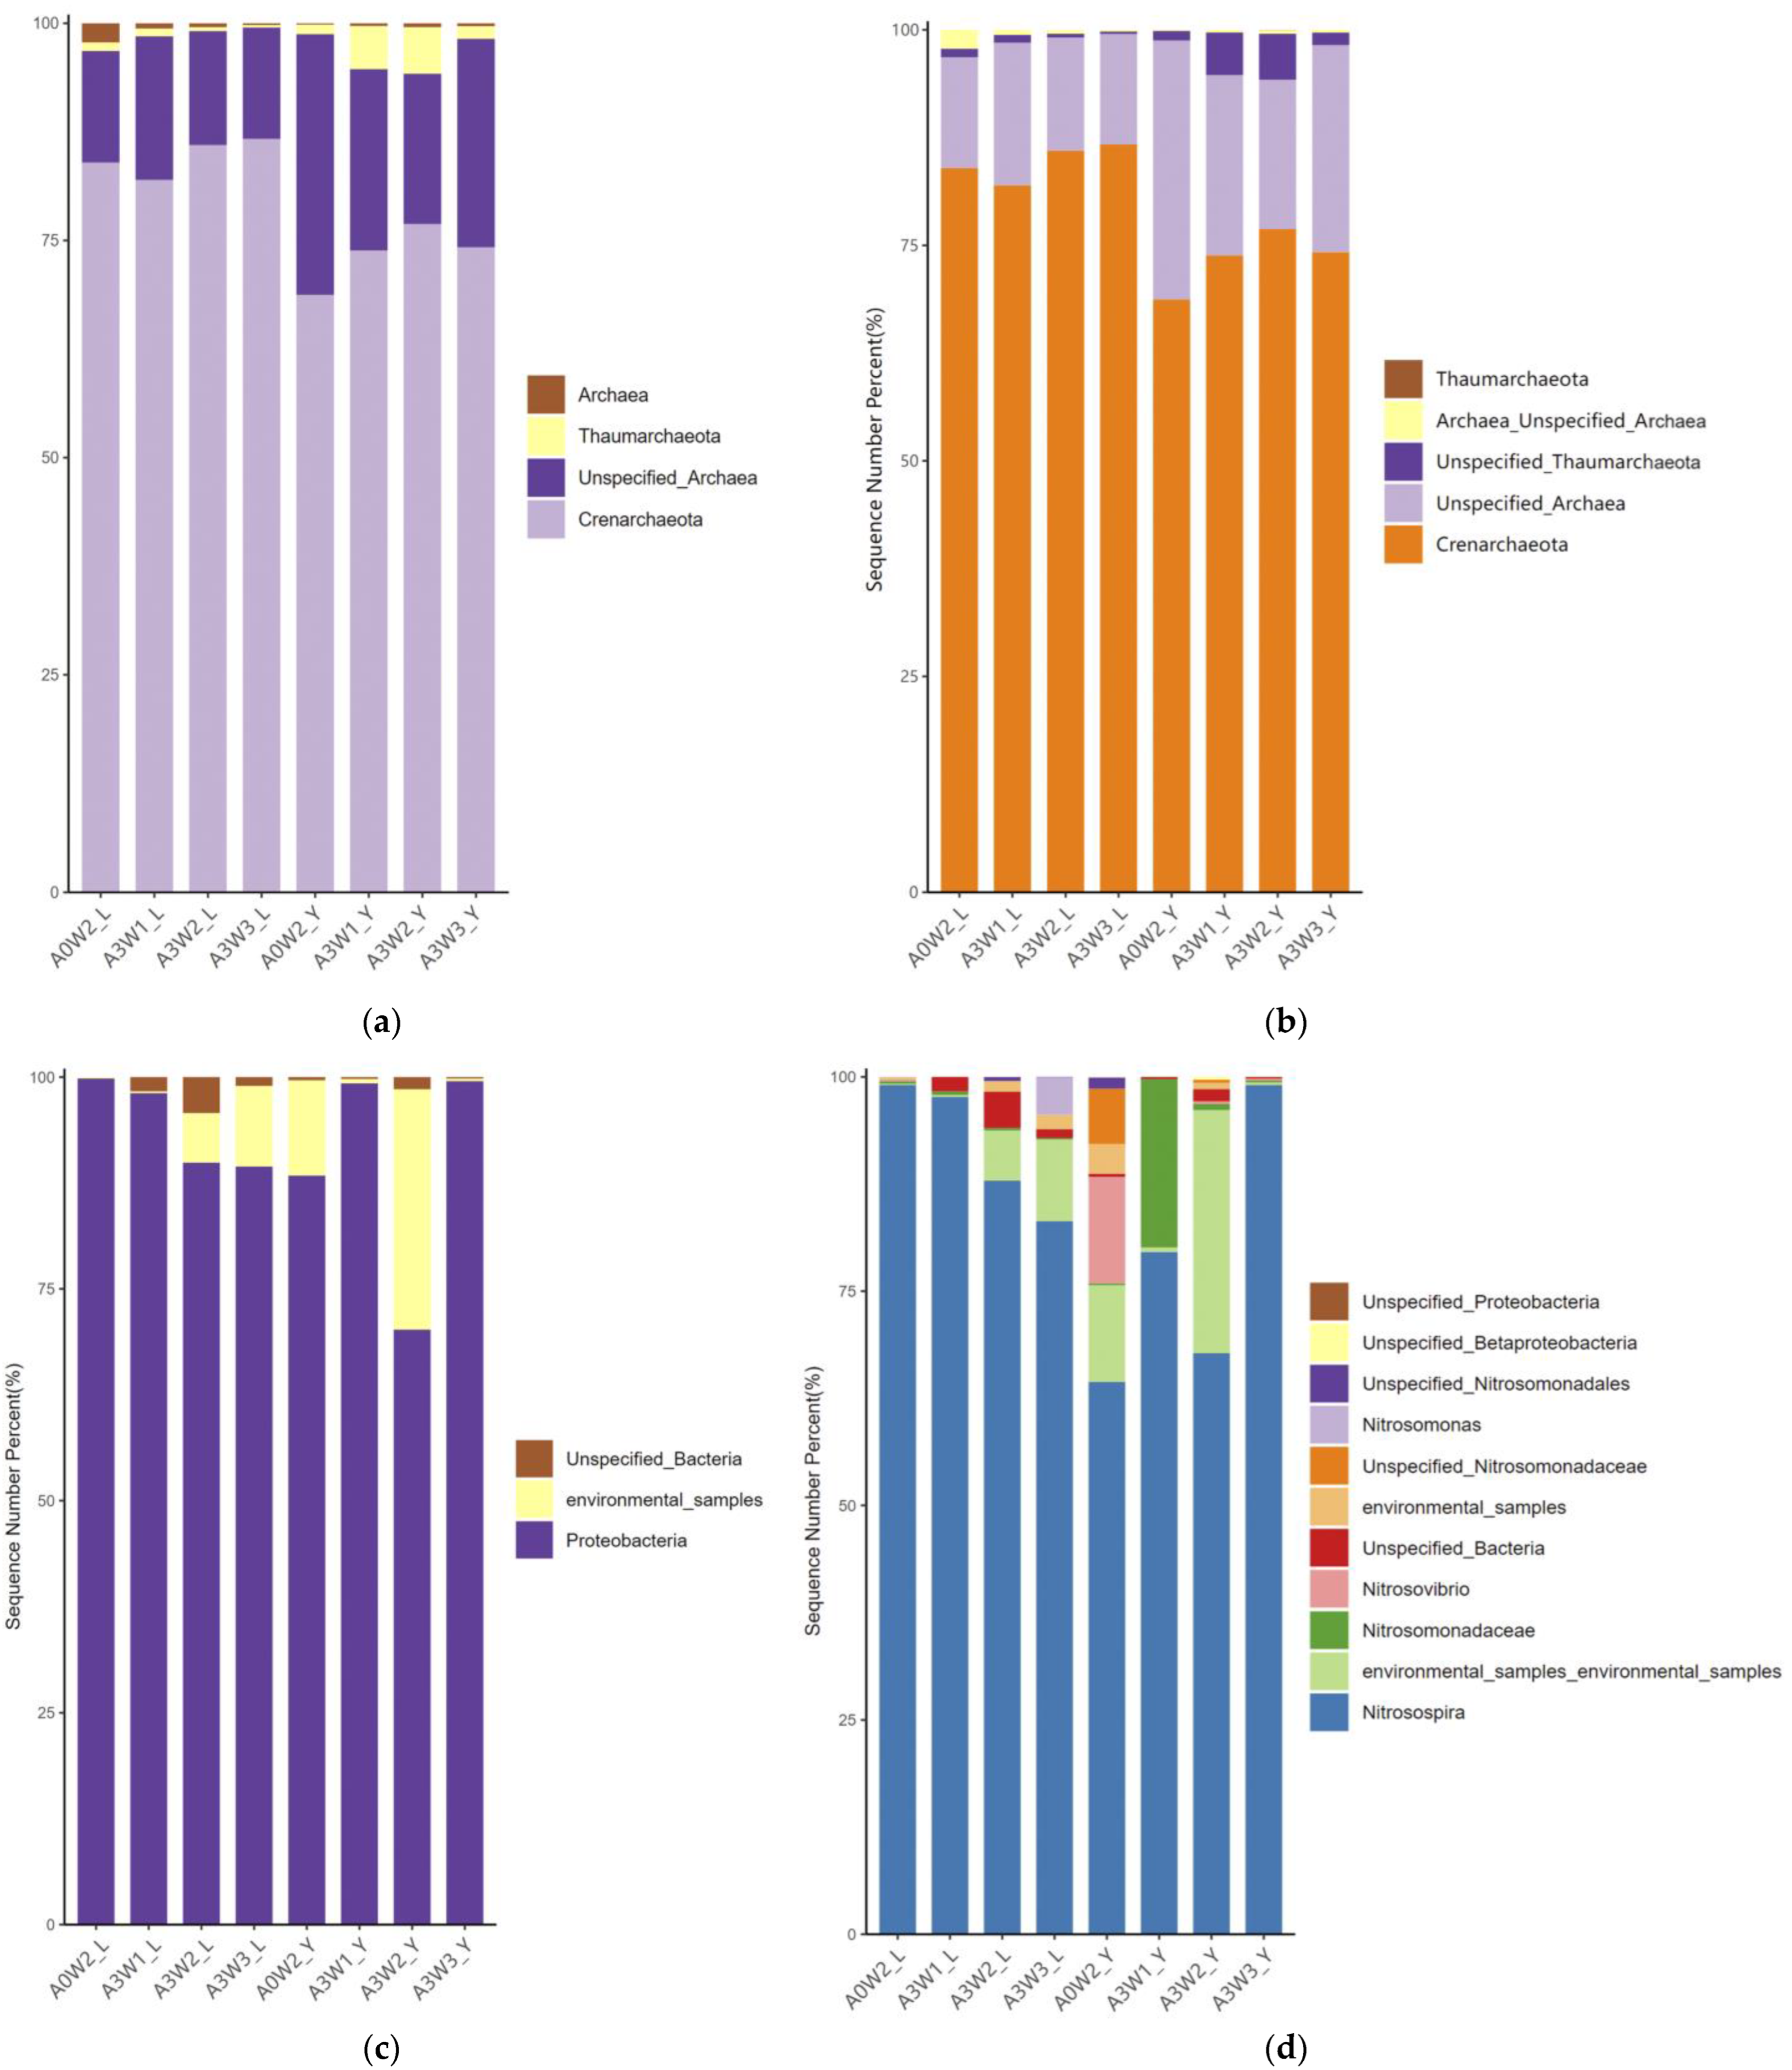
3.4.1. Community Structure of AOA amoA and AOB amoA
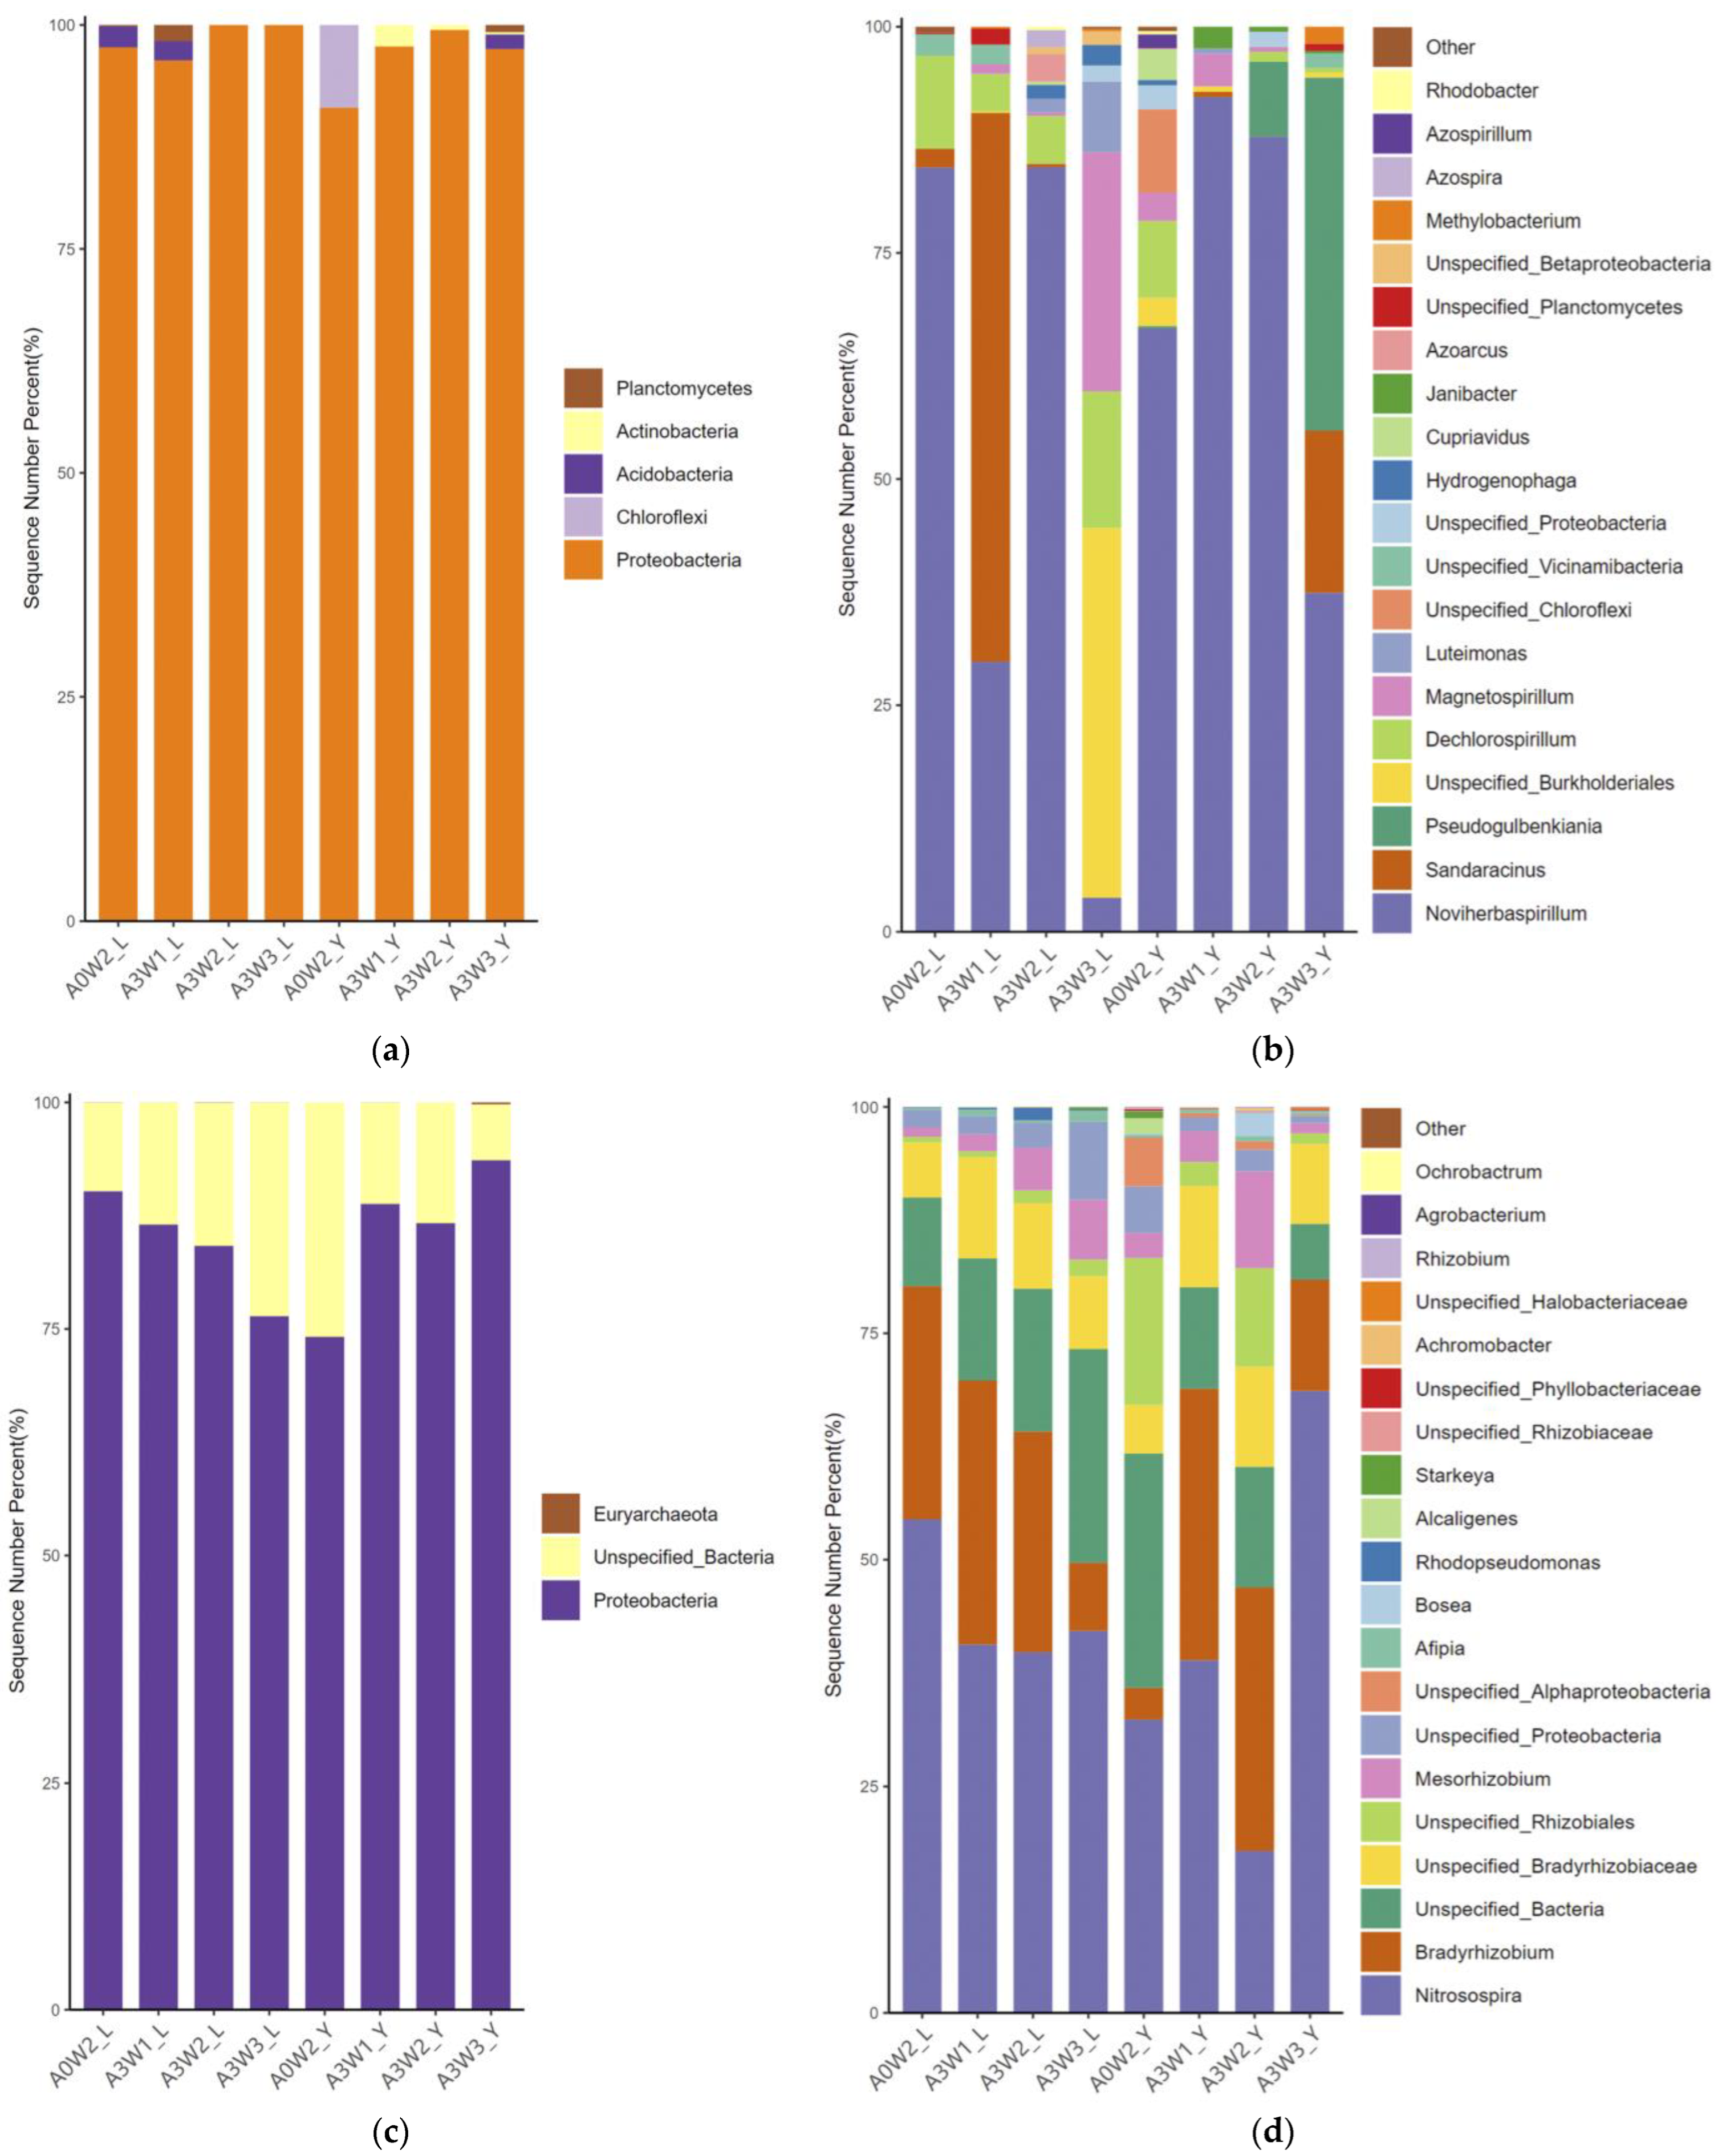
3.4.2. Community Structure of nirS and nirK
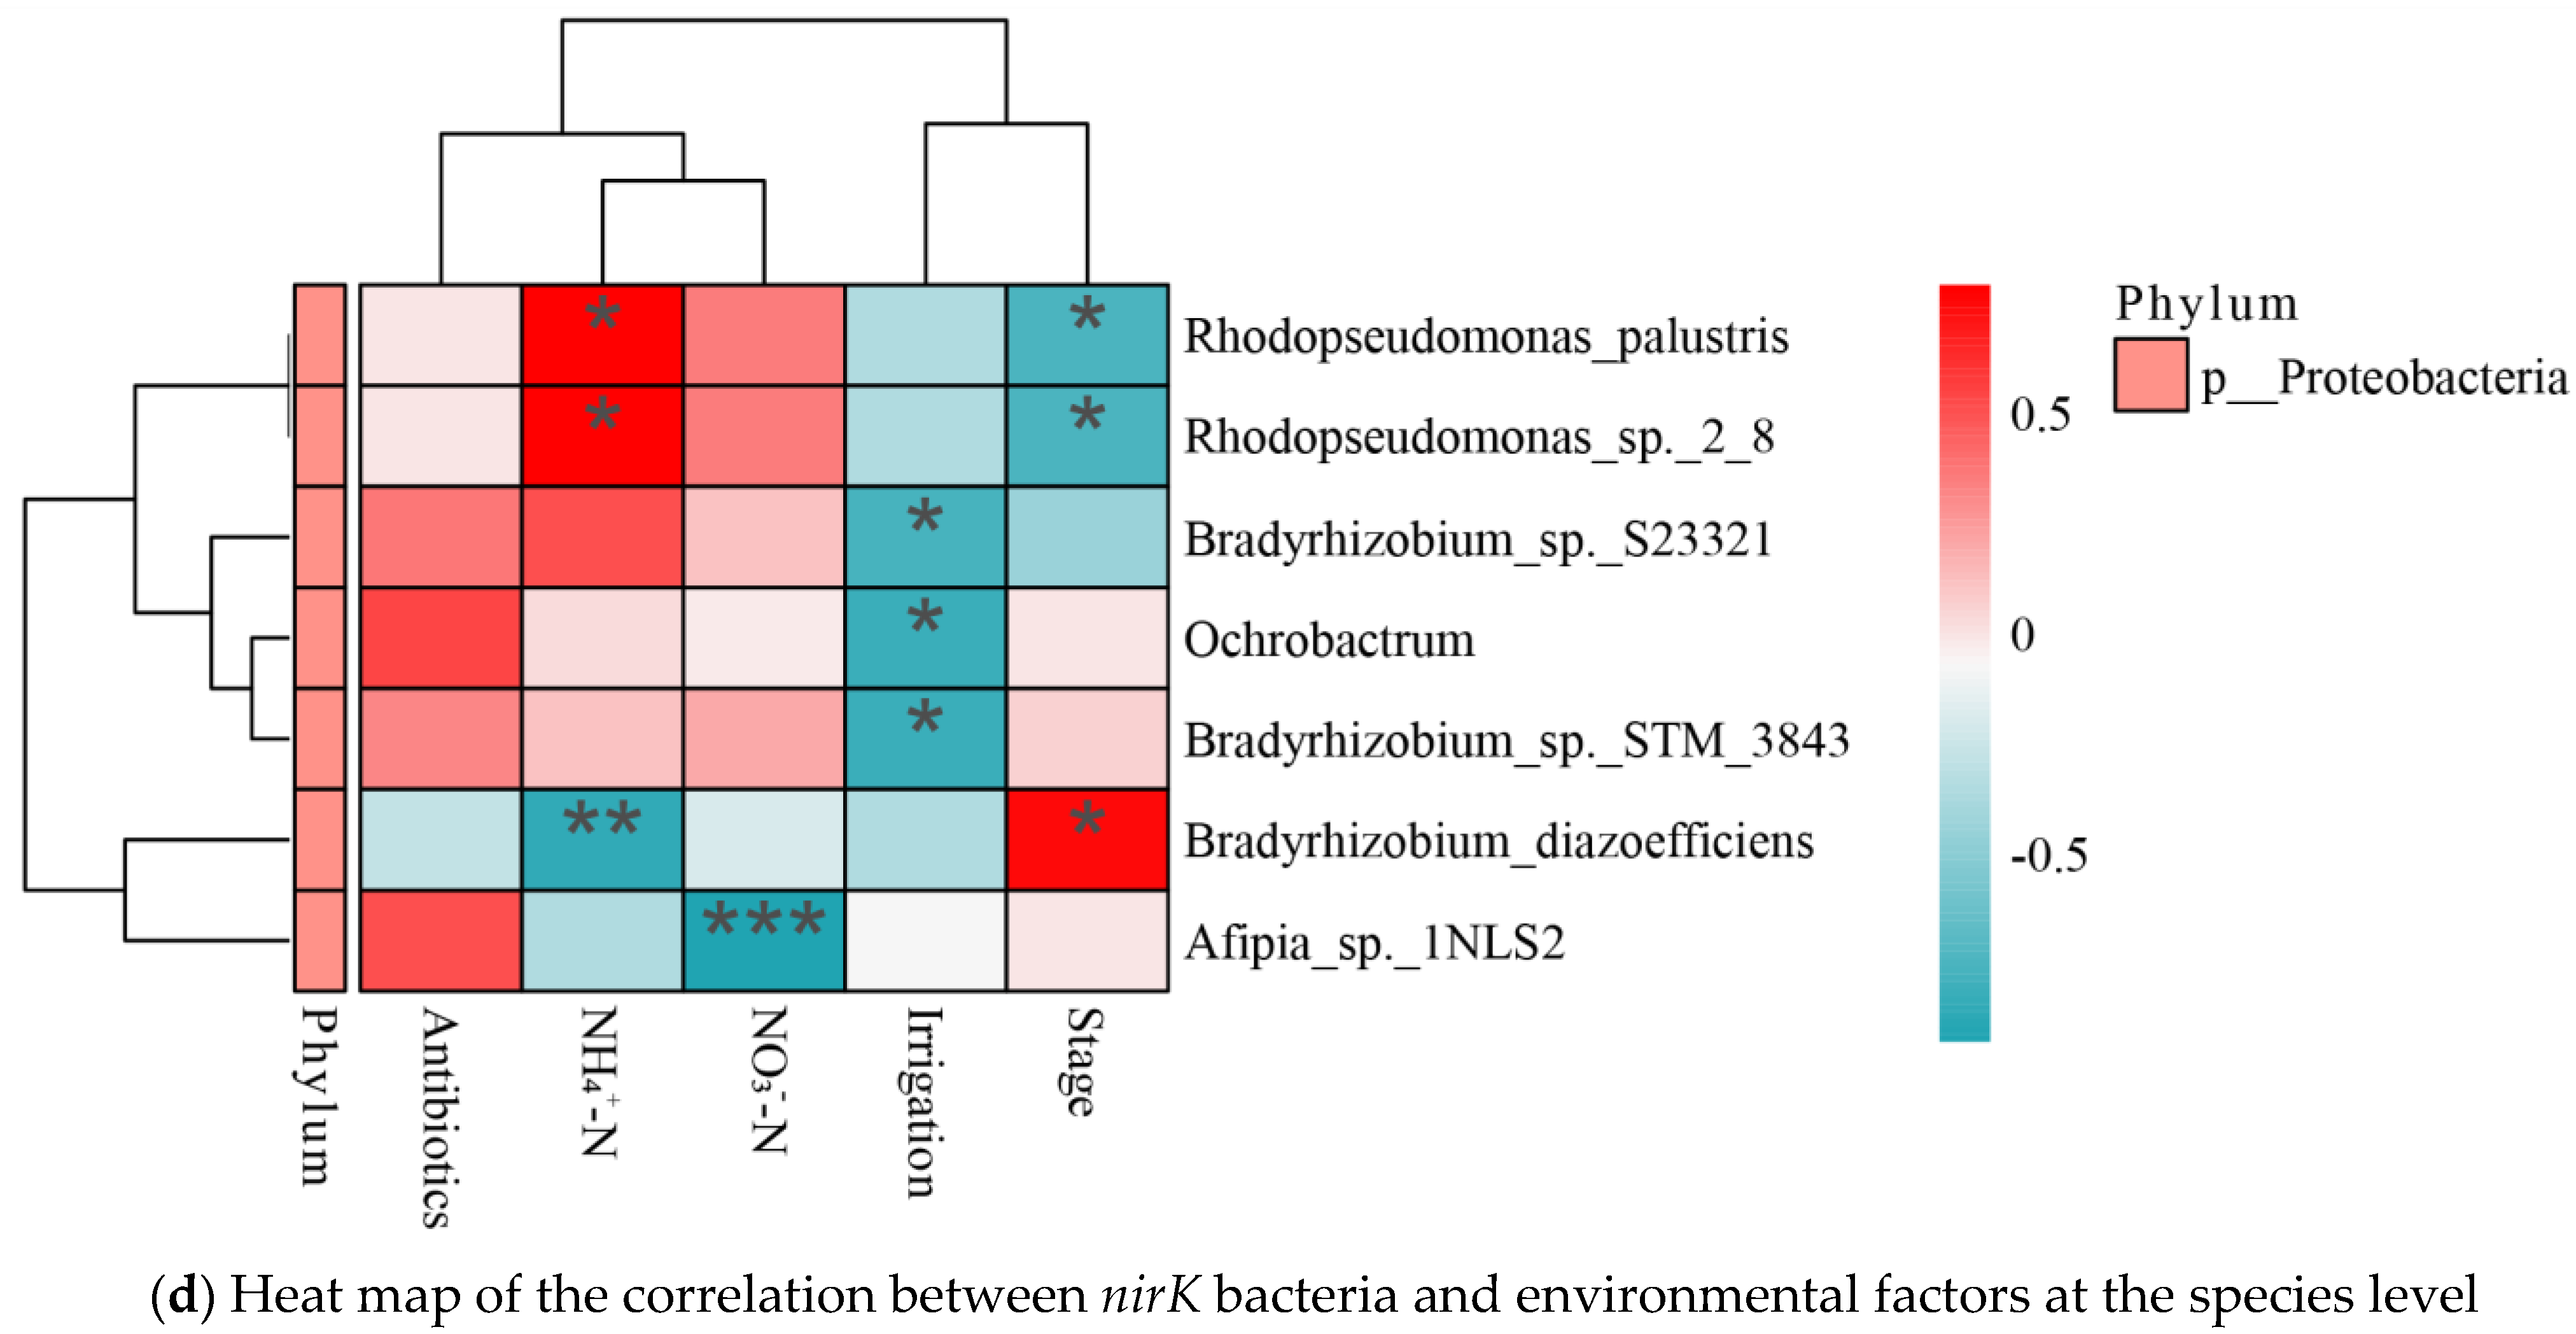
3.5. Correlation Analysis
4. Discussion
4.1. Soil Nitrogen
4.2. Nitrogen Conversion-Related Microorganisms
5. Conclusions
Supplementary Materials
Author Contributions
Funding
Data Availability Statement
Conflicts of Interest
References
- Jasechko, S.; Perrone, D. Global groundwater wells at risk of running dry. Science 2021, 372, 418–421. [Google Scholar] [CrossRef]
- Ault, T.R. On the essentials of drought in a changing climate. Science 2020, 368, 256–260. [Google Scholar] [CrossRef] [PubMed]
- Elimelech, M.; Phillip, W.A. The Future of Seawater Desalination: Energy, Technology, and the Environment. Science 2011, 333, 712–717. [Google Scholar] [CrossRef] [PubMed]
- Yan, J.; Zhu, J.Q.; Ma, Y.; Jiang, S.Y.; Wu, Q.X. Effects of Pond Aquaculture Wastewater lrrigation and Reducing Fertilization on Grain Yield, Nitrogen and Phosphorus Mobility in Soil. Water Sav. Irrig. 2017, 2017, 65–69. (In Chinese) [Google Scholar]
- de Araújo, A.F.B.; Cavalcante, E.S.; Lacerda, C.F.; de Albuquerque, F.A.; Sales, J.R.D.S.; Lopes, F.B.; Ferreira, J.F.D.S.; Costa, R.N.T.; Lima, S.C.R.V.; Bezerra, M.A.; et al. Fiber Quality, Yield, and Profitability of Cotton in Response to Supplemental Irrigation with Treated Wastewater and NPK Fertilization. Agronomy 2022, 12, 2527. [Google Scholar] [CrossRef]
- Nie, X.; Mubashar, M.; Zhang, S.; Qin, Y.; Zhang, X. Current progress, challenges and perspectives in microalgae-based nutrient removal for aquaculture waste: A comprehensive review. J. Clean. Prod. 2020, 277, 124209. [Google Scholar] [CrossRef]
- Leogrande, R.; Pedrero, F.; Nicolas, E.; Vitti, C.; Lacolla, G.; Stellacci, A.M. Reclaimed Water Use in Agriculture: Effects on Soil Chemical and Biological Properties in a Long-Term Irrigated Citrus Farm. Agronomy 2022, 12, 1317. [Google Scholar] [CrossRef]
- Chen, L.; Feng, Q.; Li, C.; Wei, Y.; Zhao, Y.; Feng, Y.; Zheng, H.; Li, F.; Li, H. Impacts of aquaculture wastewater irrigation on soil microbial functional diversity and community structure in arid regions. Sci. Rep. 2017, 7, 10. [Google Scholar] [CrossRef] [Green Version]
- Bao, W.; Zhu, S.; Jin, G.; Ye, Z. Generation, characterization, perniciousness, removal and reutilization of solids in aquaculture water: A review from the whole process perspective. Rev. Aquac. 2018, 11, 1342–1366. [Google Scholar] [CrossRef]
- Ahmad, A.; Kurniawan, S.B.; Abdullah, S.R.S.; Othman, A.R.; Abu Hasan, H. Contaminants of emerging concern (CECs) in aquaculture effluent: Insight into breeding and rearing activities, alarming impacts, regulations, performance of wastewater treatment unit and future approaches. Chemosphere 2022, 290, 15. [Google Scholar] [CrossRef]
- He, Z.; Cheng, X.; Kyzas, G.Z.; Fu, J. Pharmaceuticals pollution of aquaculture and its management in China. J. Mol. Liq. 2016, 223, 781–789. [Google Scholar] [CrossRef]
- Zhang, Q.Y.; Zhou, J.Z.; Zhao, W.W.; Wu, W. Analysis of Sulfonamides Residues and lsolation of Sulfonamides Resistant Strains in the Aquaculture Environment. Ecol. Environ. 2015, 24, 1354–1360. (In Chinese) [Google Scholar] [CrossRef]
- Carvalho, I.T.; Santos, L. Antibiotics in the aquatic environments: A review of the European scenario. Environ. Int. 2016, 94, 736–757. [Google Scholar] [CrossRef]
- Liu, X.; Steele, J.C.; Meng, X.-Z. Usage, residue, and human health risk of antibiotics in Chinese aquaculture: A review. Environ. Pollut. 2017, 223, 161–169. [Google Scholar] [CrossRef] [PubMed]
- Zhuo, L.; Wang, M.H.; Shi, Y.G.; Wang, Y.Y.; Zhuang, X.; Xu, R.F.; Ren, M.Z. Occurrence, Distribution, and Ecological Risk of Antibiotics in Surface Water of Typical Drinking Water Sources and Aquaculture in South China. Asian J. Ecotoxicol. 2019, 14, 164–175. (In Chinese) [Google Scholar] [CrossRef]
- Su, H.; Xu, W.; Hu, X.; Xu, Y.; Wen, G.; Cao, Y. Spatiotemporal variations and source tracking of antibiotics in an ecological aquaculture farm in Southern China. Sci. Total Environ. 2020, 763, 143022. [Google Scholar] [CrossRef]
- Christou, A.; Agüera, A.; Bayona, J.M.; Cytryn, E.; Fotopoulos, V.; Lambropoulou, D.; Manaia, C.M.; Michael, C.; Revitt, M.; Schröder, P.; et al. The potential implications of reclaimed wastewater reuse for irrigation on the agricultural environment: The knowns and unknowns of the fate of antibiotics and antibiotic resistant bacteria and resistance genes—A review. Water Res. 2017, 123, 448–467. [Google Scholar] [CrossRef] [Green Version]
- Camacho-Arévalo, R.; García-Delgado, C.; Mayans, B.; Antón-Herrero, R.; Cuevas, J.; Segura, M.; Eymar, E. Sulfonamides in Tomato from Commercial Greenhouses Irrigated with Reclaimed Wastewater: Uptake, Translocation and Food Safety. Agronomy 2021, 11, 1016. [Google Scholar] [CrossRef]
- Zhang, J.-J.; Chen, J.; Wang, C.; Wang, P.-F.; Gao, H.; Hu, Y. Distribution characteristics and controlling factors of typical antibiotics and antibiotic resistance genes in river networks in western area of Wangyu River, China. Water Sci. Eng. 2022, 15, 318–327. [Google Scholar] [CrossRef]
- Lyu, J.; Yang, L.; Zhang, L.; Ye, B.; Wang, L. Antibiotics in soil and water in China–a systematic review and source analysis. Environ. Pollut. 2020, 266, 115147. [Google Scholar] [CrossRef]
- Zhang, Y.; Cheng, D.M.; Xie, J.; Zhang, Y.T.; Wan, Y.; Zhang, Y.Q.; Shi, X.J. Impacts of farmland application of antibiotic–contaminated manures on the occurrence of antibiotic residues and antibiotic resistance genes in soil: A meta–analysis study. Chemosphere 2022, 300, 13. [Google Scholar] [CrossRef] [PubMed]
- Wu, J.; Wang, J.; Li, Z.; Guo, S.; Li, K.; Xu, P.; Ok, Y.S.; Jones, D.L.; Zou, J. Antibiotics and antibiotic resistance genes in agricultural soils: A systematic analysis. Crit. Rev. Environ. Sci. Technol. 2022, 1–18. [Google Scholar] [CrossRef]
- Braun, G.; Braun, M.; Kruse, J.; Amelung, W.; Renaud, F.G.; Khoi, C.M.; Duong, M.V.; Sebesvari, Z. Pesticides and antibiotics in permanent rice, alternating rice–shrimp and permanent shrimp systems of the coastal Mekong Delta, Vietnam. Environ. Int. 2019, 127, 442–451. [Google Scholar] [CrossRef] [PubMed]
- Grenni, P.; Ancona, V.; Caracciolo, A.B. Ecological effects of antibiotics on natural ecosystems: A review. Microchem. J. 2018, 136, 25–39. [Google Scholar] [CrossRef]
- Kumar, M.; Jaiswal, S.; Sodhi, K.K.; Shree, P.; Singh, D.K.; Agrawal, P.K.; Shukla, P. Antibiotics bioremediation: Perspectives on its ecotoxicity and resistance. Environ. Int. 2019, 124, 448–461. [Google Scholar] [CrossRef]
- Cui, H.; Wang, S.-P.; Fu, J.; Zhou, Z.-Q.; Zhang, N.; Guo, L. Influence of ciprofloxacin on microbial community structure and function in soils. Biol. Fertil. Soils 2014, 50, 939–947. [Google Scholar] [CrossRef]
- D’Alessio, M.; Durso, L.M.; Miller, D.N.; Woodbury, B.; Ray, C.; Snow, D.D. Environmental fate and microbial effects of monensin, lincomycin, and sulfamethazine residues in soil. Environ. Pollut. 2019, 246, 60–68. [Google Scholar] [CrossRef] [Green Version]
- DeVries, S.L.; Loving, M.; Li, X.; Zhang, P. The effect of ultralow-dose antibiotics exposure on soil nitrate and N2O flux. Sci. Rep. 2015, 5, 16818. [Google Scholar] [CrossRef] [Green Version]
- Guan, A.; Qi, W.; Peng, Q.; Zhou, J.; Bai, Y.; Qu, J. Environmental heterogeneity determines the response patterns of microbially mediated N-reduction processes to sulfamethoxazole in river sediments. J. Hazard. Mater. 2021, 421, 126730. [Google Scholar] [CrossRef]
- Sun, X.L.; Hu, Z.Y.; Liu, L.; Li, S.Y.; Liu, F.L. Pollutant Reduction Systems for Controlling Agricultural Non–Point–SourcePollution in Town District of River Network Area Based on Reuse of Wastewater and Nutrient: A Case Study in Xinjian Town, Taihu Lake. J. Ecol. Rural Environ. 2019, 35, 582–592. (In Chinese) [Google Scholar] [CrossRef]
- Ananna, F.H.; Amin, M.M.; Islam, D.; Ahmed, T.; Ashrafuzzaman, M.; Aziz, M.G. Groundwater contamination risks with manure-borne microorganisms under different land-application options. Water Sci. Eng. 2021, 14, 314–322. [Google Scholar] [CrossRef]
- Haque, A.; Uddin, K.; Sulaiman, M.; Amin, A.; Hossain, M.; Aziz, A.; Mosharrof, M. Impact of Organic Amendment with Alternate Wetting and Drying Irrigation on Rice Yield, Water Use Efficiency and Physicochemical Properties of Soil. Agronomy 2021, 11, 1529. [Google Scholar] [CrossRef]
- Zhou, H.-Y.; Han, M.-L.; Qiu, T.-L.; Gao, M.; Sun, X.-B.; Wang, X.-M. Ammonia Removal Rate and Microbial Community Structures in Different Biofilters for Treating Aquaculture Wastewater. Huan Jing Ke Xue 2017, 38, 2444–2452. [Google Scholar]
- Srikanthasamy, T.; Barot, S.; Koffi, F.K.; Tambosco, K.; Marcangeli, Y.; Carmignac, D.; N’Dri, A.B.; Gervaix, J.; Leloup, J.; Le Roux, X.; et al. Effects of vegetation cover and season on soil nitrifiers in an African savanna: Evidence of archaeal nitrifier inhibition by grasses. Geoderma 2022, 416, 115775. [Google Scholar] [CrossRef]
- Zhang, X.; Qiu, Y.; Gilliam, F.S.; Gillespie, C.J.; Tu, C.; Reberg-Horton, S.C.; Hu, S. Arbuscular Mycorrhizae Shift Community Composition of N-Cycling Microbes and Suppress Soil N2O Emission. Environ. Sci. Technol. 2022, 56, 13461–13472. [Google Scholar] [CrossRef] [PubMed]
- Liao, J.; Hu, A.; Zhao, Z.; Liu, X.; Jiang, C.; Zhang, Z. Biochar with large specific surface area recruits N2O-reducing microbes and mitigate N2O emission. Soil Biol. Biochem. 2021, 156, 12. [Google Scholar] [CrossRef]
- Gong, Y.; Sun, F.; Wang, F.M.; Lambers, H.; Li, Y.W.; Zhong, Q.P.; Chen, J.; Li, Z.; Wang, M. The mechanisms and potentially positive effects of seven years of delayed and wetter wet seasons on nitrous oxide fluxes in a tropical monsoon forest. Geoderma 2022, 412, 11. [Google Scholar] [CrossRef]
- Lv, B.; Zhang, D.; Chen, Q.; Cui, Y. Effects of earthworms on nitrogen transformation and the correspond genes (amoA and nirS) in vermicomposting of sewage sludge and rice straw. Bioresour. Technol. 2019, 287, 121428. [Google Scholar] [CrossRef]
- Yoshida, M.; Ishii, S.; Otsuka, S.; Senoo, K. Temporal shifts in diversity and quantity of nirS and nirK in a rice paddy field soil. Soil Biol. Biochem. 2009, 41, 2044–2051. [Google Scholar] [CrossRef]
- Chen, L.; Zhao, Z.; Li, J.; Wang, H.; Guo, G.; Wu, W. Effects of muddy water irrigation with different sediment particle sizes and sediment concentrations on soil microbial communities in the Yellow River Basin of China. Agric. Water Manag. 2022, 270, 107750. [Google Scholar] [CrossRef]
- Li, S.H. Effects of Different Tillage Patterns on greenhouse Gas Emission and Nitrogen Uptake of Rice. Ph.D. Thesis, Huazhong Agricultural University, Wuhan, China, 2021. (In Chinese). [Google Scholar]
- Pandey, A.; Suter, H.; He, J.-Z.; Hu, H.W.; Chen, D. Dissimilatory nitrate reduction to ammonium dominates nitrate reduction in long–term low nitrogen fertilized rice paddies. Soil Biol. Biochem. 2019, 131, 149–156. [Google Scholar] [CrossRef]
- Cao, X.C.; Liu, X.X.; Ma, C.; Tian, C.; Zhu, L.F.; Wu, L.L.; Zhang, J.H.; Jin, Q.Y.; Zhu, C.Q.; Kong, Y.L.; et al. Alternative dry–wet irrigation improves the rhizospheric oxygen environment and nitrogen transformation, and increases nitrogen absorption by rice plants. Plant Nutr. Fert. Sci. 2022, 28, 1–14. (In Chinese) [Google Scholar] [CrossRef]
- Zhang, Z.Z.; Wang, D.M.; Li, M.X. Effect of Drying–rewetting Intensity on Soil Nutrient Availability. J. Soil Water Conserv. 2021, 35, 265–270. (In Chinese) [Google Scholar] [CrossRef]
- Zhang, S.; Zhang, Y.; Li, K.; Yan, M.; Zhang, J.; Yu, M.; Tang, S.; Wang, L.; Qu, H.; Luo, L.; et al. Nitrogen Mediates Flowering Time and Nitrogen Use Efficiency via Floral Regulators in Rice. Curr. Biol. 2021, 31, 671–683. [Google Scholar] [CrossRef] [PubMed]
- Yang, H.-C.; Kan, C.-C.; Hung, T.-H.; Hsieh, P.-H.; Wang, S.-Y.; Hsieh, W.-Y.; Hsieh, M.-H. Identification of early ammonium nitrate-responsive genes in rice roots. Sci. Rep. 2017, 7, 16. [Google Scholar] [CrossRef] [Green Version]
- Revellin, C.; Hartmann, A.; Solanas, S.; Topp, E. Long-Term Exposure of Agricultural Soil to Veterinary Antibiotics Changes the Population Structure of Symbiotic Nitrogen-Fixing Rhizobacteria Occupying Nodules of Soybeans (Glycine max). Appl. Environ. Microbiol. 2018, 84, 9. [Google Scholar] [CrossRef] [Green Version]
- DeVries, S.L.; Zhang, P. Antibiotics and the Terrestrial Nitrogen Cycle: A Review. Curr. Pollut. Rep. 2016, 2, 51–67. [Google Scholar] [CrossRef] [Green Version]
- DeVries, S.L.; Block, K.A.; Loving, M.; Logozzo, L.; Zhang, P. The effects of trace narasin on the biogeochemical N-cycle in a cultivated sandy loam. Sci. Total Environ. 2020, 716, 137031. [Google Scholar] [CrossRef]
- Sterngren, A.E.; Hallin, S.; Bengtson, P. Archaeal Ammonia Oxidizers Dominate in Numbers, but Bacteria Drive Gross Nitrification in N–amended Grassland Soil. Front. Microbiol. 2015, 6, 8. [Google Scholar] [CrossRef] [Green Version]
- Xiao, R.; Qiu, Y.; Tao, J.; Zhang, X.; Chen, H.; Reberg-Horton, S.C.; Shi, W.; Shew, H.D.; Zhang, Y.; Hu, S. Biological controls over the abundances of terrestrial ammonia oxidizers. Glob. Ecol. Biogeogr. 2019, 29, 384–399. [Google Scholar] [CrossRef]
- Wang, C.; Tang, S.; He, X.; Ji, G. The abundance and community structure of active ammonia-oxidizing archaea and ammonia-oxidizing bacteria shape their activities and contributions in coastal wetlands. Water Res. 2020, 171, 115464. [Google Scholar] [CrossRef] [PubMed]
- Xiao, R.; Ran, W.; Hu, S.; Guo, H. The response of ammonia oxidizing archaea and bacteria in relation to heterotrophs under different carbon and nitrogen amendments in two agricultural soils. Appl. Soil Ecol. 2020, 158, 103812. [Google Scholar] [CrossRef]
- Qin, Y.; Liu, W.; He, F.; Li, X. Nitrogen and Phosphorus Fertilization Reshapes the Abundance and Structure of Ammonia Oxidizers on a Leymus chinensis Steppe in Northern China. Agronomy 2022, 12, 2515. [Google Scholar] [CrossRef]
- Huang, D.; Li, X.; Luo, X. Response of Nitrifier and Denitrifier Abundance to Salinity Gradients in Agricultural Soils at the Yellow River Estuary. Agronomy 2022, 12, 1642. [Google Scholar] [CrossRef]
- Ying, J.; Li, X.; Wang, N.; Lan, Z.; He, J.; Bai, Y. Contrasting effects of nitrogen forms and soil pH on ammonia oxidizing microorganisms and their responses to long-term nitrogen fertilization in a typical steppe ecosystem. Soil Biol. Biochem. 2017, 107, 10–18. [Google Scholar] [CrossRef]
- Zou, W.; Lang, M.; Zhang, L.; Liu, B.; Chen, X. Ammonia-oxidizing bacteria rather than ammonia-oxidizing archaea dominate nitrification in a nitrogen-fertilized calcareous soil. Sci. Total Environ. 2021, 811, 151402. [Google Scholar] [CrossRef]
- Dong, X.; Zhang, J.; Qiu, H.; Zhang, H.; Luo, C.; Deng, D.; Shen, Q.; Jia, Z. Chronic Nitrogen Fertilization Modulates Competitive Interactions Among Microbial Ammonia Oxidizers in a Loess Soil. Pedosphere 2019, 29, 24–33. [Google Scholar] [CrossRef]
- Bowen, H.; Maul, J.E.; Cavigelli, M.A.; Yarwood, S. Denitrifier abundance and community composition linked to denitrification activity in an agricultural and wetland soil. Appl. Soil Ecol. 2020, 151, 103521. [Google Scholar] [CrossRef]
- Liang, Y.; Wu, C.; Wei, X.; Liu, Y.; Chen, X.; Qin, H.; Wu, J.; Su, Y.; Ge, T.; Hu, Y. Characterization of nirS- and nirK-containing communities and potential denitrification activity in paddy soil from eastern China. Agric. Ecosyst. Environ. 2021, 319, 107561. [Google Scholar] [CrossRef]
- Xiao, X.; Xie, G.X.; Yang, Z.H.; He, N.; Yang, D.; Liu, M.D. Variation in abundance, diversity, and composition of nirK and nirS containing denitrifying bacterial communities in a red paddy soil as affected by combined organic–chemical fertilization. Appl. Soil Ecol. 2021, 166, 10. [Google Scholar] [CrossRef]
- Wang, X.; Li, Y.; Ciampitti, I.A.; He, P.; Xu, X.; Qiu, S.; Zhao, S. Response of soil denitrification potential and community composition of denitrifying bacterial to different rates of straw return in north-central China. Appl. Soil Ecol. 2022, 170, 10. [Google Scholar] [CrossRef]
- Heděnec, P.; Rui, J.; Lin, Q.; Yao, M.; Li, J.; Li, H.; Frouz, J.; Li, X. Functional and phylogenetic response of soil prokaryotic community under an artificial moisture gradient. Appl. Soil Ecol. 2018, 124, 372–378. [Google Scholar] [CrossRef]
- Wepking, C.; Badgley, B.; Barrett, J.E.; Knowlton, K.F.; Lucas, J.M.; Minick, K.J.; Ray, P.P.; Shawver, S.E.; Strickland, M.S. Prolonged exposure to manure from livestock-administered antibiotics decreases ecosystem carbon-use efficiency and alters nitrogen cycling. Ecol. Lett. 2019, 22, 2067–2076. [Google Scholar] [CrossRef]
- Zhang, L.; Zhang, C.; Lian, K.; Liu, C. Effects of chronic exposure of antibiotics on microbial community structure and functions in hyporheic zone sediments. J. Hazard. Mater. 2021, 416, 126141. [Google Scholar] [CrossRef] [PubMed]
- Yin, G.Y.; Hou, L.J.; Liu, M.; Zheng, Y.L.; Li, X.F.; Lin, X.B.; Gao, J.; Jiang, X.F.; Wang, R.; Yu, C.D. Effects of multiple antibiotics exposure on denitrification process in the Yangtze Estuary sediments. Chemosphere 2017, 171, 118–125. [Google Scholar] [CrossRef]
- Li, W.; Shi, C.; Yu, Y.; Ruan, Y.; Kong, D.; Lv, X.; Xu, P.; Awasthi, M.K.; Dong, M. Interrelationships between tetracyclines and nitrogen cycling processes mediated by microorganisms: A review. Bioresour. Technol. 2020, 319, 124036. [Google Scholar] [CrossRef] [PubMed]
- Tu, R.; Jin, W.; Han, S.-F.; Zhou, X.; Wang, T.; Gao, S.-H.; Wang, Q.; Chen, C.; Xie, G.-J.; Wang, Q. Rapid enrichment and ammonia oxidation performance of ammonia-oxidizing archaea from an urban polluted river of China. Environ. Pollut. 2019, 255, 113258. [Google Scholar] [CrossRef]
- Tang, S.; Wang, C.; Ji, G. Response of ammonia-oxidizing archaea and bacteria to streptomycin sulfate and penicillin in coastal wetlands along the Bohai Rim. Land Degrad. Dev. 2021, 32, 1917–1926. [Google Scholar] [CrossRef]
- Banerjee, S.; Helgason, B.; Wang, L.; Winsley, T.; Ferrari, B.C.; Siciliano, S.D. Legacy effects of soil moisture on microbial community structure and N2O emissions. Soil Biol. Biochem. 2016, 95, 40–50. [Google Scholar] [CrossRef]
- Liu, H.; Yang, Y.; Sun, H.; Zhao, L.; Liu, Y. Effect of tetracycline on microbial community structure associated with enhanced biological N&P removal in sequencing batch reactor. Bioresour. Technol. 2018, 256, 414–420. [Google Scholar] [CrossRef]
- Rahman, M.M.; Shan, J.; Yang, P.P.; Shang, X.X.; Xia, Y.Q.; Yan, X.Y. Effects of long–term pig manure application on antibiotics, abundance of antibiotic resistance genes (ARGs), anammox and denitrification rates in paddy soils. Environ. Pollut. 2018, 240, 368–377. [Google Scholar] [CrossRef] [PubMed]
- Deng, F.; Zhang, D.; Yang, L.; Li, L.; Lu, Y.; Wang, J.; Fan, Y.; Zhu, Y.; Li, X.; Zhang, Y. Effects of antibiotics and heavy metals on denitrification in shallow eutrophic lakes. Chemosphere 2021, 291, 132948. [Google Scholar] [CrossRef] [PubMed]


| Treatments | Antibiotic Concentrations (A) | Irrigation Methods (W) |
|---|---|---|
| A0W1 | A0 | W1 |
| A0W2 | A0 | W2 |
| A0W3 | A0 | W3 |
| A1W1 | A1 | W1 |
| A1W2 | A1 | W2 |
| A1W3 | A1 | W3 |
| A2W1 | A2 | W1 |
| A2W2 | A2 | W2 |
| A2W3 | A2 | W3 |
| A3W1 | A3 | W1 |
| A3W2 | A3 | W2 |
| A3W3 | A3 | W3 |
| Genes | Name of Primer | Sequence (5′ to 3′) |
|---|---|---|
| AOA amoA | Arch-amoA26F | GACTACATMTTCTAYACWGAYTGGGC |
| Arch-amoA417R | GGKGTCATRTATGGWGGYAAYGTTGG | |
| AOB amoA | amoB-F | GGGGTTTCTACTGGTGGT |
| amoB-r | CCCCTCKGSAAAGCCTTCTTC | |
| nirK | nirKF1aCu | ATCATGGTSCTGCCGCG |
| nirKR3Cu | GCCTCGATCAGRTTGTGGTT | |
| nirS | cd3aF | GTSAACGTSAAGGARACSGG |
| R3cd | GASTTCGGRTGSGTCTTGA |
| Growth Stages | Treatments | AOA amoA | AOB amoA | nirS | nirK | ||||
|---|---|---|---|---|---|---|---|---|---|
| Chao1 | Shannon | Chao1 | Shannon | Chao1 | Shannon | Chao1 | Shannon | ||
| late tillering | A0W2 | 24 | 3.113744 | 24 | 0.768873 | 34 | 2.060788 | 299.4286 | 4.729482 |
| A3W1 | 23 | 3.065076 | 19 | 1.155675 | 22 | 2.764163 | 284.6364 | 4.776766 | |
| A3W2 | 23 | 2.904411 | 15 | 0.857637 | 17.5 | 2.110334 | 292.5526 | 4.368037 | |
| A3W3 | 24 | 2.687998 | 21.33333 | 3.391534 | 19.5 | 3.050141 | 255.45 | 5.180928 | |
| yellow ripening | A0W2 | 24 | 3.129178 | 22 | 0.240285 | 20.2 | 3.707995 | 327 | 3.452603 |
| A3W1 | 23.5 | 3.306445 | 13 | 0.392306 | 20 | 2.956571 | 278.0882 | 4.347746 | |
| A3W2 | 21 | 3.279984 | 13 | 0.478024 | 42.46154 | 2.113301 | 207.2 | 2.755407 | |
| A3W3 | 24 | 3.206926 | 11 | 1.74004 | 18 | 3.458921 | 242 | 5.106296 | |
Publisher’s Note: MDPI stays neutral with regard to jurisdictional claims in published maps and institutional affiliations. |
© 2022 by the authors. Licensee MDPI, Basel, Switzerland. This article is an open access article distributed under the terms and conditions of the Creative Commons Attribution (CC BY) license (https://creativecommons.org/licenses/by/4.0/).
Share and Cite
Chen, L.; Wang, H.; Li, J.; Wu, W.; Guo, G. Effect of the Sulfamethazine on Nitrogen Conversion in Alternate Wet and Dry Paddy Fields. Agronomy 2022, 12, 3034. https://doi.org/10.3390/agronomy12123034
Chen L, Wang H, Li J, Wu W, Guo G. Effect of the Sulfamethazine on Nitrogen Conversion in Alternate Wet and Dry Paddy Fields. Agronomy. 2022; 12(12):3034. https://doi.org/10.3390/agronomy12123034
Chicago/Turabian StyleChen, Lina, Haiming Wang, Jiang Li, Wenbo Wu, and Guomian Guo. 2022. "Effect of the Sulfamethazine on Nitrogen Conversion in Alternate Wet and Dry Paddy Fields" Agronomy 12, no. 12: 3034. https://doi.org/10.3390/agronomy12123034
APA StyleChen, L., Wang, H., Li, J., Wu, W., & Guo, G. (2022). Effect of the Sulfamethazine on Nitrogen Conversion in Alternate Wet and Dry Paddy Fields. Agronomy, 12(12), 3034. https://doi.org/10.3390/agronomy12123034