
Preharvest Reduction in Nutrient Solution Supply of Pepper (Capsicum annuum L.) Contributes to Improve Fruit Quality and Fertilizer Efficiency While Stabilising Yields
Abstract
:1. Introduction
2. Materials and Methods
2.1. Experimental Site and Materials
2.2. Experimental Design and Field Management
2.3. Measurements and Methods
2.3.1. Growth and Yield
2.3.2. Plant Biomass and Element Accumulation
2.3.3. Nutrition Quality of Fruit
2.3.4. Flavour Quality of Fruit
2.3.5. Fertiliser Use Efficiency (FUE) and WUE
2.3.6. C and N Metabolism
2.4. Data Analysis
3. Results
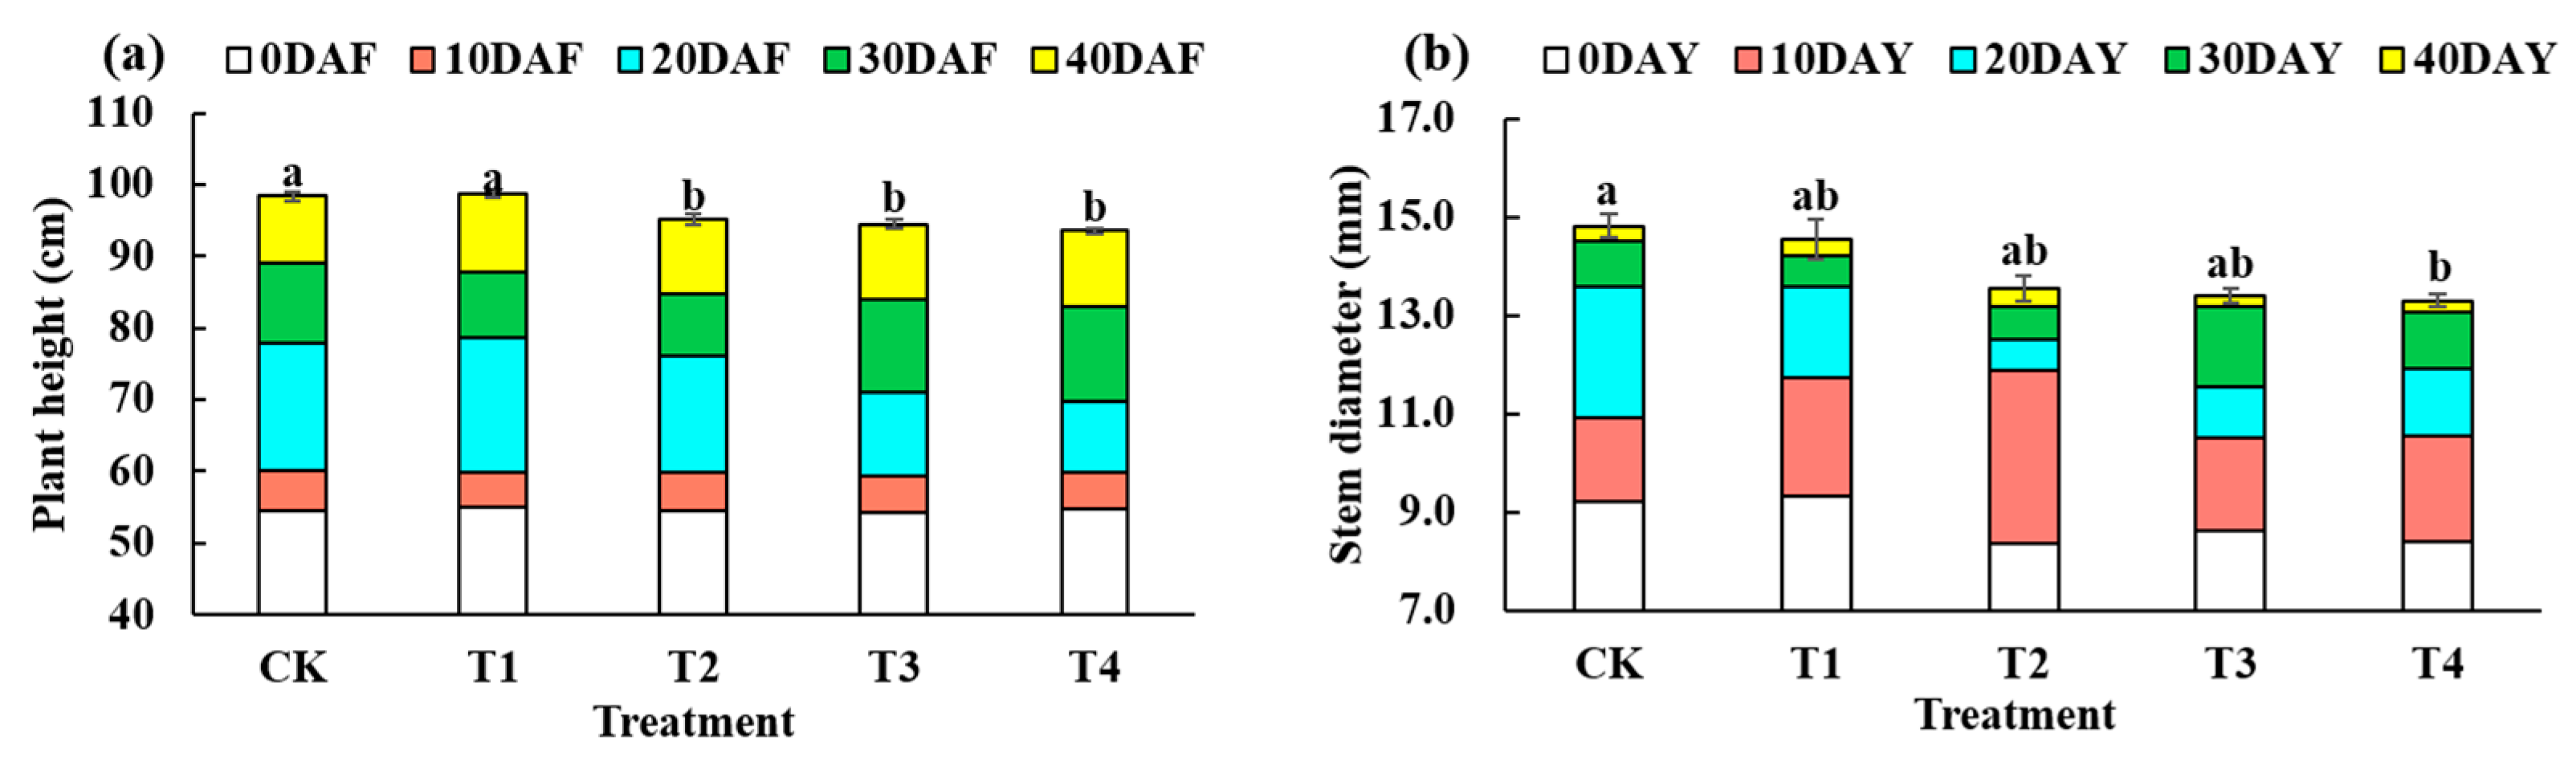
3.1. Morphological Characteristics of Pepper
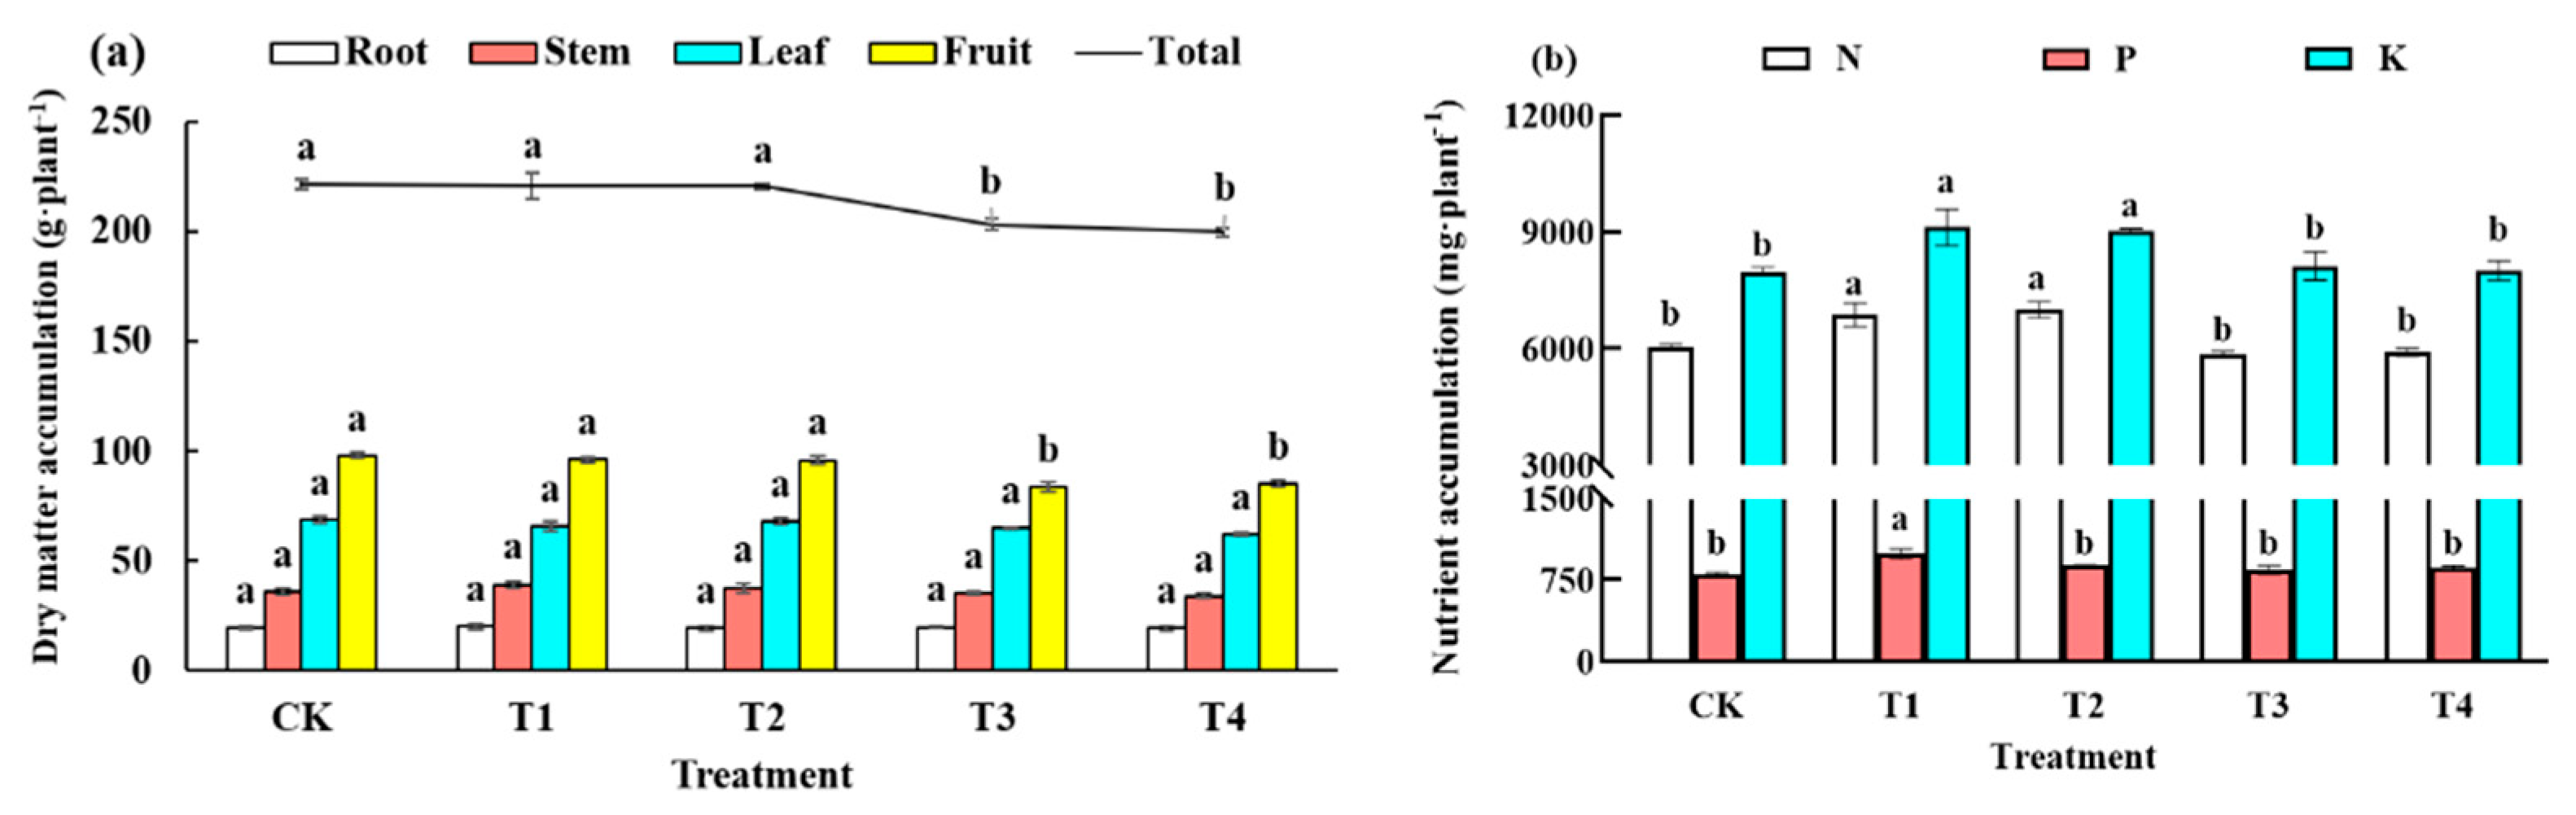
3.2. Plant Biomass and Element Accumulation
3.3. Changes in Physiological Indices Caused by Reduced Fertiliser Application before Harvesting
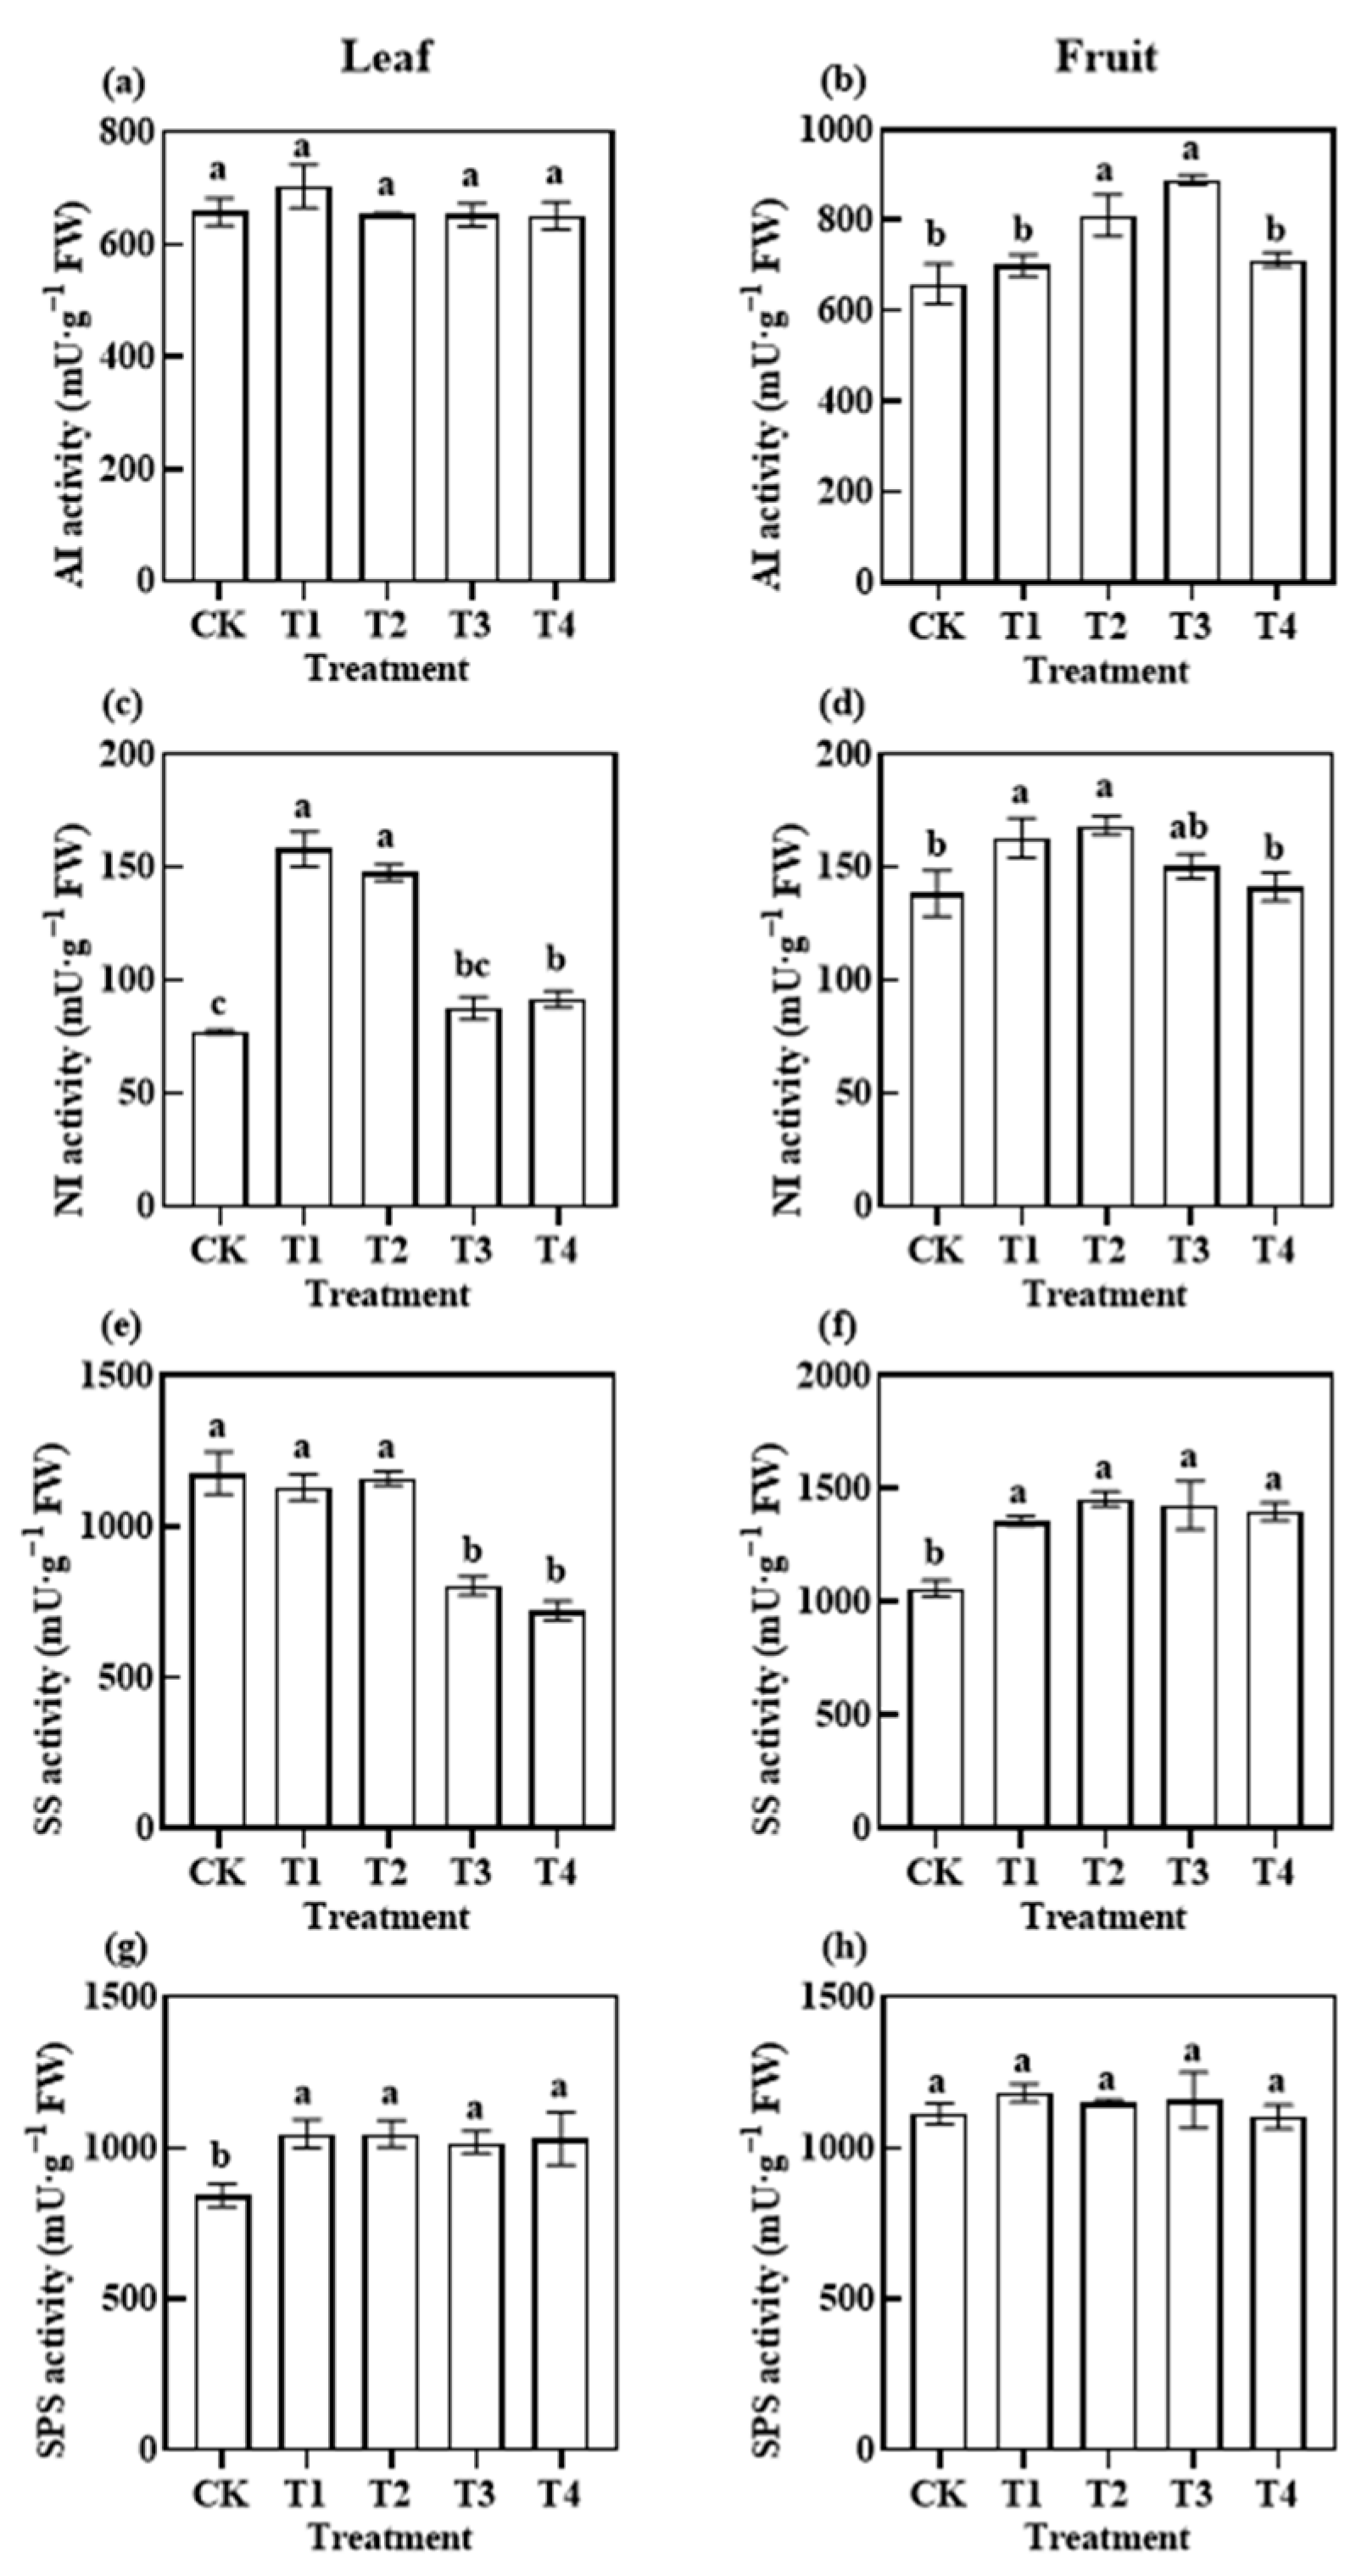
3.3.1. Photosynthetic C Metabolism-Related Enzymatic Activities
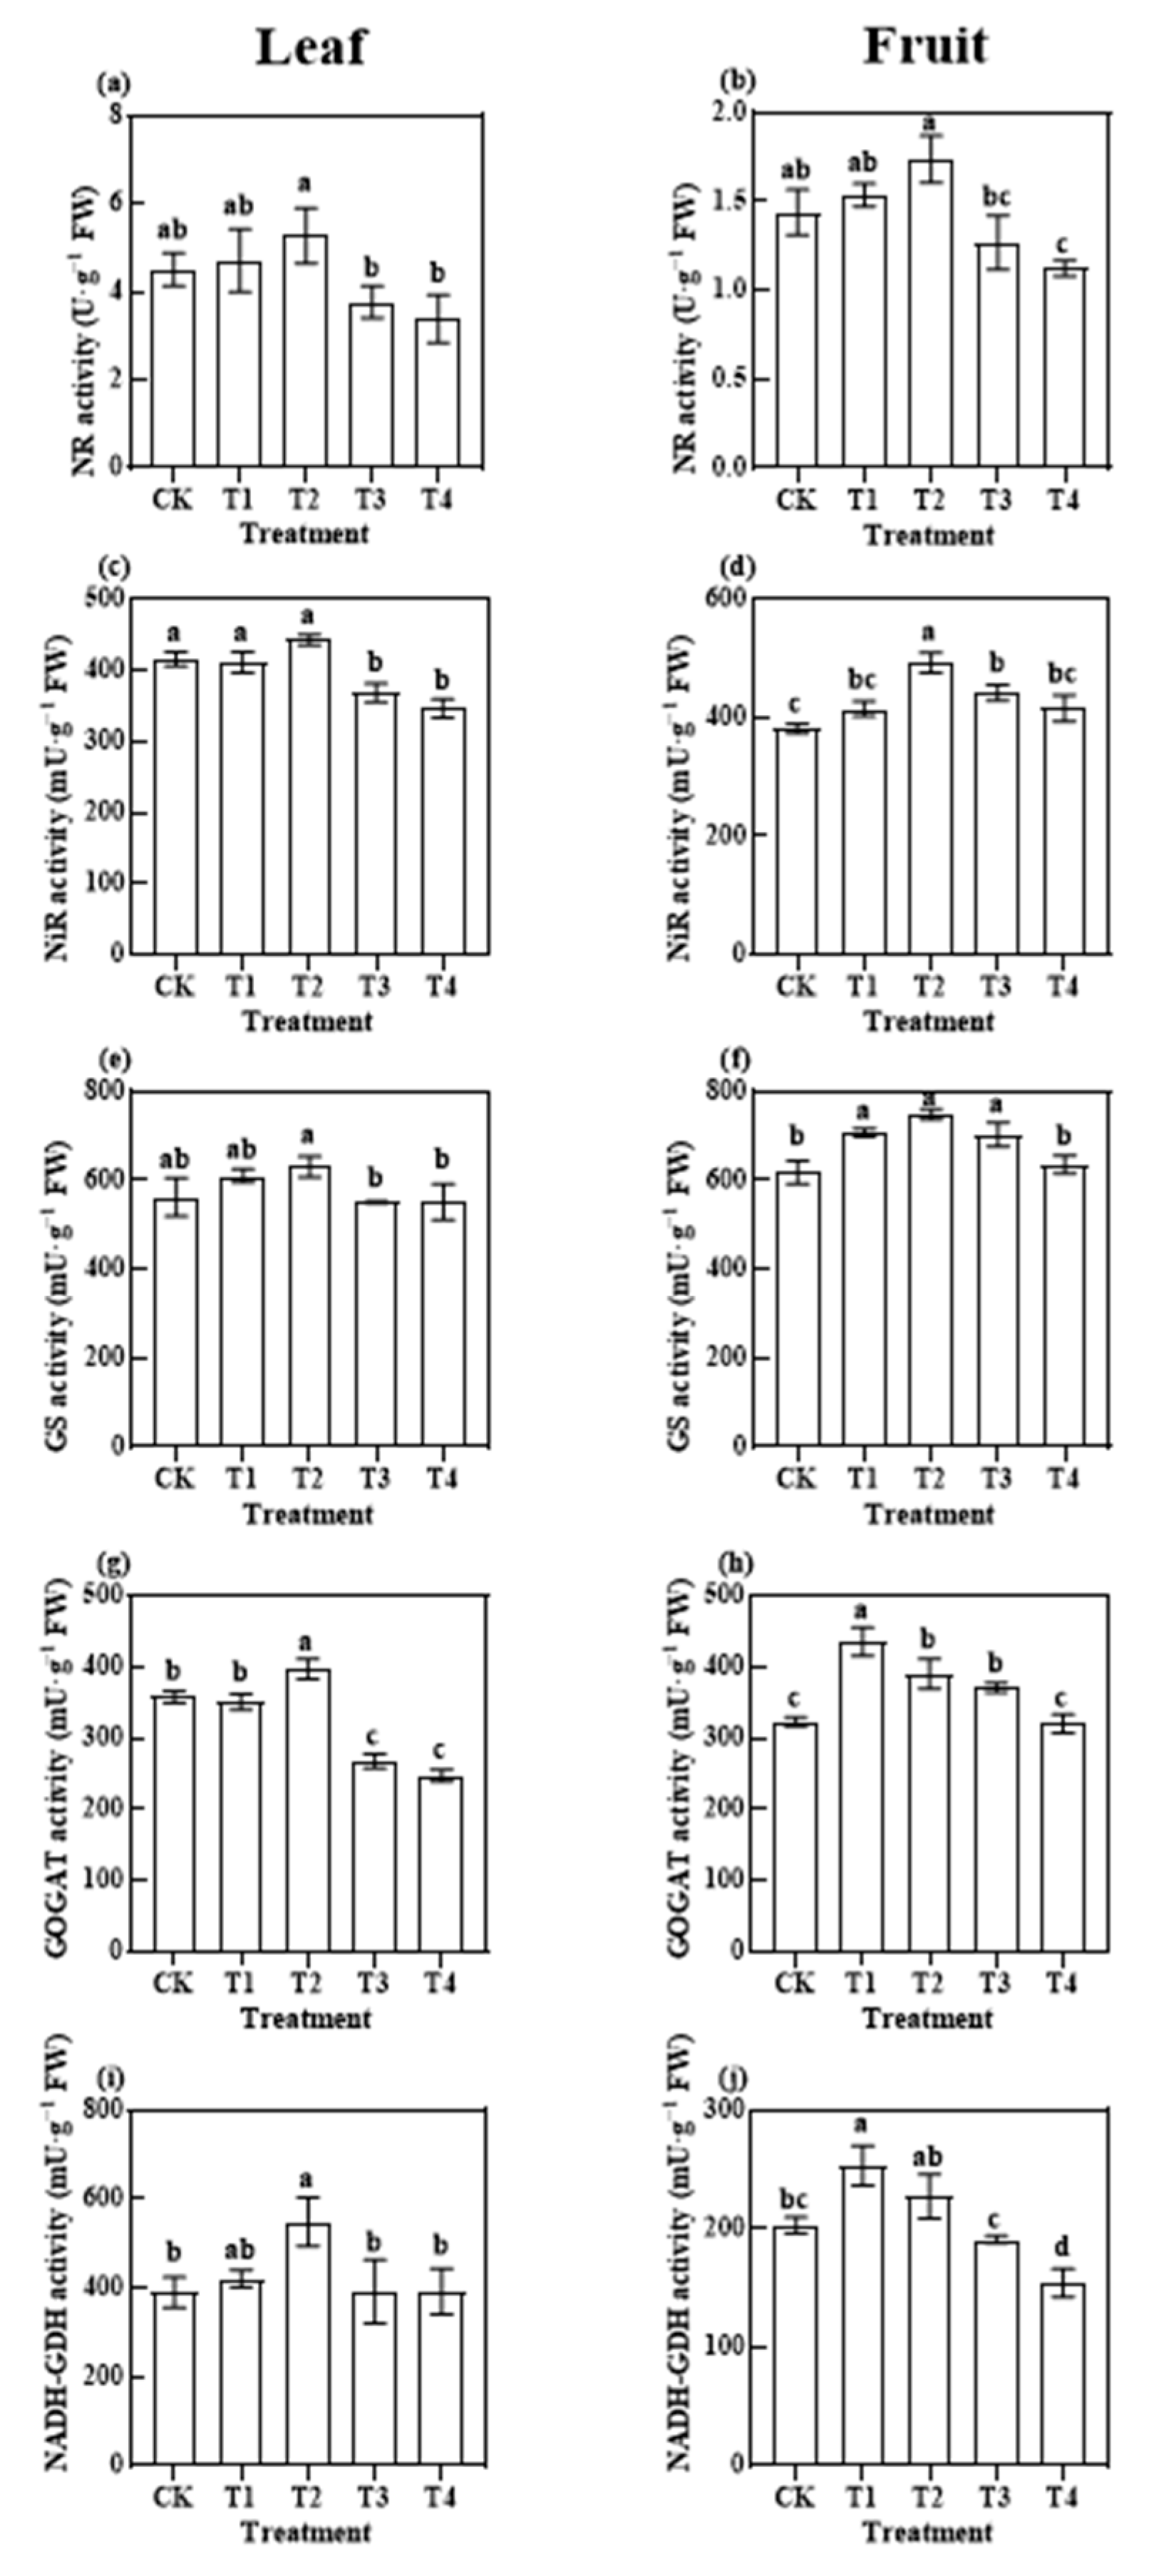
3.3.2. Photosynthetic N Metabolism-Related Enzymatic Activities
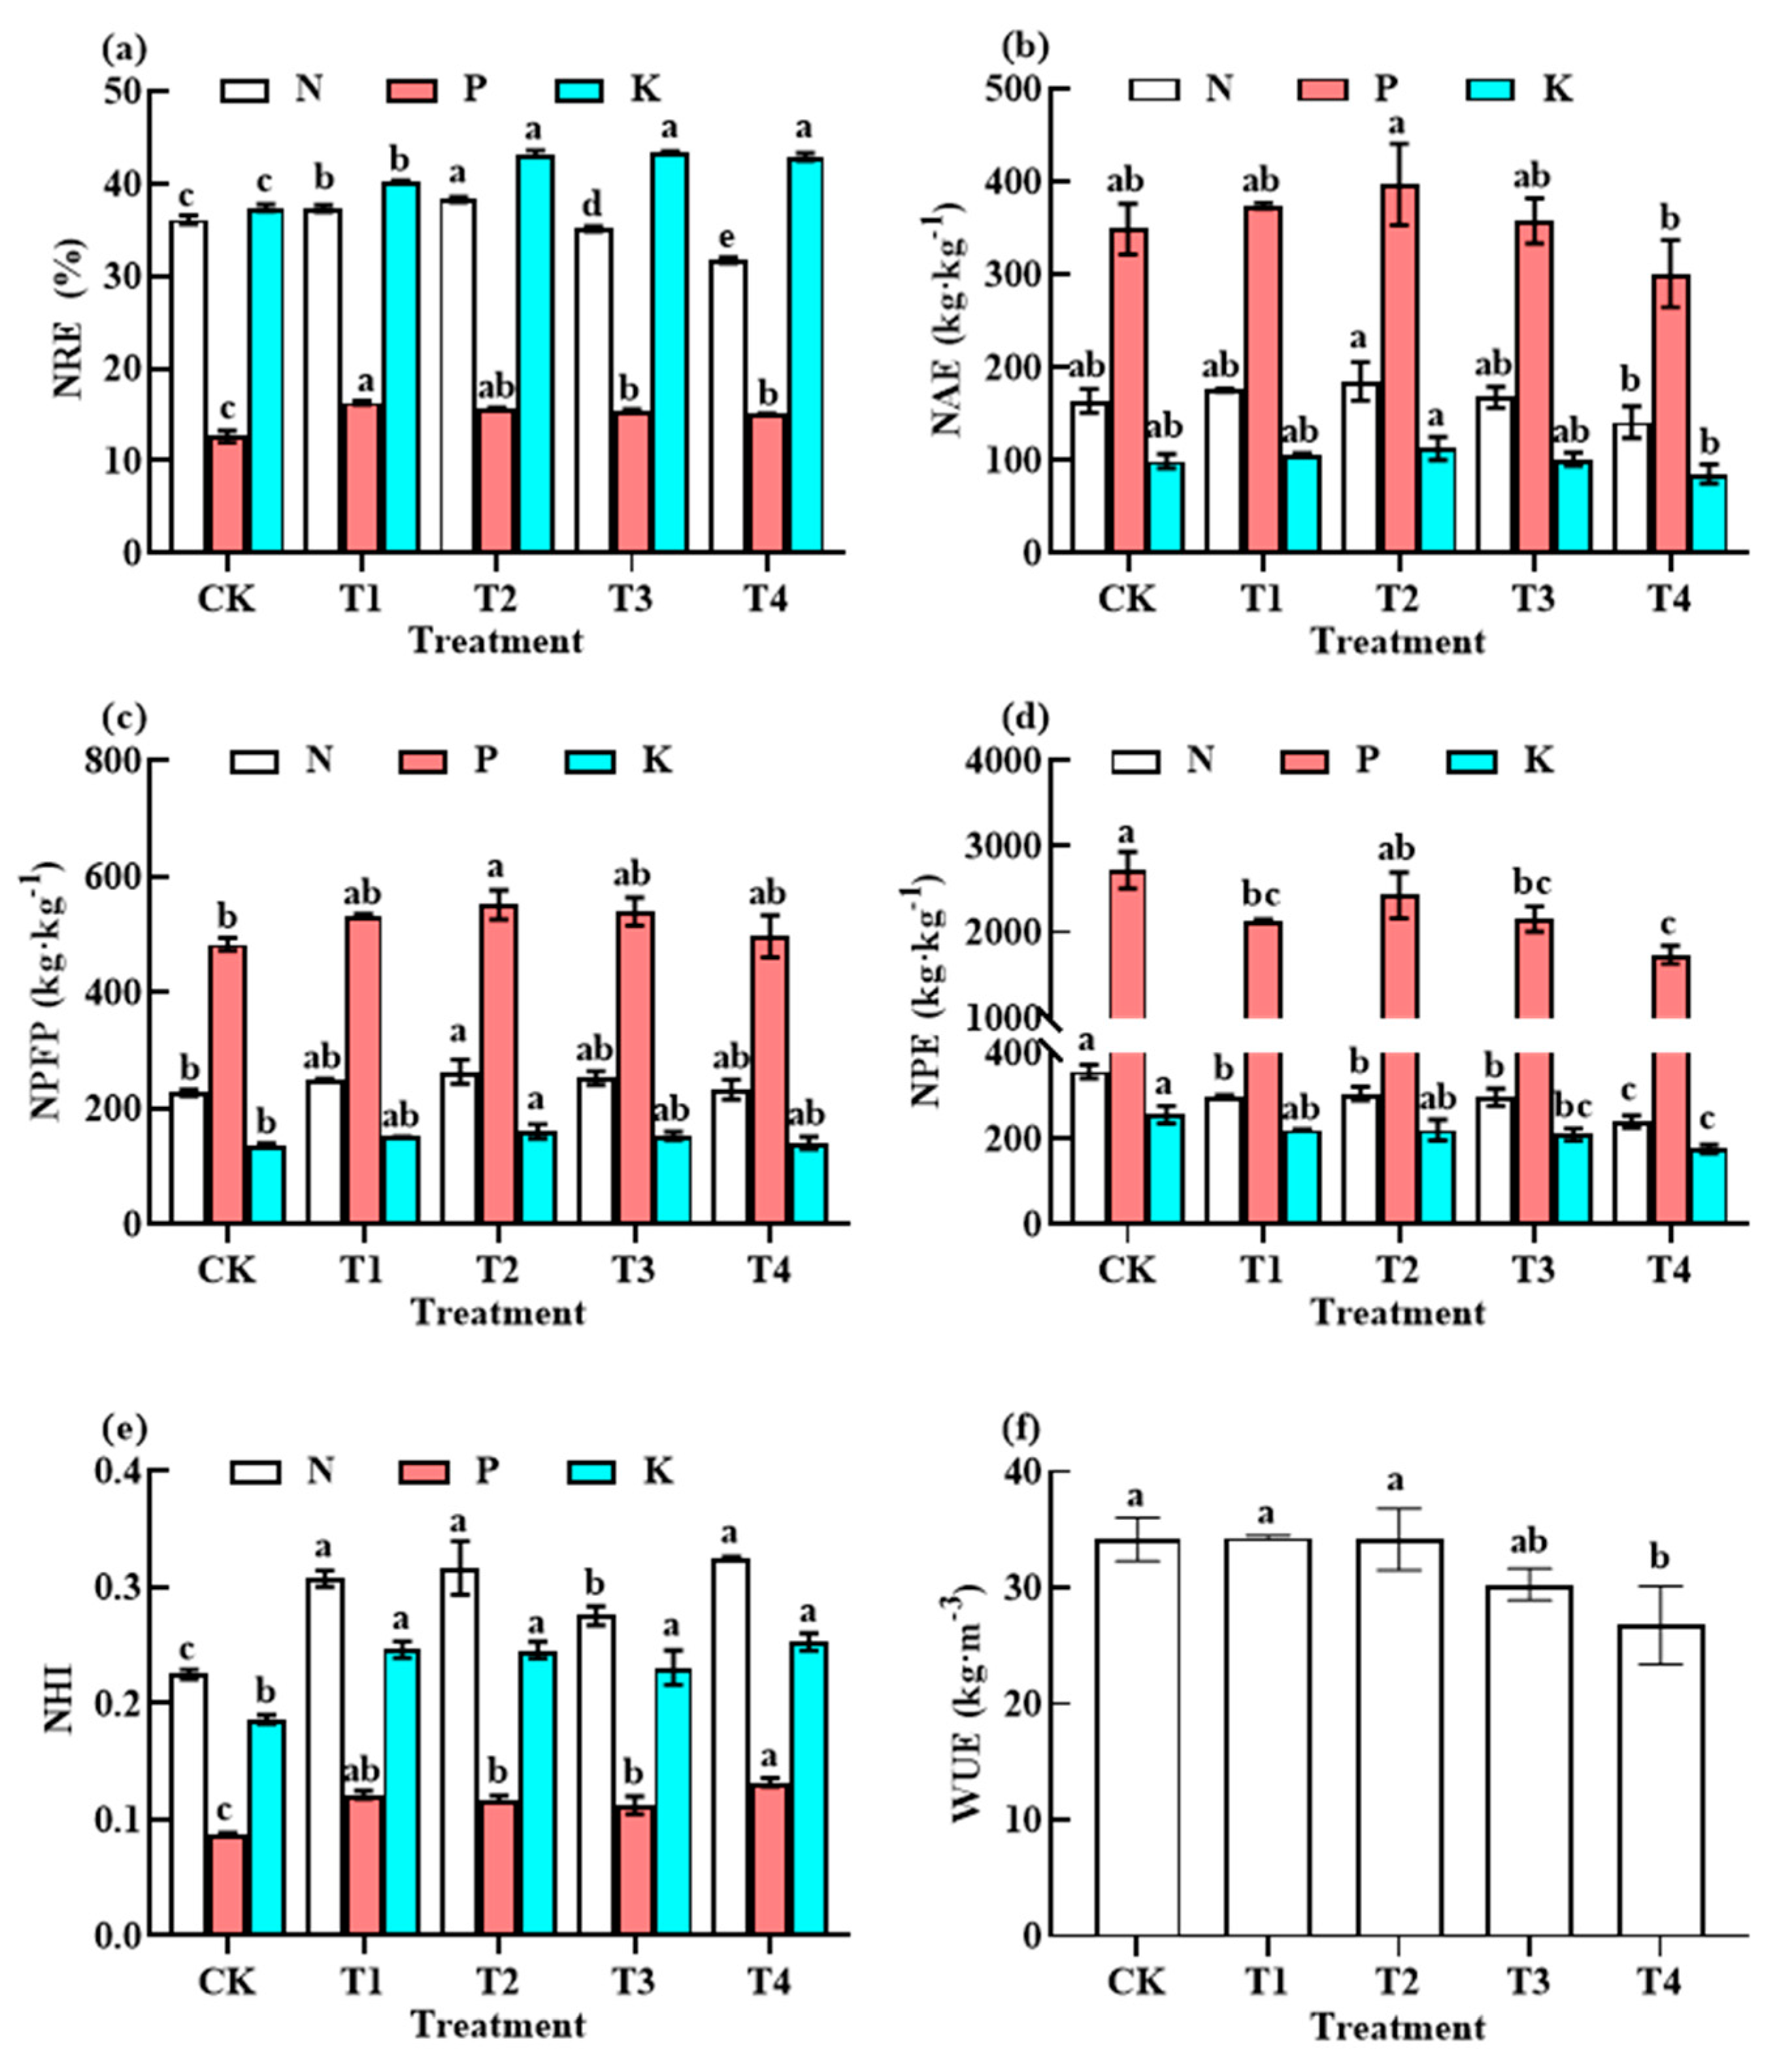
3.4. Responses of NUE and WUE to Fertiliser Reduction
3.5. Effects of Reducing Fertiliser Application before Harvest on Fruit Quality
3.5.1. Fruit Nutritional Quality
3.5.2. Fruit Flavour Compounds
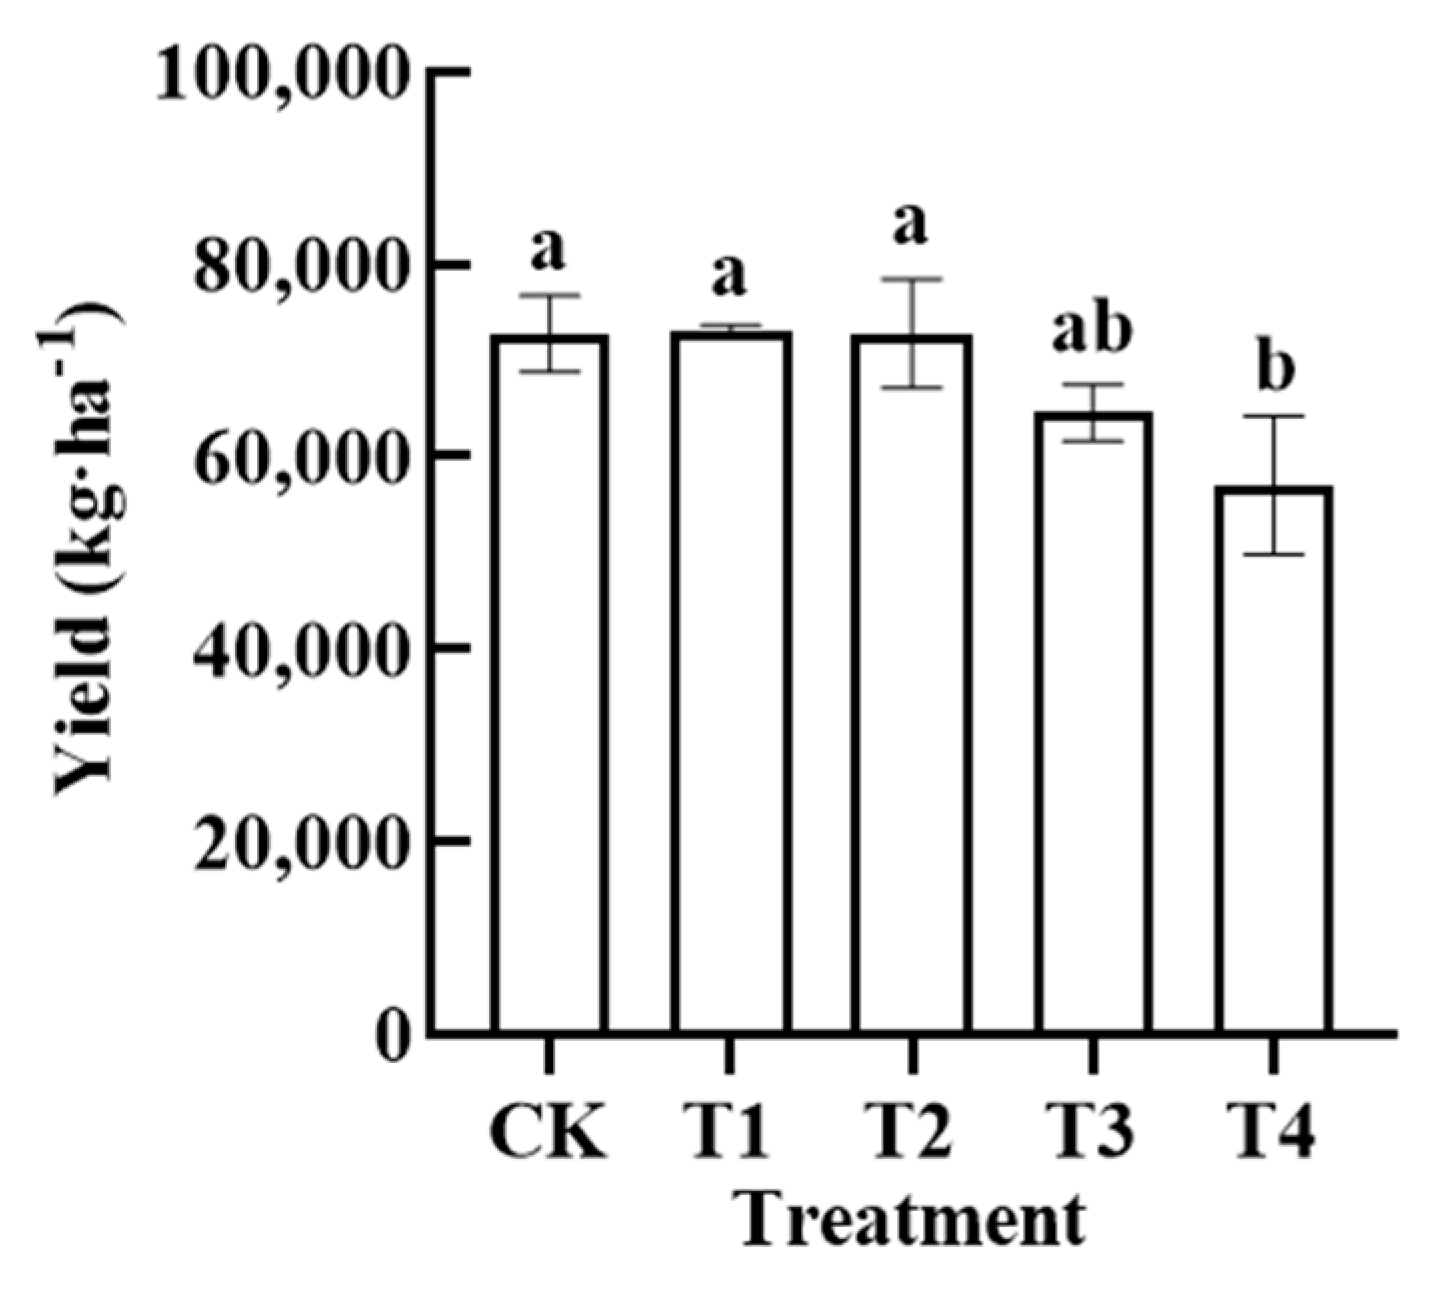
3.6. Effects of Reduced Fertiliser Application before Harvest on Pepper Yield
4. Discussion
4.1. Effects of Reduced Fertiliser Rate on Growth and Biomass before Harvest
4.2. Effects of Reduced Application of Different Fertiliser Rates on Photosynthetic Metabolism before Harvest
4.3. Effects of Reducing the Application of Different Fertiliser Rates before Harvesting on Nutrient Utilisation
4.4. Effects of Reducing the Application of Different Fertiliser Rates before Harvesting on Yield and Quality
5. Conclusions
Supplementary Materials
Author Contributions
Funding
Data Availability Statement
Conflicts of Interest
References
- Drabo, A. Climate change mitigation and agricultural development models: Primary commodity exports or local consumption production? Ecol. Econ. 2017, 137, 110–125. [Google Scholar] [CrossRef]
- Kim, S.; Meki, M.N.; Kim, S.; Kiniry, J.R. Crop modeling application to improve irrigation efficiency in year-round vegetable production in the texas winter garden region. Agronomy 2020, 10, 1525. [Google Scholar] [CrossRef]
- Paradikovic, N.; Vinkovic, T.; Vrcek, I.V.; Zuntar, I.; Bojic, M.; Medic-Saric, M. Effect of natural biostimulants on yield and nutritional quality: An example of sweet yellow pepper (Capsicum annuum L.) plants. J. Sci. Food Agric. 2011, 91, 2146–2152. [Google Scholar] [CrossRef]
- Bisbis, M.B.; Gruda, N.; Blanke, M. Potential impacts of climate change on vegetable production and product quality—A review. J. Clean. Prod. 2018, 170, 1602–1620. [Google Scholar] [CrossRef]
- Xin, X.; Man, Y.; Fu, L.L.; Ma, Z.Q.; Xing, Z. The botanical pesticide derived from Sophora flavescens for controlling insect pests can also improve growth and development of tomato plants. Ind. Crop. Prod. 2016, 92, 13–18. [Google Scholar] [CrossRef]
- Stoleru, V.; Inculet, S.C.; Mihalache, G.; Cojocaru, A.; Teliban, G.C.; Caruso, G. Yield and nutritional response of greenhouse grown tomato cultivars to sustainable fertilization and irrigation management. Plants 2020, 9, 1053. [Google Scholar] [CrossRef]
- Li, J.H.; Li, H.; Zhang, Q.; Shao, H.B.; Gao, C.H.; Zhang, X.Z. Effects of fertilization and straw return methods on the soil carbon pool and CO2 emission in a reclaimed mine spoil in Shanxi Province, China. Soil Tillage Res. 2019, 195, 104361. [Google Scholar] [CrossRef]
- Padilla, F.M.; Pena-Fleitas, M.T.; Fernandez, M.D.; del Moral, F.; Thompson, R.B.; Gallardo, M. Responses of soil properties, crop yield and root growth to improved irrigation and N fertilization, soil tillage and compost addition in a pepper crop. Sci. Hortic. 2017, 225, 422–430. [Google Scholar] [CrossRef]
- Ren, F.L.; Zhang, X.B.; Liu, J.; Sun, N.; Wu, L.H.; Li, Z.F.; Xu, M.G. A synthetic analysis of greenhouse gas emissions from manure amended agricultural soils in China. Sci. Rep. 2017, 7, 8123. [Google Scholar] [CrossRef]
- Soto, F.; Gallardo, M.; Thompson, R.B.; Pena-Fleitas, M.T.; Padilla, F.M. Consideration of total available N supply reduces N fertilizer requirement and potential for nitrate leaching loss in tomato production. Agric. Ecosyst. Environ. 2015, 200, 62–70. [Google Scholar] [CrossRef]
- Chen, Y.T.; Hu, S.Y.; Guo, Z.G.; Cui, T.H.; Zhang, L.P.; Lu, C.R.; Yu, Y.Q.; Luo, Z.B.; Fu, H.; Jin, Y. Effect of balanced nutrient fertilizer: A case study in Pinggu District, Beijing, China. Sci. Total Environ. 2021, 754, 142069. [Google Scholar] [CrossRef] [PubMed]
- Sallam, B.N.; Lu, T.; Yu, H.; Li, Q.; Sarfraz, Z.; Iqbal, M.S.; Khan, S.; Wang, H.; Liu, P.; Jiang, W. Productivity enhancement of cucumber (Cucumis sativus L.) through optimized use of poultry manure and mineral fertilizers under greenhouse cultivation. Horticulturae 2021, 7, 256. [Google Scholar] [CrossRef]
- Cole, J.C.; Smith, M.W.; Penn, C.J.; Cheary, B.S.; Conaghan, K.J. Nitrogen, phosphorus, calcium, and magnesium applied individually or as a slow release or controlled release fertilizer increase growth and yield and affect macronutrient and micronutrient concentration and content of field-grown tomato plants. Sci. Hortic. 2016, 211, 420–430. [Google Scholar] [CrossRef] [Green Version]
- Duncan, E.G.; O’Sullivan, C.A.; Roper, M.M.; Biggs, J.S.; Peoples, M.B. Influence of co-application of nitrogen with phosphorus, potassium and sulphur on the apparent efficiency of nitrogen fertiliser use, grain yield and protein content of wheat: Review. Field Crop. Res. 2018, 226, 56–65. [Google Scholar] [CrossRef]
- Spehia, R.S. Growth stage wise fertigation scheduling improves nutrient uptake, growth and yield of capsicum under protected conditions. J. Plant Nutr. 2021, 44, 898–904. [Google Scholar] [CrossRef]
- Ripoll, J.; Urban, L.; Staudt, M.; Lopez-Lauri, F.; Bidel, L.P.R.; Bertin, N. Water shortage and quality of fleshy fruits-making the most of the unavoidable. J. Exp. Bot. 2014, 65, 4097–4117. [Google Scholar] [CrossRef] [Green Version]
- Abu-Zahra, T.R. Influence of agricultural practices on fruit quality of bell pepper. Pak. J. Biol. Sci. 2011, 14, 876–881. [Google Scholar] [CrossRef] [Green Version]
- Thiele, R.; Mueller-Seitz, E.; Petz, M. Chili pepper fruits: Presumed precursors of fatty acids characteristic for capsaicinoids. J. Agric. Food Chem. 2008, 56, 4219–4224. [Google Scholar] [CrossRef]
- Liu, J.R.; Leatherwood, W.R.; Mattson, N.S. Irrigation method and fertilizer concentration differentially alter growth of vegetable transplants. Horttechnology 2012, 22, 56–63. [Google Scholar] [CrossRef]
- Liu, H.J.; Yang, H.Y.; Zheng, J.H.; Jia, D.D.; Wang, J.; Li, Y.; Huang, G.H. Irrigation scheduling strategies based on soil matric potential on yield and fruit quality of mulched-drip irrigated chili pepper in Northwest China. Agric. Water Manag. 2012, 115, 232–241. [Google Scholar] [CrossRef]
- Wang, H.; Xiang, Y.Z.; Zhang, F.C.; Tang, Z.J.; Guo, J.J.; Zhang, X.Y.; Hou, X.H.; Wang, H.D.; Cheng, M.H.; Li, Z.J. Responses of yield, quality and water-nitrogen use efficiency of greenhouse sweet pepper to different drip fertigation regimes in Northwest China. Agric. Water Manag. 2022, 260, 107279. [Google Scholar] [CrossRef]
- Yildirim, D.; Cemek, B.; Unlukara, A. The effect of mulched ridge and furrow micro catchment water harvesting on red pepper yield and quality features in Bafra Plain of Northern Turkey. Agric. Water Manag. 2022, 262, 107305. [Google Scholar] [CrossRef]
- Kraska, T.; Kleinschmidt, B.; Weinand, J.; Pude, R. Cascading use of Miscanthus as growing substrate in soilless cultivation of vegetables (tomatoes, cucumbers) and subsequent direct combustion. Sci. Hortic. 2018, 235, 205–213. [Google Scholar] [CrossRef]
- Iqbal, M.A.; Khan, M.A.; Azam, M.; Bhatti, M.I.N.; Feroze, M.A.; Zulfiqar, B.; Umar, H.; Asif, M. Seasonal fluctuations of N, P and K in leaves influenced nutrient requirement during fruit development stages in different olive genotypes. Braz. Arch. Biol. Technol. 2022, 65, e22210347. [Google Scholar] [CrossRef]
- Keller, M.; Arnink, K.J.; Hrazdina, G. Interaction of nitrogen availability during bloom and light intensity during veraison. I. Effects on grapevine growth, fruit development, and ripening. Am. J. Enol. Vitic. 1998, 49, 333–340. [Google Scholar] [CrossRef]
- He, Z.H.; Li, M.N.; Cai, Z.L.; Zhao, R.S.; Hong, T.T.; Yang, Z.; Zhang, Z. Optimal irrigation and fertilizer amounts based on multi-level fuzzy comprehensive evaluation of yield, growth and fruit quality on cherry tomato. Agric. Water Manag. 2021, 243, 106360. [Google Scholar] [CrossRef]
- Qu, F.; Jiang, J.J.; Xu, J.W.; Liu, T. Drip irrigation and fertilization improve yield, uptake of nitrogen, and water-nitrogen use efficiency in cucumbers grown in substrate bags. Plant Soil Environ. 2019, 65, 328–335. [Google Scholar] [CrossRef] [Green Version]
- Hu, X.H.; Gao, Z.X.; Ma, Y.B.; Xue, J.K.; Xie, Z.L.; Li, X.; Zhang, L.Y.; Wang, J.Z.; Ma, X.Q.; Qu, F.; et al. Coupling scheme of water and fertilizer based on yield, quality, use efficiency of water and fertilizer in bag pepper growing. Trans. Chin. Soc. Agric. Eng. 2020, 36, 81–89. (In Chinese) [Google Scholar] [CrossRef]
- Lakhiar, I.A.; Liu, X.D.; Wang, G.Q.; Gao, J.M. Experimental study of ultrasonic atomizer effects on values of EC and pH of nutrient solution. Int. J. Agric. Biol. Eng. 2018, 11, 59–64. [Google Scholar] [CrossRef]
- Du, Y.D.; Zhang, Q.; Cui, B.J.; Sun, J.; Wang, Z.; Ma, L.H.; Niu, W.Q. Aerated irrigation improves tomato yield and nitrogen use efficiency while reducing nitrogen application rate. Agric. Water Manag. 2020, 235, 106152. [Google Scholar] [CrossRef]
- Miller, G.L. Use of dinitrosalicylic acid reagent for determination of reducing sugar. Anal. Chem. 1959, 31, 426–428. [Google Scholar] [CrossRef]
- Matsuda, R.; Kubota, C. Variation of total soluble protein content in fruit among six greenhouse tomato cultivars. Hortscience 2010, 45, 1645–1648. [Google Scholar] [CrossRef] [Green Version]
- Bona, E.; Lingua, G.; Manassero, P.; Cantamessa, S.; Marsano, F.; Todeschini, V.; Copetta, A.; D’Agostino, G.; Massa, N.; Avidano, L.; et al. AM fungi and PGP pseudomonads increase flowering, fruit production, and vitamin content in strawberry grown at low nitrogen and phosphorus levels. Mycorrhiza 2015, 25, 181–193. [Google Scholar] [CrossRef] [PubMed]
- Monforte-Gonzalez, M.; Guzman-Antonio, A.; Uuh-Chim, F.; Vazquez-Flota, F. Capsaicin accumulation is related to nitrate content in placentas of habanero peppers (Capsicum chinense Jacq.). J. Sci. Food Agric. 2010, 90, 764–768. [Google Scholar] [CrossRef]
- Liu, H.; Fu, Y.M.; Hu, D.W.; Yu, J.; Liu, H. Effect of green, yellow and purple radiation on biomass, photosynthesis, morphology and soluble sugar content of leafy lettuce via spectral wavebands “knock out”. Sci. Hortic. 2018, 236, 10–17. [Google Scholar] [CrossRef]
- Zhang, L.; Fang, G.S.; Zheng, L.H.; Chen, Z.D.; Liu, X. Hypocholesterolemic effect of capsaicinoids in rats fed diets with or without cholesterol. J. Agric. Food Chem. 2013, 61, 4287–4293. [Google Scholar] [CrossRef]
- Du, Y.D.; Niu, W.Q.; Zhang, Q.; Cui, B.J.; Gu, X.B.; Guo, L.L.; Liang, B.H. Effects of nitrogen on soil microbial abundance, enzyme activity, and nitrogen use efficiency in greenhouse celery under aerated irrigation. Soil Sci. Soc. Am. J. 2018, 82, 606–613. [Google Scholar] [CrossRef] [Green Version]
- Du, Y.D.; Cao, H.X.; Liu, S.Q.; Gu, X.B.; Cao, Y.X. Response of yield, quality, water and nitrogen use efficiency of tomato to different levels of water and nitrogen under drip irrigation in Northwestern China. J. Integr. Agric. 2017, 16, 1153–1161. [Google Scholar] [CrossRef] [Green Version]
- Ullah, S.; Anwar, S.; Rehman, M.; Khan, S.; Zafar, S.; Liu, L.J.; Peng, D.X. Interactive effect of gibberellic acid and NPK fertilizer combinations on ramie yield and bast fibre quality. Sci. Rep. 2017, 7, 10647. [Google Scholar] [CrossRef] [Green Version]
- Challa, H.; Heuvelink, E. Photosynthesis driven crop growth models for green house cultivation: Advances and bottlenecks. Acta Hortic. 1996, 417, 9–22. [Google Scholar] [CrossRef]
- Reynolds, M.; Foulkes, J.; Furbank, R.; Griffiths, S.; King, J.; Murchie, E.; Parry, M.; Slafer, G. Achieving yield gains in wheat. Plant Cell Environ. 2012, 35, 1799–1823. [Google Scholar] [CrossRef] [PubMed]
- Nowicka, B.; Ciura, J.; Szymanska, R.; Kruk, J. Improving photosynthesis, plant productivity and abiotic stress tolerance—Current trends and future perspectives. J. Plant Physiol. 2018, 231, 415–433. [Google Scholar] [CrossRef] [PubMed]
- Arnon, D.I. Ferredoxin and photosynthesis. Science 1965, 149, 1460–1470. [Google Scholar] [CrossRef]
- Busch, F.A.; Sage, R.F.; Farquhar, G.D. Plants increase CO2 uptake by assimilating nitrogen via the photorespiratory pathway. Nat. Plants 2018, 4, 46–54. [Google Scholar] [CrossRef]
- Tcherkez, G.; Boex-Fontvieille, E.; Mahe, A.; Hodges, M. Respiratory carbon fluxes in leaves. Curr. Opin. Plant Biol. 2012, 15, 308–314. [Google Scholar] [CrossRef] [PubMed]
- Romero, J.M.; Lara, C.; Guerrero, M.G. Dependence of nitrate utilization upon active CO2 fixation in anacystis nidulans: A regulatory aspect of the interaction between photosynthetic carbon and nitrogen metabolism. Arch. Biochem. Biophys. 1985, 237, 396–401. [Google Scholar] [CrossRef] [PubMed]
- Horchani, F.; Hajri, R.; Aschi-Smiti, S. Effect of ammonium or nitrate nutrition on photosynthesis, growth, and nitrogen assimilation in tomato plants. J. Plant Nutr. Soil Sci. 2010, 173, 610–617. [Google Scholar] [CrossRef]
- Du, X.B.; Chen, B.L.; Zhang, Y.X.; Zhao, W.Q.; Shen, T.Y.; Zhou, Z.G.; Meng, Y.L. Nitrogen use efficiency of cotton (Gossypium hirsutum L.) as influenced by wheat-cotton cropping systems. Eur. J. Agron. 2016, 75, 72–79. [Google Scholar] [CrossRef]
- Li, G.H.; Hu, Q.Q.; Shi, Y.G.; Cui, K.H.; Nie, L.X.; Huang, J.L.; Peng, S.B. Low nitrogen application enhances starch-metabolizing enzyme activity and improves accumulation and translocation of non-structural carbohydrates in rice stems. Front. Plant Sci. 2018, 9, 1128. [Google Scholar] [CrossRef]
- Xu, X.X.; Du, X.; Wang, F.; Sha, J.C.; Chen, Q.; Tian, G.; Zhu, Z.L.; Ge, S.F.; Jiang, Y.M. Effects of potassium levels on plant growth, accumulation and distribution of carbon, and nitrate metabolism in apple dwarf rootstock seedlings. Front. Plant Sci. 2020, 11, 904. [Google Scholar] [CrossRef]
- Ren, X.D.; Zhang, J.J. Research progresses on the key enzymes involved in sucrose metabolism in maize. Carbohydr. Res. 2013, 368, 29–34. [Google Scholar] [CrossRef] [PubMed]
- Champigny, M.L. Integration of photosynthetic carbon and nitrogen metabolism in higher plants. Photosynth. Res. 1995, 46, 117–127. [Google Scholar] [CrossRef] [PubMed]
- Sturm, A.; Tang, G.Q. The sucrose-cleaving enzymes of plants are crucial for development, growth and carbon partitioning. Trends Plant Sci. 1999, 4, 401–407. [Google Scholar] [CrossRef]
- Tang, G.Q.; Luscher, M.; Sturm, A. Antisense repression of vacuolar and cell wall invertase in transgenic carrot alters early plant development and sucrose partitioning. Plant Cell 1999, 11, 177–189. [Google Scholar] [CrossRef] [Green Version]
- Shen, L.B.; Yao, Y.; He, H.; Qin, Y.L.; Liu, Z.J.; Liu, W.X.; Qi, Z.Q.; Yang, L.J.; Cao, Z.M.; Yang, Y. Genome-wide identification, expression, and functional analysis of the alkaline/neutral invertase gene family in pepper. Int. J. Mol. Sci. 2018, 19, 224. [Google Scholar] [CrossRef] [Green Version]
- Yelle, S.; Chetelat, R.T.; Dorais, M.; Deverna, J.W.; Bennett, A.B. Sink metabolism in tomato fruit: IV. Genetic and biochemical analysis of sucrose accumulation. Plant Physiol. 1991, 95, 1026–1035. [Google Scholar] [CrossRef] [Green Version]
- Ranwala, A.P.; Iwanami, S.S.; Masuda, H. Acid and neutral invertases in the mesocarp of developing muskmelon (Cucumis melo L. cv Prince) fruit. Plant Physiol. 1991, 96, 881–886. [Google Scholar] [CrossRef] [Green Version]
- Wang, X.; Chen, Y.; Jiang, S.; Xu, F.; Wang, H.; Wei, Y.; Shao, X. PpINH1, an invertase inhibitor, interacts with vacuolar invertase PpVIN2 in regulating the chilling tolerance of peach fruit. Hortic. Res. 2020, 7, 168. [Google Scholar] [CrossRef]
- Borsani, J.; Budde, C.O.; Porrini, L.; Lauxmann, M.A.; Lombardo, V.A.; Murray, R.; Andreo, C.S.; Drincovich, M.F.; Lara, M.V. Carbon metabolism of peach fruit after harvest: Changes in enzymes involved in organic acid and sugar level modifications. J. Exp. Bot. 2009, 60, 1823–1837. [Google Scholar] [CrossRef] [Green Version]
- Abe, S.S.; Hashimoto, S.; Umezane, T.; Yamaguchi, T.; Yamamoto, S.; Yamada, S.; Endo, T.; Nakata, N. Excessive application of farmyard manure reduces rice yield and enhances environmental pollution risk in paddy fields. Arch. Agron. Soil Sci. 2016, 62, 1208–1221. [Google Scholar] [CrossRef]
- Virk, H.K.; Singh, G.; Manes, G.S. Nutrient uptake, nitrogen use efficiencies, and energy indices in soybean under various tillage systems with crop residue and nitrogen levels after combine harvested wheat. J. Plant Nutr. 2020, 43, 407–417. [Google Scholar] [CrossRef]
- Nurzynska-Wierdak, R. Sweet basil essential oil composition: Relationship between cultivar, foliar feeding with nitrogen and oil content. J. Essent. Oil Res. 2012, 24, 217–227. [Google Scholar] [CrossRef]
- Nurzynska-Wierdak, R. Does mineral fertilization modify essential oil content and chemical composition in medicinal plants? Acta Sci. Pol.-Hortorum Cultus 2013, 12, 3–16. [Google Scholar] [CrossRef]


| Treatment | First Three Harvesting Periods (Each Plant Every Time) | Last Three Harvesting Periods (Each Plant Every Time) | ||
|---|---|---|---|---|
| 15–7 Days before Each Harvest | 6–0 Days before Each Harvest | 15–7 Days before Each Harvest | 6–0 Days before Each Harvest | |
| CK | 500 mL | 500 mL | 1000 mL | 1000 mL |
| T1 | 400 mL | 800 mL | ||
| T2 | 300 mL | 600 mL | ||
| T3 | 200 mL | 400 mL | ||
| T4 | 100 mL | 200 mL | ||
| Treatment | Vitamin C (mg·g−1) | Soluble Protein (μg·g−1) | Free Amino Acids (μg·g−1) | Soluble Sugar (%) | Reducing Sugar (%) | Capsaicin (μg·g−1) | Nitrate (μg·g−1) |
|---|---|---|---|---|---|---|---|
| CK | 1.87 ± 0.01 c | 659.70 ± 7.59 a | 336.44 ± 14.09 ab | 8.15 ± 0.55 ab | 3.69 ± 0.13 abc | 33.65 ± 0.83 b | 235.58 ± 6.22 a |
| T1 | 2.16 ± 0.08 b | 663.16 ± 13.25 a | 339.62 ± 9.83 ab | 9.21 ± 0.15 a | 4.12 ± 0.10 ab | 39.31 ± 0.42 a | 204.28 ± 8.24 ab |
| T2 | 2.42 ± 0.02 a | 641.00 ± 10.11 a | 379.72 ± 8.75 a | 8.53 ± 0.61 ab | 4.39 ± 0.33 a | 39.86 ± 1.09 a | 185.43 ± 6.51 bc |
| T3 | 1.64 ± 0.01 d | 558.61 ± 13.05 b | 303.28 ± 16.29 bc | 6.86 ± 0.67 ab | 3.32 ± 0.31 bc | 26.12 ± 1.12 c | 162.68 ± 5.35 cd |
| T4 | 1.53 ± 0.04 d | 553.20 ± 13.04 b | 261.75 ± 14.39 c | 6.17 ± 0.42 b | 3.00 ± 0.02 c | 18.92 ± 0.88 d | 149.42 ± 7.23 d |
| Aromatic Content (μg·kg−1) | Treatment | ||||
|---|---|---|---|---|---|
| CK | T1 | T2 | T3 | T4 | |
| 3-Pentanone | 39.14 ± 5.00 a | 36.34 ± 1.45 a | 15.74 ± 1.13 b | ND | ND |
| 2-Hexenal | 5086.10 ± 253.62 b | 8196.24 ± 407.08 a | 7276.33 ± 288.93 a | 3313.78 ± 4.37 c | 2768.89 ± 228.06 c |
| Hexyl alcohol | 2467.36 ± 144.46 a | 3164.41 ± 177.75 a | 3181.07 ± 462.69 a | 1152.88 ± 3.07 b | 1240.03 ± 55.70 b |
| 2-Pentylfuran | 145.56 ± 11.78 a | 53.39 ± 4.20 bc | 69.85 ± 6.78 b | 28.41 ± 0.04 c | ND |
| 1,3,6-Octatriene, 3, 7-dimethyl- | 545.72 ± 4.41 b | 779.97 ± 3.93 a | 428.00 ± 23.31 c | 274.46 ± 0.36 d | 118.03 ± 3.90 e |
| Propanoic acid, 2-methyl-, 4-methylpentyl ester | 51.05 ± 2.06 a | 51.45 ± 3.84 a | 11.15 ± 1.46 b | 10.67 ± 0.01 b | 19.99 ± 0.24 b |
| Total | 8334.93 ± 85.91 b | 12281.80 ± 242.74 a | 10982.15 ± 779.11 a | 4780.20 ± 6.85 c | 4146.94 ± 207.15 c |
Publisher’s Note: MDPI stays neutral with regard to jurisdictional claims in published maps and institutional affiliations. |
© 2022 by the authors. Licensee MDPI, Basel, Switzerland. This article is an open access article distributed under the terms and conditions of the Creative Commons Attribution (CC BY) license (https://creativecommons.org/licenses/by/4.0/).
Share and Cite
Wang, J.; Gao, Z.; Sun, T.; Huang, W.; Jia, Y.; Li, X.; Zhang, Z.; Hu, X. Preharvest Reduction in Nutrient Solution Supply of Pepper (Capsicum annuum L.) Contributes to Improve Fruit Quality and Fertilizer Efficiency While Stabilising Yields. Agronomy 2022, 12, 3004. https://doi.org/10.3390/agronomy12123004
Wang J, Gao Z, Sun T, Huang W, Jia Y, Li X, Zhang Z, Hu X. Preharvest Reduction in Nutrient Solution Supply of Pepper (Capsicum annuum L.) Contributes to Improve Fruit Quality and Fertilizer Efficiency While Stabilising Yields. Agronomy. 2022; 12(12):3004. https://doi.org/10.3390/agronomy12123004
Chicago/Turabian StyleWang, Junzheng, Zixing Gao, Tao Sun, Wenxian Huang, Yuanjie Jia, Xiaojing Li, Zhi Zhang, and Xiaohui Hu. 2022. "Preharvest Reduction in Nutrient Solution Supply of Pepper (Capsicum annuum L.) Contributes to Improve Fruit Quality and Fertilizer Efficiency While Stabilising Yields" Agronomy 12, no. 12: 3004. https://doi.org/10.3390/agronomy12123004