1. Introduction
The extensive use of herbicides in agriculture has promoted the rapid development of weed resistance to herbicides, which constitutes an important global issue [
1]. Acetyl-coenzyme A carboxylase (ACCase) herbicide resistance has been reported in 50 weed species, particularly in areas where ACCase herbicides have often been extensively applied without rotation [
2].
Both target-site resistance (TSR) and non-target-site-based resistance (NTSR) to ACCase herbicides are involved in weeds [
3]. TSR is essentially caused by single amino acid changes in the carboxyltransferase domain and impacts the effectiveness of the binding of ACCase herbicides [
4,
5]. NTSR is achieved by mechanisms that reduce the concentration of the herbicide reaching the target site [
6]. NTSR also plays a major role in resistance to grass-specific herbicides that inhibit ACCase, which is the third most common herbicide mode of action globally [
7].
One of the essential NTSR mechanisms is associated with enhanced herbicide metabolism rates, often involving cytochrome P450 monooxygenase (CytP450), ATP-binding cassette (ABC) transporters, glutathione S-transferase (GST), glycosyltransferase (GT), and peroxidase (POD) [
8,
9,
10,
11]. Unlike TSR, NTSR has many unknown mechanisms of action that need to be explored, as some mechanisms may enable weeds to become resistant to those herbicides which are not yet commercially marketed [
6,
11].
The level of resistance provided by NTSR has, in certain circumstances, even surpassed that of the most common target-site mechanisms, as NTSR was found to be a significantly greater contributor to resistance towards the ACCase herbicide clodinafop-propargyl and the phenylpyrazoline herbicide pinoxaden than TSR mutations at position 1781 [
12]. In addition, the herbicide mixtures and rotations strategies are less effective on NTSR metabolic resistance [
11]. NTSR is, therefore, more detrimental to efficient weed management. The advancement of genomic tools has generated useful genetic information that allows for the improvement of weed management strategies [
13]. Genomic characterization may help elucidate the molecular mechanisms of NTSR employed by various plants as well as the evolution of these mechanisms [
14]. Comparative transcriptome analysis, as one genomics tool, has been widely used to identify genes that are differentially expressed in a variety of cultivars, tissues, or treatment conditions [
15].
Asia minor bluegrass (
Polypogon fugax) is a common weed in winter crop fields (as wheat and oilseed rape) across China and greatly reduces the yield and quality of these crops [
16]. We previously reported that populations of
P. fugax resistant to clodinafop-propargyl possess a mutation of Ile
2041 to Asn and that this TSR mutation conferred resistance to ACCase herbicides [
17]. Nevertheless, Cyt P450s may play an important concurrent role in clodinafop-propargyl resistance because the Cyt P450 inhibitor, malathion, is able to significantly reduce GR
50 values [
18].
Numerous studies on weed resistance have concentrated on the seedling stage, and the expression of NTSR genes after seedling application at different times has been well studied [
19,
20,
21]. As in the fenoxaprop-P-ethyl-resistant
P. fugax population, which preliminarily characterized its TSR and NTSR mechanisms [
22], nine up-regulated expressions of P450 genes were found in the resistant plants after treatment [
23]. However, labor shortages in China’s farmlands over the past 10 years have resulted in untimely weed control that, in some instances, has allowed the weeds to reach the tillering stage before herbicide is applied. This is undesirable because effective weed control at this later period is more difficult. It is, therefore, necessary that studies on weed resistance focus on both the seedling and tillering stages.
In this study, we investigated NTSR gene expression under both treatment with and without clodinafop-propargyl, at the seedling or tillering stages, respectively, including pre-treatment with Cyt P450 inhibitor malathion. Both RNA-Seq transcriptome analysis and quantitative real-time (qRT)-PCR experiments were conducted to identify and validate the specific genes involved in NTSR towards clodinafop-propargyl in the P. fugax resistant population, particularly during the tillering stage. It will be easier to comprehend why older weeds are more challenging to control if we investigate the difference expression of NTSR genes between the seedling stage and tillering stage in P. fugax.
2. Materials and Methods
2.1. Plant Materials and Growth Condition
Seeds of the clodinafop-propargyl resistant population (referred to as R) and the susceptible population (referred to as S) of
P. fugax were characterized in our previous studies [
17]. Controlled pairings were used to create genetically homogenized plant material, since variations in gene expression can be caused by variations in the genetic background of plants. The method of obtaining the F1 generation and the pseudo-F2 generation was as described in the previous work [
24]. The pseudo-F2 generation was thus used to evaluate the synergistic effects of the Cyt P450 inhibitor and for the transcriptome sequencing. The seeds were placed on the Agar medium (0.6%), and, after their germination (about 10 days), 12 seedlings were transplanted into pots and grown in a glasshouse of Anhui Academy of Agricultural Sciences under natural sunlight (20/10 °C day/night).
2.2. Dose Response of Clodinafop-Propargyl in the Presence and Absence of Malathion
Clodinafop-propargyl application rates of 0, 0.1875, 0.75, 3, 12, 48, 192, and 768 g.a.i./ha were used to treat the S plants and R plants (10 seedlings/pot), respectively, at the seedling stage. An hour before that, half of the samples were pretreated with malathion (1000 g.a.i./ha). Herbicide was applied using a 3WP-2000 walking spray tower (Zhongnongjidian, Nanjing Institute of Agricultural Mechanization, Ministry of Agriculture and Rural Affairs, Nanjing, China) equipped with a 390 mL min−1 flow nozzle at a pressure of 3.0 kg cm−2. Control plants were treated with water. After 21 days, the aboveground parts were dried at 70 °C for 48 h. The experiment was conducted with three replications per herbicide dose, and the data used the nonlinear curve for analysis by SigmaPlot software (SigmaPlot v.14.0, Systat Software, Inc., San Jose, CA, USA).
2.3. Sample Collection for Transcriptome Sequencing
Twelve plants from each of the R and S populations at the seedling stage (3–4 leaf) were selected, and six from each group were treated with clodinafop-propargyl (48 g.a.i./ha), while the remainder were treated with water as a control. Seventy-two hours after application, the aerial parts of the R and S groups were collected, and three replicates of each sample were immediately cryopreserved in liquid nitrogen. The plants were subsequently sampled during the tillering stage (four tillers) in the same manner. All samples (24 in total) were stored at −80 °C until analysis.
2.4. RNA Isolation, Sequence Data Processing, and De Novo Assembly
TRIzol (Invitrogen Inc., Carlsbad, CA, USA) and DNase I (Takara, Otsu, Japan) were used to extract the total RNAs of the 24 samples. The cDNA library construction and the Illumina sequencing were both performed by The Beijing Genomics Institute (BGI, Beijing, China). In order to obtain high-quality clean reads for the de novo assembly, the raw reads generated from the transcriptome sequencing were filtered using the following steps: (I) adaptor sequences were removed, (II) reads with more than 5% unknown nucleotides were removed, and (III) reads with more than 50% low-quality bases (base quality ≤ 20) were discarded. The remaining clean reads were assembled into unique genes using Trinity software with an optimized K-mer length of 25 for the de novo assembly. Reads per kb per million reads (RPKM, ≥0.5), a common technique for assessing gene expression from RNA sequencing data by normalizing for total read length and the amount of sequencing reads, was used to determine the expression of distinct genes [
25].
2.5. Differential Gene Expression and Enrichment Analysis
Differentially expressed genes (DEGs) in the R and S groups were subjected to Gene Ontology (GO) functional analysis and Kyoto Encyclopedia of Genes and Genomes (KEGG) pathway analysis. Gene expression levels were calculated using the fragments per kilobase per million fragments (FPKM) method [
26]. Q-value < 0.05 and|log2 (fold change)| > 1 were used as the threshold for significantly differential expression. All the DEGs were enriched to the GO and KEGG database by GOseq and KOBAS software [
27,
28]. The significant enriched GO terms and KEGG pathways were filtered by padj value < 0.05.
2.6. qRT-PCR Validation
Malathion at 1000 g.a.i./ha was applied 1 h prior to the application of clodinafop-propargyl (48 g.a.i./ha) at the seedling stage and tillering stage of the R and S population, separately. Seventy-two hours after application, the aerial parts of the R and S population were selected, and three replicates of each sample were immediately cryopreserved in liquid nitrogen.
Total RNA was extracted as described above, and cDNA was synthesized using the M-MLV Rtase kit (Thermo Fisher Scientific, Waltham, MA, USA), according to the manufacturer’s instructions. The qRT-PCR mix (25 µL) contained 12.5 µL of SYBR Green Mix (Thermo Fisher Scientific, Waltham, MA, USA), 0.5 µL of each primer (10 µM), 2 µL of cDNA, and 9.5 µL of RNase-free water. The reaction was performed on an ABI 7300 real-time PCR system (Applied Biosystems, Foster City, CA, USA). The qRT-PCR program began with 10 min at 95 °C, followed by 40 cycles of 95 °C for 15 s and 60 °C for 45 s, and with a final extension of 60 °C for 15 s.
EF1 was used as the reference gene for normalization. GraphPad Prism 5 software (GraphPad Software, Inc., La Jolla, CA, USA) was used for data analysis. Expression was calculated as 2
−ΔΔCt. Each experiment was repeated at least three times with three replicates. Primer sequences are listed in
Supplemental Table S1. In order to enhance data reliability, significant differences in the expression levels were analyzed using Student’s
t-test (
p < 0.05).
2.7. Gene Cloning, Plasmid Construction, and Arabidopsis Transformation
The open reading frame (ORF) of the candidate sequences was predicted using the ORF finder software (
https://www.ncbi.nlm.nih.gov/orffinder/, accessed on 20 May 2021), and the full-length ORF was cloned using the primers listed in
Supplementary Table S2. Following ligation into the vector
pCAMBIA1303-35S:35ST, these amplified full-length cDNA were introduced into wild-type Arabidopsis plants (
Col) through the floral dipping technique mediated by Agrobacterium tumefaciens strain GV3101, as previously described [
29]. When they had three to four rosette leaves, the transgenic plants of T1 generation were sprayed with different concentrations of Mesosulfuron-methyl (0.3125, 0.625, 1.25, 2.5, 5.0, and 10.0 mg/mL), whereas the wild-type (WT) plants were sprayed with the lower concentrations for comparison.
3. Results
3.1. Synergistic Effect of Clodinafop-Propargyl and Malathion
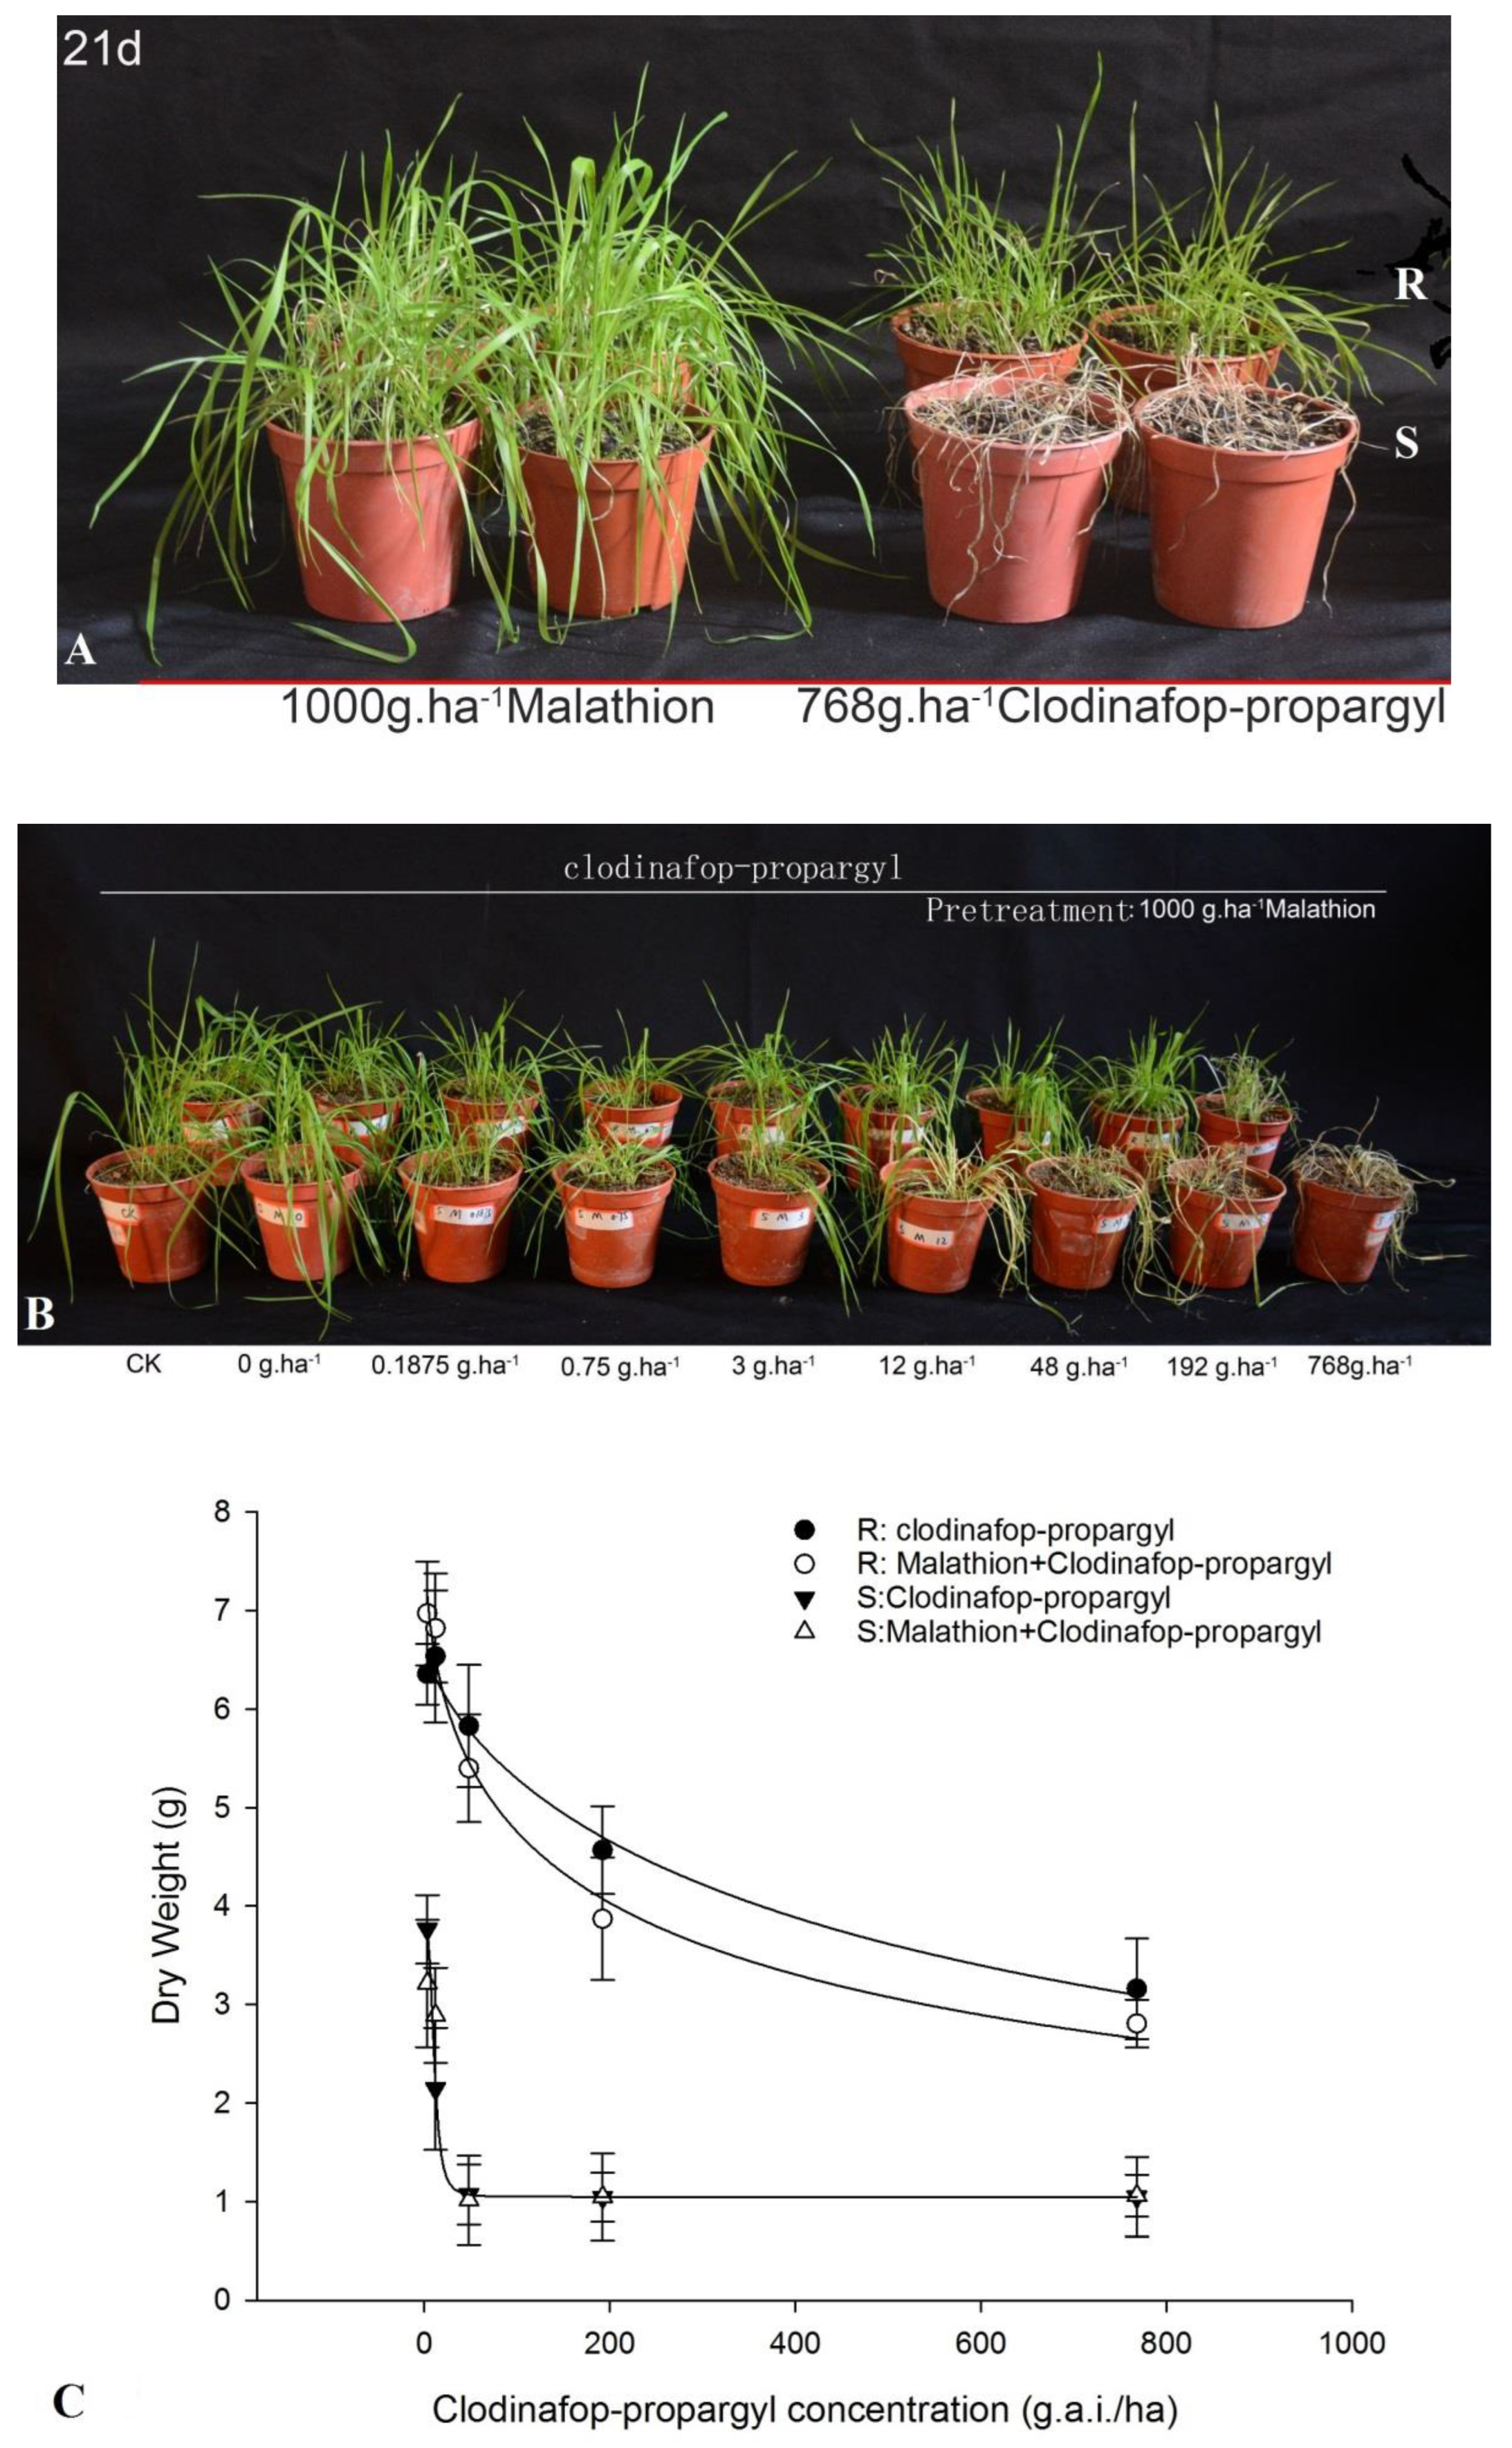
The responses of
P. fugax to clodinafop-propargyl, with or without malathion, are shown in
Figure 1. Malathion alone did not have an impact on the S and R populations of
P. fugax (
Figure 1A). The growth of the S population was significantly inhibited at 48 g.a.i./ha, while the R population still exhibited growth at 768 g.a.i./ha. However, the combination of malathion and clodinafop-propargyl (768 g.a.i./ha) resulted in a significant growth inhibition in the R population (
Figure 1B). The comparison of dry weights also showed that pretreatment by malathion could inhibit the growth and enhance the sensitivity of R to clodinafop-propargyl (
Figure 1C). When clodinafop-propargyl was applied together with malathion, the GR
50 value of clodinafop-propargyl in the R population changed by 65.2%, from 631.80 to 220.10 g a.i.ha
−1. These results suggest that both TSR and NTSR mechanisms exist in R
P. fugax.
3.2. Transcriptome Sequencing and Assembly
The 24 libraries produced 107.19 Gb of data with 948.3 Mb of raw reads. Clean reads ranging from 4.21 Gb to 4.58 Gb per sample, totaling 715.76 Mb, were used for the assembly after adapter and low-quality reads were eliminated (
Supplemental Table S3). Using the longest transcript in each locus of each gene, clean reads were assembled to 218,885 transcripts with a mean length of 1175 bp and an N50 length of 1827 bp (
Supplemental Table S4).
3.3. Functional Annotation Analysis
By doing a blast search against seven public databases, unigene annotation was carried out. There were 145,292 (66.38%) successfully annotated unigenes in at least one of the following: the NCBI non-redundant protein sequences database (Nr), Swiss-prot, NCBI non-redundant nucleotide sequences database (Nt), Interpro, KOG/COG (Clusters of Orthologous Groups of proteins), KEGG, and GO databases, with 32,574 (14.88%) unigenes in all 7 databases (
Figure 2). For example, GO assignments were used to predict the functions of the unigenes by classifying them according to “biological process”, “cellular component”, and “molecular function”. There were 54,600 unigenes in the 24 samples that could be divided into 56 functional subgroups based on the sequence homologies (
Supplemental Figure S1).
3.4. Differential Gene Expression and Functional Enrichment Analysis
In order to analyze the gene expression levels of the samples, the number of genes in three FPKM cases (FPKM ≤ 1, FPKM 1–10, FPKM ≥ 10) were enumerated (
Supplemental Figure S2). We compared the expression differences between the different treatments (intragroup—treated vs. untreated, or between groups—resistant vs. susceptible) and discovered 10,052 up-regulated genes and 5544 down-regulated genes in the treated R population, compared with the untreated R population at the seedling stage, and 19,424 up-regulated genes and 16,547 down-regulated genes in the treated R population, compared with the untreated R population at the tillering stage. Additionally, there were 33,819 up-regulated genes and 58,534 down-regulated genes in the R population, compared with the S population at the seedling stage, and 54,434 genes up-regulated and 57,597 genes down-regulated in the R population, compared with the S population at the tillering stage (
Supplemental Figure S3).
To further characterize the function of the DEGs, GO and KEGG enrichment analyses were conducted and the DEGs associated with NTSR metabolism were analyzed. The differentially expressed NTSR genes between the R and S populations (inter-group) included P450 (83), glutathione-S-transferase (49), glycosyltransferase (41), esterase (96), ABC transporter (35), peroxidase (111), and monooxygenase (61), regardless of the treatment stage (
Supplemental Table S5). In contrast, the number of differentially expressed NTSR genes declined in the tillering stage, including P450 (58), glutathione-S-transferase (41), glycosyltransferase (33), esterase (59), ABC transporter (32), peroxidase (88), and monooxygenase (40) (
Supplemental Table S6). It is also evident that the number of NTSR genes in the R population was higher than the S population during both the seedling and tillering stages. However, within the same population, the differentially expressed NTSR genes differed between the treatment groups, with the exception of the ABC transporter in the seedling stage. In addition, the number of differentially expressed NTSR genes between the treatment groups in the R population was obviously lower than in the S population, indicating that the herbicide had no significant influence on NTSR gene expression in the R population compared to the S population (
Table 1).
“All” represents the number of NTSR genes that all exist in the two analysis groups. Sample description: the first letter—U: untreated, T: treated; the second letter—S: seedling stage, T: tillering stage; the third letter—S: susceptible population, R: resistant population.
3.5. Candidate NTSR Genes Identification
The NTSR genes that had higher expression levels in the R population than in the S population, both in the seedling and tillering stages, and also with higher expression in the treated group, were selected for inter-group analysis. Of these, twelve genes were annotated to P450 families, two were annotated to ABC transporter families, eight were annotated to GST families, seven were annotated to UDP glycosyltransferase (UGT) families, eight were annotated to esterase, five were annotated to monooxygenase, and fifteen were annotated to peroxidase (
Supplemental Table S7). A total of 12 genes, for which the differences in the 2 stages between the R and S population were all greater than 1, were selected as candidate NTSR genes. In the in-group analysis, 10 NTSR genes that were more highly expressed in the treated R population than the untreated R population at the seedling or tillering stage were selected for further validation (
Table 1).
3.6. qRT-PCR Validation of Candidate NTSR Gene Expression
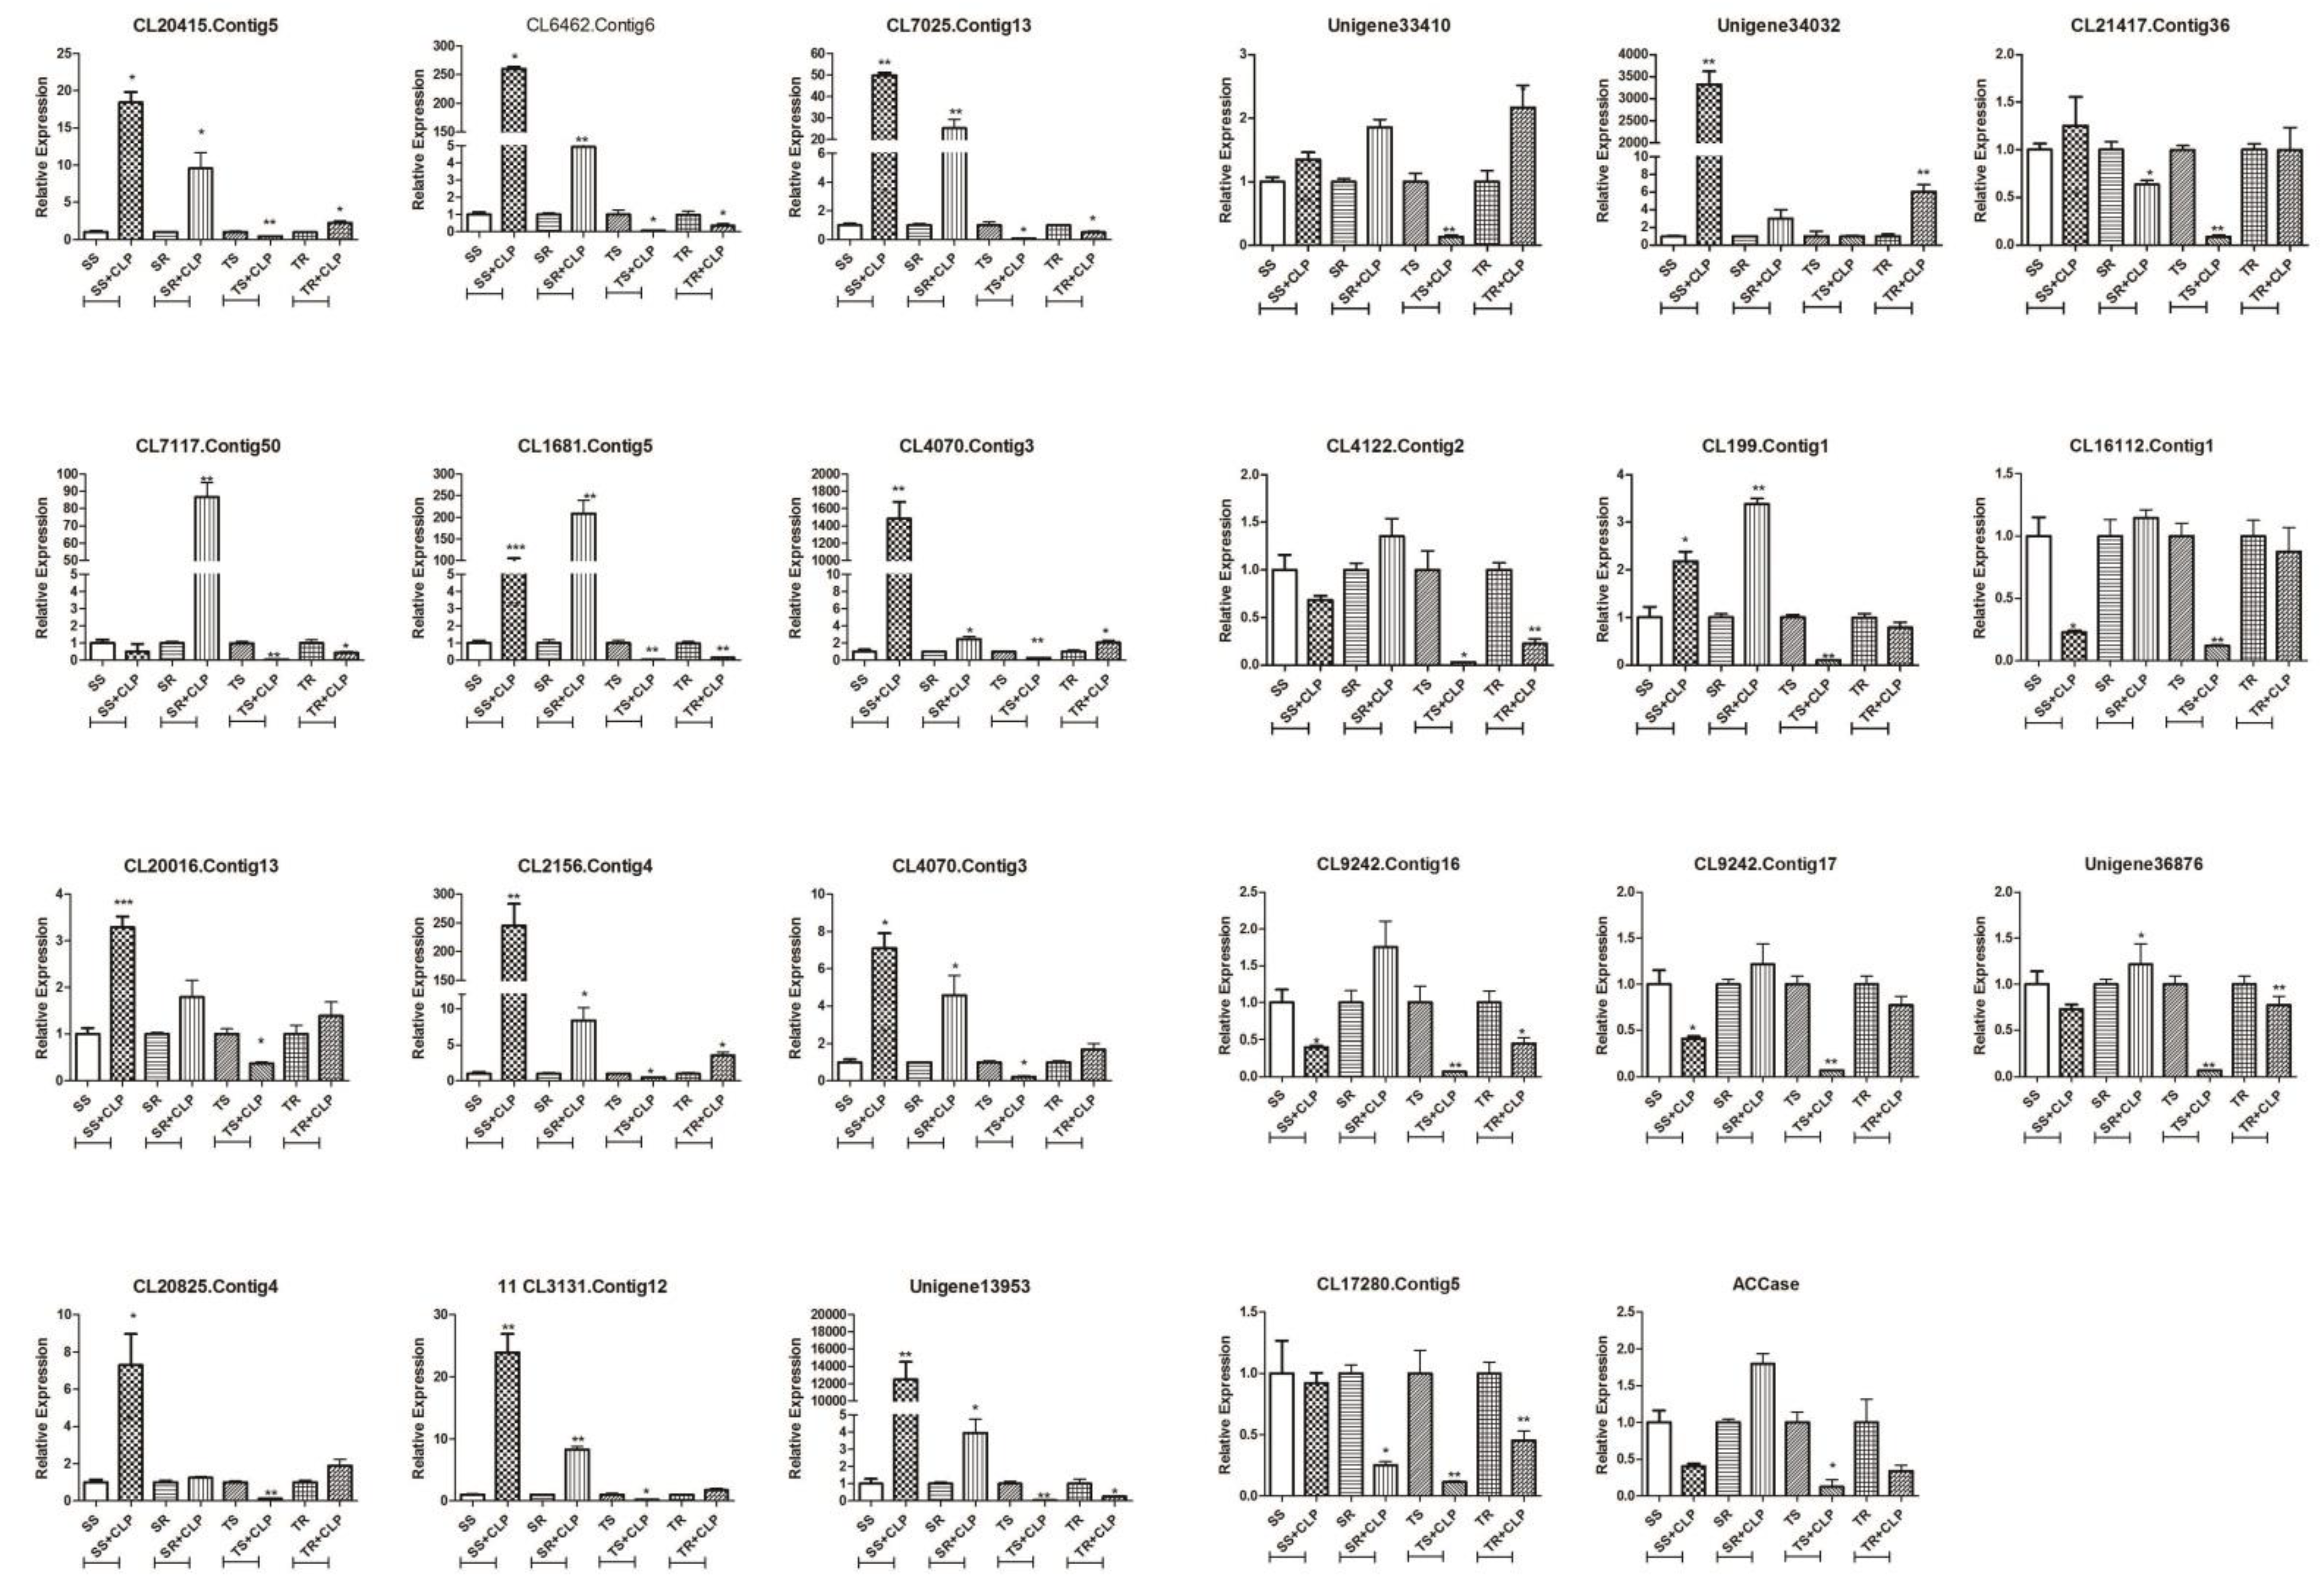
qRT-PCR validation of these 22 genes and ACCase (
Figure 3) demonstrated that the expression of the ACCase gene in the R population was lower than in the S population at the tillering stage. However, the expression level increased in the R population following herbicide application at the seedling stage. This suggested that the overexpression of the ACCase gene may be another factor influencing the resistance of the R population to clodinafop-propargyl.
In addition, a comparison between the R and S population indicated that there were seven more highly expressed genes in the R population, both at the seedling and tillering stages, than in the S population after spraying, including GST (CL7117.contig50, CL16112.contig1), peroxidases (Unigene 36876, CL4122.contig2, CL199.contig1), and ABC transporters (CL9242.contig16, CL9242.contig17).
There were six genes that were more highly expressed in the S population than the R population at the seedling stage following spraying, including peroxidases (CL20825.contig4, CL3131.contig12), esterase (CL20415.contig5), P450s (CL20016. contig13, CL2156.contig4), and GST (CL7025.contig13). These differed from those identified during the tillering stage, as one CytP450 (Unigene 33410) did not differ between the R and S population at the seedling stage after spraying, but was significantly higher in the R population than the S population at the tillering stage.
In the intra-group comparison (
Figure 4), it was found that ACCase gene expression was inhibited at the seedling and tillering stages in the S population and the tillering stage in the R population after spraying, and increased only at the seedling stage of the R population. We speculate that the overexpression of the ACCase gene in the R population is an important factor contributing towards its herbicide resistance, but this decline during the tillering stage may be related to the increased activity of other metabolic enzymes.
In the seedling and tillering stages of the R population, there were three genes’ expression that were promoted after herbicide application, including P450s (Unigene 33410, CL20016.contig13, CL2156.contig4). Additionally, there were four genes that were only significantly highly expressed in the seedling stage after spraying, including GSTs (CL7117.contig50), GT (CL1681.contig5), and peroxidase (CL199.contig1, Unigene 36876). Further investigation of the 15 DEGs under the pre-application of malathion indicated that the expression of these 15 genes was decreased in comparison to clodinafop-propargyl application alone, both in the S population and the R population at both the seedling and tillering stages (
Supplemental Figures S4 and S5). Furthermore, the expression of these 15 genes in the R population was significantly decreased in comparison to the S population (
Supplemental Figure S4). In the intra-group comparison, the expression level of three genes (CL4122.contig2, CL2156. contig4, and Unigene 36876) in the R population was higher in the tillering stage than in the seedling stage, but no significant differences in expression were noted in the other genes during these stages (
Supplemental Figure S5).
Further comparative study found that after malathion treatment, the expression of most of the genes screened above in the R population decreased significantly (
Figure 5). Some decreased significantly at both seedling and tillering stages (as CL20825.Contig4), and some decreased more at the seedling stage (CL7117.Contig50) and others more at tillering stage (as CL199.Contig1).
3.7. Arabidopsis Transgenic Validation of Candidate NTSR Genes
Based on the analysis of qRT-PCR, we selected two GST (CL7117.contig50, CL16112.contig1), one peroxidase (Unigene 36876), and one Cyt P450 (Unigene33410) genes for Arabidopsis transgenic validation. Seven days after Mesosulfuron-methyl application, it was observed that overexpression of the two GST genes and CytP450 gene enhanced Arabidopsis tolerance to Mesosulfuron-methyl at lower and medium concentrations (0.3125–2.5 mg/mL), while as a control, the growth of wild-type Arabidopsis (WT) was significantly inhibited at lower concentrations (0.3125–1.25 mg/mL) (
Figure 6). The biological phenotype of peroxidase (Unigene 36876) transgenic plants was changed, e.g., the number of rosette leaves became less and the leaves became smaller, so the herbicide resistance could not be determined.
4. Discussion
ACCase herbicides inhibit de novo fatty acid synthesis in susceptible grass weeds, leading to rapid necrosis and plant death [
30]. Based on their chemical structures, the compounds in ACCase herbicides can be divided into three classes, namely, aryloxyphenoxypropionates (FOPs), cyclohexanediones (DIMs), and phenylpyrazolins (DENs) [
31]. In some weed populations, NTSR to ACCase herbicides could degrade the above metabolizable compounds into non-toxic entities [
3]. Metabolic resistance has been inferred indirectly from the use of synergists such as piperonyl butoxide (PBO) and malathion, which impact P450 enzymes, that inhibit detoxifying enzymes involved in ACCase herbicide metabolism, the absence of known target-site mutations, and differential responses to closely metabolizable and non-metabolizable FOP and DIM herbicides [
5,
32,
33,
34].
In this study, malathion was used to evaluate the synergistic effects of metabolic resistance to clodinafop-propargyl in
P. fugax R and S populations. No obvious promoting effect was noted in the S population, while increased sensitivity to clodinafop-propargyl was found in the R population. Here, we demonstrated that clodinafop-propargyl resistance in the
P. fugax resistant population was also partly due to an NTSR mechanism, as the application of malathion largely reversed this resistance (
Figure 1). As observed in
Beckmannia syzigachne populations resistant to the FOP herbicide fenoxaprop-p-ethyl, the combined application of fenoxaprop-p-ethyl with ABT or PBO increased the sensitivity towards fenoxaprop-p-ethyl [
35]. These findings support that NTSR and TSR coexist in
P. fugax R populations, as was seen in populations of herbicide-resistant
Lolium rigidum [
36].
RNA-Seq has been successfully applied to the identification of genes involved in NTSR to acetolactate synthase (ALS) and ACCase-inhibiting herbicides in
Descurainia sophia [
37] and
Aegilops tauschii [
21]. However, the NTSR mechanisms are different, both among and within weed species [
6].
As genes that are consistently over-expressed in the R population may contribute importantly to NTSR, the 14 genes that were differentially expressed between the S and R populations under the 2 spraying conditions at the tillering and seedling stages in this study were verified by qRT-PCR. The 14 genes discovered here provide evidence in favor of the theory that NTSR in P. fugax is primarily caused by variations in a set of genes’ expression patterns between the R and S populations.
4.1. Candidate Genes in the Cyt P450 and GST Families
The biochemical role of Cyt P450-mediated herbicide metabolisms was shown to be involved in metabolic resistance to ACCase-inhibiting herbicide [
38]. In our study, three Cyt P450 genes (CL20016.contig13, CL2156.contig4, and Unigene33410) were identified as major candidates for metabolic resistance, with functional annotation as
CYP89A9 (CL20016.contig13) and
CYP94B3 (CL2156.contig4, Unigene33410) in
A. thaliana. The CYP89 family functions in biological processes, such as chlorophyll oxidation, and CYP94A1 have been implicated in plant defense against chemical injury in
Vicia sativa L. [
39]. The expression of these three genes in the R population did not differ significantly from the S population after herbicide application at the seedling stage. In contrast, the expression of these genes was significantly higher in the R population than the S population after herbicide application at the tillering stage (
Figure 3). We thus speculated that these three P450 genes may be associated with resistance metabolism at the tillering stage, but the specific functions require further verification.
Prior studies have indicated that GSTs and GTs are associated with NTSR to ACCase-inhibiting herbicides in
L. rigidum [
38]. In the present study, three GST genes (CL7025.contig13, CL16112.contig1, and CL7117.contig50) were identified as associated with the metabolic resistance of
P. fugax. The expression of CL7025.contig13 was similar to the above three P450 genes, while the expression of CL16112.contig1 and CL7117.contig50 was higher in the R population than the S population at both stages. Furthermore, the expression of CL7117.contig50 differed more significantly at the seedling stage in the R population than in the S population (
Figure 3). These findings imply that the up-regulation of CL16112.contig1 and CL7117.contig50 may be associated with metabolic resistance in the R population.
4.2. Candidate Genes in the ABC Transporter Family
Plant ABC transporters are implicated in the detoxification of xenobiotics, which include herbicides [
40]. However, in contrast to other metabolism gene families, ABC transporters detoxify herbicides by sequestering the herbicides and their metabolites [
9]. In the present study, the two contigs, CL9242.contig16 and CL9242.contig17, were all annotated to ABCC10. ABCC transporter subfamily proteins have been identified for their role in the detoxification and the regulation of stomatal guard cells [
41]. The expression of these two genes in the R population was lower than in the S population prior to clodinafop-propargyl application, but the expression increased in the R population following application and then increased further at the tillering stage (
Figure 3). This corroborates a previous finding whereby ABCC1 was found to play an important role in the herbicide resistance of a
D. sophia population [
37]. In addition, a ABCC transporter (
EcABCC8) has also been characterized in
Echinochloa colona to confer glyphosate resistance by acting as a glyphosate exporting pump [
42]. Thus, these two genes may be associated with NTSR resistance in R
P. fugax population.
4.3. Candidate Herbicide-Resistance Genes in Other Gene Families
In this study, we discovered five peroxidase genes (CL199.contig1, Unigene36876, CL4122.contig2, CL20825.contig4, and CL3131.contig12) and one esterase gene (CL20415.contig5) that are possibly associated with clodinafop-propargyl metabolic resistance in
P. fugax. The expression of CL199.contig1, Unigene36876, and CL4122.contig2 in the R population was higher than in the S population at the seedling and tillering stages following clodinafop-propargyl application, and the difference between the former two was more significant (
Figure 3). After the intra-group comparison, we found that the expression level of these three genes in the R population at the seedling stage had increased following clodinafop-propargyl application. However, the opposite was observed during the tillering stage (
Figure 4). We, therefore, presumed that CL199.contig1, Unigene 36876, and CL4122.contig2 were related to NTSR metabolism in the R population at the seedling stage. As the expression of CL20825.contig4, CL3131.contig12, and CL20415.contig5 in the R population was higher than in the S population only during the tillering stage, and was also higher under the condition of clodinafop-propargyl application (
Figure 3), we thus assumed that these three genes were related to NTSR metabolism in the R population in the tillering stage. In some resistant plants, NTSR promotes the expression of peroxidases that protect cells against oxidative damage, thereby extending the resistant plant’s time to degrade the herbicide [
6]. Additionally, esterase was also found to be involved in the degradation of an ACCase inhibitor in
Alopecurus myosuroides [
43].
4.4. Effect of Malathion on the Expression Level of NTSR Gementenes
Following the application of malathion (
Figure 5), five NTSR genes were not only significantly inhibited in the seedling stage in the S population, but also were all significantly inhibited in both the seedling and tillering stages in the R population. These genes included CL20415.contig5 (esterase), CL20016.contig13 (P450), CL20825.contig4 (peroxidase), CL3131.contig12 (peroxidase), and Unigene33410 (P450). The pre-application of malathion resulted in the expression of these genes being significantly lower in the R population than the S population (
Supplemental Figure S4), indicating that malathion reduced the metabolic enzyme activity of the R population, thereby reducing the resistance. Furthermore, we discovered that, despite malathion application, the expression of NTSR genes was partly inhibited during the tillering stage, including CL7025.contig13 (GST) and CL2156.contig4 (P450) in the S and R populations; however, the degree of inhibition was far lower than in the seedling stage (
Supplemental Figure S5). We thus speculated that the enhancement in the metabolic enzyme activity of these genes during the tillering stage may contribute to the ineffective control of weeds during this stage.
5. Conclusions
A
P. fugax population (QS) possessing TSR and NTSR to clodinafop-propargyl was identified in a previous study, and the TSR mechanism was clearly demonstrated [
17]. In the present study, the NTSR mechanism was explored. In combination, our results suggest that this latter mechanism is likely to be associated with Cyt P450- and GST-mediated integrated metabolic resistance together with an ABC transporter-mediated sequestration of the herbicide metabolites. Additional genes, such as peroxidases and esterases, may also contribute to the NTSR. In addition, we found that these genes were differentially expressed between the R and S populations, the two growth stages, and the herbicide application conditions. Different genes were associated with NTSR metabolism at the seedling and tillering stages. Functional characterization, such as transgenic overexpression of the two GST (CL7117.contig50, CL16112.contig1) and one Cyt P450 (Unigene33410) genes in Arabidopsis, further validated the herbicide metabolism role of the candidate genes. This study provided novel insight into the gene expression profile of seedling and tillering stages in
P. fugax and identified the function genes regulating herbicide metabolism in resistant populations, which can serve as a foundation for uncovering the NTSR mechanism in older weeds. It should be stressed that although the transgenic Arabidopsis plants can partially verify the function of the candidate genes, further endogenous verification by transfer of these genes into the callus of
P. fugax should be conducted in the future.


