Article

Extraction of Winter-Wheat Planting Areas Using a Combination of U-Net and CBAM

1
National Engineering Research Center for Analysis and Application of Agro-Ecological Big Data, Anhui University, Hefei 230601, China
2
School of Electronic and Information Engineering, Anhui University, Hefei 230601, China
3
Institute of Space Integrated Ground Network Anhui Co., Ltd., Hefei 230088, China
*
Author to whom correspondence should be addressed.
Agronomy 2022, 12(12), 2965; https://doi.org/10.3390/agronomy12122965
Submission received: 24 October 2022 / Revised: 16 November 2022 / Accepted: 21 November 2022 / Published: 25 November 2022

Abstract

:
Winter wheat is one of the most important food crops in China, and it is of great significance to ensure national food security. The accurate extraction of wheat-growing areas is a prerequisite for growth assessments, stress monitoring, and yield assessments. In this study, GF-6 (8 m resolution) and Sentinel-2 (10 m resolution) remote sensing images were used to create datasets for the accurate extraction of winter-wheat growing areas by improving the U-Net model. First, U-Net was used as the base network to extract features, and then the convolutional block attention module (CBAM) was embedded in the basic convolutional units in the coding and decoding layers of the network to enhance or suppress the features to improve the feature-expression capability of the model, and to finally complete the end-to-end winter-wheat planting-area extraction. SegNet, DeepLabV3+, and U-Net-CBAM were selected as the comparison models, and they were tested using the test set in the Sentinel-2 dataset. The precision of the U-Net-CBAM model trained on the GF-6 dataset was 84.92%, the MIoU was 77.1%, the recall was 88.28%, the overall precision (OA) was 91.64%, and the F1 was 86.45%. For training on Sentinel-2 dataset, those values were: 90.06% for precision, 83.18% for MIoU, 90.78% for recall, 93.93% for OA, and 90.52% for F1, which showed significantly better results than those of the comparison models, indicating that U-Net-CBAM improved the accuracy of winter-wheat area extraction. It also showed that the segmentation performance of the training and test sets from different datasets was much lower than the segmentation performance from the same dataset.

1. Introduction

Winter wheat is one of the most important grain crops in China, and according to the National Bureau of Statistics (data.stats.gov.cn, 2019 (accessed on 24 August 2021)), the production in 2019 was as high as 133,596,300 tons, and the planted area was 23,772,768 thousand hectares, accounting for 14.29% of the total grain crop. Therefore, timely and accurate information on the planted area and its spatial distribution is important for food security, grain-yield estimation, and agricultural management and policy [1]. Due to the complexity of the crop cultivation structure and its environmental impact on China, there are many difficulties in crop identification and planting-area extraction. Traditional methods of obtaining winter-wheat planting areas, such as statistical surveys and agronomic forecasts, are not only time-consuming and laborious, but they are also susceptible to subjective human factors [2]. Satellite remote sensing technology has the characteristics of wide coverage and multiband and multitemporal imaging, which can greatly improve the efficiency and make up for the shortage of traditional agricultural monitoring, while obtaining timely information on the crop conditions during a large growing season [3], and it is a good data source for obtaining information on winter-wheat cultivation.
With the development of remote sensing technology, remote sensing images have gradually become the main data source for extracting crop-planting information [4,5,6,7]. The pixel-by-pixel classification of remote sensing images is an effective method for obtaining the spatial distribution information of crops in large areas [8,9,10], and the key to improving pixel-based classification accuracy is to extract more effective pixel features from remote sensing images [11,12,13]. Many scholars have carried out a lot of research work on this. Li et al. [14] used Sentinel data with multiple fertility periods and extracted the winter-wheat area in Fugou County, Henan Province, using random forests (RFs). Ge et al. [15] used the HJ-1A satellite as a data source and extracted the winter-wheat area in Shuyang County, Jiangsu Province, using the normalized difference vegetation index (NDVI) density segmentation method. Bazzi et al. [16] used Sentinel-1 SAR time series data and extracted rice-growing areas in southern France using a decision tree classification method. Yang et al. [17] used the SPOT 5 satellite as the data source and five supervised classification methods to extract crop areas in southern Texas. Mansaray et al. [18] combined Sentinel-1A, Landsat 8, and Sentinel-2A data to extract rice-growing areas in Jiaxing City, Zhejiang Province, using RF. All of the above studies successfully extracted crop-planting information and spatial distribution data. However, as they mainly used traditional supervised and unsupervised classification methods, they were only able to extract low-level features with poor discriminatory ability, and the results were error-prone regarding the identification of the edge pixels of winter-wheat planting areas, which often led to unsatisfactory classification results [19,20,21].
Deep convolutional neural networks have achieved great success in many fields, and they have demonstrated excellent performance in many applications [22,23]. This trend has also attracted many researchers to apply deep convolutional neural networks to the field of the semantic segmentation of remote sensing images. Wu et al. [24] used a deep learning model based on long short-term memory (LSTM) to detect and extract rice fields in Taiwan from Sentinel-1 SAR images. Sun et al. [25] used Landsat 8 image data to extract the crop acreage of North Dakota, and the results outperformed the extraction results obtained via RF. Huang et al. [26] proposed an improved SegNet model based on Sentinel-2 data, replacing the convolution in SegNet with a depth-separable convolution for peanut acreage extraction. Ji et al. [27] used multitemporal GF-2 remote sensing image data for crop classification using 3D convolutional neural networks. Zhao et al. [28] used images taken by the DJI Phantom 4 UAV platform equipped with high-resolution digital and multispectral cameras as a data source to extract areas of fallen rice on Qixing Farm, Sanjiang Administration, Heilongjiang Province, using the U-Net model. Du et al. [29] input images taken by the WorldView-2 satellite into the DeepLabV3+ model to achieve crop classification and extraction, and the experimental results show that the segmentation accuracy of this method is better than those obtained via maximum likelihood classification (MLC), a support vector machine (SVM), or RF. However, there are still some challenges in extracting the crop-planting areas from high-resolution remote sensing images, including: (1) high-resolution remote sensing images have complex spatial feature relationships and a large amount of redundant information, and it is difficult to reflect the main information of the content by directly extracting the features of the whole image; (2) the influence of the spatial resolution and data sources of training sets on the classification accuracy has not yet been fully considered; and (3) the sizes of winter-wheat planting areas are different, and the sizes of winter-wheat pixel blocks in remote sensing images are not the same.
To address the above challenges, this study introduces CBAM to the U-Net model to remove redundant information by focusing on the useful features of the image in channel and spatial dimensions and places more attention on informative features to further improve the classification performance so as to effectively improve the extraction accuracy of winter-wheat planting areas, which provides a theoretical and technical method for the extraction of other crop-planting areas.

2. Study Area and Data Sources
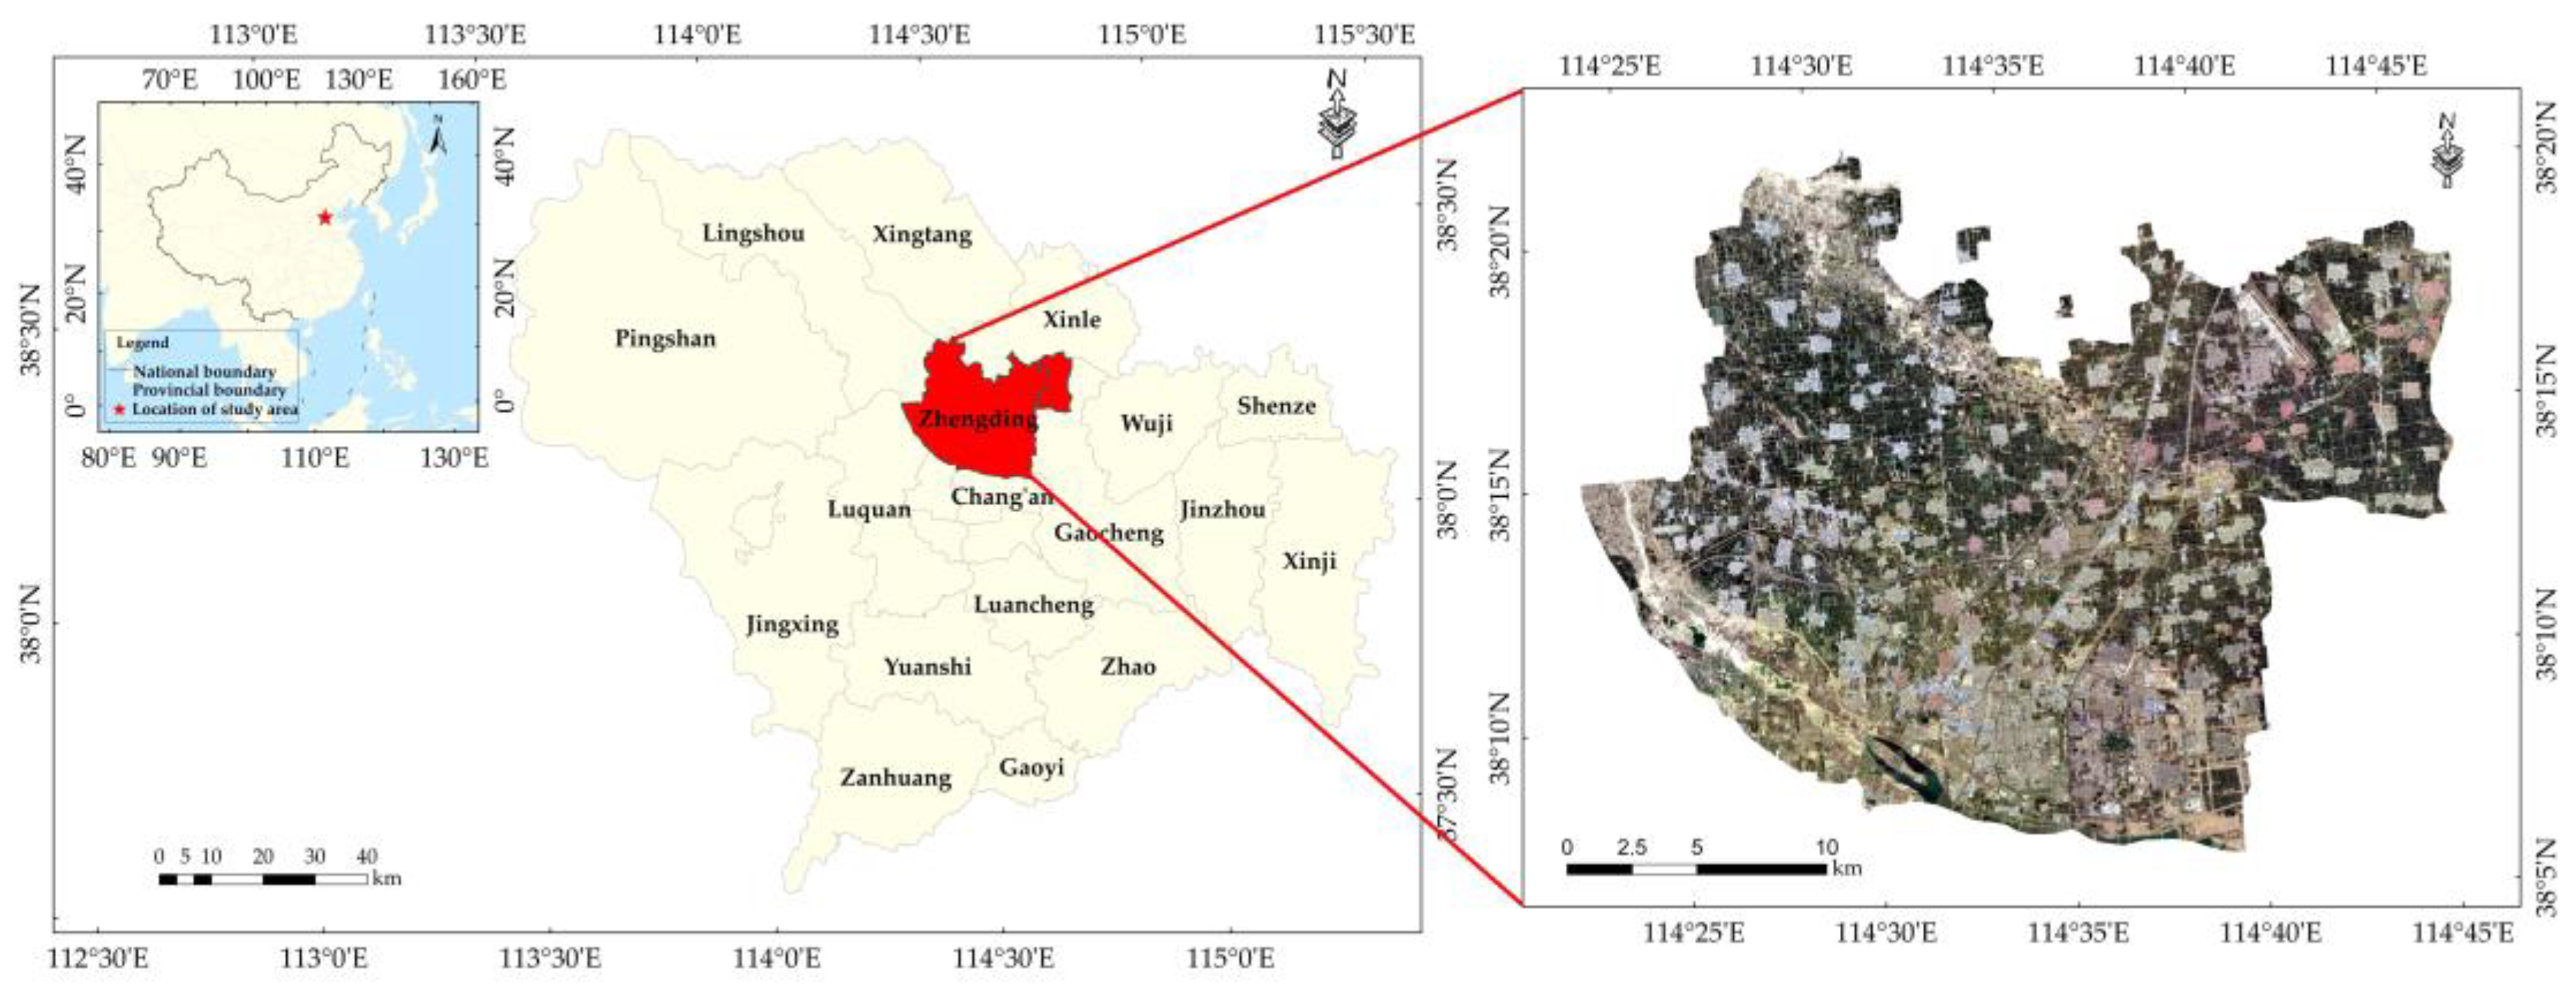
2.1. Study Area

The study area is located in Zhengding County and Zengcun Town, Gaocheng District, Shijiazhuang City, Hebei Province, China, with an area of about 581.24 km2 and a central geographic location of 114.35° E, 38.15° N (Figure 1). This area belongs to the temperate continental semi-humid monsoon climate zone, with four distinct seasons and sufficient light for crop growth. According to The Shijiazhuang Statistical Yearbook 2019 [30], the main crops include winter wheat and summer corn. The Shijiazhuang Gaocheng District and Zhengding county comprise one of the major grain-producing areas for winter wheat in Hebei Province, and the study area selected for the extraction of the winter-wheat growing area is representative.

2.2. Growth Cycles of Winter Wheat in the Study Area

The developmental period of winter wheat can be generally divided into nine periods, including seed sowing, seedling emergence, tillering, wintering, reviving, elongation, heading, milk-ripening, and maturing, starting on October 1 and ending on June 30 of the following year [31]. The winter-wheat phenology calendar for Shijiazhuang City was obtained from the website of the Ministry of Agriculture and Rural Affairs of the People’s Republic of China (http://www.moa.gov.cn/ (accessed on 24 August 2021)), and the specific growth cycles are shown in Table 1. When winter wheat is in the milk-ripening stage, the growth is good, other crops have not yet been sown or have just been sown, and there are obvious differences between winter wheat and other species, which can reduce misclassifications caused by “same species, different spectrum” and “different species, same spectrum”.

2.3. Remote Sensing Imagery

2.3.1. Sentinel-2 Data

The Sentinel-2 satellite Level-1C data products used in this study have been taken from the data center of the European Space Agency (ESA) (https://scihub.copernicus.eu/dhus/#/home (accessed on 26 October 2021)). Sentinel-2 is a second-generation Earth observation satellite operated by ESA with two satellites, 2A and 2B. Sentinel-2A covers 13 spectral bands with a spatial resolution range of 10–60 m and a revisit period of 10 days. The experiment used a remote sensing image, taken on 28 May 2019 by Sentinel-2A, that covered the whole study area with less cloud cover. The parameters of the Sentinel-2A satellite are shown in Table 2.
The acquired Sentinel-2A images were preprocessed using the Sentinel Application Platform (SNAP) and Environment for Visualizing Images (ENVI) software, first with the help of the Sen2cor plug-in (http://step.esa.int/main/snap-supported-plugins/sen2cor/ (accessed on 26 October 2021)) provided by ESA for atmospheric correction. Then, the SNAP was used to resample the images, and finally, ENVI software was used to perform band synthesis, image mosaic, and cropping in the B2–B4 bands to obtain Sentinel-2A images covering the study area with a spatial resolution of 10 m.

2.3.2. GF-6 Data

The GF-6 satellite was officially placed into service on 21 March 2019. GF-6 is a low-orbiting optical satellite equipped with a panchromatic/multispectral high-resolution (PMS) camera and a wide field-of-view (WFoV) camera. This study used GF-6 PMS images with a revisit period of 4 days, an observation width of 90 km, a spatial resolution of 2 m in the panchromatic band, and a spatial resolution of 8 m in the multispectral band. The GF-6 PMS satellite parameters are shown in Table 2.
One remote sensing image from GF-6, taken on 6 May 2019 and covering the whole study area, was used for the experiment. This GF-6 image has less cloud cover and better clarity. Preprocessing was performed using ENVI software, including atmospheric correction, geometric correction, image cropping, and band synthesis. After preprocessing, a preprocessed GF-6 image containing four channels (blue, green, red, and near-infrared), with a spatial resolution of 8 m, was obtained.

3. Methodology

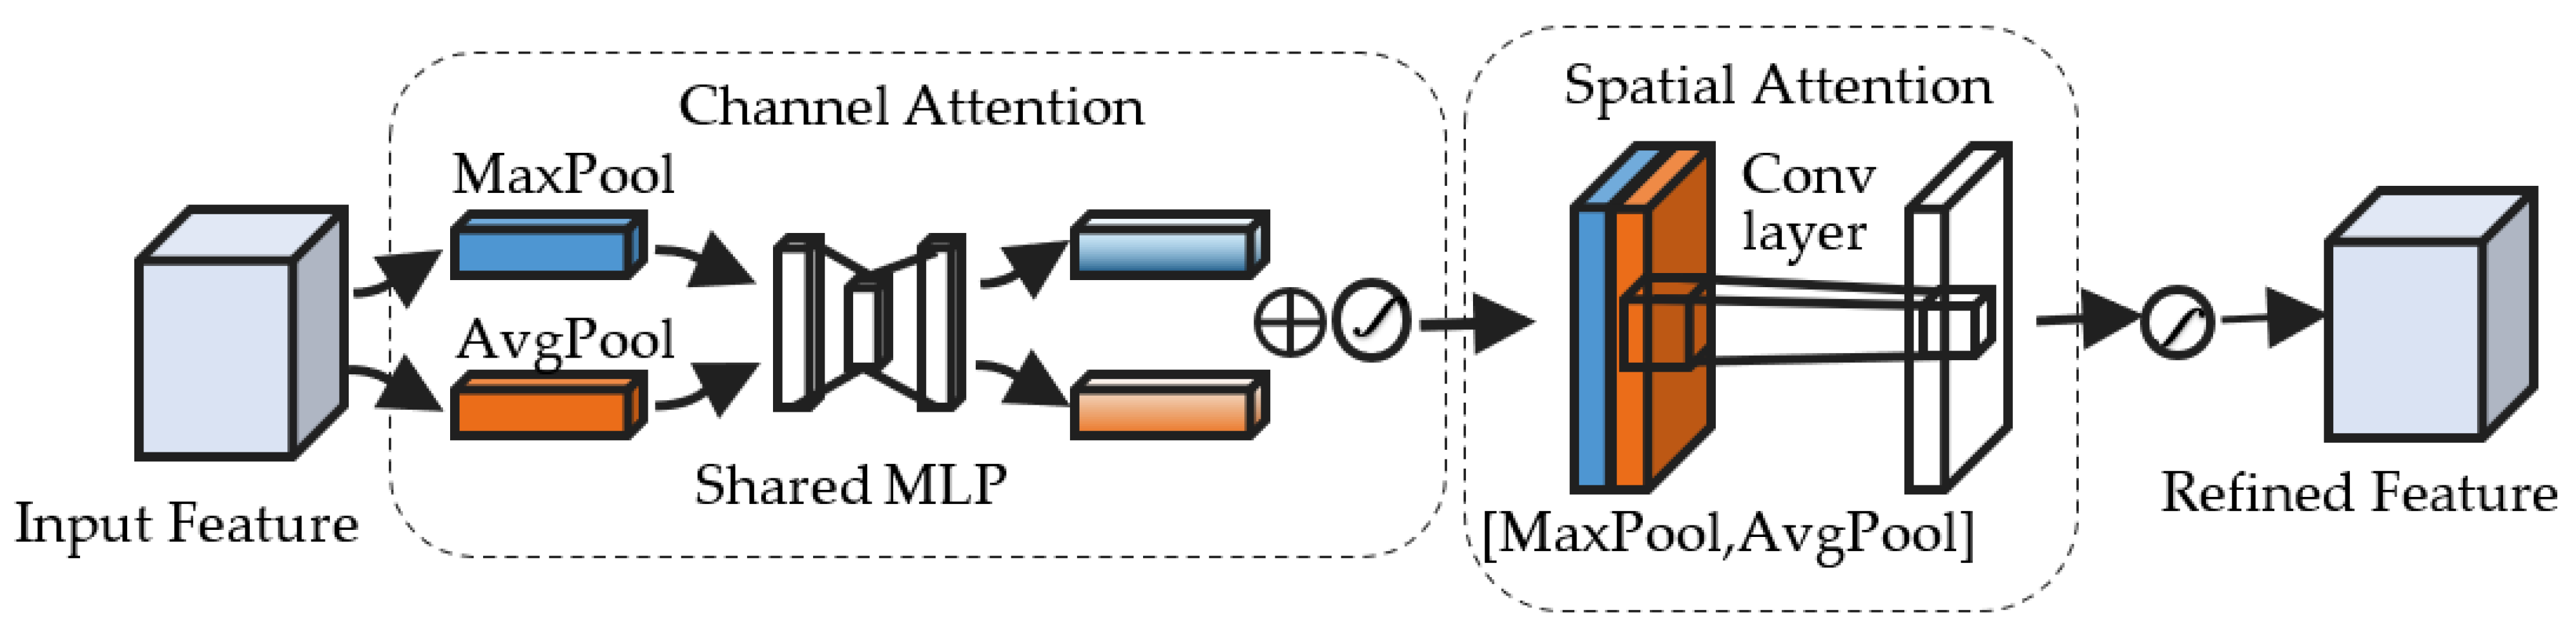
3.1. Convolutional Block Attention Module

The convolutional block attention module (CBAM) (Figure 2) is an attention mechanism module that combines spatial and channel dimensions [32,33,34]. The channel attention module uses the global average pooling and global maximum pooling methods to obtain two aspects of global information when compressing the spatial dimension of the feature map, and then it feeds this into a shared model consisting of a hidden layer and a multilayer perceptron to obtain two features, respectively. After adding these two features, the channel attention graph M_c is obtained by a sigmoid function (δ). Finally, the feature vector is output by summing over each element in combination with the channel attention graph. The expression of the channel attention module is as follows:
M _ c ( F ) = δ ( MLP ( AvgPool ( F ) ) + MLP ( MaxPool ( F ) ) )
The spatial attention module performs global maximum pooling and global average pooling based on the feature channels, joins them to generate valid feature descriptors, convolves them with a 7 × 7 convolution kernel, and then performs a sigmoid operation to generate spatial attention features to obtain the spatial attention map M_s. The expression of the spatial attention module is as follows:
M _ s ( F ) = δ ( f ( 7 × 7 ) ( [ AvgPool ( F ) ; MaxPool ( F ) ] )
M _ CBAM ( F ) = M _ c ( F ) + M _ s ( F )

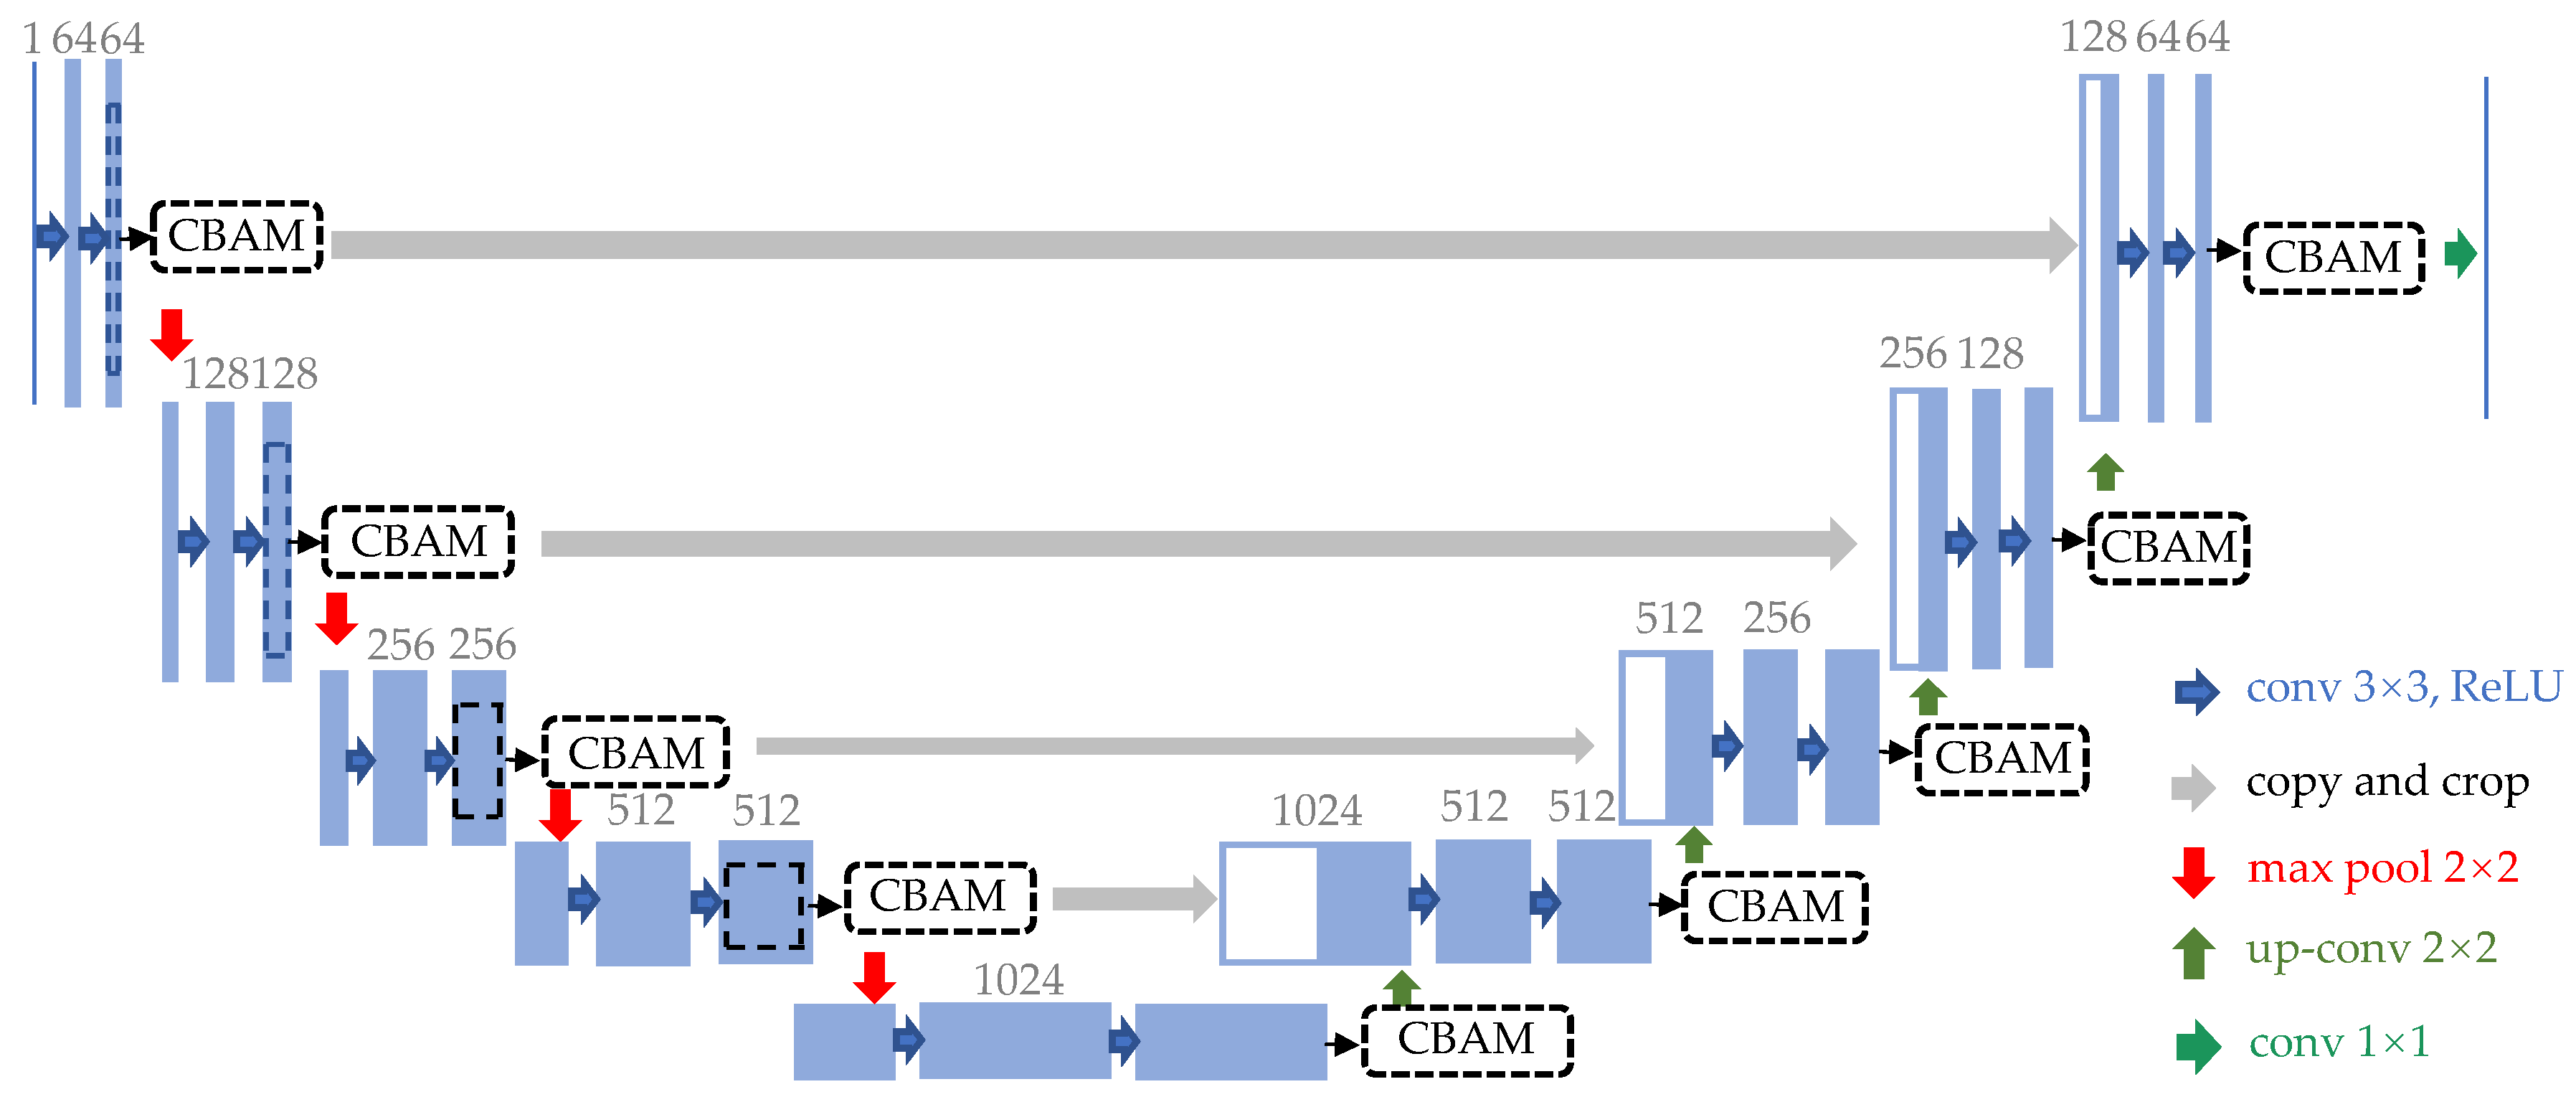
3.2. Structure of the U-Net-CBAM

U-Net [35] is a deep learning network architecture widely used for semantic segmentation tasks (Figure 3). U-Net employs a typical encoder–decoder structure to generate feature maps with a small resolution but condensed high-dimensional semantic representations after successive convolution and downsampling by the encoder. Then, the decoder performs successive convolutions and upsampling to the original size to obtain the segmentation result.
In our experiments for this study, the CBAM network structure was fused with U-Net, and the convolutional attention module was used to identify important features in image channels and spatial regions, paying more attention to the boundary features of the winter-wheat planting area to ensure that the features of each pixel point in the winter-wheat planting area would be learned. CBAM was placed after each double-convolution of the encoder and decoder to highlight the features in the feature map generated by the deep convolution of the target features and to improve the recognition performance of the model.

4. Training of U-Net-CBAM and Evaluation Metrics

The U-Net-CBAM model was implemented using Python 3.6 on a Windows 10 operating system and a PyTorch framework. The comparison experiments were performed on a graphics workstation with an NVIDIA Quadro P4000 Graphics device with 192 GB of graphic memory.

4.1. Image Label Datasets

To establish the image label dataset for training and testing, the specific steps are as follow: (1) Fuse the 2 m panchromatic image of GF-6 and the 8 m multispectral data image to obtain the 2 m multispectral data as the reference basis for manual labeling; (2) Select Zhengding County of Shijiazhuang City as the training set and Zengcun Town of Gaocheng City as the testing set; and (3) Use the Region of Interest (ROI) tool in ENVI software to outline the boundaries of the winter-wheat planting areas on the remote sensing images of GF-6 and Sentinel-2 in the study area and to create labeled images for the remote sensing images; (4) Overlap cropping using sliding windows to help extend the training dataset and avoid overfitting by cutting the remote sensing images and the labeled images into equally sized image blocks (256 × 256); the image blocks and their corresponding label files form image–tag pairs. The training set is then augmented with data to further expand the dataset. The final GF-6 image dataset and Sentinel-2 image dataset each have 5000 image–tag pairs in the training set and 375 image–tag pairs in the test set.

4.2. Model Training

Cross entropy is used as a loss function in model training, and Equation (4) illustrates the definition of sample cross entropy:
H ( p , q ) = i = 1 t q i log ( p i )
where p is the predicted category probability distribution, q is the actual category probability distribution, i is the index of the elements in the category probability distribution, and t is the number of category labels. On this basis, the loss function of the model is defined as:
l o s s = 1 t s t s i = 1 t q i log ( p i )
where ts denotes the number of samples used in the training phase.
We trained the U-Net-CBAM model in an end-to-end manner using the following five steps:
(1)
Determine the hyperparameters in the training process and initialize the parameters of the U-Net-CBAM model;
(2)
Input the images and labels from the training set in the GF-6 image dataset and the Sentinel-2 image dataset into the U-Net-CBAM model, respectively;
(3)
Perform forward propagation on the current training data using the U-Net-CBAM model;
(4)
Calculate the loss and back-propagate to the U-Net-CBAM model;
(5)
Use the Adam optimizer to update the parameters of the U-Net-CBAM model based on the loss values, and repeat steps 2–4 until the loss is lower than a predetermined threshold.
In the experiment, completing the training required 15 h. The hyperparameter settings for training all the models were determined, as shown in Table 3, by referring to the references [36,37,38].

4.3. Evaluation Metrics

The evaluation metrics used in this study for the network prediction results are Precision, Mean Intersection over Union (MIoU), Recall, Overall Accuracy (OA), and F1 [39]. The extraction results for winter wheat can be classified as TP (pixels correctly identified as winter wheat), TN (pixels correctly identified as other types of crops), FP (pixels misclassified as winter wheat), and FN (pixels misclassified as other types of crops).
MIoU is used to evaluate the accuracy of segmentation:
MIoU = i n T P T P + F N + F P n
Precision is used to indicate the proportion of winter-wheat pixels that are accurately classified, as compared to all pixels identified as winter wheat:
Precision = T P ( T P + F P )
Recall indicates the proportion of accurately classified winter-wheat pixels, as compared to all actual winter-wheat pixels:
R e c a l l = T P ( T P + F N )
F1 is a metric used to assess the accuracy of classification models in statistics:
F 1 = 2 P r e c i s i o n R e c a l l P r e c i s i o n + R e c a l l
OA is the ratio of the number of correctly classified samples to the total number of samples:
OA = ( T P + T N ) ( T P + T N + F P + F N )

4.4. Comparison Models

SegNet and DeepLabV3+ are classical semantic segmentation models for images and have achieved good results in camera image processing. In this study, these two models were chosen as the comparison models to better reflect the advantages of the U-Net-CBAM model in classification. SegNet, DeepLabV3+, U-Net, and U-Net-CBAM models were trained using the training sets from the GF-6 image dataset and Sentinel-2 image dataset, respectively.

5. Results and Discussion

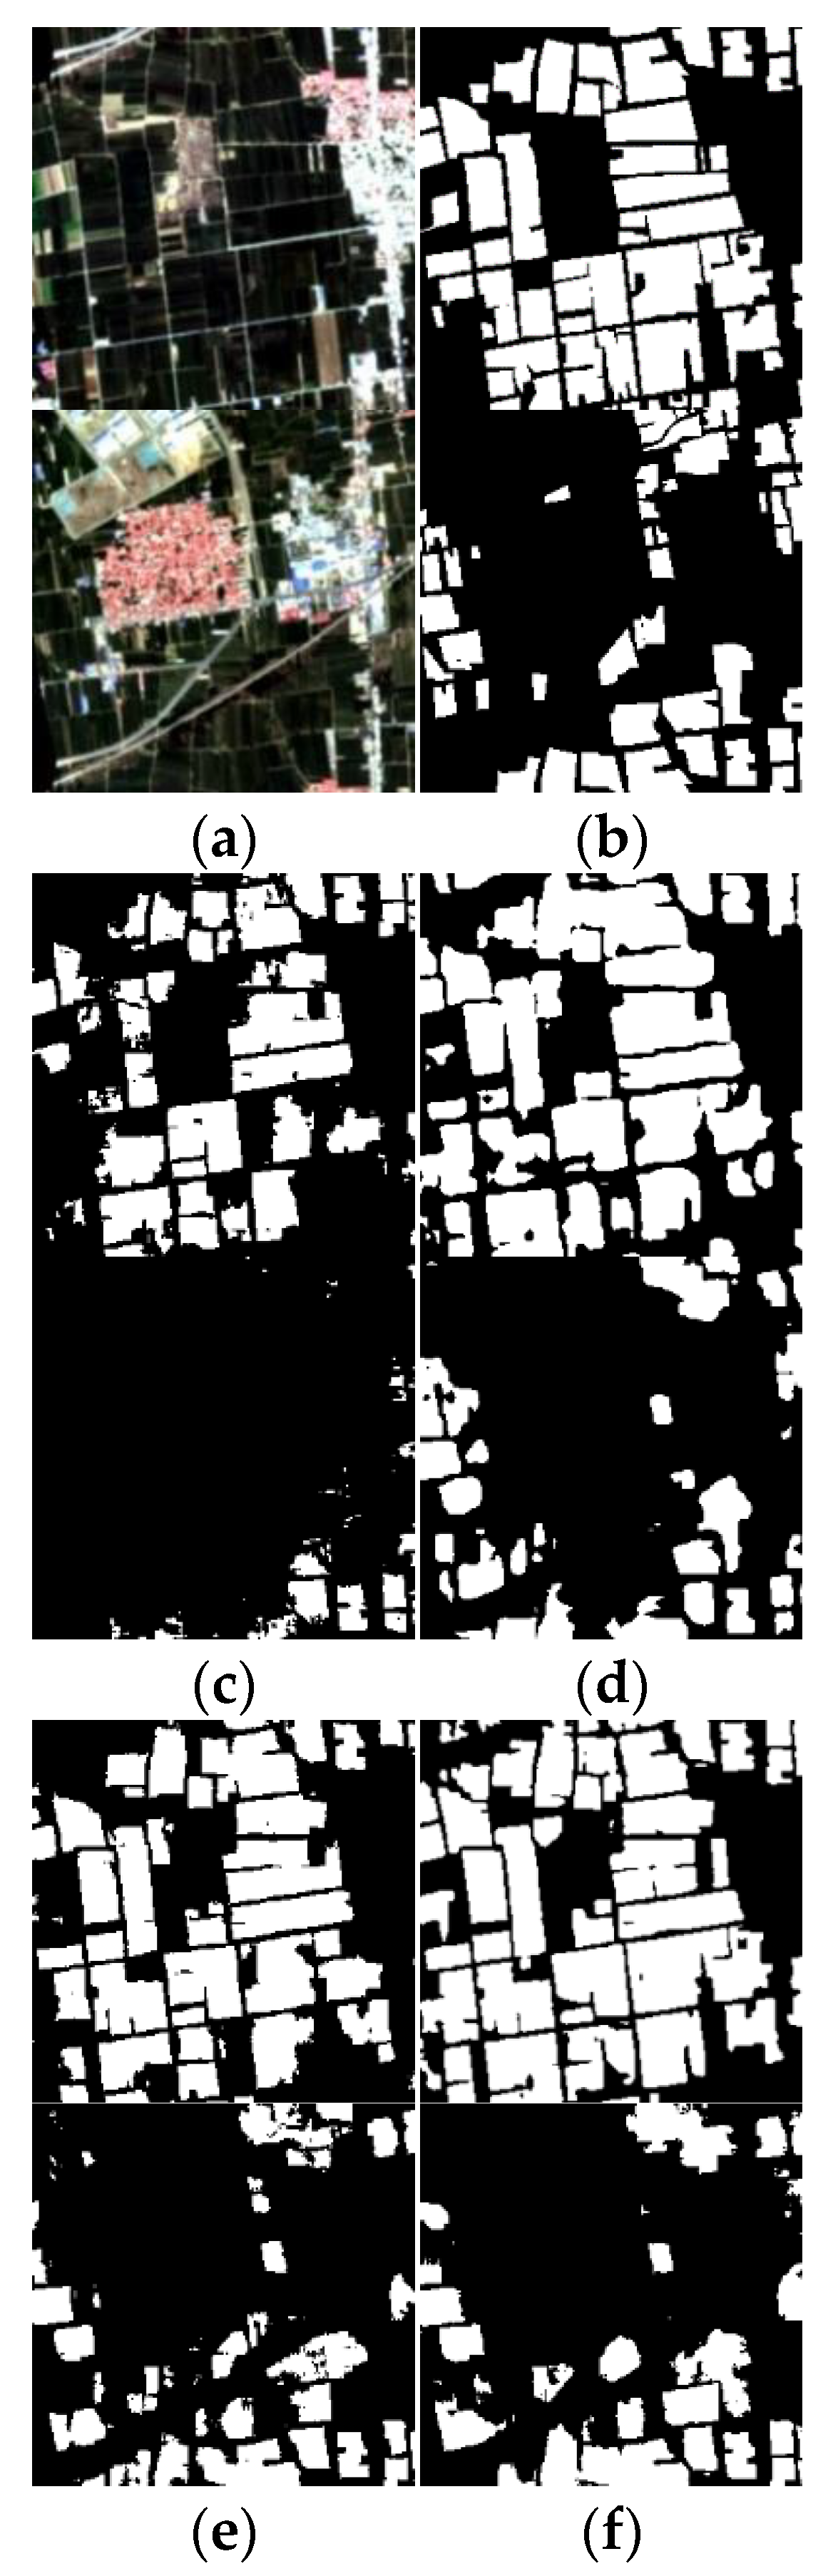
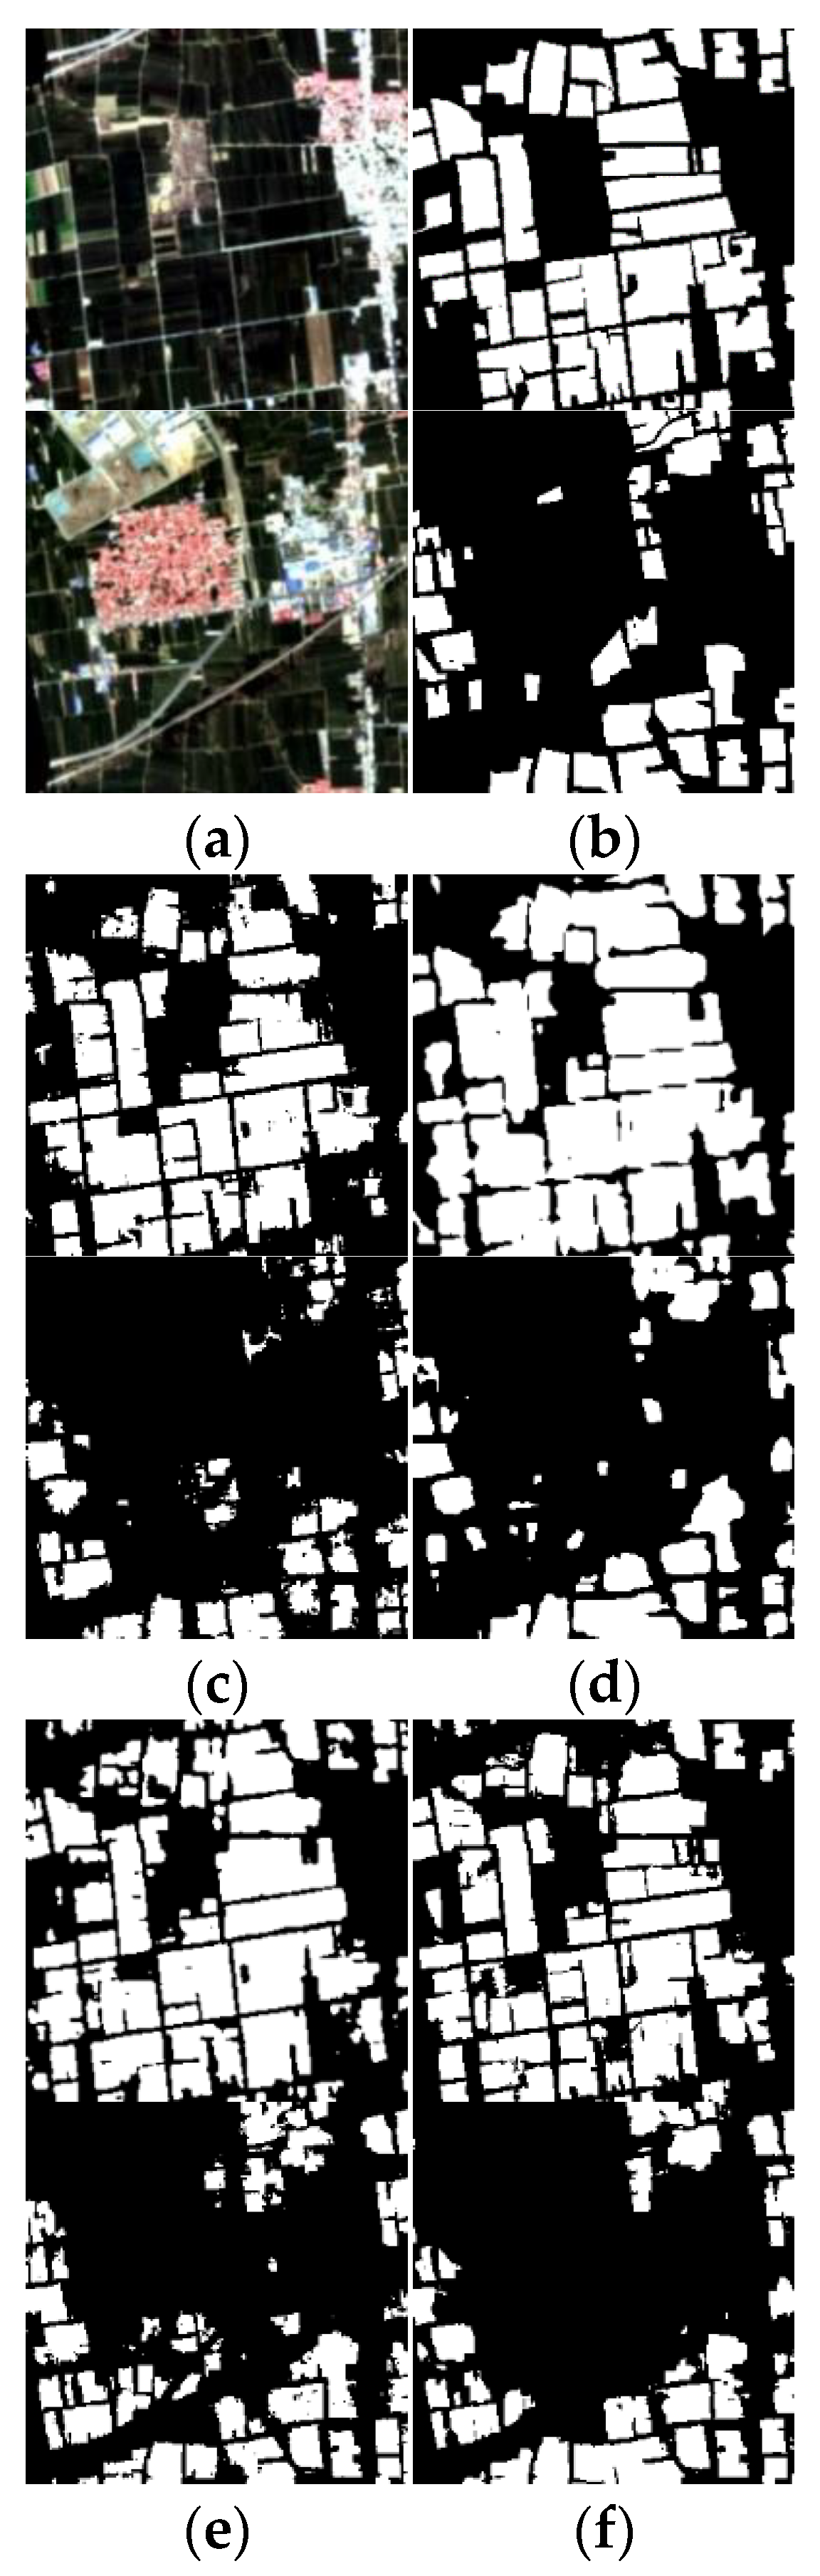
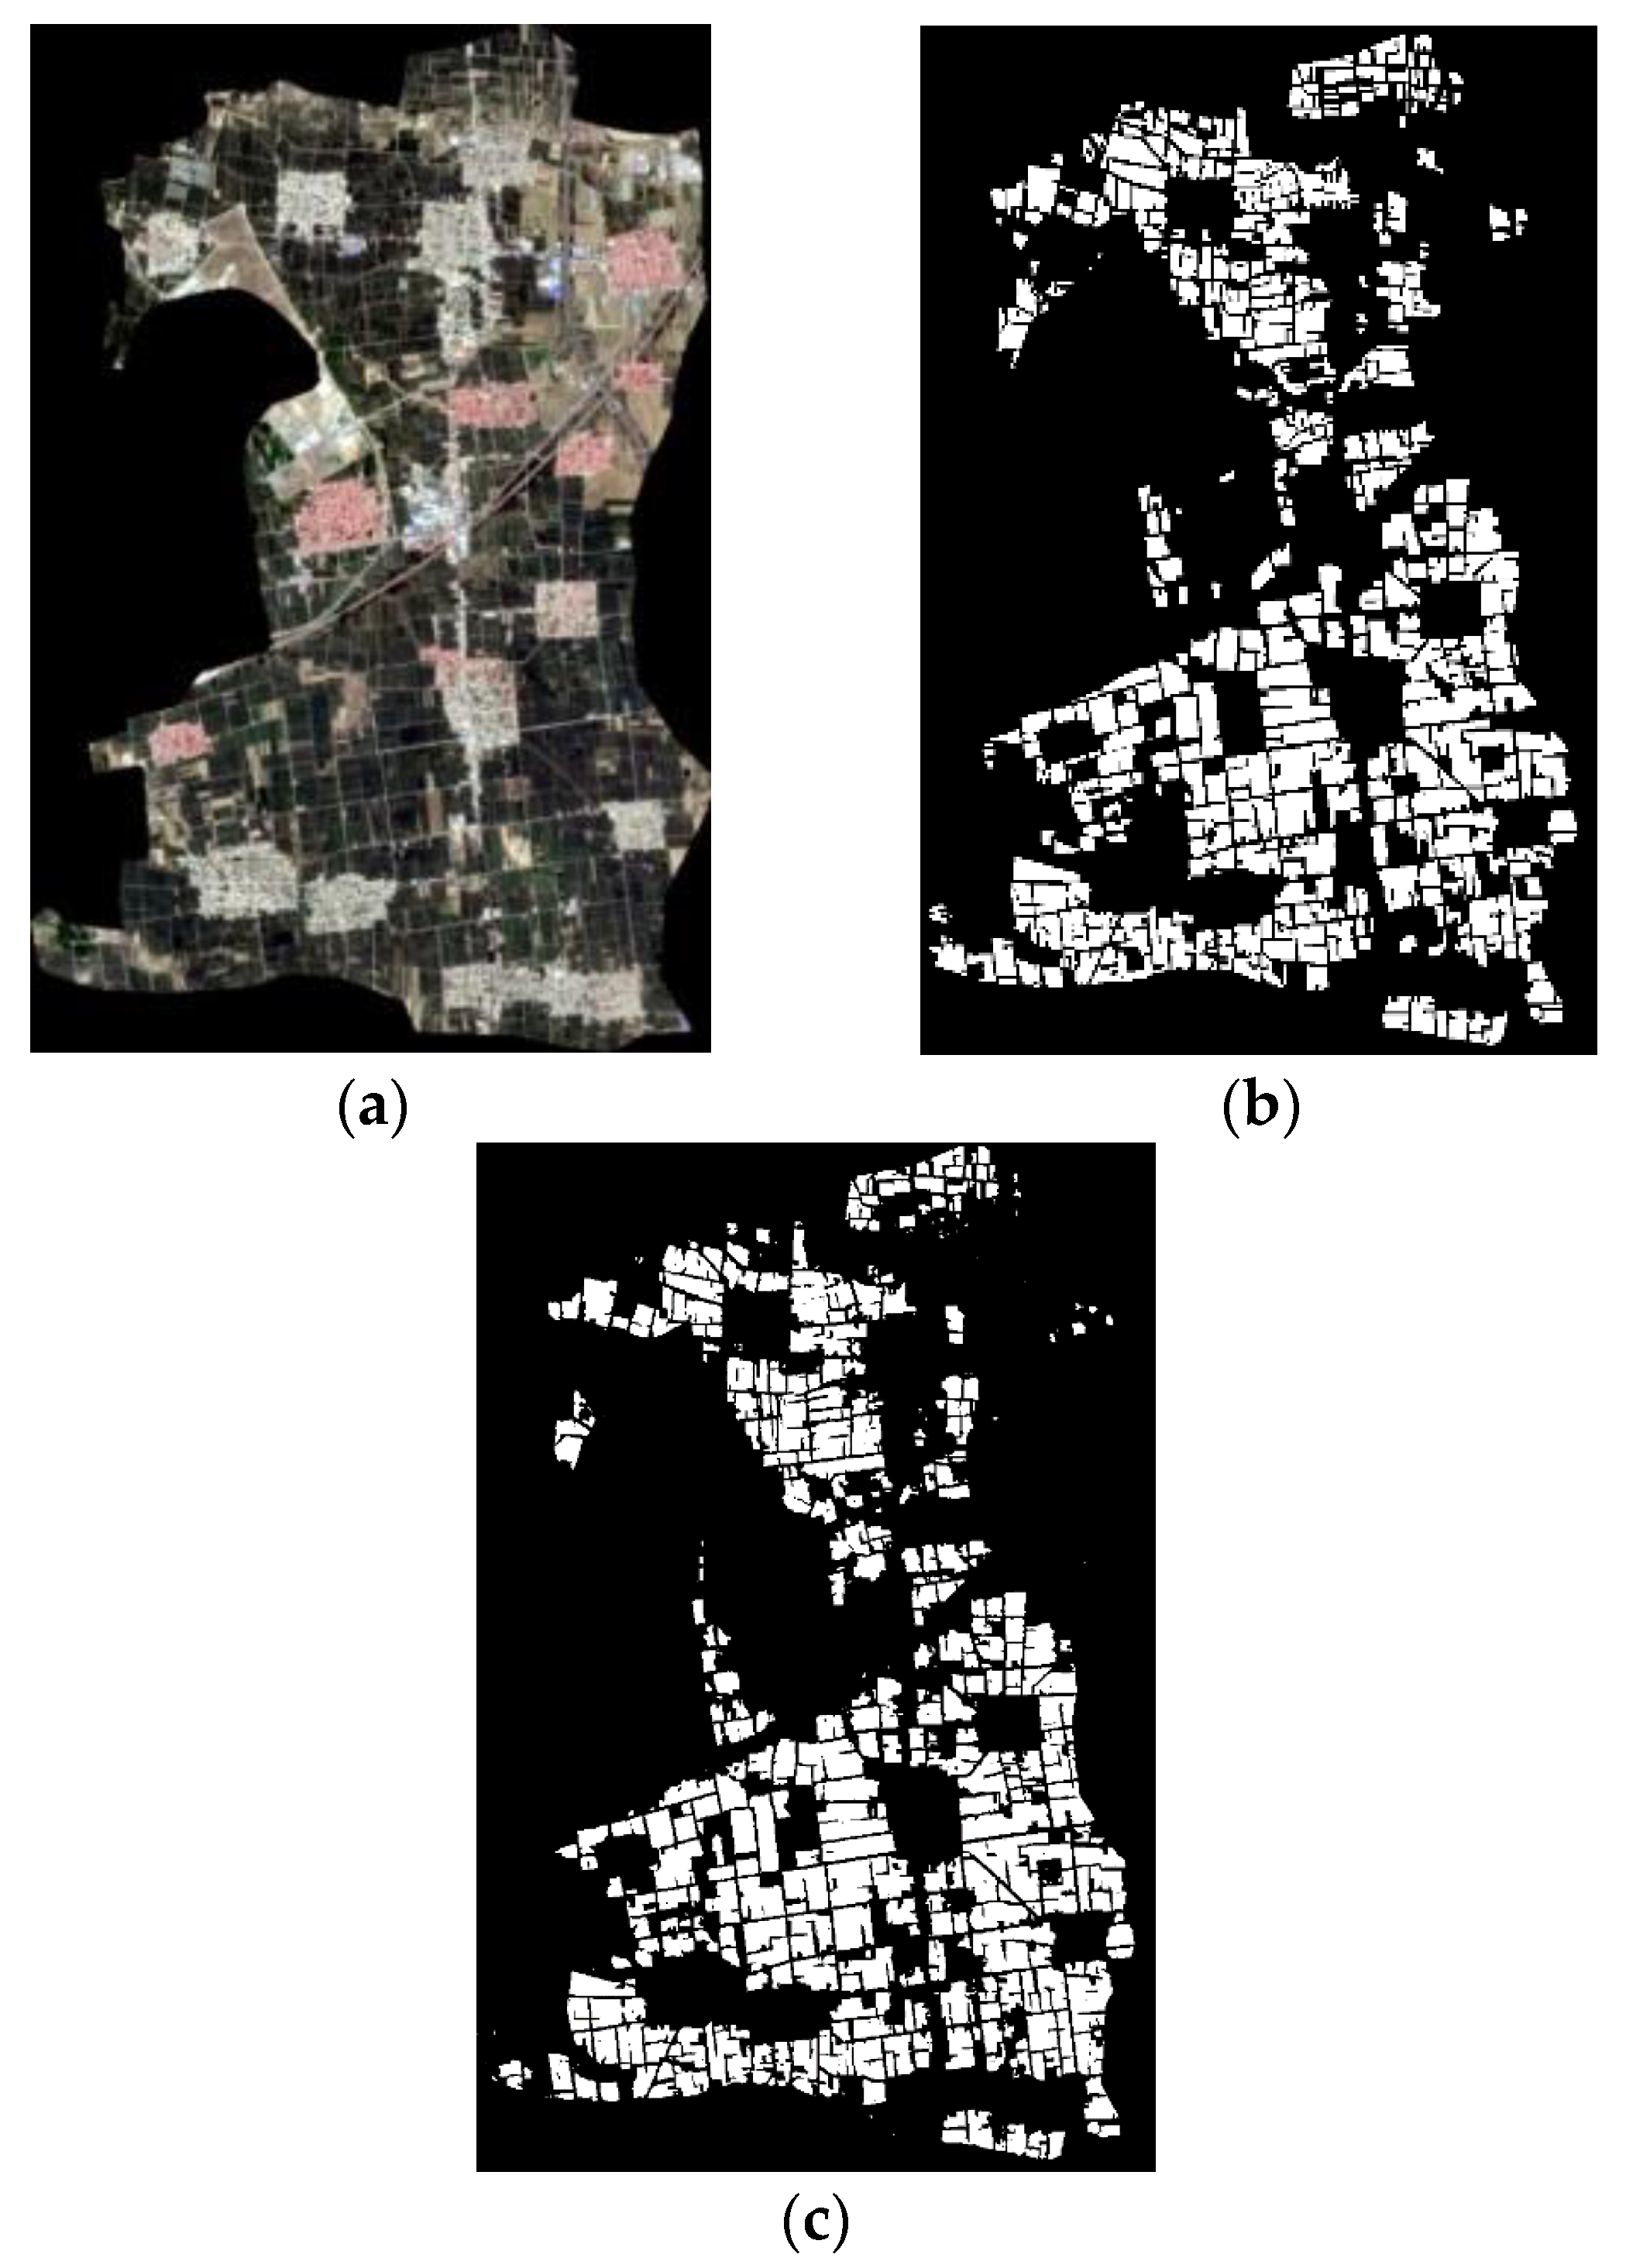
5.1. Identification of Winter Wheat

In order to compare the performance of the four models, SegNet, DeepLabV3+, U-Net, and U-Net-CBAM, the experimental results of two representative areas were selected for comparison—one of which is dominated by agricultural land, and the other is mixed with facility agriculture and buildings—which are representative of the land-use structure of the experimental area.
Figure 4 and Figure 5 show the two images selected from the test images and the corresponding results using the four methods. It can be seen that the U-Net-CBAM model misclassified only a small number of pixels in the corners of the winter-wheat growing area. In the SegNet results, DeepLabV3+ results, U-Net results, and U-Net-CBAM results, the misclassified pixels were mainly distributed at the junction of winter-wheat and nonwinter-wheat areas, including the edges and corner locations. The number of misclassified pixels in the U-Net-CBAM model results was lower than that of DeepLabV3+, and the SegNet results had the largest number of errors. Among them, the shapes extracted by the U-Net-CBAM algorithm matched well with the actual regions in the larger winter-wheat growing regions, and the other algorithms had more edge errors. The U-Net-CBAM algorithm showed a better level of performance than did the other algorithms in processing the images.
After the models were trained, the test set images from the Sentinel-2 dataset were used as input for the models, which automatically extract features from the images and make predictions for each pixel to determine its type, finally obtaining the classification results.
As shown in Figure 6, the U-Net-CBAM model trained on the Sentinel-2 image dataset was used to accurately extract the winter-wheat growing areas in Zengcun town.

5.2. Comparison of Identified Results

Table 4 shows the confusion matrix of the segmentation results of the model trained with the training sets from the GF-6 image dataset and Sentinel-2 image dataset, respectively. Each row of the confusion matrix indicates the proportion of the actual category, and each column indicates the proportion of the predicted category. From the confusion matrix of the four models, it can be seen that U-Net-CBAM achieved better classification results on both the GF-6 image dataset and the Sentinel-2 image dataset. The percentages of “Winter Wheat” misclassified as “Nonwinter Wheat” and “Nonwinter Wheat” misclassified as “Winter Wheat” were 0.055 and 0.035, respectively. The percentages of “Nonwinter Wheat” misclassified as “Winter Wheat” were 0.033 and 0.031, respectively.
Table 5 shows the evaluation criteria values of the four models on the image datasets of the GF-6 image dataset and the Sentinel-2 image dataset, respectively. Using the statistical analysis of the experimental results, we can visually observe that the improved models outperformed the original models in all five of the evaluation metrics. Compared with SegNet, DeepLabV3+, and U-Net, U-Net-CBAM performed the best in terms of accuracy, MIoU, OA, and F1. In addition, the accuracy and MIoU of U-Net-CBAM are significantly higher than those of U-Net, with a 4.2% and a 3.6% improvement over U-Net on the GF-6 dataset and a 2.9% and a 2.9% improvement over U-Net on the Sentinel-2 dataset, respectively. This implies that the introduction of an attention mechanism in the U-Net network to improve the accuracy of extracting winter -wheat planting areas is effective. In the experiment, we trained the model on the Sentinel-2 and GF-6 datasets, respectively, and then tested the segmentation performance of the model on the Sentinel-2 test set. It can be observed that all the models trained by the Sentinel-2 dataset showed better performance in the Sentinel-2 test set. The phenomenon shows that the segmentation performance of the training and test sets from different datasets is much lower than that from the same dataset. In other words, cross-dataset or cross-domain segmentation is still a challenging problem.

6. Conclusions

The extraction of winter-wheat planting areas using satellite remote sensing has become a mainstream method, but the field edge results are usually coarse, leading to a decrease in OA. U-Net can significantly improve the OA of remote sensing image segmentation results, but there are certain misclassified pixels in adjacent land-use types in the segmentation results. In this study, by adding an attention mechanism to the basic convolutional unit of the U-Net network to amplify the important features, the U-Net-CBAM model was used to achieve the accurate extraction of winter-wheat planting areas from high-resolution multisource remote sensing images.
It can be seen from the comparison experiments that the proposed model performs better, and most of the evaluation indices are better than those of the comparison classification algorithms. In the experimental design, the dataset we selected always has errors because of manual labeling. Future research should try to use semi-supervised classification to reduce the reliance on pixel label files, further improve the accuracy and efficiency of winter-wheat planting-area extraction from high-resolution multisource remote sensing images, and cope with more complex application scenarios.

Author Contributions

J.Z. and Y.L. conceived and designed the experiments; J.W. and H.Q. performed the experiments; J.W. and Y.Z. analyzed the data; J.Z., J.W. and Y.L. wrote the paper. All authors have read and agreed to the published version of the manuscript.

Funding

This research was funded by the Natural Science Foundation of Anhui Province (2008085MF184), the National Natural Science Foundation of China (31971789), and the Science and Technology Major Project of Anhui Province (202003a06020016).

Informed Consent Statement

Not applicable.

Acknowledgments

The authors would like to acknowledge the support for experimental design and data collection from the National Engineering Research Center for Information Technology in Agriculture.

Conflicts of Interest

The authors declare no conflict of interest.

References

  1. Chen, Z.; Liu, H.; Zhou, Q.; Yang, G.; Liu, J. Sampling and scaling scheme for monitoring the change of winter wheat acreage in China. Trans. Chin. Soc. Agric. Eng. 2000, 16, 126–129. [Google Scholar]
  2. Jiao, X.; Yang, B.; Pei, Z. Paddy rice area estimation using a stratified sampling method with remote sensing in China. Trans. Chin. Soc. Agric. Eng. 2006, 22, 105–110. [Google Scholar]
  3. Ma, Q.; Min, X.; Xu, X. Initial application of satellite remote sensing technology in agricultural investigation. J. Chin. Agri. Resour. Regional Plann. 2003, 24, 14–16. [Google Scholar]
  4. Wu, M.; Yang, L.; Yu, B.; Wang, Y.; Zhao, X.; Niu, Z.; Wang, C. Mapping crops acreages based on remote sensing and sampling investigation by multivariate probability proportional to size. Trans. Chin. Soc. Agric. Eng. 2014, 30, 146–152. [Google Scholar]
  5. Georgi, C.; Spengler, D.; Itzerott, S.; Kleinschmit, B. Automatic delineation algorithm for site-specific management zones based on satellite remote sensing data. Precision Agric. 2018, 19, 684–707. [Google Scholar] [CrossRef] [Green Version]
  6. Wang, D.; Fang, S.; Yang, Z.; Wang, L.; Tang, W.; Li, Y.; Tong, C. A regional mapping method for oilseed rape based on HSV transformation and spectral features. ISPRS Int. J. Geo-Inform. 2018, 7, 224. [Google Scholar] [CrossRef] [Green Version]
  7. Wang, L.; Liu, J.; Yao, B.; Ji, F.; Yang, F. Area change monitoring of winter wheat based on relationship analysis of GF-1 NDVI among different years. Trans. Chin. Soc. Agric. Eng. 2018, 34, 184–191. [Google Scholar]
  8. Dribault, Y.; Chokmani, K.; Bernier, M. Monitoring seasonal hydrological dynamics of minerotrophic peatlands using multi-date GeoEye-1 very high resolution imagery and object-based classification. Remote Sens. 2012, 4, 1887–1912. [Google Scholar] [CrossRef] [Green Version]
  9. Rodriguez-Galiano, V.F.; Ghimire, B.; Rogan, J.; Chica-Olmo, M.; Rigol-Sanchez, J.P. An assessment of the effectiveness of a random forest classifier for land-cover classification. ISPRS J. Photogramm. Remote Sens. 2012, 67, 93–104. [Google Scholar] [CrossRef]
  10. Song, D.; Zhang, C.; Yang, X.; Li, F.; Han, Y.; Gao, S.; Dong, H. Extracting winter wheat spatial distribution information from GF-2 image. J. Remote Sens. 2020, 24, 596–608. [Google Scholar]
  11. Hu, Q.; Wu, W.; Xia, T.; Yu, Q.; Yang, P.; Li, Z.; Song, Q. Exploring the use of Google Earth imagery and object-based methods in land use/cover mapping. Remote Sens. 2013, 5, 6026–6042. [Google Scholar] [CrossRef] [Green Version]
  12. Chen, Y.; Lin, Z.; Zhao, X.; Wang, G.; Gu, Y. Deep learning-based classification of hyperspectral data. IEEE J. Sel. Topics Appl. Earth Observ. Remote Sens. 2014, 7, 2094–2107. [Google Scholar] [CrossRef]
  13. Jiang, T.; Liu, X.; Wu, L. Method for mapping rice fields in complex landscape areas based on pre-trained convolutional neural network from HJ-1 A/B data. ISPRS Int. J. Geo-Inform. 2018, 7, 418. [Google Scholar] [CrossRef] [Green Version]
  14. Li, C.; Chen, W.; Wang, Y.; Ma, C.; Wang, Y. Extraction of winter wheat planting area in county based on multi-sensor sentinel data. Trans. Chin. Soc. Agric. Mach. 2021, 52, 207–215. [Google Scholar]
  15. Ge, G.; Li, W.; Jing, Y. Area of winter wheat extracted on NDVI density slicing. J. Triticeae Crops 2014, 34, 997–1002. [Google Scholar]
  16. Bazzi, H.; Baghdadi, N.; El Hajj, M.; Zribi, M.; Minh, D.H.T.; Ndikumana, E.; Courault, D.; Belhouchette, H. Mapping paddy rice using Sentinel-1 SAR time series in Camargue, France. Remote Sens. 2019, 11, 887. [Google Scholar] [CrossRef] [Green Version]
  17. Yang, C.; Everitt, J.H.; Murden, D. Evaluating high resolution SPOT 5 satellite imagery for crop identification. Comput. Electron. Agric. 2011, 75, 347–354. [Google Scholar] [CrossRef]
  18. Mansaray, L.R.; Wang, F.; Huang, J.; Yang, L.; Kanu, A.S. Accuracies of support vector machine and random forest in rice mapping with Sentinel-1A, Landsat-8 and Sentinel-2A datasets. Geocarto Int. 2020, 35, 1088–1108. [Google Scholar] [CrossRef]
  19. Li, D.R.; Zhang, L.P.; Xia, G.S. Automatic analysis and mining of remote sensing big data. Acta Geod. Cartogr. Sinica 2014, 43, 1211–1216. [Google Scholar]
  20. Zhong, Y.; Lin, X.; Zhang, L. A support vector conditional random fields classifier with a Mahalanobis distance boundary constraint for high spatial resolution remote sensing imagery. IEEE J. Sel. Topics Appl. Earth Observ. Remote Sens. 2014, 7, 1314–1330. [Google Scholar] [CrossRef]
  21. Fu, T.; Ma, L.; Li, M.; Johnson, B.A. Using convolutional neural network to identify irregular segmentation objects from very high-resolution remote sensing imagery. J. Appl. Remote Sens. 2018, 12, 025010. [Google Scholar] [CrossRef]
  22. Liang, X.; Liu, S.; Shen, X.; Yang, J.; Liu, L.; Dong, J.; Lin, L.; Yan, S. Deep human parsing with active template regression. IEEE Trans. Pattern Anal. Mach. Intell. 2015, 37, 2402–2414. [Google Scholar] [CrossRef] [PubMed] [Green Version]
  23. Hao, H.; Liu, W.; Xing, W.; Zhang, S. Multilabel learning based adaptive graph convolutional network for human parsing. Pattern Recogn. 2022, 127, 108593. [Google Scholar] [CrossRef]
  24. Wu, M.C.; Alkhaleefah, M.; Chang, L.; Chang, Y.L.; Shie, M.H.; Liu, S.J.; Chang, W.Y. Recurrent deep learning for rice fields detection from SAR images. In Proceedings of the IEEE International Geoscience and Remote Sensing Symposium, Waikoloa, HI, USA, 26 September–2 October 2020; pp. 1548–1551. [Google Scholar]
  25. Sun, Z.; Di, L.; Fang, H.; Burgess, A. Deep learning classification for crop types in north dakota. IEEE J. Sel. Topics Appl. Earth Observ. Remote Sens. 2020, 13, 2200–2213. [Google Scholar] [CrossRef]
  26. Huang, Y.; Tang, L.; Jing, D.; Li, Z.; Tian, Y.; Zhou, S. Research on crop planting area classification from remote sensing image based on deep learning. In Proceedings of the 2019 IEEE International Conference on Signal, Information and Data Processing (ICSIDP), Chongqing, China, 11–13 December 2019; pp. 1–4. [Google Scholar]
  27. Ji, S.; Zhang, C.; Xu, A.; Shi, Y.; Duan, Y. 3D convolutional neural networks for crop classification with multi-temporal remote sensing images. Remote Sens. 2018, 10, 75. [Google Scholar] [CrossRef] [Green Version]
  28. Zhao, X.; Yuan, Y.; Song, M.; Ding, Y.; Lin, F.; Liang, D.; Zhang, D. Use of unmanned aerial vehicle imagery and deep learning unet to extract rice lodging. Sensors 2019, 19, 3859. [Google Scholar] [CrossRef] [PubMed] [Green Version]
  29. Du, Z.; Yang, J.; Ou, C.; Zhang, T. Smallholder crop area mapped with a semantic segmentation deep learning method. Remote Sens. 2019, 11, 888. [Google Scholar] [CrossRef] [Green Version]
  30. Shijiazhuang City Bureau of Statistics. Shijiazhuang Statistical Yearbook-19; China Statistics Publishing House: Beijing, China, 2020.
  31. Broeske, M.; Gaska, J.; Roth, A. Winter Wheat Development and Growth Staging, Netrient and Pest Management Program; University of Washington Madison: Madison, WI, USA, 2022. [Google Scholar]
  32. Li, S.; Zhao, L.; Li, J.; Chen, Q. Segmentation of Hippocampus based on 3DUnet-CBAM Model. In Proceedings of the 4th IEEE International Conference on Advanced Electronic Materials, Computers and Software Engineering (AEMCSE), Changsha, China, 26–28 March 2021; pp. 595–599. [Google Scholar]
  33. Cun, X.; Pun, C.-M. Improving the harmony of the composite image by spatial-separated attention module. IEEE Trans. Image Process. 2020, 29, 4759–4771. [Google Scholar] [CrossRef] [PubMed] [Green Version]
  34. Woo, S.; Park, J.; Lee, J.Y.; Kweon, I.S. Cbam: Convolutional block attention module. In Proceedings of the European Conference on Computer Vision (ECCV), Munich, Germany, 8–14 September 2018; pp. 3–19. [Google Scholar]
  35. Ronneberger, O.; Fischer, P.; Brox, T. U-net: Convolutional networks for biomedical image segmentation. In Proceedings of the International Conference on Medical Image Computing and Computer-Assisted Intervention, Munich, Germany, 5–9 October 2015; pp. 234–241. [Google Scholar]
  36. Hu, H.; Li, Z.; Li, L.; Yang, H.; Zhu, H. Classification of very high-resolution remote sensing imagery using a fully convolutional network with global and local context information enhancements. IEEE Access 2020, 8, 14606–14619. [Google Scholar] [CrossRef]
  37. Breuel, T.M. The effects of hyperparameters on SGD training of neural networks. arXiv 2015, arXiv:1508.02788. [Google Scholar]
  38. Kingma, D.P.; Ba, J. Adam: A method for stochastic optimization. arXiv 2014, arXiv:1412.6980. [Google Scholar]
  39. Wang, H.; Wang, Y.; Zhang, Q.; Xiang, S.; Pan, C. Gated convolutional neural network for semantic segmentation in high-resolution images. Remote Sens. 2017, 9, 446. [Google Scholar] [CrossRef]
Figure 1. Geographic location of the study area using a Sentinel-2 remote sensing image.
Agronomy 12 02965 g001
Figure 2. Structural diagram of the convolutional block attention module.
Agronomy 12 02965 g002
Figure 3. Structural diagram of the U-Net-CBAM network.
Agronomy 12 02965 g003
Figure 4. Prediction results using the GF-6 dataset used as training dataset: (a) Sentinel-2 original image, (b) label, (c) SegNet, (d) DeepLabV3+, (e) U-Net, (f) U-Net-CBAM.
Agronomy 12 02965 g004
Figure 5. Prediction results using the Sentinel-2A dataset as training dataset: (a) Sentinel-2 original image, (b) label, (c) SegNet, (d) DeepLabV3+, (e) U-Net, (f) U-Net-CBAM.
Agronomy 12 02965 g005
Figure 6. Mapping winter-wheat planting areas in Zengcun County: (a) Sentinel-2 original image, (b) label, (c) U-Net-CBAM prediction results using the Sentinel-2A dataset as training dataset.
Agronomy 12 02965 g006
Table 1. Primary winter-wheat growth cycles in the study area.
Growth CycleTimePhotoGrowth CycleTimePhoto
Seed sowingEarly OctoberAgronomy 12 02965 i001ElongationMid- to late April
of the following year
Agronomy 12 02965 i002
Seedling emergenceMid- to late OctoberAgronomy 12 02965 i003HeadingEarly May of the
following year
Agronomy 12 02965 i004
TilleringNovemberAgronomy 12 02965 i005Milk-ripeningMid-May to early
June of the following year
Agronomy 12 02965 i006
WinteringJanuary to early March
of the following year
Agronomy 12 02965 i007MaturingMid- to late June
of the following year
Agronomy 12 02965 i008
RevivingMid-March to early
April of the following year
Agronomy 12 02965 i009
Table 2. Parameter information for the Sentinel-2A and GF-6 satellite sensors.
Satellite NameBand NumberBand NameSpectral Range (μm)Spatial Resolution (m)
Sentinel-2AB1Coastal Aerosol0.433–0.53360
B2Blue0.458–0.52310
B3Green0.543–0.57810
B4Red0.65–0.6810
B5Vegetation Red Edge0.698–0.71320
B6Vegetation Red Edge0.733–0.74820
B7Vegetation Red Edge0.773–0.79320
B8NIR0.785–0.910
B8ANarrow NIR0.855–0.87520
B9Water Vapor0.935–0.95560
B10SWIR-Cirrus1.36–1.3960
B11SWIR1.565–1.65520
B12SWIR2.1–2.2820
GF-6PPanchromatic0.45–0.902
B1Blue0.45–0.528
B2Green0.52–0.608
B3Red0.63–0.698
B4NIR0.76–0.908
Table 3. Determination of hyperparameters for the U-Net-CBAM model.
HyperparameterValue
Batch size4
Learning rate0.0001
Beta1 for Adam0.5
Beta2 for Adam0.999
Epochs100
Table 4. Confusion matrix of winter wheat classification.
DatasetsApproachPredictedWinter WheatNonwinter Wheat
GF-6
dataset
SegNetWinter wheat0.7720.021
Nonwinter wheat0.1030.104
DeepLabV3+Winter wheat0.7590.033
Nonwinter wheat0.0750.133
U-NetWinter wheat0.7660.025
Nonwinter wheat0.0780.131
U-Net-CBAMWinter wheat0.7610.033
Nonwinter wheat0.0550.151
Sentinel-2
dataset
SegNetWinter wheat0.7640.029
Nonwinter wheat0.0620.145
DeepLabV3+Winter wheat0.7660.026
Nonwinter wheat0.0460.162
U-NetWinter wheat0.7650.029
Nonwinter wheat0.0480.158
U-Net-CBAMWinter wheat0.7620.031
Nonwinter wheat0.0350.172
Table 5. Extraction accuracy of winter-wheat planting areas.
DatasetsApproachPrecisionMIoURecallOAF1
GF-6
dataset
SegNet0.7400.6670.8730.8830.782
DeepLabV3+0.8060.7250.8650.8990.831
U-Net0.8070.7350.8840.9050.837
U-Net-CBAM0.8490.7710.8820.9160.864
Sentinel-2
dataset
SegNet0.8380.7660.8890.9150.860
DeepLabV3+0.8810.8150.9100.9340.894
U-Net0.8710.8020.9030.9290.886
U-Net-CBAM0.9000.8310.9070.9390.905
Publisher’s Note: MDPI stays neutral with regard to jurisdictional claims in published maps and institutional affiliations.

