Article

Water Saving Using Thermal Imagery-Based Thresholds for Timing Irrigation in Potatoes under Drip and Furrow Irrigation Systems

1
International Potato Center (CIP), Headquarters P.O. Box 1558, Lima 15024, Peru
2
Water Resources Doctoral Program, Universidad Nacional Agraria La Molina (UNALM), Lima 15024, Peru
3
Applied Meteorology Master Program, Universidad Nacional Agraria La Molina (UNALM), Lima 15024, Peru
4
Academic Department of Statistics and Informatics, Faculty of Economics and Planning, Universidad Nacional Agraria La Molina (UNALM), Lima 15024, Peru
5
CATIE - Centro Agronómico Tropical de Investigación y Enseñanza, Cartago Turrialba 30501, Costa Rica
*
Author to whom correspondence should be addressed.
Agronomy 2022, 12(12), 2921; https://doi.org/10.3390/agronomy12122921
Submission received: 27 October 2022 / Revised: 17 November 2022 / Accepted: 20 November 2022 / Published: 23 November 2022
(This article belongs to the Special Issue Water Saving in Irrigated Agriculture)

Abstract

:
Under the current water crisis in agriculture, irrigation methods for saving and conserving water are necessary. However, these methods must guarantee an appropriate yield with a concomitant economic benefit and a reduced environmental impact. In this study, two irrigation thresholds for irrigation timing (IT) based on thermal imagery were analyzed with the UNICA potato variety in three trials under drip (DI) and furrow (FI) irrigation during 2017–2018 in Lima, Peru. The control (T1) remained at >70% of soil field capacity. For other treatments, thresholds were defined based on stomatal conductance at light saturation (T2: 0.15 and T3: 0.05 mol H 2 O m 2 s 1 ) and crop water stress index (T2: 0.4 and T3: 0.6) based on canopy temperature. An integrated index (IIN) was established for the valuation of treatments using the criteria of high fresh tuber yield (FTY) and a low total amount of irrigated water, production cost (PC), and total C emissions (TE) and using criteria of a score. FI-T2 (0.69–0.72) and DI-T3 (0.19–0.29) showed the highest and lowest IIN value, respectively. FTY in T2 was not significantly reduced under FI, resulting in a lower PC regarding DI–T2 and emphasizing the usefulness of thermal imagery in determining watering schedules in potatoes under furrow irrigation systems.

1. Introduction

Agriculture is regarded as the activity that consumes the highest quantity of fresh water globally (∼70%, [1,2]). Although irrigated agriculture is considered crucial for guaranteeing food production [3], improper irrigation management and governance is one of the leading causes of land degradation, promoting salinization and the reduction of water productivity in crops [4,5,6]. The substantial water risk due to agriculture has been highlighted in the future caused by climate change [7,8], which calls for ways to optimize water use. Potatoes are the third most crucial edible crop worldwide [9] and are also considered one of the most effective water use crops because of its higher energy produced per water volume, which is higher than rice, maize, and other crops [10,11]. Due to its low carbon emissions and water use, the potato is a highly regarded staple crop. Thus, potato cultivation replacing other higher GHG emitter crops (such as rice) is considered an appropriate alternative to mitigate climate change in the future [12]. Concerning irrigated potatoes, water management through alternate and deficit irrigation [13,14], high-tech irrigation, i.e., irrigation techniques that maximize water use by crops and improve irrigation timing [15,16], and decision support methodologies to determine how much [17,18] and when irrigation should occur [19,20,21] have been substantiated. There are fundamental advances regarding procedures to schedule irrigation timing using physiological indicators as thresholds for irrigation scheduling in potatoes. Thus, the early detection of water stress through cameras with infrared sensors has allowed monitoring of the foliage temperature, which is associated with stomatal openness in irrigated potatoes [19,20,21,22,23]. For that purpose, the use of a foliage temperature-based crop water stress index (CWSI) to assess complementary temperatures associated with maximum and minimum leaf transpiration has allowed water savings of between 342–516 m 3 ha 1 [21] using a value <0.4 of CWSI in potato. This CWSI threshold value depends on the kind of irrigation system. Thus, Silva-Díaz et al. [24] suggest that furrow irrigation promotes a short-memory mechanism, allowing more strict thresholds (>0.4) to save water without tuber penalization in comparison to drip irrigation.
Agriculture is one of the most critical worldwide GHG emissions contributors [25,26], and the necessity to include environmental and social indicators in the assessment of agricultural practices has been pointed out. Thus, the use of key performance indicators to achieve “agronomic gain” through improved productivity, resource use efficiency, and soil health has been recently remarked on by Saito et al. [27]. However, the combination of agronomic, environmental, and economic indicators is scarce. In potatoes, for example, besides tuber yield, Qin et al. [15] used C footprint analysis and net return to compare alternate furrow irrigation against drip irrigation. In this study, trials under drip and furrow irrigation using CWSI thresholds to establish timing for irrigation were assessed with the hypothesis that using these thresholds can allow good productivity, water, and money savings and reduce C emissions compared to conventional irrigation. The study aimed to compare the timing of scheduled watering treatments (through CWSI) based on agronomic, environmental, and economic indicators under drip and furrow irrigation systems.

2. Materials and Methods

2.1. Study Description and Experimental Conditions

Three field trials were conducted at the International Potato Center (CIP) and the National Agrarian University La Molina (UNALM) experimental stations in Lima ( 12 4 S, 76 56 W, 244 m.a.s.l.) from 5 July to 10 October 2017 (CIP, Trial A), 5 October 2017 to 15 January 2018 (CIP, Trial B) and 13 June to 13 September 2018 (UNALM, Trial C). The study area belongs to the central coast of Peru, characterized by an arid desert climate [28] with 19.5 ± 0.91 °C, 81.8 ± 1.64%, and 7.1 ± 0.14 mm of average annual temperature, relative humidity, and rain, respectively (2013–2020 CIP-Meteorological Station; see details in Table S1). The soil conditions in these trials were a sandy loam texture with organic matter content, phosphorous, and potassium with ranges between 1.31–1.53%, 14.9–45.9 ppm, and 197.3–273.2 ppm, respectively. Additionally, the average air temperature, relative humidity, and solar radiation remained in the ranges of 14.4–23.2 °C, 63.0–96.8%, and 0.99–22.3 MJ m 2 during the three growing seasons. See more details of the meteorological conditions for Trial A and B–C in Silva et al. [24] and Cucho-Padin et al. [21], respectively.

2.2. Experimental Design and Water Management

The potato cultivar studied was UNICA (CIP code: 392797.22), an early and improved genotype with high-temperature tolerance [29]. Trials A and B were carried out in 24 plots of 3.6 × 12.5 m 2 grouped in 2 blocks (14.4 × 62 m 2 each) under furrow (FI) and drip irrigation (DI). Trial C consisted of 15 sub-plots of 4.5 × 15.8 m 2 under DI in 1738.8 m 2 of total area (the experimental layout is available in the supplementary material of Silva-Díaz et al. [24]). Fertility management for Trials A and B consisted of 180, 100, and 160 kg ha 1 of N, P 2 O 5 , and K 2 O, respectively, and Trial C was done through fertigation, dissolving the fertilizers in 250 L tank using 160, 80, and 180 kg ha 1 as a source of N, P 2 O 5 , and K 2 O, respectively. Additionally, in Trial C, doses of 60 and 30 kg ha 1 were supplied as CaO and MgO, respectively. The plant density was 3.7 plants m 2 for all the trials, using 120 and 180 plants per plot in Trials A and B and Trial C, respectively. Chemical applications for disease-pest controls were applied under an integrated pest management program for all the trials, such as Rugby 10G (Farmagro, Peru), Trigard 75 WP (Syngenta, Switzerland) and Movento 150 OD (Bayer AG, Germany), with doses of 10 kg ha 1 , 0.15 kg ha 1 and 0.50 L ha 1 , respectively. Additionally, Vertimec 1.8 EC (Syngenta, Switzerland) and Sunfire 24 SC (BASF, Brazil) were applied with doses of 0.5 and 0.25 L ha 1 , respectively, for Trial A and Evisetc-S (Arysta, Cary, NC, USA) and Sorba 50 EC (Farmagro, Peru) with doses of 0.60 kg ha 1 and 0.55 L ha 1 , respectively, for Trial B. Ethological controls were realized by installing yellow and pheromone traps in all trials. Before every irrigation, soil samples (from 0–0.3 m in depth) were collected randomly in each plot using a soil sampler. Water content was calculated using the gravimetric method [24]. FI was performed by pumping groundwater to the furrows with approximately 0.22 m 3 min 1 flow per irrigation. In contrast, the DI system of non-pressure compensation consisted of two drip tapes (Aqua-Traxx PBX, Toro, Bloomington, MN, USA) per furrow (separated 0.35 m) at a distance between emitters of 0.20 m and using an emitter flow rate of 1.49 ± 0.05 L h 1 at 0.05 MPa. A motor pump supplied the water with 1 hp (Venus 33M, ESPA, Banyoles, Spain ) connected to a polyethylene tank of 5000 L capacity. Both irrigation systems were set up independently per plot; in FI, the irrigation was carried out by controlling the time of entry of the water until it filled all the furrows of the plot. DI was carried out by measuring the irrigation time per plot and using the methodology used by Silva-Díaz et al. [24] to estimate the irrigation volume per plot.
The assessed treatments were arranged in each block using a completely randomized block design (see the experimental layout in Silva-Díaz et al. [24]). The control treatment (T1) consisted of plots under full irrigation, maintaining the soil moisture higher than 70% of field capacity through periodic samplings of soil moisture in each plot. Two irrigation timing treatments (T2 and T3) were compared against the control. In Trial A, thresholds of stomatal conductance ( g s _ m a x ) of 0.15 and 0.05 mol H 2 O m 2 s 1 were defined as T2 and T3, respectively. A portable photosynthesis system (LI-6400 XT, LI-COR Biosciences, Lincoln, NE, USA) configured at 400 ppm of CO 2 , 500 µmol s 1 of airflow, 1500 µmol m 2 s 1 of PAR (light saturation point) and 1.1–1.8 kPa of pressure deficit were used for g s _ m a x inspections. These inspections were realized between 8:00 and 11:00 a.m. on 3 target (central) plants per subplot and on the apical leaflet of the third young leaf per plant. Irrigation timing for trials B and C were defined using CWSI thresholds of 0.4 and 0.6. Canopy temperature was measured using a handheld thermal camera (Model E60, FLIR Systems Inc., Sweden) covering six target plants in the middle of the assessed plot. CWSI was calculated using the empirical methods applied to potatoes [19,20,23]. For this, canopy temperature, dry temperature, and wet surface reference were used for the estimations following the equation described by Cucho-Padin et al. [21]. The dry temperature was considered 13 °C and 7 °C above the air temperature acquired from the meteorological station (HOBO U30 model, Onset Computer Corporation, Bourne, MA, USA) for Trial B (hot season) and Trial C (wet season), respectively. Finally, the assessment frequency for g s _ m a x in Trial A was monitored every 2 days after tuber initiation onset, occurred at 30 days after planting (start of treatment).

2.3. Agronomic, Environmental and Economic Indicators for Potato Production

The environmental indicator used in this study was total carbon emissions (TE, kg CO 2 eq. t 1 ), which was estimated using the “Cool Farm Tool—Potato” model (CFT-Potato, version 2), developed by the Sustainable Food Lab [30]. CFT-Potato is based on crop management information (yield, amountn of seeds, planting and harvest date, fertilizer and irrigation water applied, and amount of chemical pesticides), soil characteristics, and energy used [31] (see details in Table S2). The production cost (PC) was used as an economic indicator, and it was calculated using asset and operation costs for each treatment (including the cost of fertilizer and pesticides, seeds, water, and labor). Additionally, the benefit-cost ratio (BCR) was calculated using PC over gross returns [32]. All trials used fresh tuber yield (FTY, t ha 1 ) and total irrigated water (IW, m 3 ha 1 ) as agronomic indicators.

2.4. Integrated Index

An integrated index (IIN) was calculated combining all the indicators per trial. Thus, FTY, IW, TE, and PC were divided into ten parts considering the maximum and minimum values, and each value was assigned a score from 1 to 10. IW, TE, and PC were inverted, so IIN obtained higher values with high FTY and low IW, TE, and PC. A last criterion of importance was introduced for each indicator depending on user preference: unimportant, moderately important, and highly important, with 1, 2, and 3 weighting importance values, respectively. IIN was calculated as follows:
IIN = sFTY × wFTY + sPC × wPC + sIW × wIW + sTE × wTE
where sFTY, sPC, sIW, and sTE were the score values of FTY, PC, IW, and TE, respectively, divided by the maximum score (10); wFTY, wPC, wIW, and wTE were the importance weighting value (1–3) divided by the sum of maximum weightings (12) corresponding to FTY, PC, IW, and TE, respectively. Seven scenarios were analyzed considering the weighted importance value for each indicator: (I) 3 for FTY and 1 for all other indicators, (II) 3 for FTY, 2 for PC, and 1 for all other indicators, (III) 3 for FTY and PC, and 1 for all other indicators, (IV) 3 for FTY and PC, 2 for IW, and 1 for TE, (V) 3 for FTY, PC and IW, and 1 for TE, (VI) 3 for FTY, PC and IW, and 2 for TE, and (VII) 3 for all the indicators. Different scenarios represented a transition of the user from considering prioritization based only on yield (classical agronomic perspective, scenario I) to move for a more sustainable view of prioritization considering economic and environmental criteria (scenario VII).

2.5. Data Analysis and Statistics

A mixed linear model using PROC MIXED (SAS software version 9.2, SAS Institute Inc., Cary, NC, USA ) was run to analyze the effect of the irrigation system (IS) and timing of irrigation treatments (IT) in the used indicators (Section 3.2). IS and IT factors and trials were considered as fixed and random effects, respectively. The restricted maximum likelihood (REML) criterion at the convergence method was used (details in SAS [33]). A principal component analysis (PCA) was run to analyze the weight of the indicators in the ordination of all the plots under different trials, IS and IT. The components with eigenvalues >1 (“Kaiser Criterion”, [34]) were selected for the analysis. PCA was conducted using the R software [35].

3. Results

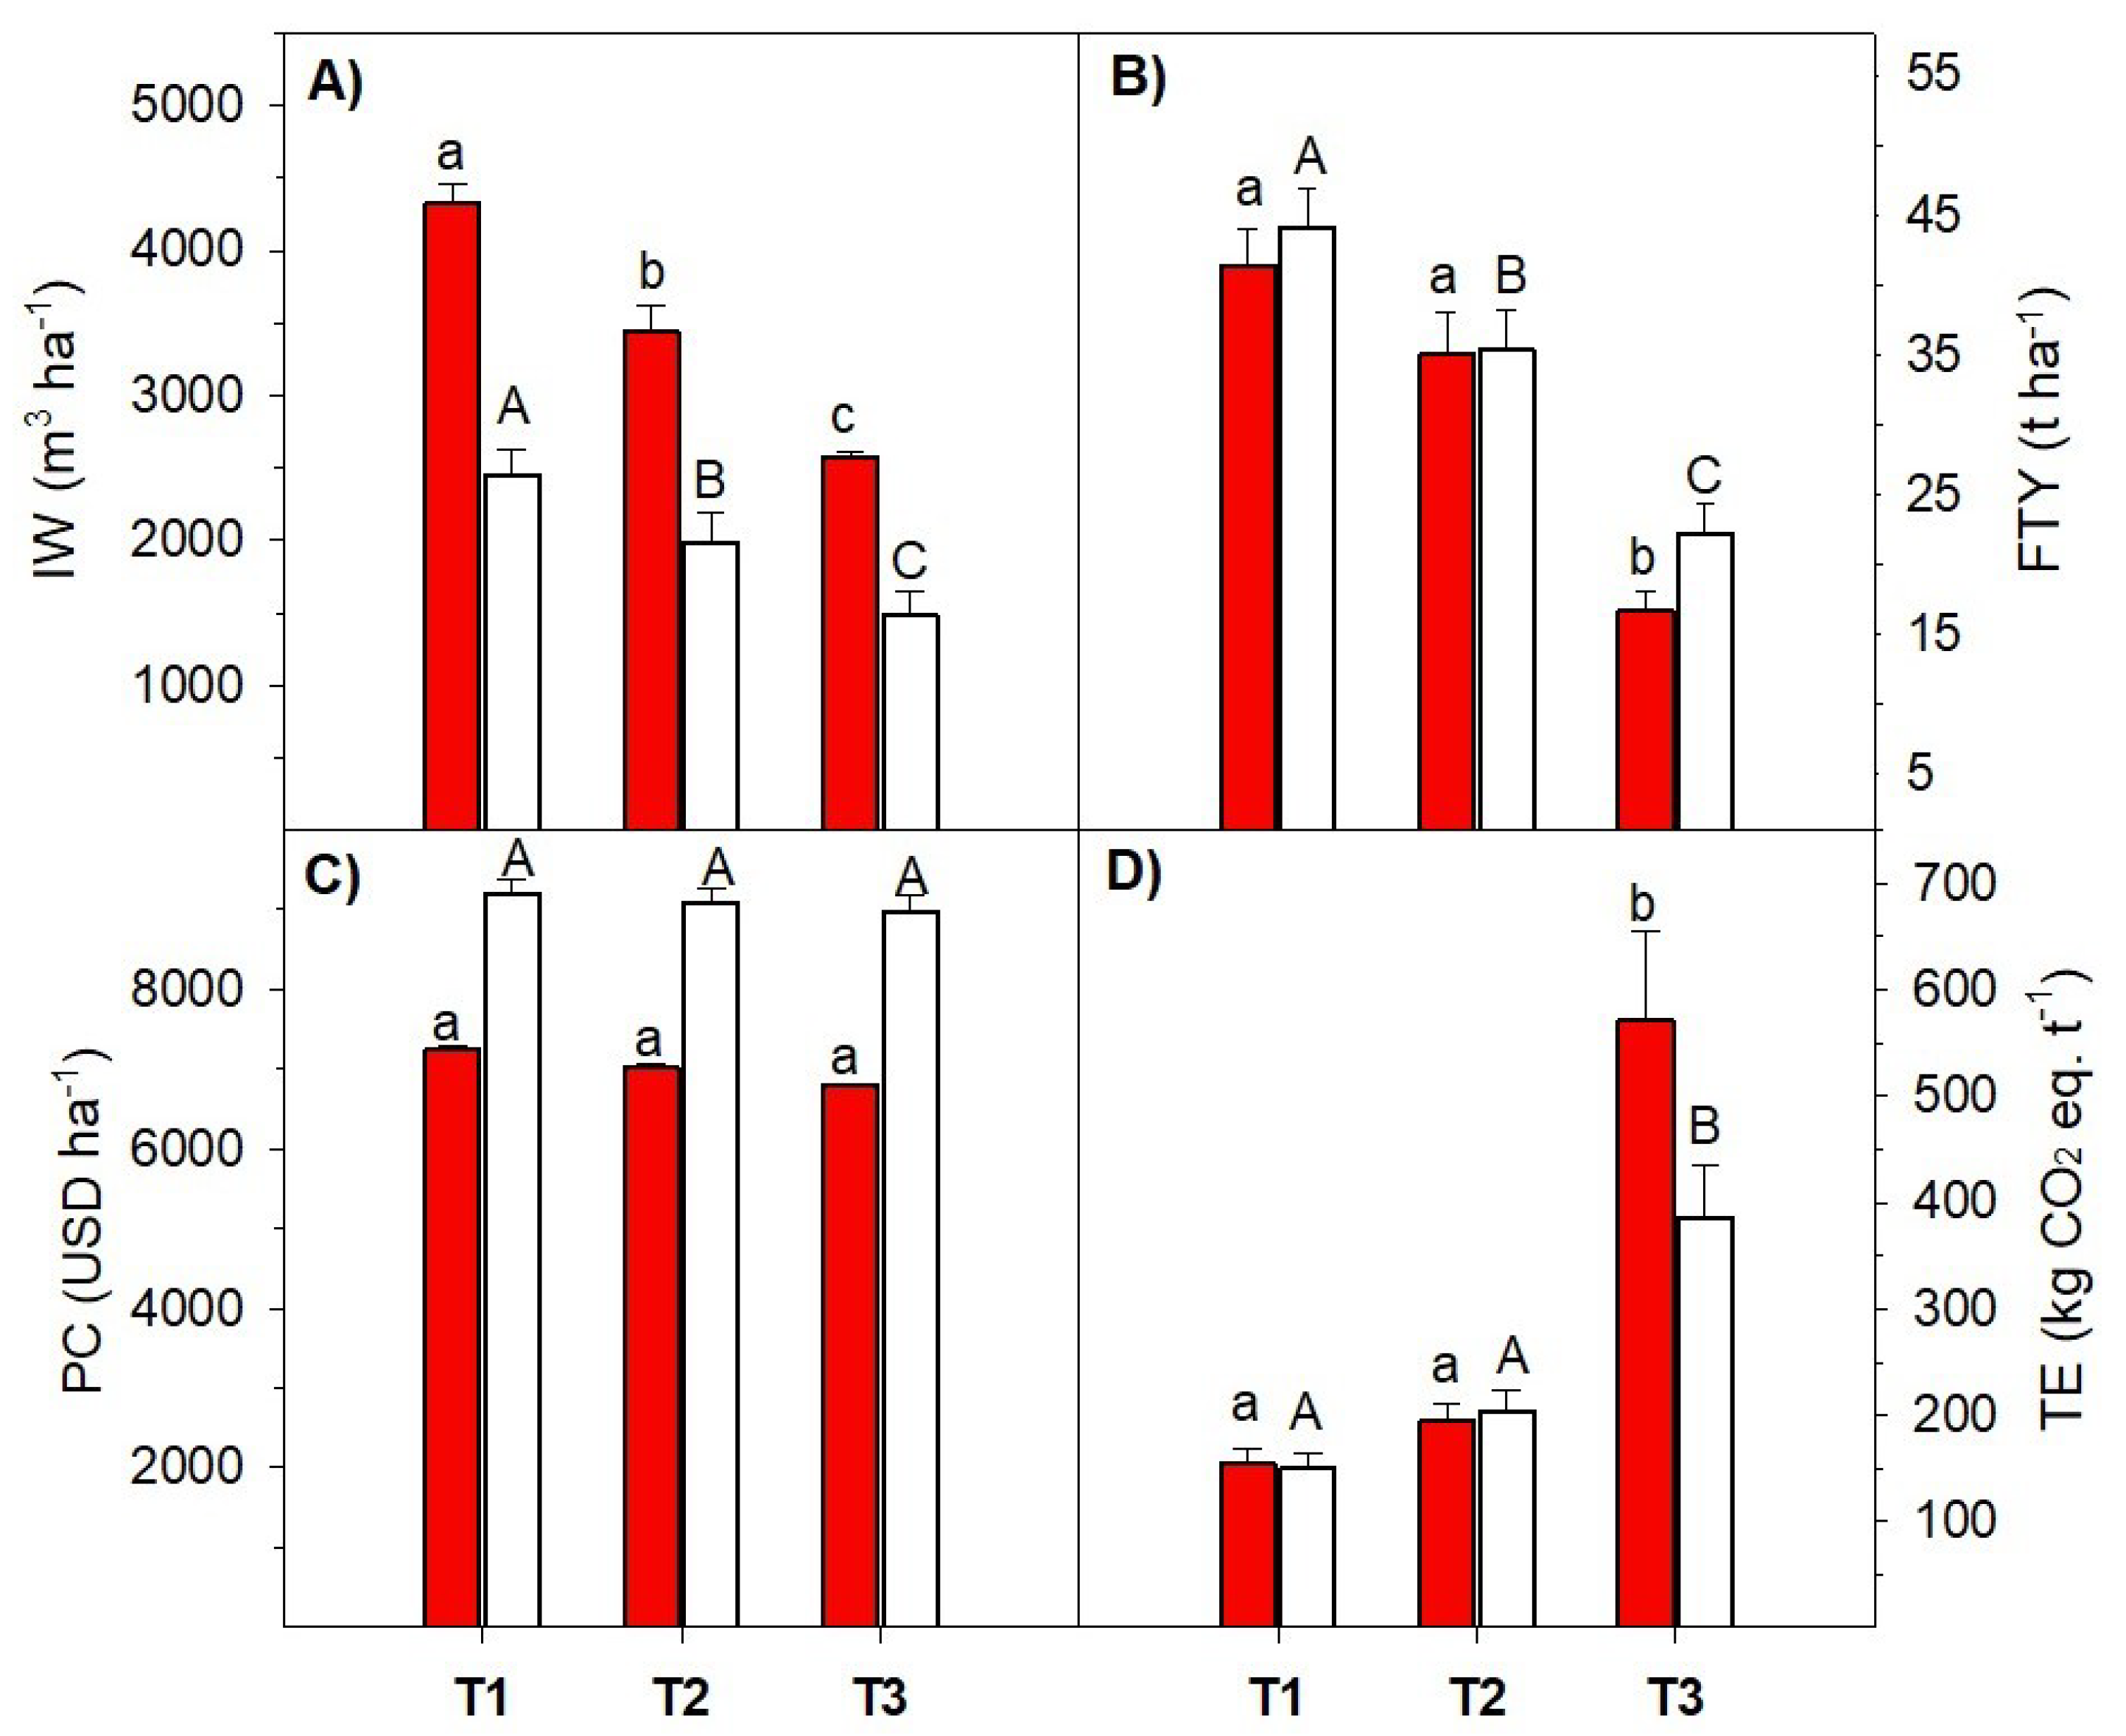
3.1. Timing Schedule Watering Treatments and Irrigation Systems Effects on Assessed Indicators

The ANOVA showed significant effects of irrigation timing treatments (IT) in all of the assessed indicators, whereas the interaction IS × IT was significant for IW and PC (Table 1). The trial’s effect (random factor) did not show significant variations in most indicators (except FTY, data not shown). IW ranged between 2425.8–4848.8 and 696.0–3470.5 m 3 ha 1 for FI and DI, respectively. On average, FI spent 1878.4, 1447.1, and 889.2 m 3 ha 1 more IW than DI in T1, T2, and T3, respectively (Figure 1A). The use of water irrigation thresholds significantly reduced the IW in both irrigation systems (Figure 1A). FTY ranged between 9.8–58.1 and 12.4–57.7 t ha 1 for FI and DI, respectively. FTY showed an average reduction of 6.3, 1.1 and 28.5% under FI compared to DI in T1, T2 and T3, respectively (Figure 1B). Under FI, FTY under T1 and T2 was significantly higher than FTY-T3, and under DI, the use of water irrigation thresholds significantly reduced the yield (Figure 1B). PC ranged between 6765.7–7371.5 and 8395.4–9986.3 USD ha 1 for FI and DI, respectively. This indicator was 21.2, 22.8, and 24.3% higher under DI than FI in T1, T2, and T3, respectively (Figure 1C). Additionally, the average BCR values for T1, T2, T3 were 2.0 ± 0.12, 1.6 ± 0.11, 1.0 ± 0.08 and 2.4 ± 0.20, 2.1 ± 0.22, 1.0 ± 0.11 for DI and FI, respectively. PC showed significant differences among IT in each IS. TE ranged between 94.5–1064 and 104.2–737.5 kg CO 2 -eq t fresh tubers 1 corresponding to FI and DI, respectively (Table 2). The average difference of TE of DI related to FI was −3.9, +9.1, and −184.5 kg CO 2 -eq t fresh tubers 1 in T1, T2, and T3, respectively (Figure 1D). T3 showed significantly higher TE values than T1–T2 for both IS. The main source of TE was fertilizer inputs (33.5–47.2%) in T1–T2 for both IS, followed by seed production (27.4–28.7%) in T2 and energy use activities (24.7–27.0%) in T1 (Table 2). Regarding T3, it was seed production (40.1–43.4%) followed by fertilizer inputs (33.7–35.7%). In all treatments, off-farm transport activity was negligible (<1%).

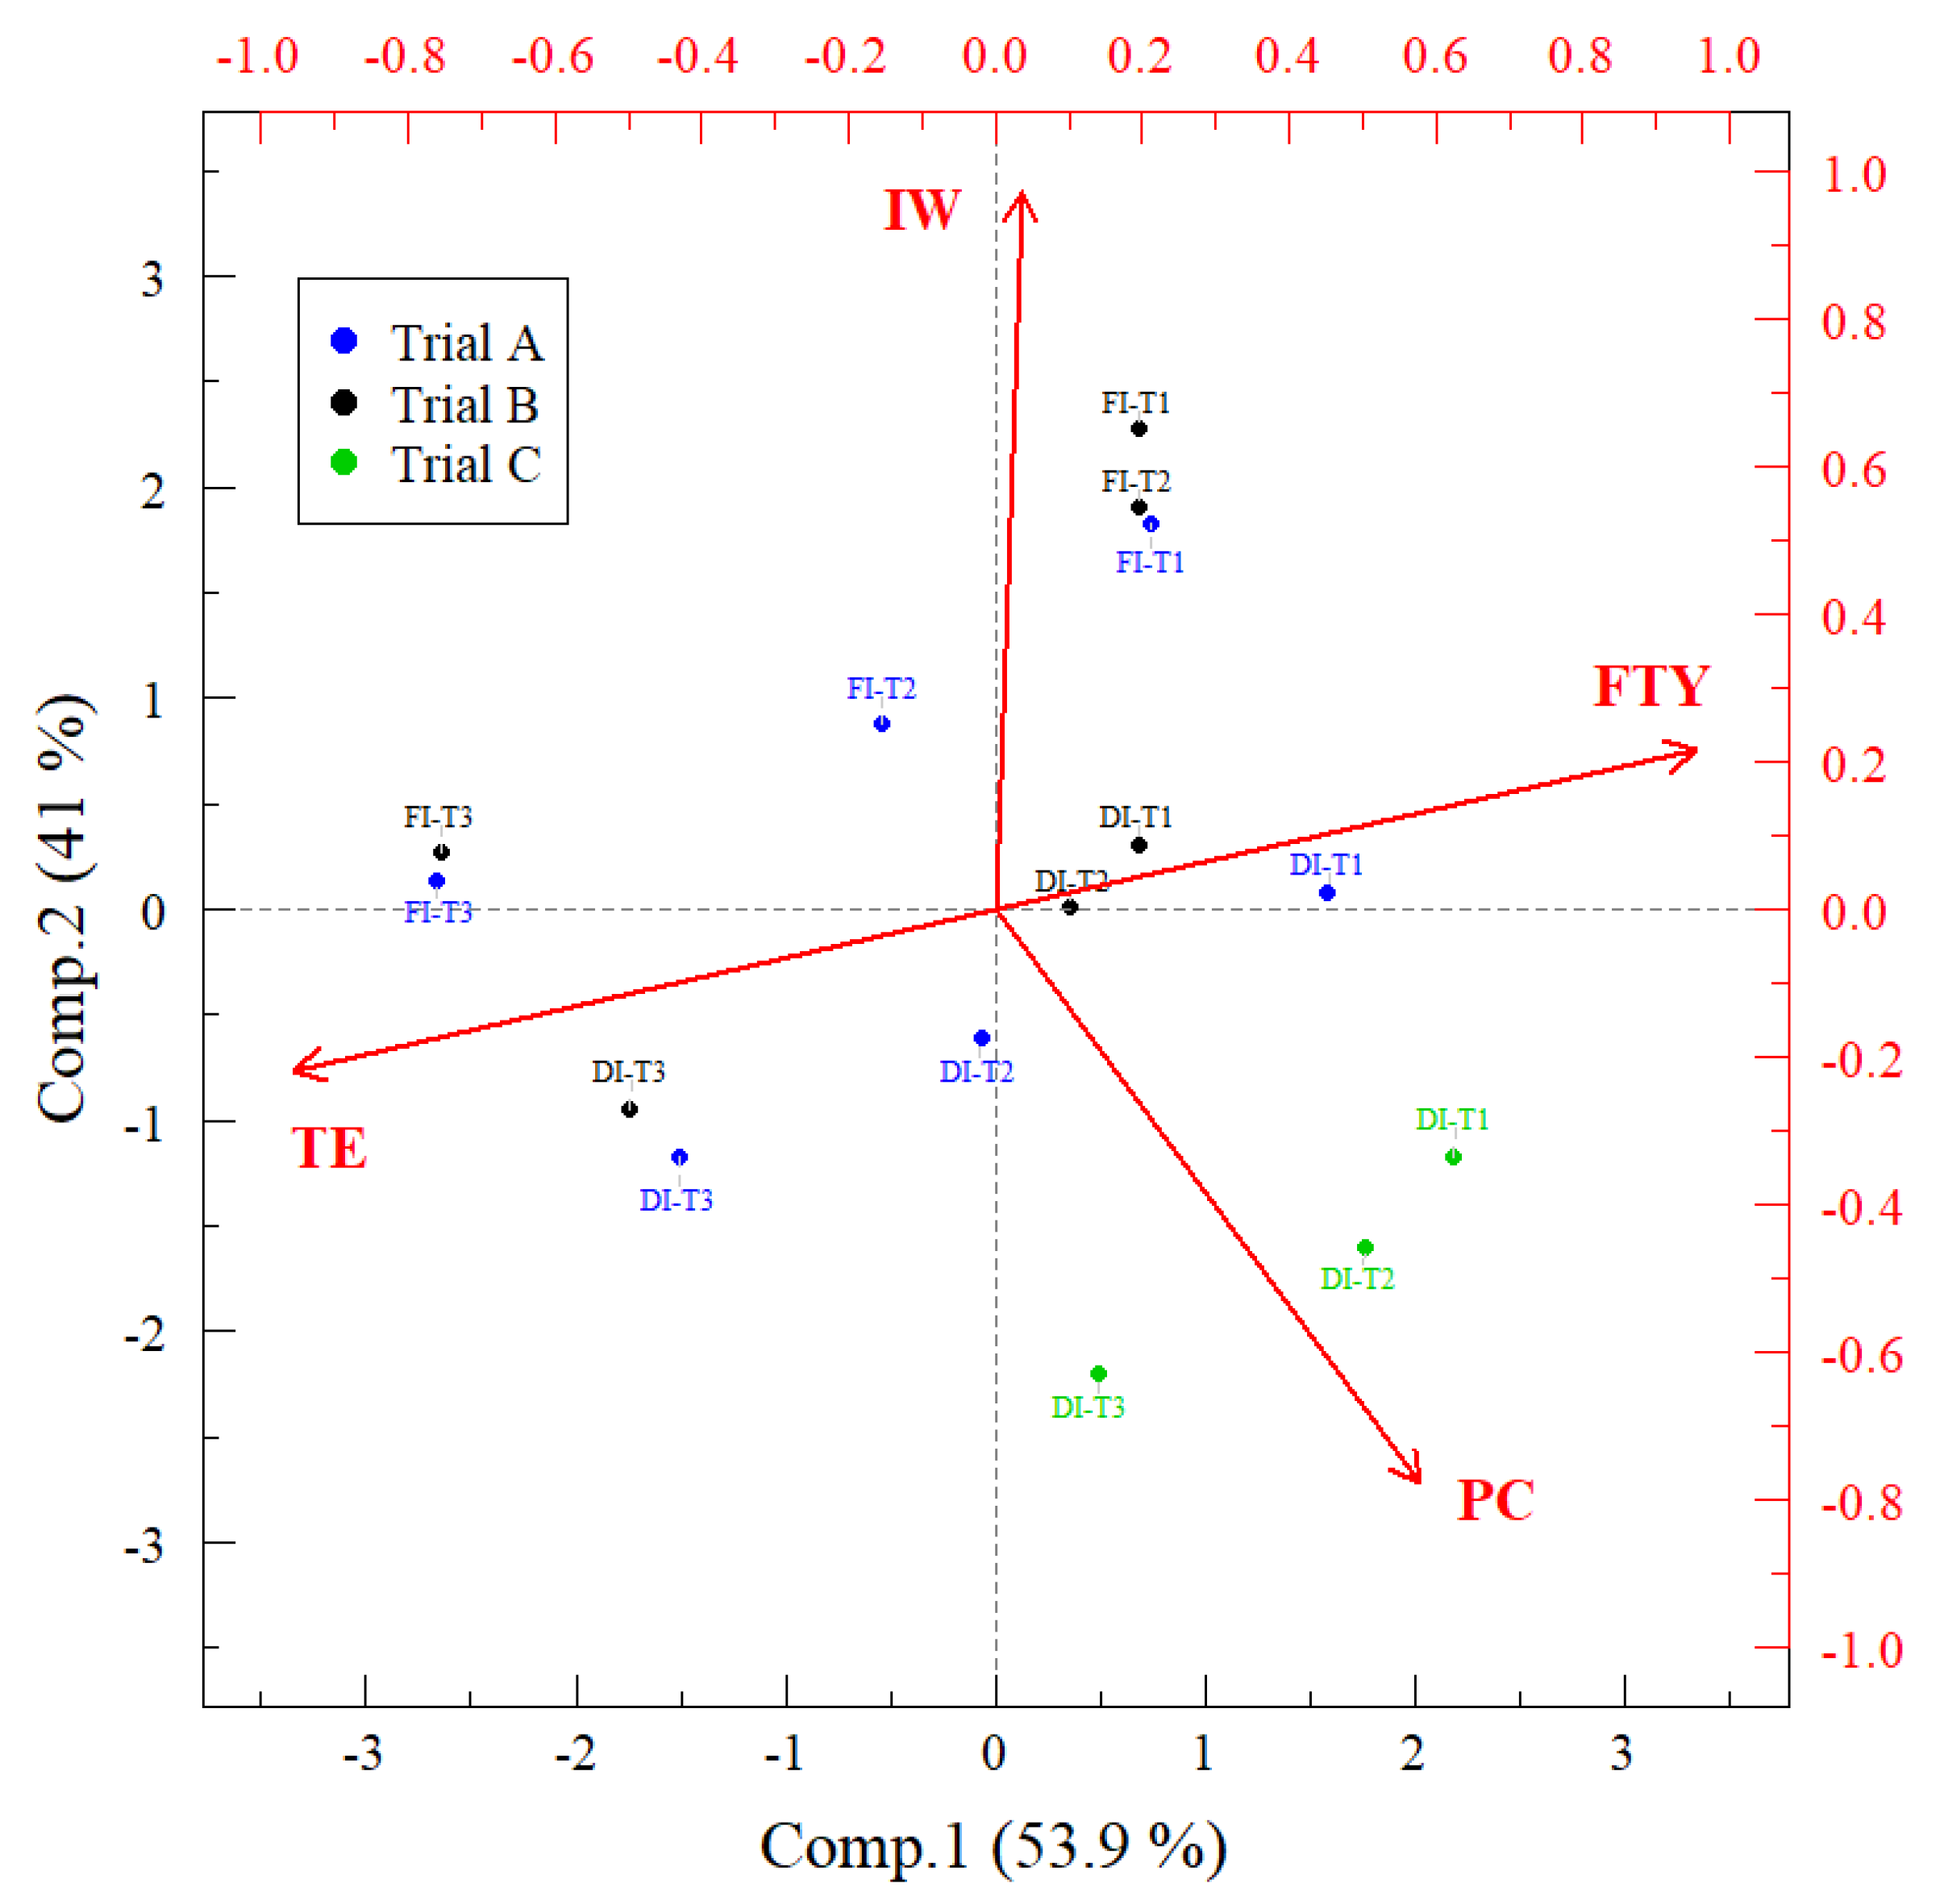
3.2. Interaction of the Indicators and Treatments Valuation Based on the Integrated Index

The extracted components with eigenvalues > 1 represented 94.9% of the total cumulative variance (Table 3). FTY and TE mainly explained the first principal component (PComp) with positive and negative signs, respectively. In contrast, the second PComp was represented primarily by PC and IW, with a negative and positive sign, respectively (Table 2, Figure 2). FI-T2 showed higher values of IIN for scenarios IV–VII (0.52–0.71), reaching in VII the maximum value of 0.71 in all the scenarios. Additionally, IIN was higher for FI-T1 with values of 0.42 and 0.50 under scenarios II and III, respectively (Figure 3). DI-T3 showed lower IIN values (0.19–0.29) in all the scenarios (Figure 3). The treatment with higher IIN in most scenarios (FI-T2) was in the group of higher FTY and low IW, TE and PC, whereas DI-T3 treatment with lower IIN in all scenarios was grouped in the polygon of lower FTY and IW and higher PC and TE (Figure 4).

4. Discussion

4.1. High-Tech Irrigation Allowed to Save Water but with Higher Monetary Cost

A range of 1200–1600 m 3 ha 1 of water saving using DI compared to FI has been reported in potatoes [15,24,36]. A reduction in N leaching, higher nutrient absorption and water availability, the removal of salt away from roots, and better soil aeration are the reported causes of the benefits of DI compared to FI that allowed yielding more with less water in this crop [37,38,39,40,41]. In this study, DI allowed for 1878.4 and 2337.3 m 3 ha 1 of water saving under control (T1) and using CWSI < 0.4 as a timing irrigation threshold (T2), respectively, compared to FI under control (T1). This water saved compromised an average of −2.8 and 5.9 t ha 1 of non-significant tuber yield reduction, which highlights the potential of this technology for water saving purposes in potatoes. An essential part of the applied/irrigated water is lost through evaporation, percolation, and runoff. Therefore, the water used (or consumed) by plants for the transpiration process is considered a better indicator to assess the effectiveness of the irrigation method [16]. In this sense, water use efficiency in potatoes based on transpired water for assessing DI as optimum water technology compared to other technologies is scarce [42]. This aspect (correct method of water productivity calculus) and a narrow “local” scale are why some authors debate the effectiveness of “high-tech” technology for water saving [16,43,44]. On the other hand, DI has been reported as less environmentally and economically friendly than furrow irrigation. Thus, Qin et al. [15] said that high-tech irrigation promotes 16.5% (+603.2 kg CO 2 -eq ha 1 ) more C footprint emissions than alternate FI. Notwithstanding, this result was partially confirmed by this study’s findings, with IW and PC being the variables showing the lower and higher values, respectively, in DI compared with FI (Figure 1 and Figure 4). In contrast, TE did not show differences between IS in the treatments T1 and T2. The explanation for this result is that in the study area, FI required energy to pump water from the well (Section 2.2). The global average TE value in this study under T1 (95.7–282.0 kg CO 2 -eq t fresh tubers 1 ) was in the range of the reported for potato under optimum conditions (41–330 kg CO 2 -eq Mg fresh tubers 1 ; [15,45,46,47,48,49,50]) (Table 2). Our findings are similar to other potato studies [45,47,48,49,50,51,52], where fertilizers were the most important source of C emissions for treatments T1–T2 in both IS. In our case, an intensive application was necessary due to the study area’s low soil fertility level and organic matter (Table S2). In contrast, in T3, seed production becomes more important due to tuber yield penalization [45]. In this sense, tuber yield is considered the most influential parameter of C emissions with an inverse effect [45], which was also corroborated in this study (Figure 2, Table S3). Thus, Sandaña and Kalazich [48] remark that around 1.4 kg CO 2 -eq is reduced with the increase of 1 t ha 1 of fresh tuber yield by analyzing different potato systems. Because irrigation timing using 0.05 mol H 2 O m 2 s 1 of g s _ m a x or 0.6 of CWSI as thresholds (T3) poses photosynthetic impairment in potatoes [24], it promoted a critical tuber yield reduction with a concomitant TE increase.
The overall average PC values in this study under T1 and T2 (6844.5–9986.3 USD ha 1 ) were in the range above that reported for potatoes under optimum conditions. Most studies reported a PC value greater than 900, ranging between 906.0 and 5961.5 USD ha 1 [15,32,53,54,55,56,57,58,59,60,61]. However, some studies reported PC values above 7000 USD ha 1 [62,63] with an average of approximately 3400 USD ha 1 . The high PC values found in this study were because the experimental trials were carried out in stations where all the components were considered, including irrigation water, fertilizer, machinery, agrochemicals, and seeds. On the other hand, it was found that PC values were higher in DI compared to FI due to the irrigation system used. Additionally, most studies reported a BCR value greater than 1 ranging between 1.2–2.7 [15,53,54,55,56,62]. The trend in BCR values (higher in T1 and lower in T3) coincides with the literature where BCR decreases when less water is applied [55,58].

4.2. Irrigation Timing Based on Thermal Imagery Improved Most Indicators under Furrow Irrigation

A CWSI value of 0.4 as a threshold to establish timing irrigation under FI provided the higher IIN in the scenarios where users considered moderately important and highly important economic (PC) and environmental indicators (IW, TE) for prioritization beyond yield production (Figure 3). Although there are studies where tuber yield, water used quantification, carbon footprint, and economic indicators were measured [47,49,50,64], they usually are used individually to analyze agricultural sustainability. To our knowledge, this study is the first to propose an integrated index combining all the indicators that allows performing a holistic assessment of technologies depending on the user preferences (scenarios) in potatoes. The weighting method of the proposed IIN in this study (as in Shi et al. [65] for maize) has the advantage of a more straightforward calculation than other more complex indexes (fuzzy logic) reported for maize [66]. On the other hand, it has been highlighted that the threshold values for irrigation based on thermal imagery depend on the IS in potatoes [21]. Although the plant water delivery under FI is less efficient than DI, in which water is supplied directly to the root zone, the former allows potatoes to resist under more demanding thresholds, saving higher water quantities without significant tuber reductions [24]. These authors hypothesized short-term water memory is potentially activated under FI as a mechanism to improve water restriction tolerance. Because of its lower cost, FI is more accessible to small farmers in developing countries. They can use it under different methods of water management in potatoes, e.g., supplemental irrigation [52,67,68], deficit irrigation [69], alternate irrigation [13,14,70,71], and the use of homemade siphons [72], among others. Qin et al. [15], comparing alternate FI and DI, found that the former could save the same water quantity as DI with no tuber yield penalization, less monetary investment, and lower carbon emissions. Water management methods under FI and the use of canopy temperature require an extra cost investment related to labor and equipment that must be considered in the cost analysis in the future. Regarding the use of thermal imagery for canopy temperature assessments, some cameras adapted to a cellphone with an app for image segmentation can reduce the cost from 7000 to 250 USD [73,74]. Thus, infrared temperature sensors allow measuring canopy temperatures with high temporal precision at a reduced price [75]. In addition, due to the fact that canopy temperature is highly associated with drought stress and crop yield [18,20], CWSI maps retrieved by thermal imagery from unmanned aerial vehicle (UAV) can be used to optimize resources such as water, reducing cost production and keeping high yields [76]. On the other hand, to obtain higher scales, remote sensing technology through UAV or satellite-based thermal imagery through the training of algorithms using artificial intelligence is being used to estimate CWSI in crops [77,78]. This technology can be used in irrigated systems that have suffered from improper water management and governance, such as the Nile basin, where water productivity has been lost because of improper irrigation and water waste [4,5,6].

5. Conclusions

The irrigation system that allowed the optimization of the agronomic, economic, and environmental indicators for potatoes in this study consisted of using thermal imagery to establish the timing to schedule FI. CWSI thresholds < 0.4 allowed an appropriate yield and reduced the production cost of benefits, the amount of irrigated water used, and the C footprint under FI, demonstrating its usefulness in establishing water saving technologies in potato-irrigated systems. It is necessary to use thermal cameras assembled on UAVs to estimate CWSI in different zones, allowing precise irrigation through the recommended CWSI threshold in this study to optimize the use of water at larger spatial scales. After appropriate downscaling analysis and adjustments, satellite information was found to be a promising method for CWSI analysis in regional irrigation systems in the near future. The proposed index (Equation (1)) can be used for prioritization schemes to assess water management technologies, including agronomic, economic, and environmental indicators. Incorporating other indicators such as soil health will be necessary for assessing the recently called “agronomic gain” (i.e., “improvement in key performance indicators related to sustainability, productivity, and environment, through of agronomic practices and social contexts”; Saito et al. [27]) in studies related to water-saving technologies in this crop.

Supplementary Materials

The following supporting information can be downloaded at: https://www.mdpi.com/article/10.3390/agronomy12122921/s1, Table S1: Climate conditions in the study zone 2013–2020. Dataset Rinza et al. [79]; Table S2: Summary of crop management information of drip irrigation (DI) and furrow irrigation (FI) for different treatments: T1—control, T2—0.4 of CWSI, and T3—0.7 of CWSI. CWSI–Crop water stress index. Rinza et al. [80] dataset; Table S3: Pearson correlation matrix for agronomic (FTY–Fresh tuber yield and IW–total irrigated water), environmental (TE–Total emissions carbon), and economic (BCR–Benefit cost ratio) indicators.

Author Contributions

Conceptualization, D.A.R. and R.Q.; methodology, J.R. and D.A.R.; software, J.R., J.N. and F.d.M.; validation, J.N. and J.R.; formal analysis, F.d.M. and D.A.R.; investigation, J.R., J.N., J.G. and D.A.R.; resources, D.A.R. and R.Q.; data curation, J.R., F.d.M. and J.N.; writing—original draft preparation, J.R. and D.A.R.; writing—review and editing, R.Q., F.d.M., J.G. and J.N.; visualization, J.R. and J.N.; supervision, D.A.R., J.G and R.Q.; project administration, D.A.R. and J.R.; funding acquisition, D.A.R. All authors have read and agreed to the published version of the manuscript.

Funding

This research received the financial support from “Programa Nacional de Innovación Agraria” (PNIA), with the Project No. 016-2015-INIA-PNIA/UPMSI/IE “Uso efectivo del agua en el cultivo de papa en zonas áridas: Mejorando el manejo del riego mediante el monitoreo del estatus hídrico para enfrentar al Cambio Climático”. This research received complementary funds from “Root, Tubers and Bananas” (RTB) CGIAR Research Program by CGIAR Trust Fund contributors https://www.cgiar.org/funders/ (accessed on 30 August 2022) and Excellence in Agronomy OneCGIAR Initiative.

Institutional Review Board Statement

Not applicable.

Informed Consent Statement

Not applicable.

Data Availability Statement

The agronomic and ecophysiological data of trials A, B, and C are available on the CIP database (https://data.cipotato.org/, accessed on 15 December 2021).

Acknowledgments

The authors thank Jesus Zamalloa, Nikolai Alarcon, Kini Quispe and Angel Cobeñas for their technical assistance in the data collection.

Conflicts of Interest

The authors declare no conflict of interest.

References

  1. Howard, J.K.; Fesenmyer, K.A.; Grantham, T.E.; Viers, J.H.; Ode, P.R.; Moyle, P.B.; Kupferburg, S.J.; Furnish, J.L.; Rehn, A.; Slusark, J.; et al. A freshwater conservation blueprint for California: Prioritizing watersheds for freshwater biodiversity. Fresh. Sci. 2018, 37, 417–431. [Google Scholar] [CrossRef] [Green Version]
  2. Shtull-Trauring, E.; Cohen, A.; Ben-Hur, M.; Tanny, J.; Bernstein, N. Reducing salinity of treated waste water with large scale desalination. Water Res. 2020, 186, 116322. [Google Scholar] [CrossRef] [PubMed]
  3. Graham, N.T.; Hejazi, M.I.; Kim, S.H.; Davies, E.G.; Edmonds, J.A.; Miralles-Wilhelm, F. Future changes in the trading of virtual water. Nat. Commun. 2020, 11, 1–7. [Google Scholar] [CrossRef] [PubMed]
  4. Elshaikh, A.E.; Yang, S.H.; Jiao, X.; Elbashier, M.M. Impacts of Legal and Institutional Changes on Irrigation Management Performance: A Case of the Gezira Irrigation Scheme, Sudan. Water 2018, 10, 1579. [Google Scholar] [CrossRef] [Green Version]
  5. Ibrahim, Y.A. Complex adaptive system approach for improved irrigation management: The case of the Gezira scheme in Sudan. Irrig. Drain. 2020, 69, 1072–1081. [Google Scholar] [CrossRef]
  6. Goelnitz, A.; Al-Saidi, M. Too big to handle, too important to abandon: Reforming Sudan’s Gezira scheme. Agric. Water Manag. 2020, 241, 106396. [Google Scholar] [CrossRef]
  7. An, P.; Ren, W.; Liu, X.; Song, M.; Li, X. Adjustment and optimization of the cropping systems under water constraint. Sustainability 2016, 8, 1207. [Google Scholar] [CrossRef] [Green Version]
  8. OECD. Water Risk Hotspots for Agriculture; OECD Studies on Water; OECD Publishing: Paris, France, 2017. [Google Scholar] [CrossRef]
  9. Faostat. Available online: http://www.fao.org/faostat/en/ (accessed on 24 December 2020).
  10. DeFauw, S.L.; He, Z.; Larkin, R.P.; Mansour, S.A. Sustainable potato production and global food security. In Sustainable Potato Production: Global Case Studies; He, Z., Larkin, R., Honeycutt, W., Eds.; Springer: Dordrecht, The Netherlands, 2012; pp. 3–19. [Google Scholar] [CrossRef]
  11. Renault, D.; Wallender, W.W. Nutritional water productivity and diets. Agric. Water Manag. 2000, 45, 275–296. [Google Scholar] [CrossRef]
  12. Xu, X.; Sharma, P.; Shu, S.; Lin, T.S.; Ciais, P.; Tubiello, F.N.; Smith, P.; Campbell, N.; Jain, A.K. Global greenhouse gas emissions from animal-based foods are twice those of plant-based foods. Nat. Food 2021, 2, 724–732. [Google Scholar] [CrossRef]
  13. Yactayo, W.; Ramírez, D.A.; Gutiérrez, R.; Mares, V.; Posadas, A.; Quiroz, R. Effect of partial root-zone drying irrigation timing on potato tuber yield and water use efficiency. Agric. Water Manag. 2013, 123, 65–70. [Google Scholar] [CrossRef]
  14. Saeed, H.; Grove, I.G.; Kettlewell, P.S.; Hall, N.W. Potential of partial rootzone drying as an alternative irrigation technique for potatoes (Solanum tuberosum). Ann. Appl. Biol. 2008, 152, 71–80. [Google Scholar] [CrossRef]
  15. Qin, J.; Ramírez, D.A.; Xie, K.; Li, W.; Yactayo, W.; Jin, L.; Quiroz, R. Is partial root-zone drying more appropriate than drip irrigation to save water in China? A preliminary comparative analysis for potato cultivation. Potato Res. 2018, 61, 391–406. [Google Scholar] [CrossRef] [Green Version]
  16. Perry, C.; Steduto, P.; Karajeh, F. Does Improved Irrigation Technology Save Water? A Review of the Evidence; FAO (Food and Agriculture Organization of the United Nations): Rome, Italy, 2017; Volume 42, pp. 33–35. Available online: https://www.fao.org/3/I7090EN/i7090en.pdf (accessed on 1 March 2021).
  17. Kjelgaard, J.F.; Stockle, C.O.; Evans, R.G. Accuracy of canopy temperature energy balance for determining daily evapotranspiration. Irr. Sci. 1996, 16, 149–157. [Google Scholar] [CrossRef]
  18. Ninanya, J.; Ramírez, D.A.; Rinza, J.; Silva-Díaz, C.; Cervantes, M.; García, J.; Quiroz, R. Canopy Temperature as a Key Physiological Trait to Improve Yield Prediction under Water Restrictions in Potato. Agronomy 2021, 11, 1436. [Google Scholar] [CrossRef]
  19. Ramírez, D.A.; Yactayo, W.; Gutiérrez, R.; Mares, V.; De Mendiburu, F.; Posadas, A.; Quiroz, R. Chlorophyll concentration in leaves is an indicator of potato tuber yield in water-shortage conditions. Sci. Hortic. 2014, 168, 202–209. [Google Scholar] [CrossRef]
  20. Rinza, J.; Ramírez, D.A.; García, J.; de Mendiburu, F.; Yactayo, W.; Barreda, C.; Velasquez, T.; Mejía, A.; Quiroz, R. Infrared Radiometry as a Tool for Early Water Deficit Detection: Insights into Its Use for Establishing Irrigation Calendars for Potatoes Under Humid Conditions. Potato Res. 2019, 62, 109–122. [Google Scholar] [CrossRef] [Green Version]
  21. Cucho-Padin, G.; Rinza, J.; Ninanya, J.; Loayza, H.; Quiroz, R.; Ramírez, D.A. Development of an open-source thermal image processing software for improving irrigation management in potato crops (Solanum Tuberosum L.). Sensors 2020, 20, 472. [Google Scholar] [CrossRef] [PubMed] [Green Version]
  22. Prashar, A.; Yildiz, J.; McNicol, J.W.; Bryan, G.J.; Jones, H.G. Infra-red thermography for high throughput field phenotyping in (Solanum tuberosum). PLoS ONE 2013, 8, e65816. [Google Scholar] [CrossRef]
  23. Rud, R.; Cohen, Y.; Alchanatis, V.; Levi, A.; Brikman, R.; Shenderey, C.; Heuer, B.; Markovitch, T.; Dar, Z.; Rosen, S.; et al. Crop water stress index derived from multi-year ground and aerial thermal images as an indicator of potato water status. Precis. Agric. 2014, 15, 273–289. [Google Scholar] [CrossRef]
  24. Silva-Díaz, C.; Ramírez, D.A.; Rodríguez-Delfín, A.; de Mendiburu, F.; Rinza, J.; Ninanya, J.; Loayza, H.; Quiroz, R. Unraveling Ecophysiological Mechanisms in Potatoes under Different Irrigation Methods: A Preliminary Field Evaluation. Agronomy 2020, 10, 827. [Google Scholar] [CrossRef]
  25. Pandey, D.; Agrawal, M. Carbon Footprint Estimation in the Agriculture Sector. In Assessment of Carbon Footprint in Different Industrial Sectors, Volume 1; Muthu, S.S., Ed.; EcoProduction; Springer: Singapore, 2014; pp. 25–47. [Google Scholar]
  26. Abbas, F.; Hammad, H.M.; Ishaq, W.; Farooque, A.A.; Bakhat, H.F.; Zia, Z.; Fahad, S.; Farhad, W.; Cerdà, A. A Review of Soil Carbon Dynamics Resulting from Agricultural Practices. J. Environ. Manag. 2020, 268, 110319. [Google Scholar] [CrossRef] [PubMed]
  27. Saito, K.; Six, J.; Komatsu, S.; Snapp, S.; Rosenstock, T.; Arouna, A.; Cole, S.; Taulya, G.; Vanlauwe, B. Agronomic gain: Definition, approach, and application. Field Crop. Res. 2021, 270, 108193. [Google Scholar] [CrossRef]
  28. Servicio Nacional de Meteorología e Hidrología (SENAMHI). Available online: https://www.senamhi.gob.pe/ (accessed on 1 February 2021).
  29. Gutiérrez-Rosales, R.O.; Espinoza-Trelles, J.A.; Bonierbale, M. UNICA: Variedad Peruana para mercado fresco y papa frita con tolerancia y resistencia para condiciones climáticas adversas. Rev. ALAP 2007, 14, 45–50. [Google Scholar] [CrossRef]
  30. Cool Farm Alliance. Version 2. Available online: https://app.coolfarmtool.org/account/login/ (accessed on 15 February 2022).
  31. Haverkort, A.J.; Hillier, J.G. Cool farm tool–potato: Model description and performance of four production systems. Potato Res. 2011, 54, 355–369. [Google Scholar] [CrossRef] [Green Version]
  32. Roy, S.B.; Saha, N.K.; Kadian, M.S.; Quiroz, R.; Llangantileke, S. Improving the livelihood of farmers by intensifying the rice-potato-rice system through double-transplanting of rice in West Bengal, India. International Potato Center (CIP), West Bengal. 2014. Available online: http://cipotato.org/wp-content/uploads/publication%20files/working%20papers/003830.pdf (accessed on 5 July 2022).
  33. SAS Institute Inc. SAS/STAT® 14.1 User’s Guide; SAS Institute Inc.: Cary, NC, USA, 2015. [Google Scholar]
  34. Kaiser, H.F. The application of electronic computers to factor analysis. Educ. Psychol. Meas. 1960, 20, 141–151. [Google Scholar] [CrossRef]
  35. R Core Team. R Software. Version, 5.6.1. Available online: https://www.r-project.org/ (accessed on 20 July 2022).
  36. Kumar, S.; Asrey, R.; Mandal, G.; Singh, R. Microsprinkler, drip and furrow irrigation for potato (Solanum tuberosum) cultivation in a semi-arid environment. Indian J. Agric. Sci. 2009, 79, 165–169. Available online: https://krishi.icar.gov.in/jspui/bitstream/123456789/25589/1/IJASc2009.pdf (accessed on 1 July 2022).
  37. Ati, A.S.; Iyada, A.D.; Najim, S.M. Water Use Efficiency of Potato (Solanum tuberosum L.) under Different Irrigation Methods and Potassium Fertilizer Rates. Ann. Agric. Sci. 2012, 57, 99–103. [Google Scholar] [CrossRef] [Green Version]
  38. Sharma, V.; Sharma, I.P.; Spehia, R.S.; Kumar, P. Influence of Irrigation Methods and Fertilizer Levels on Productivity of Potato (Solanum tuberosum). Indian J. Agric. Sci. 2012, 82, 117–121. Available online: https://www.researchgate.net/publication/290629108_Influence_of_irrigation_methods_and_fertilizer_levels_on_productivity_of_potato_Solanum_tuberosum (accessed on 15 October 2021).
  39. Shi, Y.; Qi, X.; Li, P.; Qiao, D.; Huang, Z. Improving Water and Nutrient Use Efficiency of Potato by Partial Root-Zone Drying Irrigation in a Semi-Arid Area in China: A Field Experimental Study. Int. J. Simul. Syst. Sci. Technol. 2016, 17, 19.1–19.7. [Google Scholar] [CrossRef]
  40. Jha, G.; Choudhary, O.P.; Sharda, R. Comparative Effects of Saline Water on Yield and Quality of Potato under Drip and Furrow Irrigation. Cogent. Food Agric. 2017, 3, 1369345. [Google Scholar] [CrossRef]
  41. Amali, S.; Rolston, D.E.; Fulton, A.E.; Hanson, B.R.; Phene, C.J.; Oster, J.D. Soil water variability under subsurface drip and furrow irrigation. Irrig. Sci. 1997, 17, 151–155. [Google Scholar] [CrossRef]
  42. Monneveux, P.; Ramírez, D.A.; Pino, M.-T. Drought Tolerance in Potato (S. Tuberosum L.): Can We Learn Drought Tolerance Research in Cereals. Plant Sci. 2013, 205, 76–86. [Google Scholar] [CrossRef]
  43. Ward, F.A.; Pulido-Velazquez, M. Water conservation in irrigation can increase water use. Proc. Natl. Acad. Sci. USA 2008, 105, 18215–18220. [Google Scholar] [CrossRef] [PubMed] [Green Version]
  44. Perry, C.; Steduto, P.; Allen, R.G.; Burt, C.M. Increasing productivity in irrigated agriculture: Agronomic constraints and hydrological realities. Agric. Water Manag. 2009, 105, 1517–1524. [Google Scholar] [CrossRef] [Green Version]
  45. Röös, E.; Sundberg, C.; Hansson, P.-A. Uncertainties in the Carbon Footprint of Food Products: A Case Study on Table Potatoes. Int. J. Life Cycle Assess. 2010, 15, 478–488. [Google Scholar] [CrossRef]
  46. van Evert, F.K.; de Ruijter, F.J.; Conijn, J.G.; Rutgers, B.; Haverkort, A.J. Worldwide Sustainability Hotspots in Potato Cultivation. 2. Areas with Improvement Opportunities. Potato Res. 2013, 56, 355–368. [Google Scholar] [CrossRef] [Green Version]
  47. Haverkort, A.J.; Sandaña, P.; Kalazich, J. Yield Gaps and Ecological Footprints of Potato Production Systems in Chile. Potato Res. 2014, 57, 13–31. [Google Scholar] [CrossRef] [Green Version]
  48. Sandaña, P.; Kalazich, J. Attainable CO2 Emission of Ware Potatoes Under High Yield Conditions in Southern Chile. Am. J. Potato Res. 2015, 92, 318–325. [Google Scholar] [CrossRef]
  49. Steyn, J.M.; Franke, A.C.; van der Waals, J.E.; Haverkort, A.J. Resource Use Efficiencies as Indicators of Ecological Sus-tainability in Potato Production: A South African Case Study. Field Crop. Res. 2016, 199, 136–149. [Google Scholar] [CrossRef] [Green Version]
  50. Svubure, O.; Struik, P.; Haverkort, A.; Steyn, J. Carbon Footprinting of Potato (Solanum Tuberosum L.) Production Systems in Zimbabwe. Outlook Agric. 2018, 47, 3–10. [Google Scholar] [CrossRef]
  51. Sharma, J.; Chaukhande, P.; Dua, V.K.; Kumar, S.; Chakrabarti, S.K. Carbon Footprint and Energy Consumption Analysis of Potato Production in Himachal Pradesh. Potato J. 2018, 45, 116–122. Available online: https://www.cabdirect.org/cabdirect/abstract/20193196926 (accessed on 2 February 2022).
  52. Qin, S.; Li, L.; Wang, D.; Zhang, J.; Pu, Y. Effects of Limited Supplemental Irrigation with Catchment Rainfall on Rain-Fed Potato in Semi-Arid Areas on the Western Loess Plateau, China. Am. J. Potato Res. 2013, 90, 33–42. [Google Scholar] [CrossRef]
  53. Tang, C.; Lu, Y.; Jiang, B.; Chen, J.; Mo, X.; Yang, Y.; Wang, Z. Energy, Economic, and Environmental Assessment of Sweet Potato Production on Plantations of Various Sizes in South China. Agronomy 2022, 12, 1290. [Google Scholar] [CrossRef]
  54. Subedi, S.; Ghimire, Y.N.; Gautam, S.; Poudel, H.K.; Shrestha, J. Economics of potato (Solanum tuberosum L.) production in terai region of Nepal. AAES 2019, 4, 57–62. [Google Scholar] [CrossRef]
  55. Onder, S.; Caliskan, M.E.; Onder, D.; Caliskan, S. Different irrigation methods and water stress effects on potato yield and yield components. Agric. Water Manag. 2005, 73, 73–86. [Google Scholar] [CrossRef]
  56. Gatto, M.; Petsakos, A.; Hareau, G. Sustainable intensification of rice-based systems with potato in Eastern Indo-Gangetic plains. Am. J. Potato Res. 2020, 97, 162–174. [Google Scholar] [CrossRef] [Green Version]
  57. Zangeneh, M.; Omid, M.; Akram, A. A comparative study on energy use and cost analysis of potato production under different farming technologies in Hamadan province of Iran. Energy J. 2010, 35, 2927–2933. [Google Scholar] [CrossRef]
  58. Patel, N.; Rajput, T.B.S. Effect of drip tape placement depth and irrigation level on yield of potato. Agric. Water Manag. 2007, 88, 209–223. [Google Scholar] [CrossRef]
  59. Gitari, H.I.; Nyawade, S.O.; Kamau, S.; Gachene, C.K.; Karanja, N.N.; Schulte-Geldermann, E. Increasing potato equivalent yield increases returns to investment under potato-legume intercropping systems. Open Agric. 2019, 4, 623–629. [Google Scholar] [CrossRef]
  60. Mosquera, V.B.; Delgado, J.A.; Alwang, J.R.; López, L.E.; Ayala, Y.C.; Andrade, J.D.; D’adamo, R. Conservation agriculture increases yields and economic returns of potato, forage, and grain systems of the Andes. J. Agron. 2019, 111, 2747–2753. [Google Scholar] [CrossRef] [Green Version]
  61. Tirado-Malaver, R.H.; Mendoza-Saenz, J.; Tirado-Lara, R.; Tirado-Malaver, R. Multivariate analyzes to characterize and typify potato production farms (Solanum tuberosum L.) in Cutervo, Cajamarca, Peru. Trop. Subtrop. Agroecosyst. 2021, 24. Available online: https://www.revista.ccba.uady.mx/ojs/index.php/TSA/article/view/3744/1677 (accessed on 5 August 2022). [CrossRef]
  62. Scuderi, A.; Cammarata, M.; Branca, F.; Timpanaro, G. Agricultural production trends towards carbon neutrality in response to 397 the EU 2030 Green Deal: Economic and environmental analysis in horticulture. J. Agric. Econ. 2021, 67, 435–444. [Google Scholar] [CrossRef]
  63. Mohammadzadeh, A.; Vafabakhsh, J.; Mahdavi Damghani, A.; Deihimfard, R. Assessing environmental impacts of major vegetable crop production systems of East Azerbaijan province in Iran. Arch. Agron. Soil Sci. 2018, 64, 967–982. [Google Scholar] [CrossRef]
  64. Franke, A.C.; Steyn, J.M.; Machakaire, A.T.B.; Haverkort, A.J. Resource use efficiencies in potato production. Water Wheel 2018, 17, 18–21. [Google Scholar]
  65. Shi, X.; Batchelor, W.D.; Liang, H.; Li, S.; Li, B.; Hu, K. Determining optimal water and nitrogen management under different initial soil mineral nitrogen levels in northwest China based on a model approach. Agric. Water Manag. 2020, 234, 106110. [Google Scholar] [CrossRef]
  66. Carozzi, M.; Bregaglio, S.; Scaglia, B.; Bernardoni, E.; Acutis, M.; Confalonieri, R. The development of a methodology using fuzzy logic to assess the performance of cropping systems based on a case study of maize in the Po Valley. Soil Use Manag. 2013, 29, 576–585. [Google Scholar] [CrossRef]
  67. Tang, J.; Wang, J.; Fang, Q.; Wang, E.; Yin, H.; Pan, X. Optimizing Planting Date and Supplemental Irrigation for Potato across the Agro-Pastoral Ecotone in North China. Eur. J. Agron. 2018, 98, 82–94. [Google Scholar] [CrossRef]
  68. Satognon, F.; Owido, S.F.O.; Lelei, J.J. Effects of Supplemental Irrigation on Yield, Water Use Efficiency and Nitrogen Use Efficiency of Potato Grown in Mollic Andosols. Environ. Syst. Res. 2021, 10, 38. [Google Scholar] [CrossRef]
  69. Geerts, S.; Raes, D. Deficit irrigation as an on-farm strategy to maximize crop water productivity in dry areas. Agric. Water Manag. 2009, 96, 1275–1284. [Google Scholar] [CrossRef] [Green Version]
  70. Xie, K.; Wang, X.-X.; Zhang, R.; Gong, X.; Zhang, S.; Mares, V.; Gavilán, C.; Posadas, A.; Quiroz, R. Partial Root-Zone Drying Irrigation and Water Utilization Efficiency by the Potato Crop in Semi-Arid Regions in China. Sci. Hortic. 2012, 134, 20–25. [Google Scholar] [CrossRef]
  71. Badr, M.A.; El-Tohamy, W.A.; Salman, S.R.; Gruda, N. Yield and Water Use Relationships of Potato under Different Timing and Severity of Water Stress. Agric. Water Manag. 2022, 271, 107793. [Google Scholar] [CrossRef]
  72. Yactayo, W.; Ramírez, D.A.; German, T.; Worku, A.; Abeb, A.; Harahagazwe, D.; Quiroz, R. Improving potato cultivation using siphons for partial root-zone drying irrigation: A case study in the Blue Nile river basin, Ethiopia. Open Agric. 2017, 2, 255–259. [Google Scholar] [CrossRef]
  73. CPAD. (18 October 2020). Developing Digital Tools to Optimize Water Use in Agriculture. International Potato Center. Available online: https://cipotato.org/blog/developing-digital-tools-optimize-water-use-agriculture/ (accessed on 5 July 2022).
  74. Cucho-Padin, G.; Rinza, J.; Ninanya, J.; Ramírez, D. Thermal Images Processor for Android Phones TIPCIP V1.0; International Potato Center (CIP): Lima, Peru, 2019. [Google Scholar] [CrossRef]
  75. Jones, H.G.; Hutchinson, P.A.; May, T.; Jamali, H.; Deery, D.M. A practical method using a network of fixed infrared sensors for estimating crop canopy conductance and evaporation rate. Biosyst. Eng. 2018, 165, 59–69. [Google Scholar] [CrossRef] [Green Version]
  76. Meron, M.; Tsipris, J.; Orlov, V.; Alchanatis, V.; Cohen, Y. Crop water stress mapping for site-specific irrigation by thermal imagery and artificial reference surfaces. Precis. Agric. 2010, 11, 148–162. [Google Scholar] [CrossRef]
  77. Shi, X.; Han, W.; Zhao, T.; Tang, J. Decision support system for variable rate irrigation based on UAV multispectral remote sensing. Sensors 2019, 19, 2880. [Google Scholar] [CrossRef] [Green Version]
  78. Veysi, S.; Naseri, A.A.; Hamzeh, S.; Bartholomeus, H. A satellite based crop water stress index for irrigation scheduling in sugarcane fields. Agric. Water Manag. 2017, 189, 70–86. [Google Scholar] [CrossRef]
  79. Rinza, J.; Ramírez, D.A.; Ninanya, J.; Yactayo, W. Dataset for: Meteorological data at La Molina 2 CIP experimental station from 2013 to 2020. Int. Potato Cent. 2021, V1. [Google Scholar] [CrossRef]
  80. Rinza, J.; Ninanya, J.; Ramírez, D.A. Dataset for: Estimating carbon footprint in potato trials 4 under drip and furrow irrigation. Int. Potato Cent. 2021, V1. [Google Scholar] [CrossRef]
Figure 1. Total irrigated water (IW, A), fresh tuber yield (FTY, B), production cost (PC, C), and total C emissions (TE, D) with treatments under furrow (FI, red bars) and drip (DI, white bars) irrigation using timing schedule irrigation treatments: control (T1), 0.4 (T2) and 0.6 (T3) thresholds of crop water stress index (CWSI). Different letters show significant differences among timing schedule water treatments (T1-T3) under FI (lowercase letters) and DI (capital letters) using the least significant different (LSD) multiple pairwise comparison test at a 0.05 probability level based on the mixed linear model.
Agronomy 12 02921 g001
Figure 2. Drip (DI) and furrow (FI) irrigation under control (T1), 0.4 (T2) and 0.6 (T3) thresholds of crop water stress index (CWSI), with ordination based on principal component analysis for agronomic (DTY and IW), environmental (TE) and economic (PC) indicators. See abbreviations in Table 1.
Agronomy 12 02921 g002
Figure 3. Average values of the integrated index for each treatment (T1, T2, and T3 for control and thresholds of 0.4 and 0.6 crop water stress index for irrigation timing) under drip (DI) and furrow (FI) irrigation for seven scenarios: (I) “highly important” fresh tuber yield (FTY), with other indicators labeled as “unimportant”, (II) “highly important” FTY and “moderately important” production cost (PC), with the other indicators labeled as "unimportant”, (III) “highly important” FTY and PC, with the other indicators labeled as “unimportant”, (IV) “highly important” FTY and PC, “moderately important” total irrigated water (IW), and “unimportant” total C emissions (TE), (V) “unimportant” TE, with the other indicators labeled as “highly important”, (VI) “moderately important” TE, with the other indicators labeled as "highly important”, and (VII) “highly important” for all the indicators.
Agronomy 12 02921 g003
Figure 4. Radar diagram illustrating drip (DI) and furrow (FI) irrigation systems under control (T1) and thresholds of 0.4 (T2) and 0.6 (T3) of the crop water stress index (CWSI) for agronomic (FTY), environmental (TE), and economic (PC) indicators. See abbreviations in Table 1.
Agronomy 12 02921 g004
Table 1. Variance analysis of fixed factors for agronomic (FTY—fresh tuber yield per plot and IW—total irrigated water), environmental (TE—total emissions carbon footprint), and economic (PC—production cost) indicators. F-values are presented at p < 0.01 (**), p < 0.05 (*), and p > 0.05 (ns) of significance. DF: degrees of freedom.
SourceDFFTYIWTEPC
Irrigation Systems (IS)10.34 ns421.01 **0.75 ns14812.8 **
Irrigation Timing Treatments (IT)244.97 **304.89 **33.36 **256.86 **
IS × IT20.52 ns25.72 **3.14 *32.96 **
Table 2. Average total carbon emissions (TE, kg CO 2 eq. to fresh tubers 1 ) are divided into different agricultural activities under drip irrigation (DI) and furrow irrigation (FI) using timing schedule irrigation treatments: control (T1), 0.4 (T2), and 0.7 (T3) thresholds of crop water stress index (CWSI). Calculations were made using the Cool Farm Tool [30].
SourceTE (kg CO 2 -eq t Fresh Tubers 1 )TE (%)
DI-T1DI-T2DI-T3FI-T1FI-T2FI-T3DI-T1DI-T2DI-T3FI-T1FI-T2FI-T3
Seed production38.860.5157.144.361.6252.724.128.740.123.627.443.4
Fertilizers *70.487.8139.979.493.7196.443.741.735.742.441.733.7
Crop protection11.514.322.812.414.630.77.16.85.96.66.55.3
Energy use (field)39.847.270.950.653.7100.924.722.418.127.023.917.3
Off-farm transport0.60.71.10.70.81.70.40.30.30.40.40.3
Total161.0210.4391.8187.4224.5582.4100100100100100100
* Calculated with validated default values for fertilizer production
Table 3. Loading of the first two principal components (PComp) obtained for agronomic (FTY and IW), environmental (total carbon emissions, TE) and economic (PC) indicators. In gray: scores > |0.7|. TCV = total cumulative variance.
IndicatorPComp1PComp2
FTY0.65−0.17
IW0.020.76
TE−0.65−0.17
PC−0.39−0.61
Eigenvalue2.161.64
TCV (%)53.994.9
See abbreviations in Table 1.
Publisher’s Note: MDPI stays neutral with regard to jurisdictional claims in published maps and institutional affiliations.

