Article

Early Detection of Coffee Leaf Rust Caused by Hemileia vastatrix Using Multispectral Images

by
Analis da Silva Soares
1,*,
Bruno Sérgio Vieira
2,
Thalita Almeida Bezerra
2,
George Deroco Martins
3 and
Ana Carolina Silva Siquieroli
4
1
Graduate Program in Agriculture and Geospatial Information, Institute of Agrarian Sciences, (Universidade Federal de Uberlândia), Monte Carmelo 38500-000, Brazil
2
Institute of Agrarian Sciences (Universidade Federal de Uberlândia), Monte Carmelo 38500-000, Brazil
3
Institute of Geography (Universidade Federal de Uberlândia), Monte Carmelo 38500-000, Brazil
4
Institute of Biotechnology (Universidade Federal de Uberlândia), Monte Carmelo 38500-000, Brazil
*
Author to whom correspondence should be addressed.
Agronomy 2022, 12(12), 2911; https://doi.org/10.3390/agronomy12122911
Submission received: 18 August 2022 / Revised: 5 October 2022 / Accepted: 10 October 2022 / Published: 22 November 2022
(This article belongs to the Special Issue Application of Image Processing in Agriculture)

Abstract

Conventional methodology in the field for the sampling of coffee leaf rust, caused by Hemileia vastatrix, has proven to be impractical. This paper proposes a method for the early detection of this disease, which is the most significant pathogen of coffee plants worldwide, using multispectral images acquired using a Mapir Survey3W camera and an unmanned aerial vehicle (UAV). For this purpose, 160 coffee seedlings of the coffee cultivar ‘Mundo Novo’ were inoculated with urediniospores of H. vastatrix and compared with 160 control (non-inoculated) seedlings to determine the most favorable interval for distinguishing healthy and infected plants. The 320 seedlings were placed on a dark surface to perform the imaging flights. In vitro analyses of the physiological parameters of 20 specimens were then performed for each condition (inoculated/non-inoculated) to obtain the hyperspectral curves, and this process was repeated three times at 15, 30, and 45 days after inoculation (DAI). Based on the simulated hyperspectral curves, a discrepancy between the red and near-infrared (NIR) bands was identified at 15 DAI, with the inoculated plants showing greater absorption in the red band and a greater spectral response in the NIR band. Thus, multispectral images were able to distinguish H. vastatrix infection in coffee seedlings at an asymptomatic stage (15 DAI) using a support vector machines (SVM) algorithm. Detection accuracy was 80% and the Kappa index of agreement was moderate (0.6). The early detection of this pathogen in the field using low-cost technology can be an important tool for the monitoring of coffee leaf rust and, consequently, a more sustainable management of the pathogen, causing farmers to make applications of chemical fungicides only when necessary.

1. Introduction

Coffee leaf rust, caused by the biotrophic fungus Hemileia vastatrix, is one of the main limiting factors in Arabica coffee production, and is considered as the most significant pathogen of coffee plants worldwide [1]. The pathogen is an obligate parasite that infects leaves causing severe defoliation and leading to branch drought [2]. Coffee leaf rust causes not only a reduction in primary productivity in a single year, but also secondary loss in subsequent years due to branch drought [3]. The pathogen requires an average of 33 days to begin the sporulation process from the deposition of spores (urediniospores) on the leaf, and 40 d for 50% of the pustules (where the spores are located) to develop [4].
The conventional methodology for sampling rust in the field has proven to be impractical. One of the reasons for this is the long latency period of the fungus, which is approximately 30 days. Therefore, a 10% incidence of visible disease can indicate a subsequent doubling or trebling in disease development, even in the absence of new infections. Some lesions are incubated where the fungus is not yet in the sporulation phase (phase of disease spread), and, therefore, remains invisible to the naked eye. Moreover, visual assessments are very time-consuming and labor-intensive.
The control of coffee leaf rust can be carried out with the use of resistant varieties, but it does not dispense the use of chemical fungicides, therefore, chemical control is the main tool available to producers for the management of this disease. A fixed spray schedule is used to control coffee rust, with two to six fungicide applications per crop year. However, this no longer meets the requirements for efficient and rational disease control as, in certain areas, the peak of rust has shifted from May to September/October [5], and the fungicide must be applied at the appropriate time. This is crucial because to ensure the success of chemical control, applications must be made according to the disease cycle and its seasonal dynamics, which are influenced by climatic variations [6]. Therefore, the early detection of H. vastatrix infection in the field would be a very important tool for monitoring coffee leaf rust, and may allow the reduction or even the non-application of the chemical fungicides on some farms in a specific year if there is no incidence of coffee leaf rust. This would have environmental benefits as well as enhance yields and reduce costs. It is important to highlight that in the long term, over-application of chemical fungicides can lead to the selection of new resistant races of pathogens and cause harm to human health.
Numerous studies have demonstrated the potential of using multispectral images to identify plant diseases [7,8,9,10,11,12]. For example, Carmo et al. [13] demonstrated the feasibility of using multispectral images in conjunction with machine learning tools for the early detection of soft rot in lettuce seedlings caused by Pectobacterium carotovorum subsp. carotovorum. Based on the hypothesis that it is possible to distinguish diseases in agricultural crops using remotely sensed images, the aim of this study is to better understand how to facilitate the early detection of coffee leaf rust. We did this in the present work by testing the effectiveness of multispectral images acquired using an unmanned aerial vehicle (UAV) to distinguish coffee leaf rust caused by H. vastatrix in asymptomatic coffee seedlings inoculated with the pathogen, based on machine learning algorithms.

2. Material and Methods

The study was conducted in the municipality of Monte Carmelo, Minas Gerais, Brazil (18°42′43.19″ S, 47°29′55.8″ W, altitude = 873 m) (Figure 1). This region is characterized as having a humid and temperate climate according to the Köeppen climate classification [14].
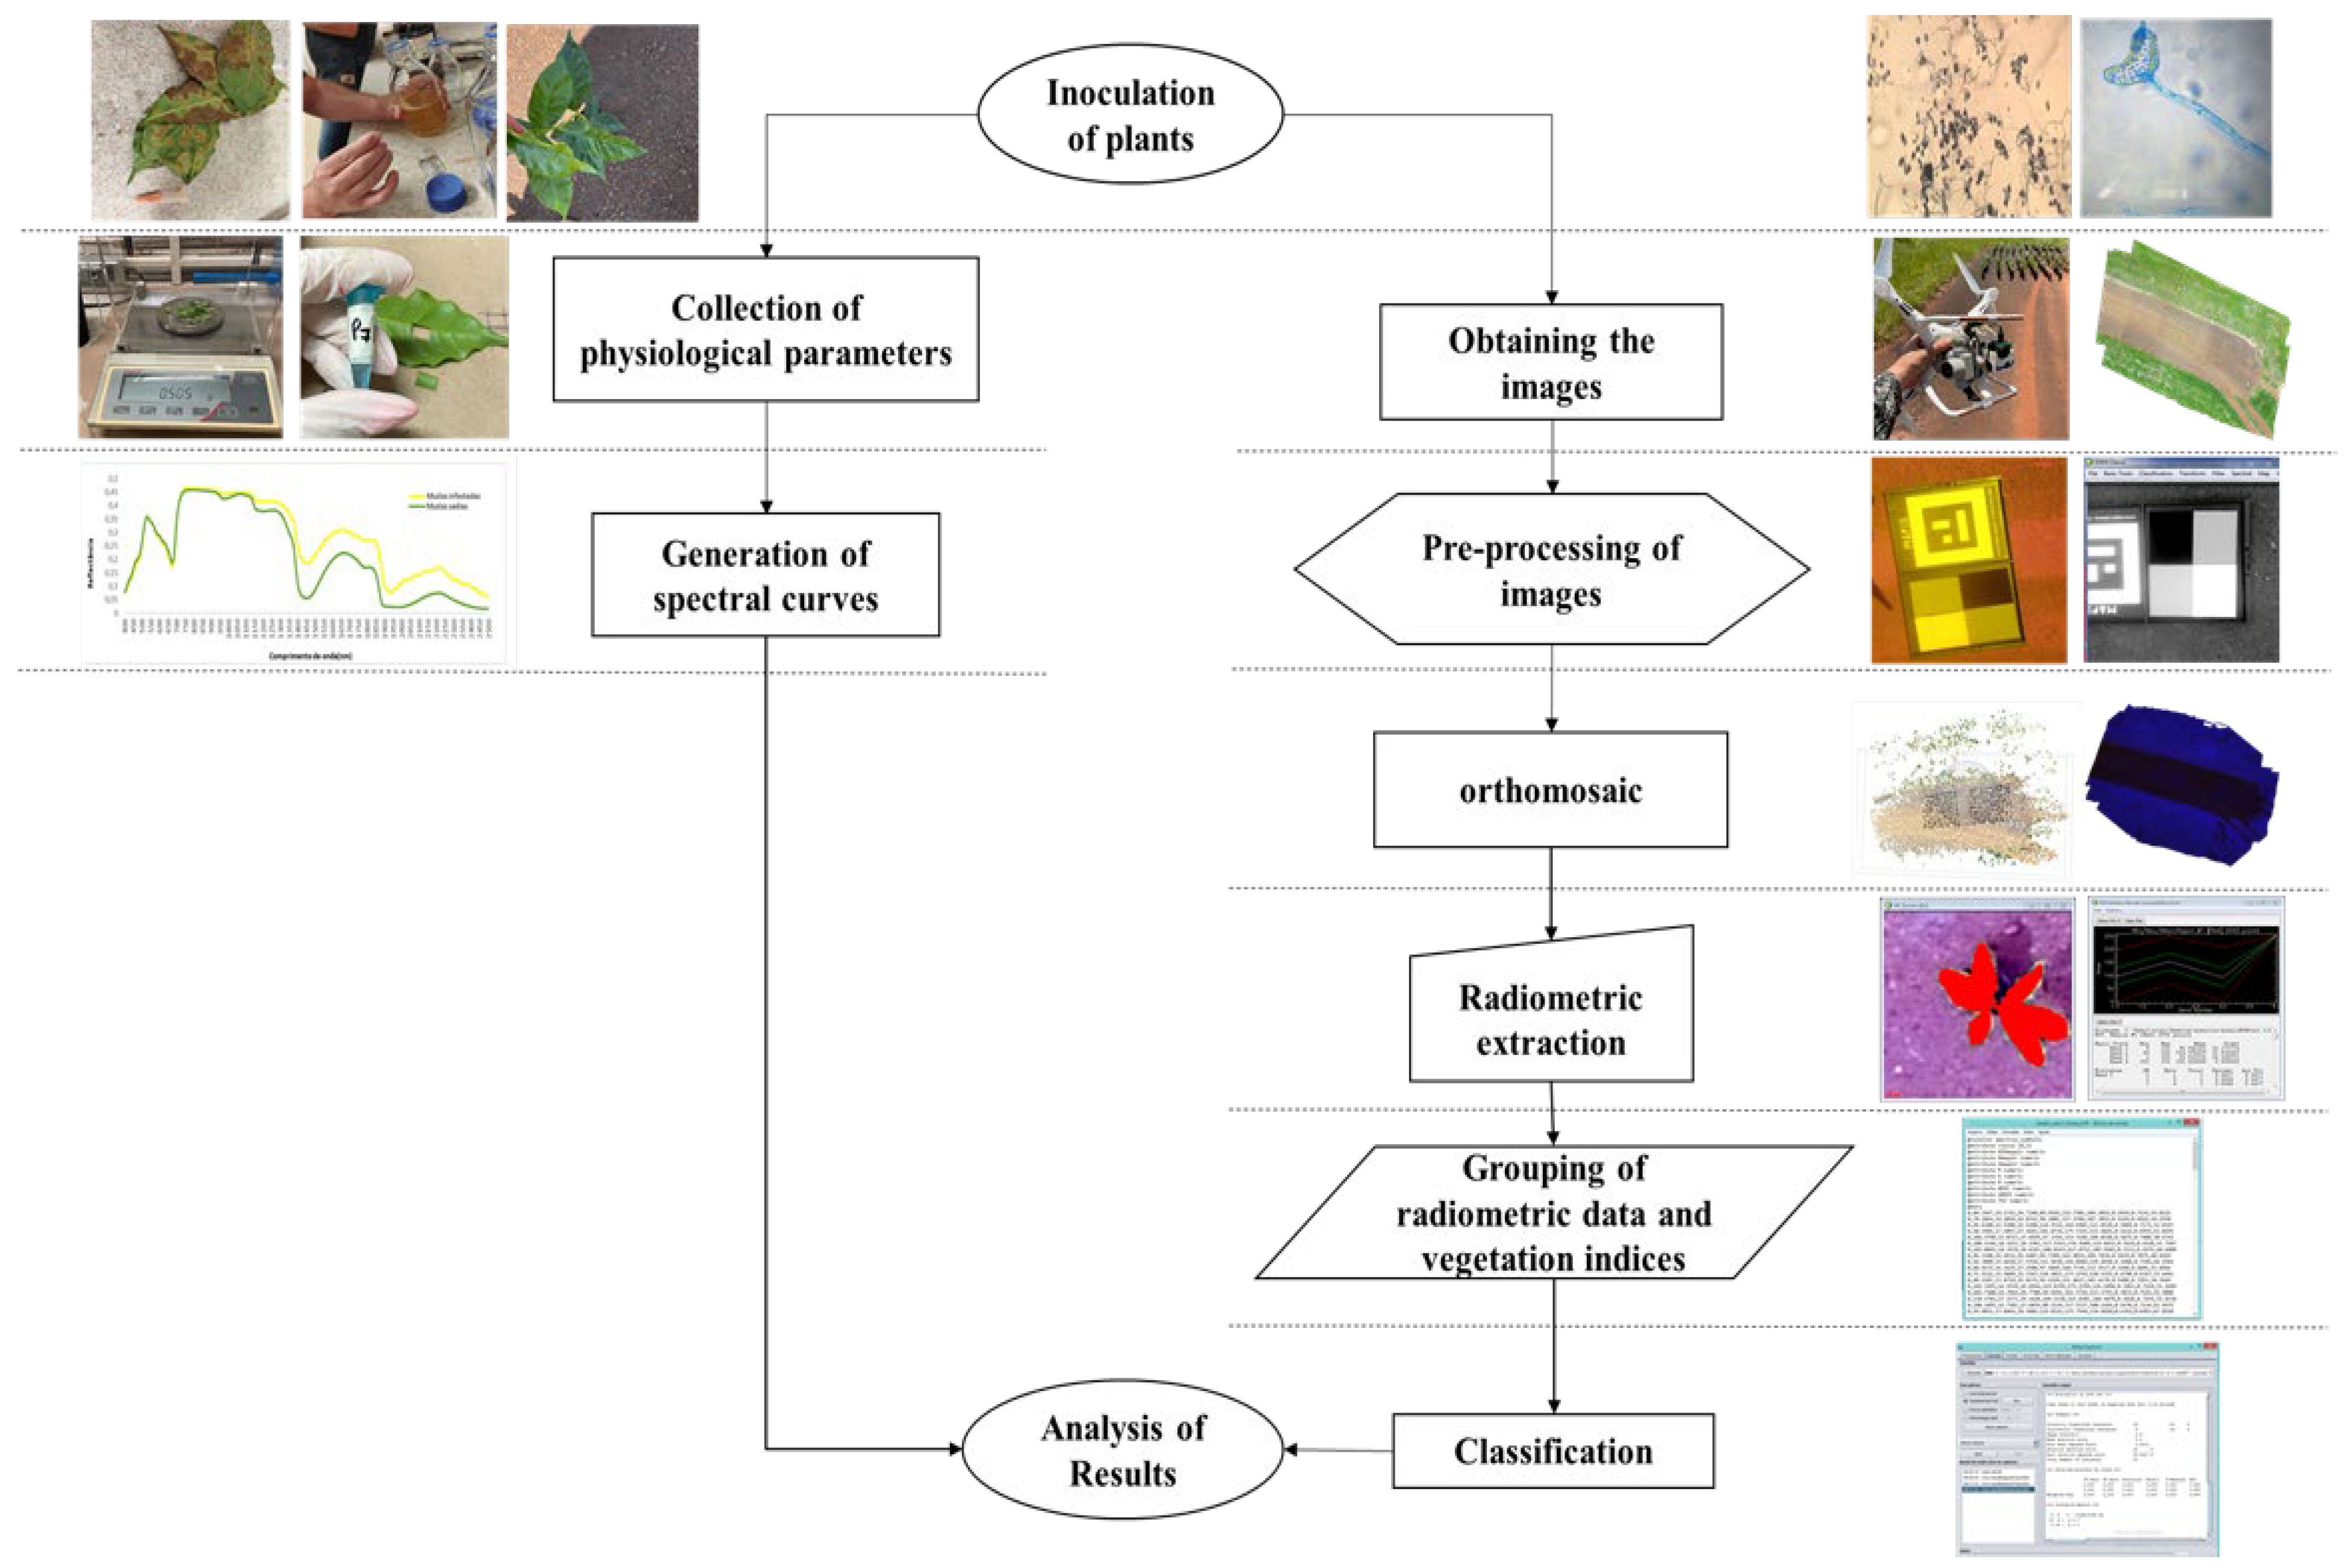
The methodology used in this study is illustrated as a flowchart in Figure 2.
Initially, inoculation with urediniospores of H. vastatrix was performed for the 160 seedlings of coffee tree cultivar ‘Mundo Novo’ IAC 379-19, which is highly susceptible to rust [15]. Subsequently, flights were performed and image mosaics using the images obtained using a Mapir Survey3W and RGB camera coupled to the UAV (Figure 3). At the same time, physiological parameters were measured for all of the seedlings inoculated and not inoculated for the elaboration of the simulated spectral curves to verify if the parameters would be significantly different in the two conditions. These evaluations were to verify if the development of the pathogen would influence the physiological parameters.

2.1. Inoculation of Coffee Seedlings with H. vastatrix

The urediniospores of H. vastatrix race II were previously collected in the field and preserved in plastic ampoules sealed with cotton. Subsequently, the urediniospores were placed inside a desiccator with a relative humidity of approximately 50% and a temperature of 4 °C [16]. Before inoculation, the viability of the urediniospores was evaluated using a germination test in a 2% agar water medium according to the method of Shein and Rotem [17] as modified by Zambolim and Chaves [16]. Only urediniospores with viability greater than 80% were used for the inoculation.
Inoculation was performed in the ‘Mundo novo’ IAC 379-19 seedlings at the phenological stage of four to six pairs of leaves. With the aid of a brush, urediniospores were inoculated onto the abaxial surface of fully developed young leaves at a concentration of 1 × 10⁶ urediniospores mL−1. After inoculation, plants were placed in a mist chamber (22 °C, RH ~ 90%) in the dark for 48 h. Thereafter, seedlings were maintained at 22 °C for 52 d with a photoperiod of 12 h.

2.2. Determination of Biochemical and Structural Parameters of Leaves for Hyperspectral Characterization

Simulated spectral curves were generated using the PROSPECT model fed by the physiological parameters of the coffee seedlings (both inoculated and non-inoculated) so that the degree of correspondence between the simulated curves and the classification of the imaged plants could be analyzed. Three evaluations were conducted at 15, 30, and 45 DAI. The radiative transfer PROSPECT model simulates the directional-hemispheric reflection and transmission in the 400–2500 nm spectral region at the individual leaf level [18]. The following input parameters were fed into the model to develop the simulated spectral curves: chlorophyll (CL) and total carotenoid (CN) content (µg cm−2); equivalent thickness of water in the leaf (cm); dry matter content per unit area (g cm−2), and brown pigment content. Moreover, a dimensionless leaf structure parameter (N) was determined that is related to the structural arrangement of the cells that compose the leaf, with values ranging between 1.5 and 2.5 [19]. To represent leaf structure, N was set to 1.5 for all 60 spectral curves generated for each condition (i.e., 60 curves for the healthy seedlings and 60 curves for inoculated seedlings), with 20 curves of each condition for each of the three flights (15, 30, and 45 DAI).
Three leaves of each seedling were used to measure CL and CN, and this was performed in triplicate. Leaves were crushed (0.5 g) and added to a solution of petroleum ether and acetone (1:1) according to the methodology proposed by Lichtenthaler and Wellburn [20] with modifications. The absorbance values were determined using a UV-190 spectrophotometer at 663, 645, and 470 nm, and the proportions of pigments (chlorophyll-a, chlorophyll-b, total chlorophyll, and total CN) were calculated using the equations described by Lichtenthaler and Wellburn [20].
The dry matter content was determined per unit area (g cm−2). For this, 20 units of 1 cm2 were extracted from each seedling and placed in a convection oven at a constant temperature of 65 °C for 72 h to remove all the water from the cells. Subsequently, the samples were weighed and the dry matter per unit area was determined.
Brown pigment content was defined as the senescent material content (Cs), determined as the average “darkening” of leaves between 0 (completely green leaves) and 1 (completely brown leaves) according to the methodology of Jiang et al. [21]. The leaves remained green 45 DAI, and so zero scores were assigned for all evaluations.
The thickness of the central vein (cm) of each leaf was measured to estimate the water content, i.e., the equivalent water thickness of the leaf. Cross-sections were made along the leaf midrib at 4:00 am in the laboratory and preserved in formaldehyde to preserve the water status. Millimeter sections of each seedling were then prepared on slides and recorded using an AxioCamERs 5s camera coupled to an optical microscope. Two photographs of each section were taken and measured (ImageJ 1.53) for each seedling to obtain an average water thickness value. The resulting 240 images were measured individually, giving 80 values for each evaluation period. Visible and near-infrared reflectance (VNIR) averages were calculated from the spectral curves for further comparative analysis with the radiometric data extracted from the mosaics. The data for leaf pigments and other physiological parameters of the inoculated and healthy coffee seedlings were compared using a fixed-effects ANOVA (p-values ≤ 0.05).

2.3. Image Acquisition

A Phantom 4 Pro drone, a camera with an RGB sensor, and a Mapir Survey3W camera were used to acquire the images. The RGB camera was capable of capturing images in the red (650 nm), green (550 nm), and blue (480 nm) channels, with a full width at half maximum (FWHM) of 10 nm and a resolution of 20 megapixels. The Mapir Survey3W camera has a resolution of 12 megapixels, with red (660 nm), green (550 nm), and near-infrared (850 nm) equivalent channels (RGN), and FWHMs of 40, 60, and 80 nm, respectively. Flights were performed at an altitude of 9 m, with 70% lateral overlap and 75% longitudinal overlap, at a speed of 1 ms−1. Each flight lasted approximately 2 min and captured 40 images in .jpeg format. The coffee seedlings were placed on an asphalt surface (Figure 1) spaced approximately 30 cm apart.
The images were taken between 11:00 am and 1:00 pm to avoid shade due to the inclination of the sun, and on clear, cloudless days to avoid interference in the visible and infrared spectral bands [22]. Three flights were made: the first flight was made 15 DAI when the spores of the pathogen had already germinated and the hyphae had penetrated the leaf tissue and established stable parasitic relationships (infection/colonization of the leaf tissue) but when there were no visible symptoms; the second flight was made 30 DAI when the first visible symptoms appeared, characterized by chlorotic lesions on the abaxial surface of the leaves, and the sporulation process had begun, and the third flight was made 45 DAI, when at least 50% of the pustules had developed on the leaves [4].

2.4. Image Pre-Processing

2.4.1. Radiometric Calibration

Radiometric calibration is necessary as the camera’s sensing elements do not measure the reflectance of the imaged objects, irrespective of the type of multispectral camera used. Rather, cameras reproduced the amount of electromagnetic energy that reached the sensor at the band for which the sensor was designed [23]. Radiometric calibration was performed using the Mapir Camera Control (MCC) software. The following input data were provided: camera model, lens, and filter, and the calibration target (20 cm × 20 cm) of known radiance that was inserted into the flight path.

2.4.2. Radiometric Normalization

Radiometric rectification was applied based on the use of a control dataset between the baseline image and the image to be normalized, as developed by Hall et al. [24]. The image of the second flight was chosen as the reference for normalization, focusing on two parameters: greater sharpness and less atmospheric disturbance. Subsequently, the calibration target of the Mapir Survey3W camera was positioned in the overflight area to extract the average values of the bright and dark groups of all images, as the radiation intensity is stable. The digital numerical values and reflectance of the bright and dark pixels were manually extracted from the reference image in the red, green, blue, and NIR bands of the RGB and RGN of the images. Equation (1) was then used to determine the linear transformation coefficients [25] for each spectral band:
T𝑖 = m𝑖 × x𝑖 + b𝑖,
where T𝑖 is the digital number (RGB) and reflectance (RGN) of the normalized image; m𝑖 is given as (Br𝑖 − Dr𝑖)/(Bs𝑖 − Ds𝑖); x𝑖 is the spectral band to be normalized; B𝑖 is given as (Dr𝑖 × Bs𝑖 − Ds𝑖 × Br𝑖)/(Bs𝑖 − Ds𝑖); aBr𝑖 is the average of the reference bright set; Dr𝑖 is the average of the reference dark set; Bs𝑖 is the average of the reference bright set to be normalized; Ds𝑖 is the average of the reference dark set to be normalized, and 𝑖 is the band of the sensor under study.
Equation (1) was applied to each band of the images using the Band Math tool, available in ENVI 5.1 (Environment for Visualizing Images). Three layers of each image were generated and combined into a single image with similar values to those of the reference image using the “Layer Stacking” tool.
One mosaic with RGB and another with RGN images were created for each of the three flights after pre-processing. The six mosaics were created using Agisoft Metashape version 1.6.2., which automatically calculates the positions and orientations of the original images. The process included two main steps: (1) image alignment by calculating the camera position and orientation using keypoint detection and image matching, and (2) generation of a dense point cloud. Based on the obtained 3D point cloud, a digital surface model (DSM) was then created. The mosaics were then created by projecting and combining the original images with the DSM.

2.5. Extraction of Radiometric Data

ENVI 5.1 software was used to extract radiometric data via the Region of Interest (ROI) function. The brightness values of the 320 seedlings (160 inoculated and 160 non-inoculated) of each RGB and RGN mosaic were collected during the first flight. The same procedure was performed in the other two flights, but the values of only 280 seedlings (140 inoculated and 140 non-inoculated) were extracted in the second flight, and 240 seedlings (120 inoculated and 120 non-inoculated) in the third. This reflected the destructive sampling of 40 for physiological analysis after each flight. To construct the multispectral curves, the average reflectance values of each band were calculated from the reflectance values extracted from the six mosaics generated with RGB and RGN sensors.

2.6. Calculation of Vegetation Indices

Vegetation indices were calculated from the radiometric data of each seedling (inoculated and non-inoculated) as these are correlated with biophysical parameters mainly in the visible and near-infrared bands [25]. One vegetation index was selected in the visible spectrum and two were selected in the near-infrared band (Table 1). These indices are related to the leaf area index (LAI), the biophysical parameters of the vegetation, and other phenotypic features that allow seedling development tracking.

2.7. Supervised Classification

After extracting the digital values of the spectral bands and calculating the vegetative indices, the data were organized to create files in arff format. Supervised classification was performed using Weka 3.9.4 (Waikato Environment for Knowledge Analysis) software. Artificial Neural Networks (ANN) and Support Vector Machines (SVM) algorithms were used because they are commonly applied to highly correlated variables or variables that do not have a normal distribution. The input radiometric data were divided into the following classes: RGN, NDVI, and GNDVI; RGB and TGI, and seedling condition class. The classes selected for classification at each evaluation time were bands only (for each camera) and combined bands and indices.
A total of 80% of the data classes were used for training and 20% for validation, for both classification algorithms. Thus, the Kappa coefficient, overall accuracy (OA), omission error (false negative), and commission error (false positive) were used to evaluate the authenticity of a classification. The Kappa coefficient is a measure of association used to describe and evaluate the degree of agreement, i.e., the reliability and accuracy of the classification [30], and OA was calculated as the proportion of correctly classified observations.

3. Results

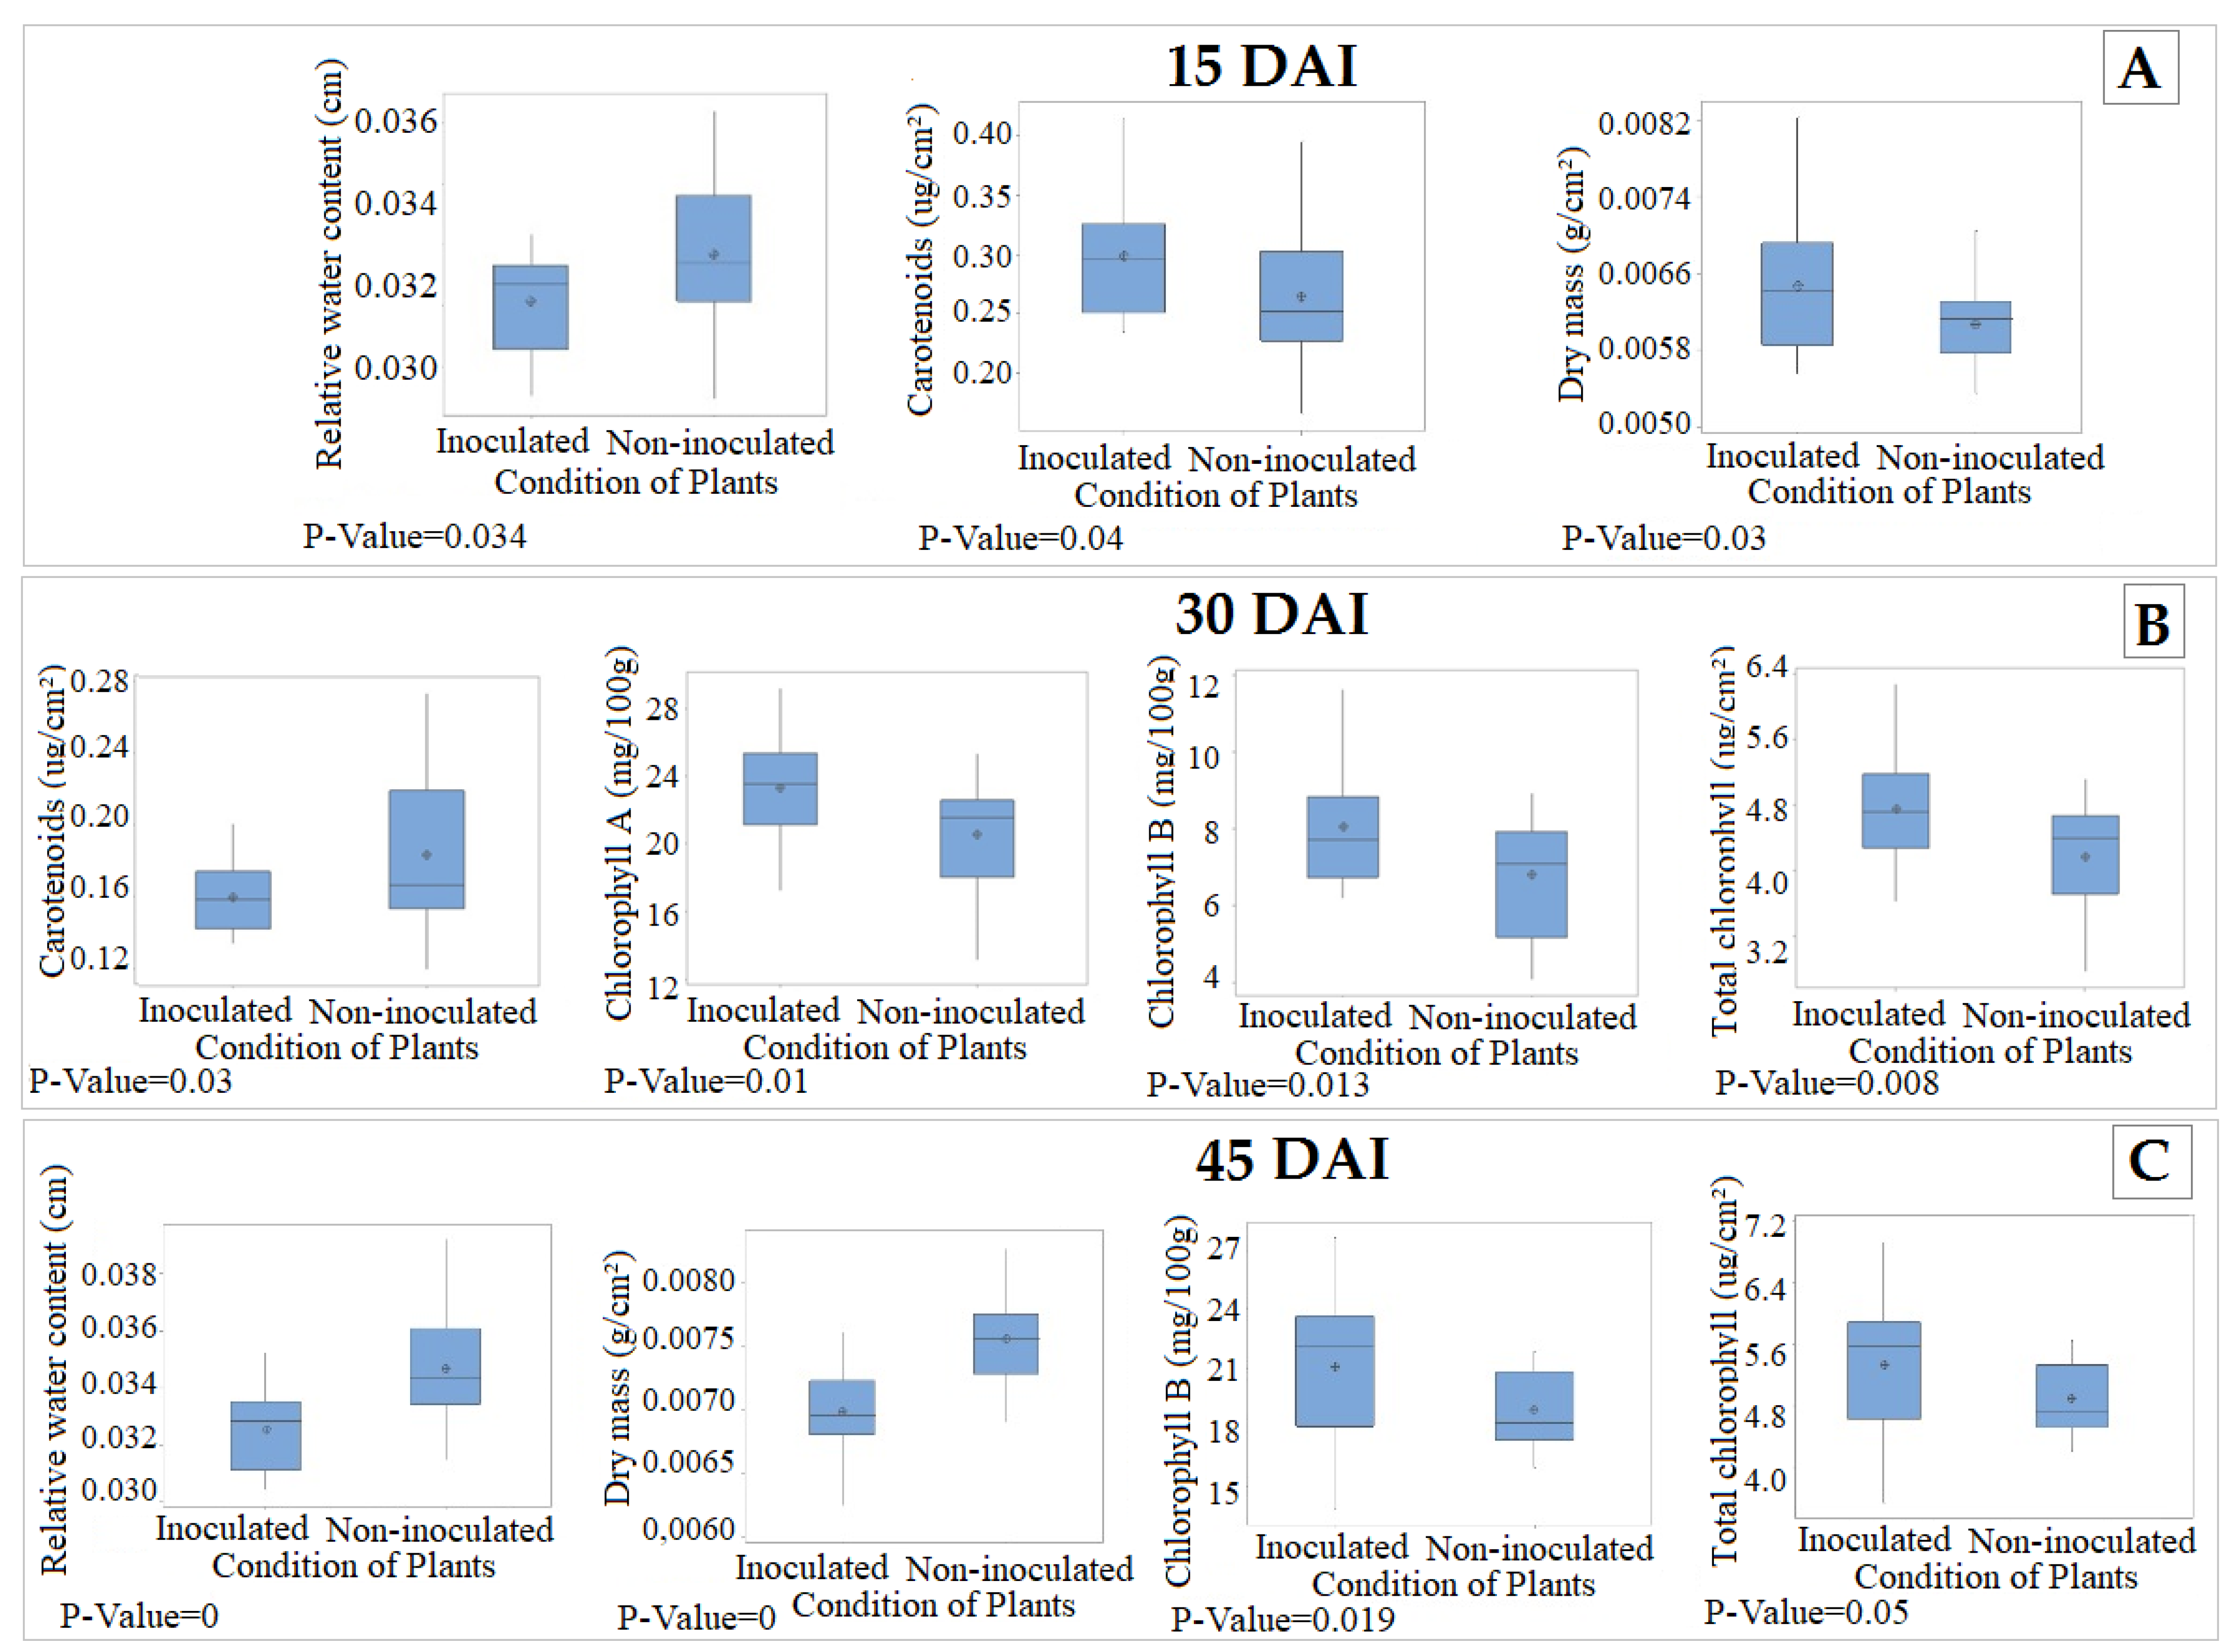
The physiological parameters of the H. vastatrix inoculated and non-inoculated coffee seedlings were significantly different (p ≤ 0.05) for water thickness, CN, and leaf dry matter content 15 DAI (Figure 4A). Data for the other parameters are not presented as they were not significantly different.
There was an increase in CN and leaf dry matter content and a decrease in leaf water thickness at 15 DAI (Figure 4A). At 30 DAI, all the coffee seedlings showed significant differences (p ≤ 0.05) in CN, chlorophyll-a, chlorophyll-b, and total chlorophyll (Figure 4B). At 45 DAI, water thickness, dry matter, chlorophyll-b, and total chlorophyll were significantly different (p ≤ 0.05) (Figure 4C).
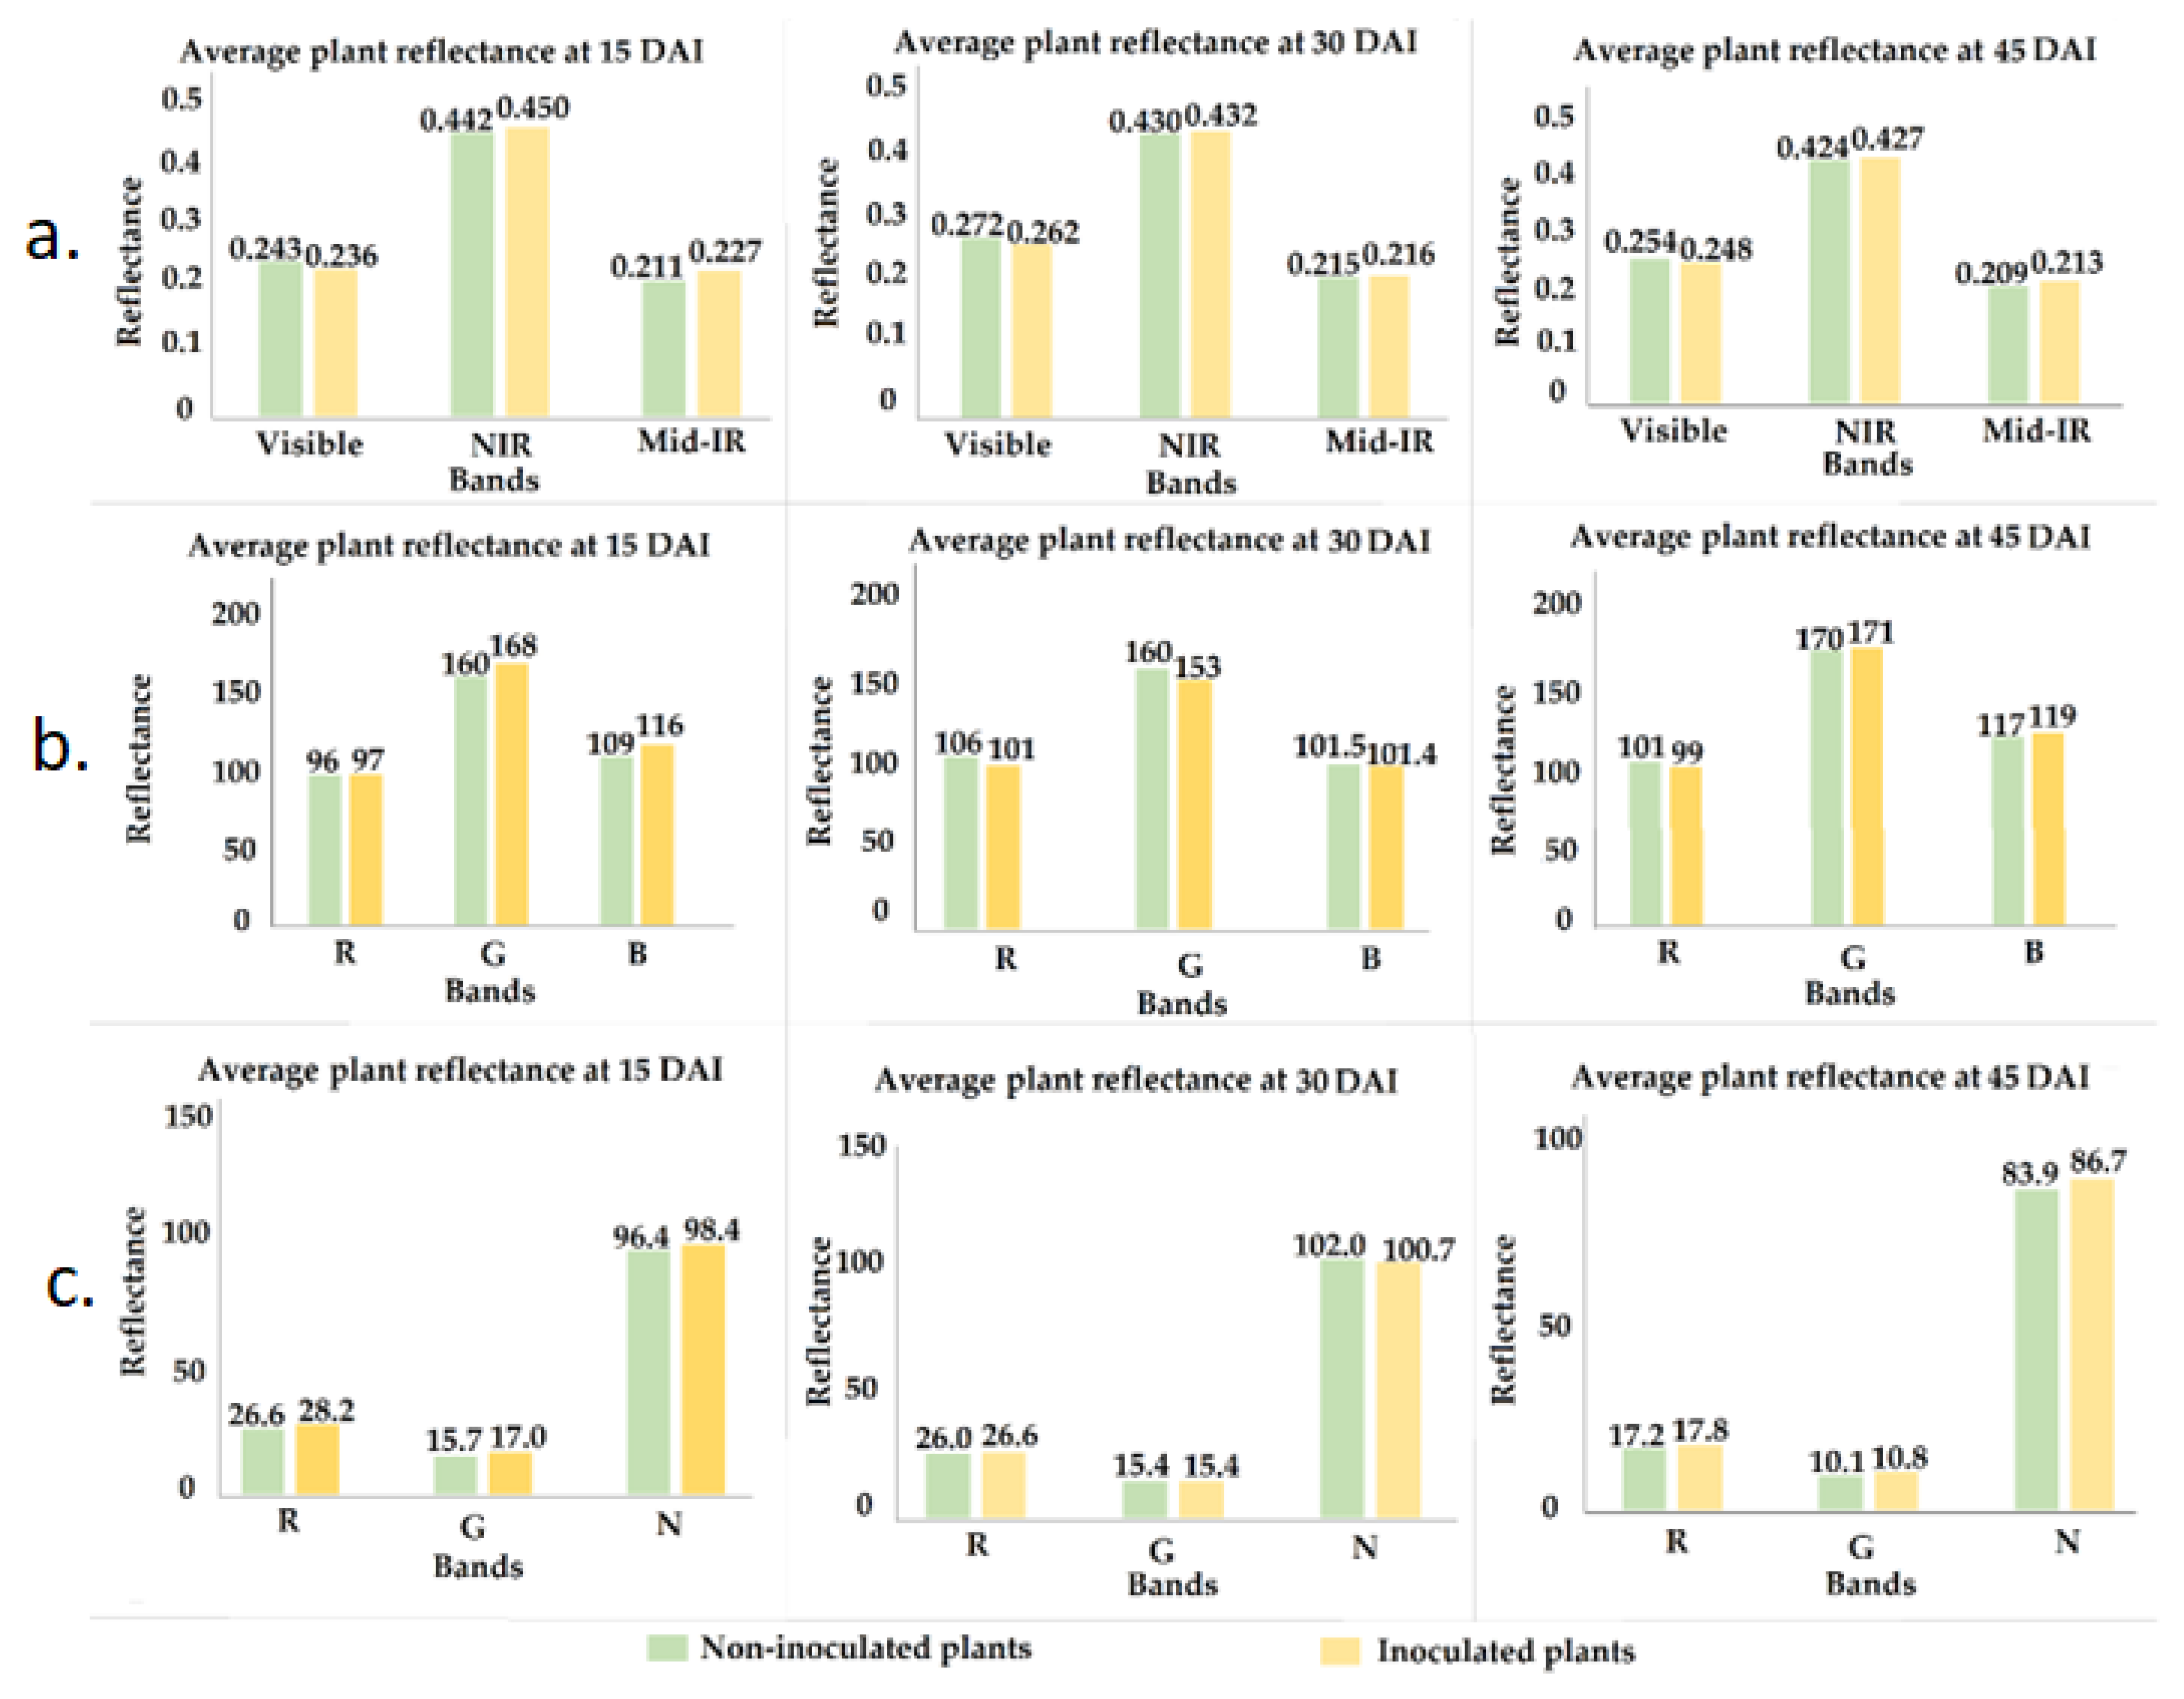
Figure 5 shows the average reflectance values of the inoculated and non-inoculated seedlings from the spectral curves (for the visible, NIR, and mid-infrared bands), and the average reflectance values of the seedlings from the RGB and RGN sensors. Figure 6 shows the reflectance discrepancies between the inoculated and non-inoculated seedlings as a function of the sensors and the evaluation periods.
The seedlings showed a greater discrepancy in reflectance of the spectral curves (Figure 5) at 15 DAI in the NIR band. The inoculated seedlings during this period showed a 23.6% higher reflectance (Figure 6) than the non-inoculated seedlings. There was a greater discrepancy in the visible band at 30 DAI. These results show that H. vastatrix caused greater reflectance in the blue and green bands at 15 DAI (Figure 5) with the RGB sensor. Consequently, during this period, the RGN sensor recorded a greater discrepancy in these reflectance bands. The RGB and RGN sensors registered higher reflectance in the red and green bands at 30 DAI, and the greatest NIR discrepancy was recorded at 45 DAI. During the third evaluation around (45 DAI), the red and blue bands showed a higher discrepancy with the RGB sensor, but the RGN sensors showed a higher discrepancy in the green and infrared bands.
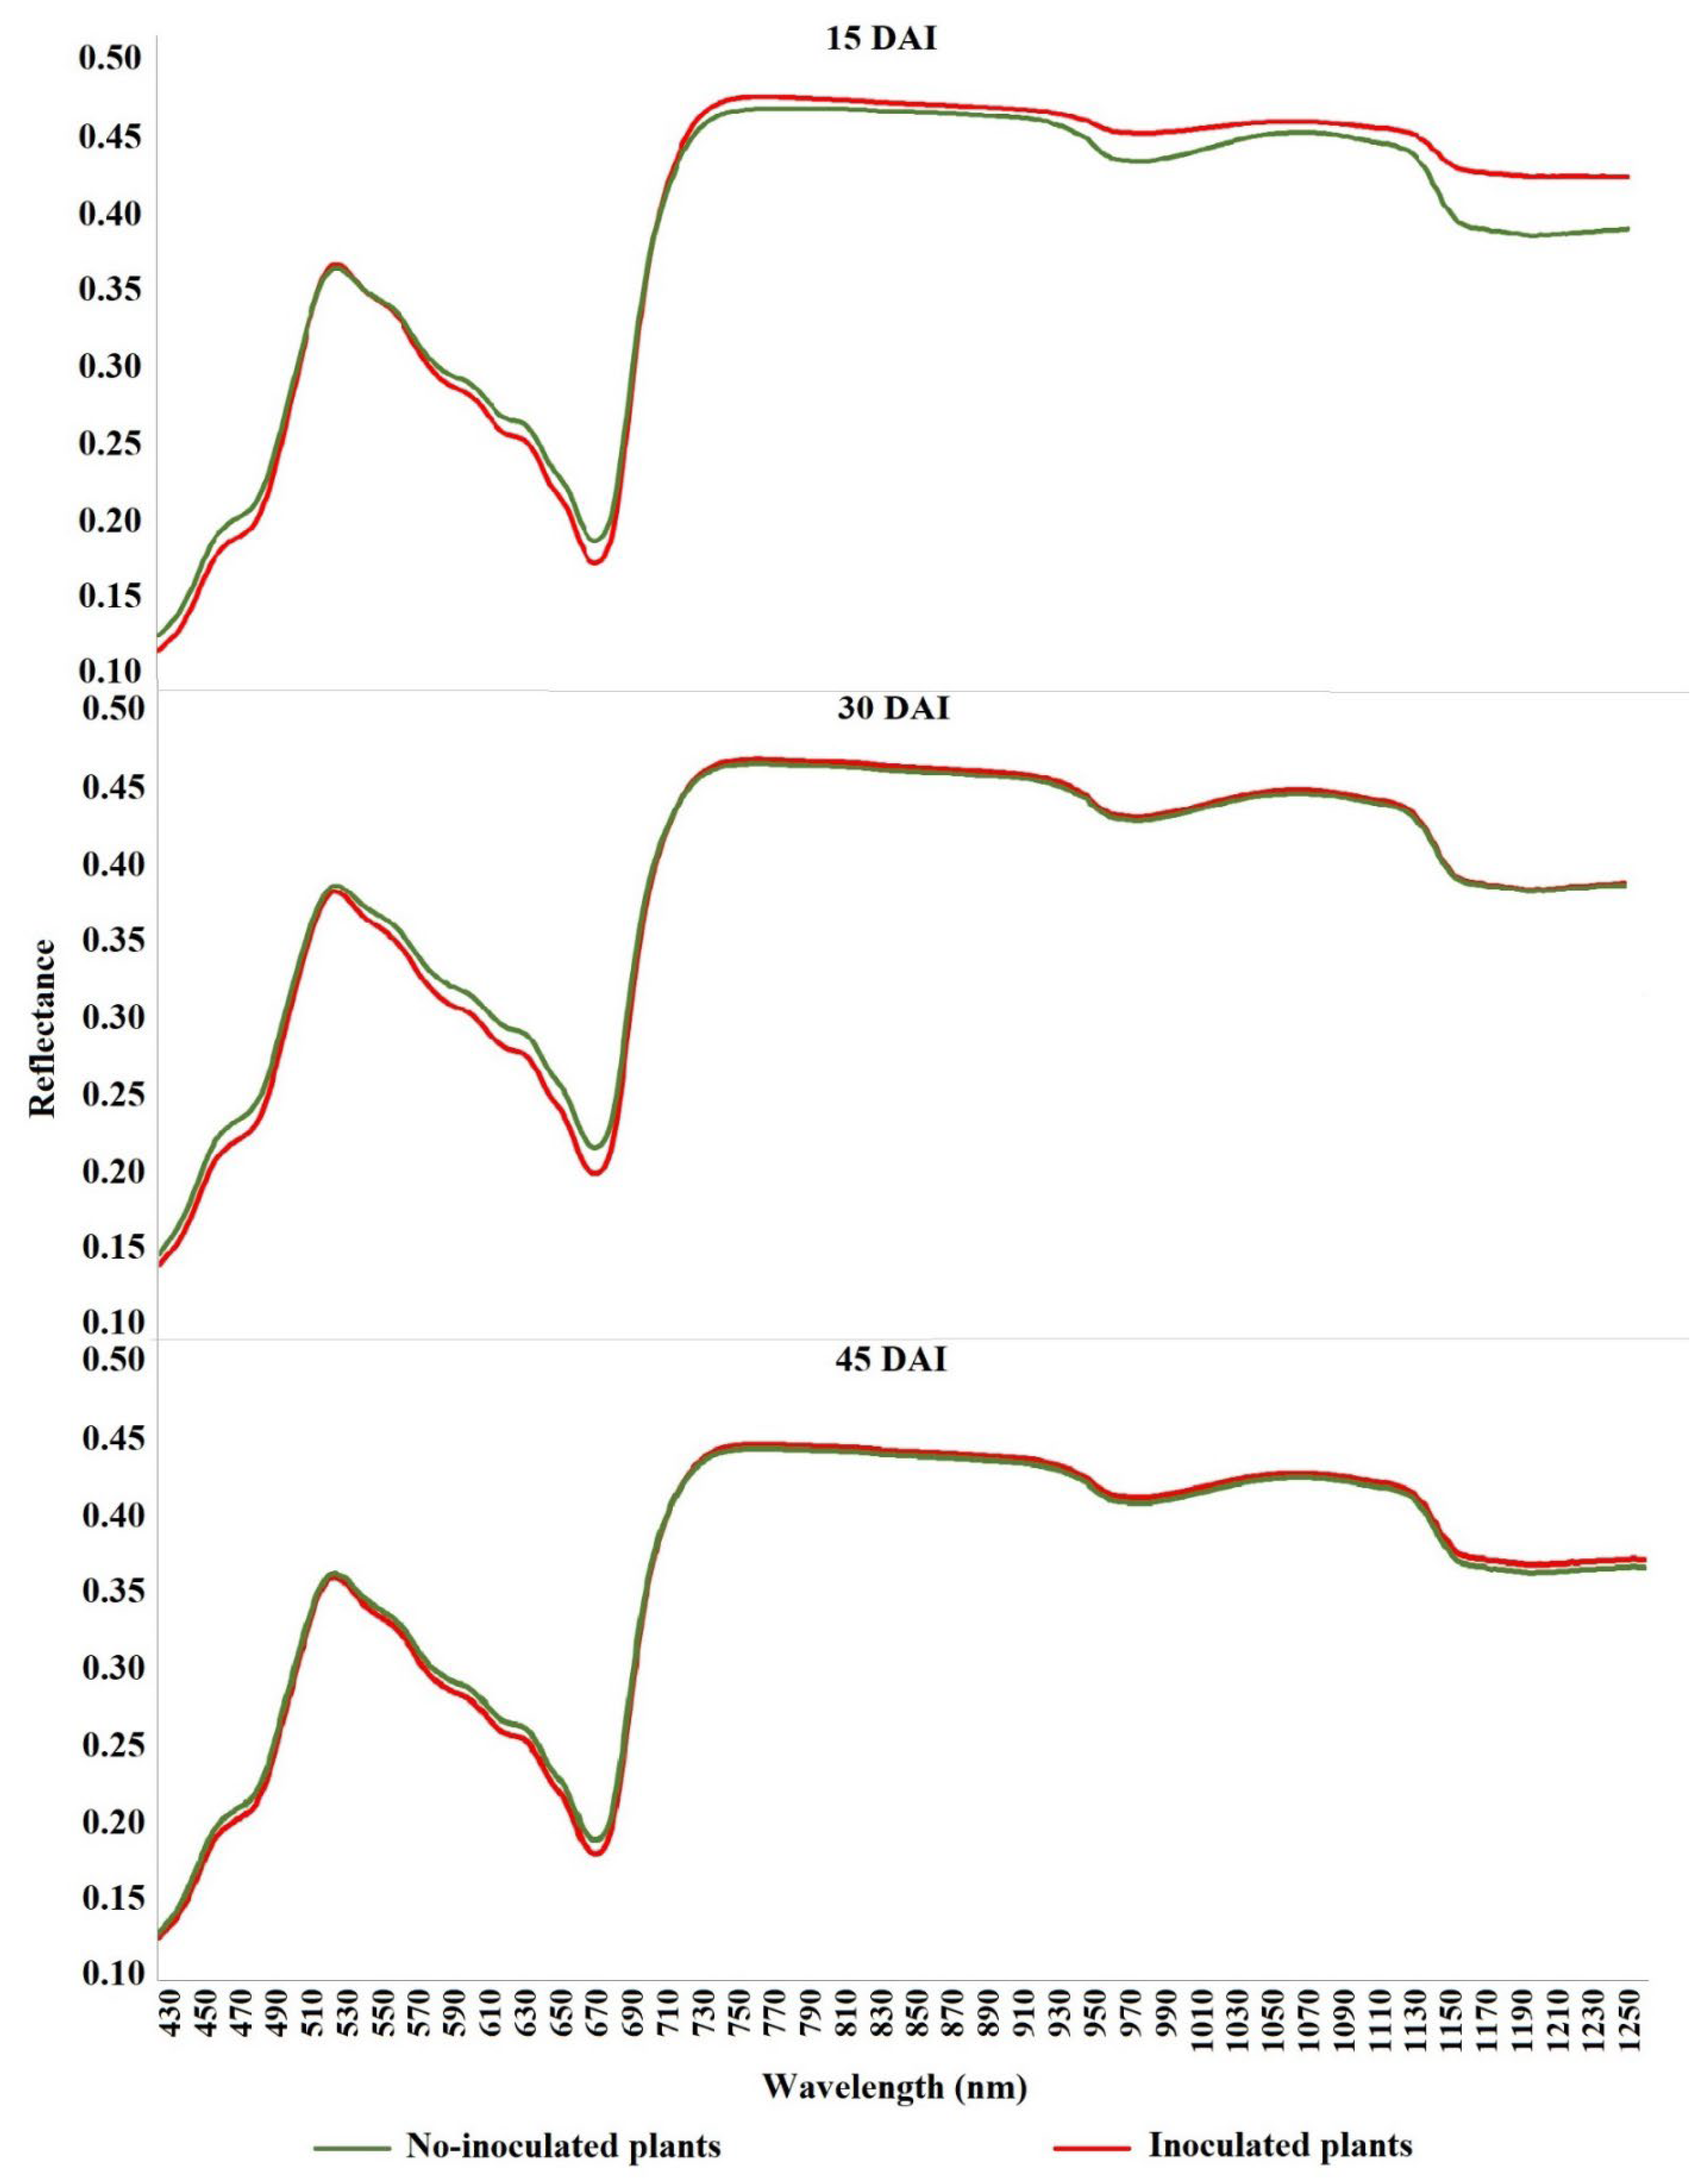
The spectral responses of the inoculated and non-inoculated coffee seedlings at 15 DAI are shown in Figure 7. The inoculated seedlings had lower reflectance values compared to non-inoculated seedlings in the visible band during the asymptomatic stage of the disease. The curves show that the inoculated seedlings had greater absorbance in the red band (650 nm) and better separation of the curves in the near-infrared band.
The spectral curves diverged more in the visible band at 30 DAI (Figure 7). In the mid-IR and NIR bands, the curves showed less discrepancy. The inoculated seedlings showed 0.43% and 0.46% higher reflectance than the non-inoculated seedlings, respectively. As parameters such as water thickness and dry matter were not significantly different between the inoculated and non-inoculated seedlings, this response was not unexpected.
The spectral curves (Figure 7) showed very similar responses in the visible and NIR bands at 45 DAI. However, some physiological parameters (water thickness and dry matter), which influence reflectance absorption in the NIR band, and chlorophyll-b and total chlorophyll, which influence reflectance absorption in the visible band, showed significant differences. The non-inoculated seedlings during this period had a 2.3% higher average reflectance value (Figure 7) than the inoculated seedlings in the visible band. In the near- and mid-IR bands, the reflectance of the inoculated seedlings were also higher, with values of 0.79% and 2%, respectively.
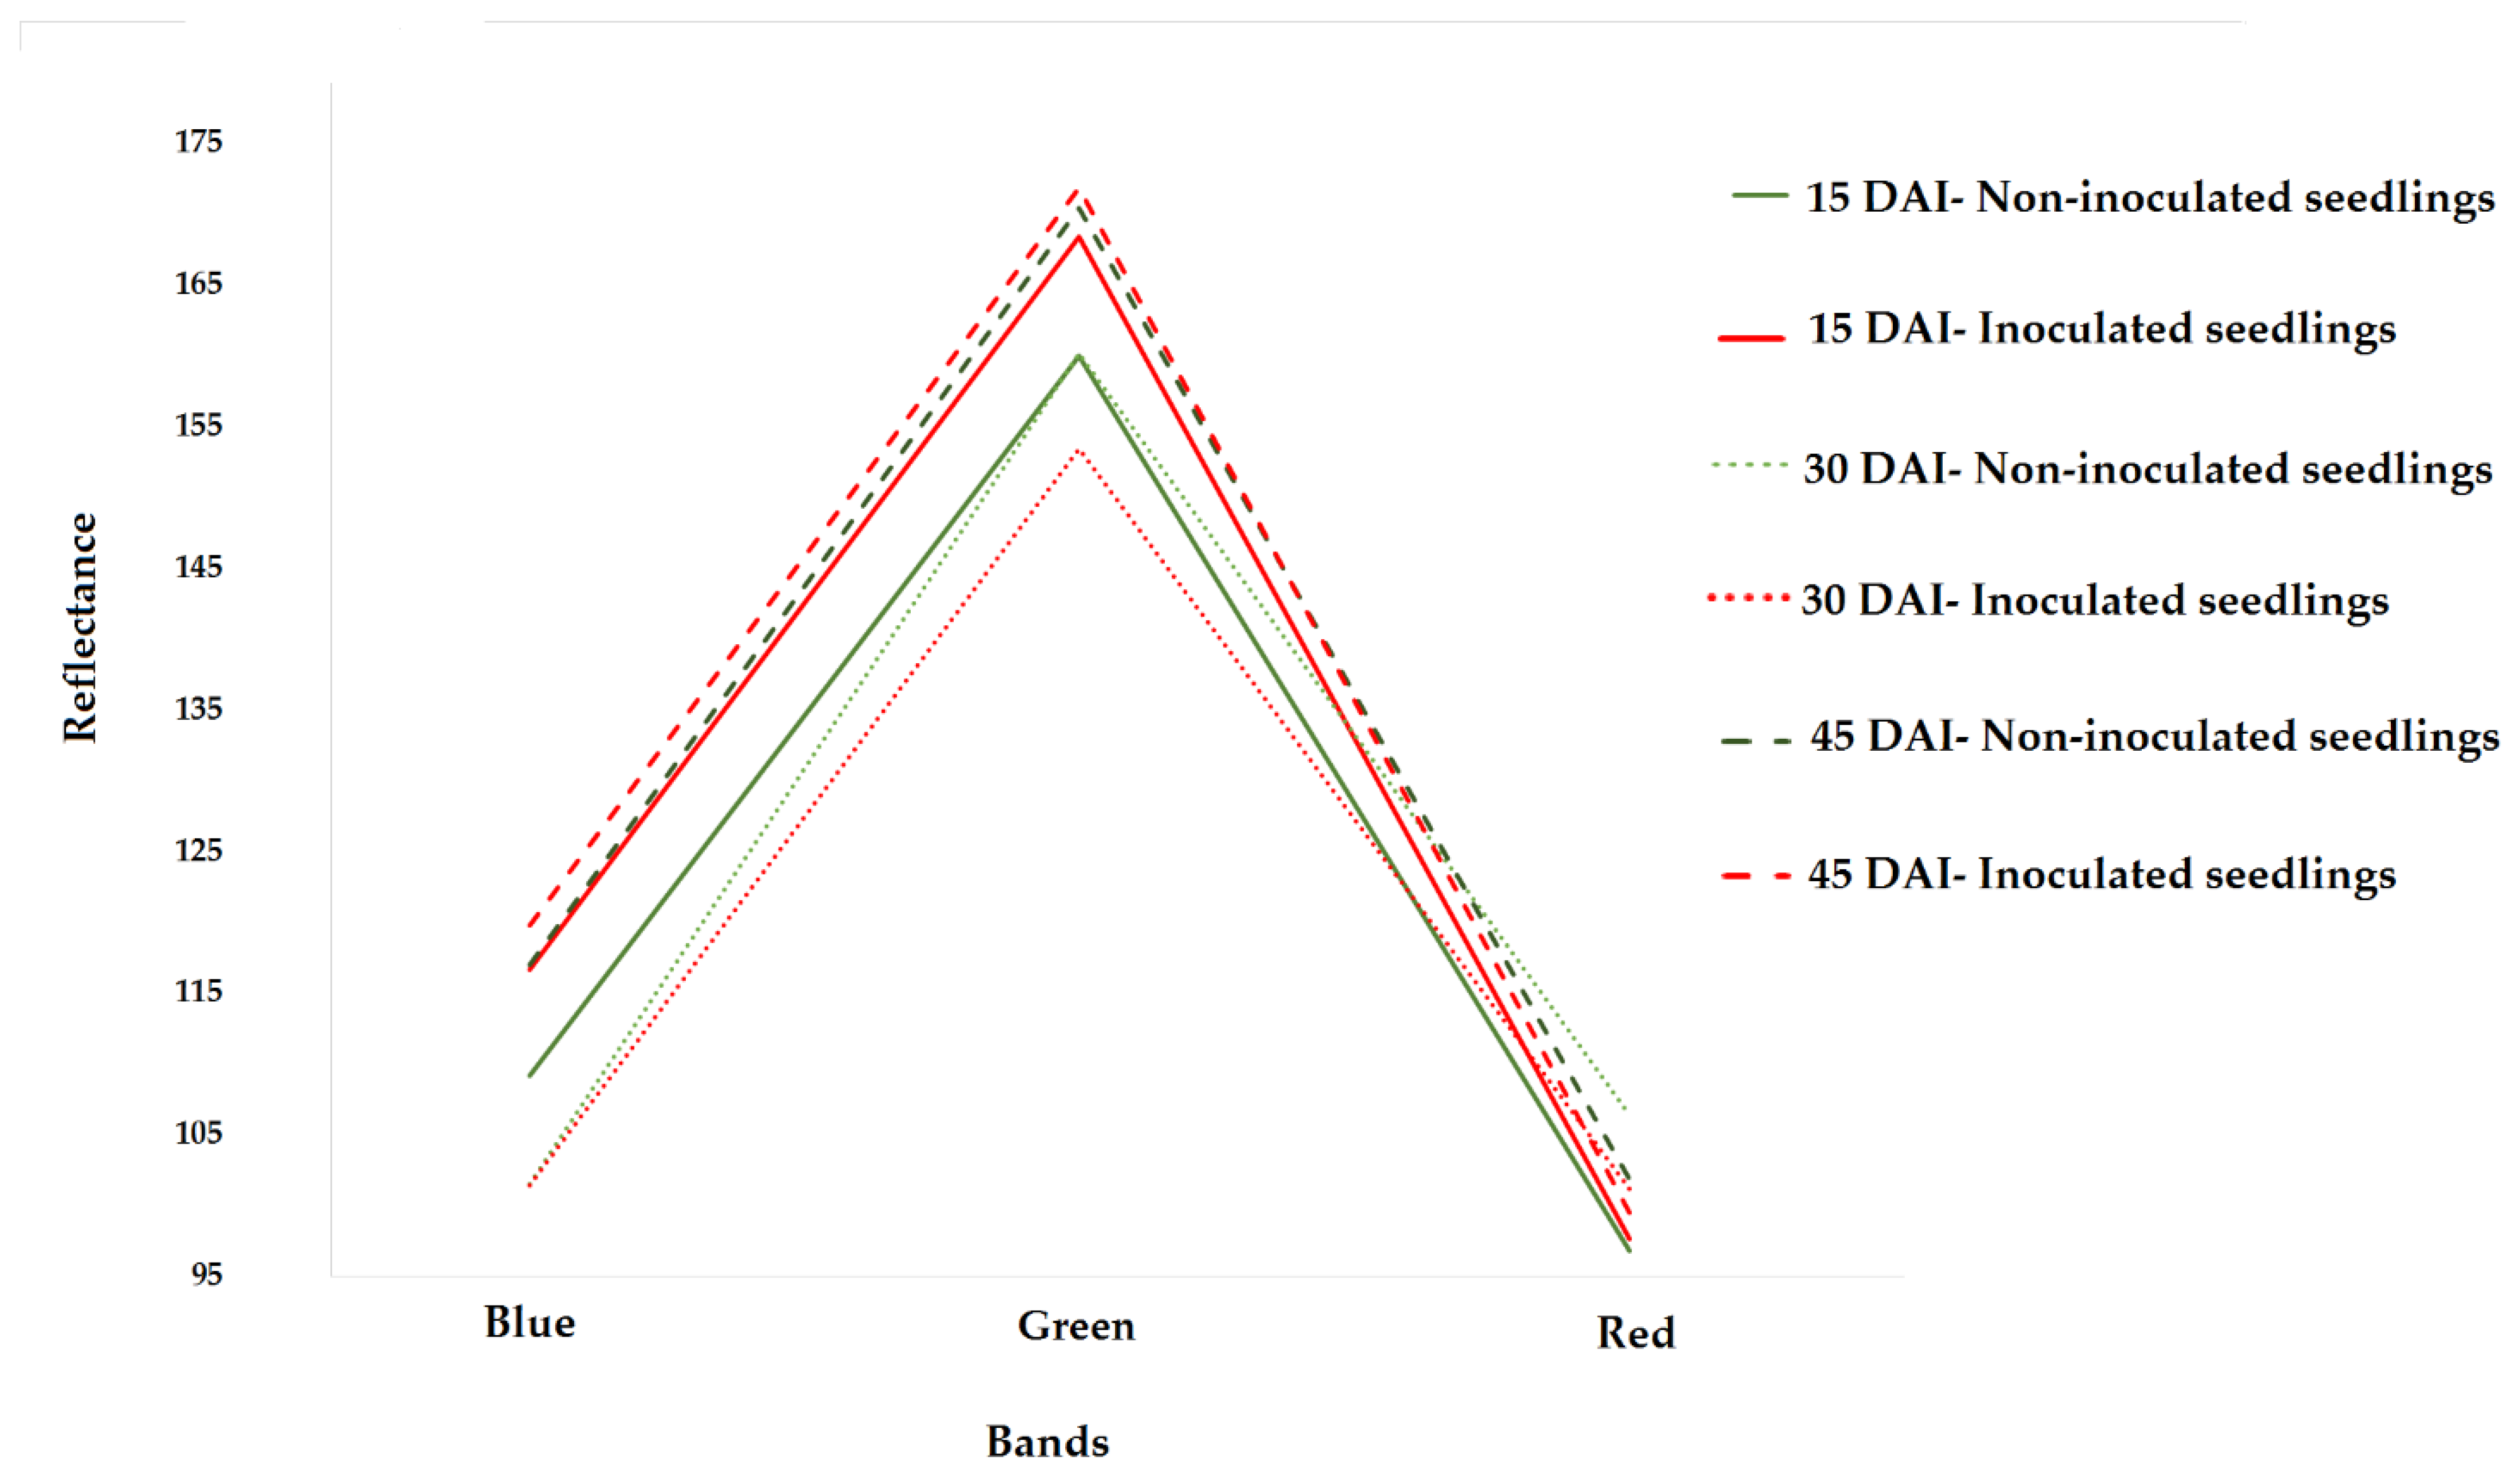
Based on the average reflectance values obtained from the RGN and RGB sensor images, the spectral response of the inoculated and non-inoculated coffee seedlings at 15, 30, and 45 DAI are shown in Figure 8 and Figure 9. The images of the RGB sensor at 15 and 30 DAI best distinguish plant condition; there is greater separation in the blue and green bands at 15 DAI, and greater separation in the green and red bands at 30 DAI.
The SVM algorithm performed better in all evaluations. The algorithm distinguished between the inoculated and non-inoculated seedlings at 15 DAI, based on the RGN bands and the subset of RGN bands and vegetation indices (NDVI and GNDVI), when symptoms are not typically visible to the naked eye. The subsets showed moderate agreement (K = 0.6) and an overall accuracy of 80% (Table 2).
The confusion matrix for the classes and evaluation periods showed that for 15 DAI, a total of 32 out of the 40 seedlings used for validation (Table 3) were correctly classified by the SVM algorithm. Notably, the vegetation indices did not contribute to the results, i.e., the subsets that contained the vegetation indices did not obtain better classification results. The health status of the seedlings was determined using the RN classifier, showing better classification with the subset RGN bands and indices (NDVI and GNDVI). A total of 30 out of the 40 seedlings used for validation were correctly identified.
The coffee seedlings showed visible symptoms of disease at 30 DAI. The SVM algorithm provided the best result for the RGB band (Table 4), with substantial agreement (K = 0.7) and an overall accuracy of 85% during this period. The algorithm correctly classified 34 of the 40 seedlings used for validation (Table 3). The RN algorithm showed a moderate Kappa value (K = 0.6) and an overall accuracy of 80%, correctly classifying 32 of the 40 seedlings used for validation. Similar to the spectral curves, the condition of the plants was more visible at 30 DAI.
The non-inoculated seedlings showed a higher reflectance response in the NIR band, but this discrepancy was only 1.23% (Figure 5) compared to the non-inoculated seedlings. Classification using the RN algorithm showed a moderate Kappa index (0.5) and an overall accuracy of 76% in the RGN band. Therefore, a total of 30 out of the 40 seedlings used for validation were correctly classified (Table 3).
The 45 DAI classifications showed poorer results compared to the first two evaluations, as did the corresponding spectral curves. The SVM algorithm (Table 5) from the RGN band achieved an overall accuracy of 70% and a reasonable Kappa index (0.4). A total of 28 out of the 40 plants used for validation were correctly classified with the SVM algorithm (Table 3).
The inoculated seedlings had a greater spectral response than the non-inoculated (3.26%) seedlings in the NIR band (Figure 5), but the spectral curves were not sensitive to these differences (Figure 7).

4. Discussion

The obtained spectral curves for the inoculated seedlings showed higher reflectance in the IR band and greater absorption in the red band (650 nm) compared to the non-inoculated seedlings, which characterized more photosynthetically active material [31]. However, the RGB sensor was not very sensitive to this absorption signal. The similarity (0.8%) between the spectral responses of the seedling groups in the red band may have limited the ability of the algorithms to separate the classes based on the RGB images at 15 DAI, with the sensors more sensitive to discrepancies in the red band better able to distinguish between the treatment groups. These results corroborate modeling performed by Chemura et al. [32], who identified the red and NIR bands as the most important variables for distinguishing coffee leaf rust stages with resampled data from the multispectral Sentinel-2 sensor.
The RGN and RGB bands were able to distinguish between coffee seedlings that were inoculated with the urediniospores of H. vastatrix and those that were not at 15 DAI using both classifiers. Notably, the inoculated seedlings were still asymptomatic at this stage. Furthermore, the classifications performed with the RGB sensor bands were less accurate than those of the multispectral sensor. This is not unexpected given that the spectral curves generated at 15 DAI showed small distances in the visible band compared to the NIR band, with no significant difference in the chlorophyll content of leaves absorbing the reflectance signal in this region. Notably, the same pattern was not observed for CN content.
The RGB band generated a satisfactory result at 15 DAI using the SVM algorithm and classified the non-inoculated seedlings better, possibly because the brightness values in the red band had similar values, which likely confused the classification model. Furthermore, the spectral response of the non-inoculated seedlings was greater in the green (4.9%) and blue (6.4%) bands. The inoculated seedlings may have exhibited a lower spectral response due to radiant energy absorption, given that carotenoids absorb in the blue band [25]. RGB images can be an alternative to RGN images, due to the Mapir camera having a lower cost compared to multispectral cameras. The multispectral images provided a better classification at 15 DAI as the inoculated seedlings were more reflective in both the NIR and spectral curves. Notably, the higher the reflectance in the NIR band, the higher the leaf area and biomass index typically are [33]. The inoculated seedlings showed 2.1% higher brightness values in the NIR band, which may reflect enhanced photosynthesis related to the activation of photosystem I [34], which in turn may have led to an increase in LAI and biomass and, thus, water loss.
Water loss from the inoculated seedlings resulted in more internal scattering of the incident radiation and, consequently, higher reflectance [25]. Although the multispectral images yielded better results, both sensors showed the potential for the early detection of coffee leaf rust in the inoculated and asymptomatic seedlings. These results are consistent with those of Velásquez et al. [35], who evaluated the colonization stage of H. vastatrix in Coffea arabica using multispectral drone-coupled cameras, wireless sensor networks, and deep learning (DL) techniques. These authors demonstrated that the models using multispectral data performed better than those using RGB sensor data, although both sensors performed satisfactorily.
At 30 DAI, the coffee seedlings were at the first stage of disease progression, known as the “slow phase” (severity ≤5%). During this period, better results were obtained with the RGB band. The spectral curves showed a greater distance in the visible band as pigments such as CN, chlorophyll-a, and chlorophyll-b, as well as total chlorophyll content being significantly different. Photosynthesis performed by autotrophs for photochemical production of organic matter and the release of oxygen uses chemical energy converted from visible light absorption, and chlorophylls are primarily responsible for this absorption [36]. Thus, the algorithms better detected the seedlings during this period due to the higher brightness values in the red band associated with the absorption by chlorophyll-a [37]. The photosynthetic pigments that affect reflectance the most are chlorophylls a and b, which have absorption peaks in the red and blue bands, respectively [38]. The larger discrepancy (5.1%) in the red band may have contributed to the better classification performance, given that the discrepancy in the blue band was very small (0.07%). Furthermore, the non-inoculated seedlings showed higher reflectance in the green band (4.41%), which could indicate that their internal structure remained unaffected at this time [39].
Classification was possible using the RN algorithm and the RGN sensor data at 30 DAI, although the seedlings were able to normalize LAI and biomass. The water thickness parameter was also normalized through the spectral curves in the NIR band, which showed a similar response.
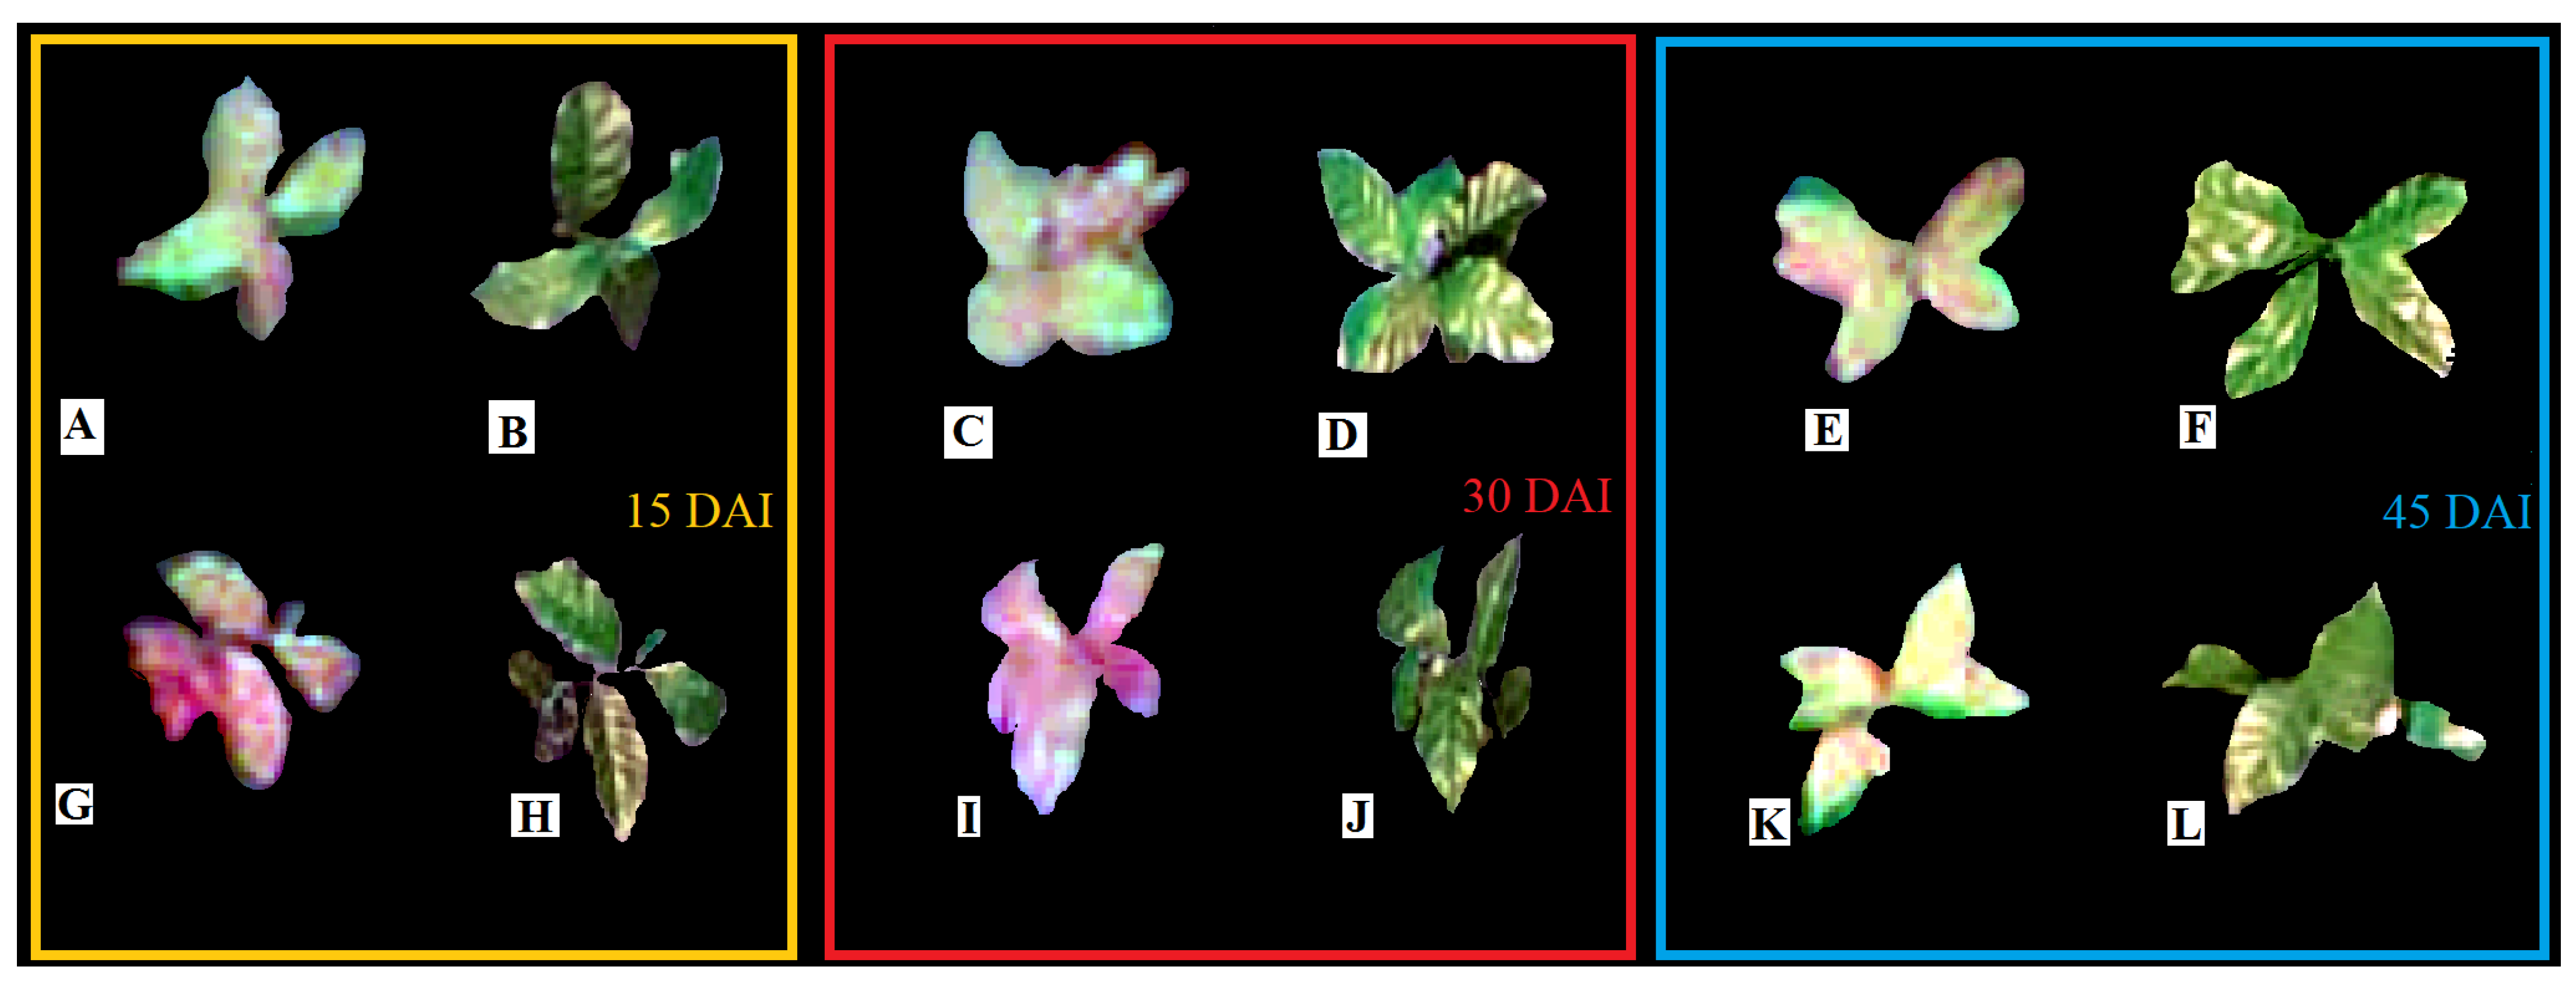
The classification was poorest at 45 DAI. This could have been due to the increase in the nutritional variability of the seedlings, which would have impeded the model performance. Therefore, the RGB sensor was not sensitive enough to distinguish between the treatment groups during this evaluation period. While the inoculated seedlings were better classified as the NIR band responded more strongly (3.2%), this response was not evident in the images (Figure 2) or the spectral curves (Figure 8). At 45 DAI, the pathogen was at the sporulation/spreading stage, with very clear symptoms and signs of disease including chlorotic lesions on the adaxial surface and sporulation with an orange powdery appearance on the undersides of the leaves. During this time, the inoculated seedlings showed more reflection in the red (3.2%) and green (6.55%) bands indicating that the non-inoculated seedlings were under stress, such as a lack of root space in the experimental pots, which may have affected the classification.
The early detection of coffee leaf rust using a low-cost and adaptive technology allows for a reduction in the application of chemical fungicides in order to manage coffee rust, thus reducing the costs of coffee production and allowing for a less aggressive, more efficient management of the disease. The possibility of early detection of the coffee leaf rust using an unmanned aerial vehicle (UAV) in the field may represent a paradigm change for coffee producers making it possible to carry out the monitoring of this pathogen in a preventive way in extensive areas with a low cost and without the need of manpower for conventional methodology for sampling this disease.
The ability to discriminate diseases in their early stage can be extended to other pathosystems even in asymptomatic plants (visual symptoms) due to physiological changes in plants caused by pathogens that are sensitive to the near infrared [40].

5. Conclusions

This study demonstrates the potential of using multispectral images to monitor early-stage infection of coffee plants by H. vastatrix, the most important pathogen of coffee plants worldwide, using an unmanned aerial vehicle (UAV). The early detection of this pathogen in the field with low-cost technology can be an important tool for the monitoring of coffee leaf rust and, consequently, a more sustainable management of this pathogen, making applications of chemical fungicides only when necessary.
Satisfactory results were obtained using RGN and RGB sensors for the classification of infected seedlings at 15 DAI. Vegetation indices had no positive effect on the classification. Notably, the RGN sensor yielded better results at 15 DAI by distinguishing between leaf area and biomass states based on the NIR band. However, the RGB sensor yielded a better result when classifying seedlings with visible symptoms, and therefore, might provide a low-cost alternative to RGN sensors.

Author Contributions

A.d.S.S., B.S.V., G.D.M. and A.C.S.S. conceptualized the project. A.d.S.S., B.S.V. and T.A.B. provided coffee seedlings of the coffee cultivar ‘Mundo Novo’. B.S.V. collected in the field urediniospores of H. vastatrix. A.d.S.S., T.A.B. and G.D.M. prepared the flight plan and flew the UAV for aerial images. G.D.M. helped develop protocols and routines for image processing and analysis. A.d.S.S., T.A.B. and A.C.S.S. measured physiological parameters for all of the seedlings inoculated and not inoculated for the elaboration of the simulated spectral curves. A.d.S.S., B.S.V., G.D.M., T.A.B. and A.C.S.S. collected and analyzed the data. A.d.S.S. wrote the manuscript. B.S.V., G.D.M. and A.C.S.S. provided thorough review of the data analysis and the manuscript. All authors have read and agreed to the published version of the manuscript.

Funding

This research received no external funding.

Data Availability Statement

The datasets generated and/or analyzed during the present study are available from the corresponding author on reasonable request.

Acknowledgments

The authors are grateful to the Graduate Program in Agriculture and Geospatial Information of the Federal University of Uberlândia, Monte Carmelo Campus.

Conflicts of Interest

The authors declare no conflict of interest.

References

  1. Van der Vossen, H.; Bertrand, B.; Charrier, A. Next generation variety development for sustainable production of arabica coffee (Coffea arabica L.): A review. Euphytica 2015, 204, 243–256. [Google Scholar] [CrossRef]
  2. Motisi, N.; Bommel, P.; Leclerc, G.; Robin, M.; Aubertot, J.; Butron, A.; Treminio, E.; Avelino, J. Improved forecasting of coffee leaf rust by qualitative modeling: Design and expert validation of the ExpeRoya model. Agric. Syst. 2021, 197, 103–129. [Google Scholar] [CrossRef]
  3. Cerda, R.; Avelino, J.; Gary, C.; Tixier, P.; Lechevallier, E. Primary and secondary yield losses caused by pests and diseases: Assessment and modeling in coffee. PLoS ONE 2017, 12, e0169133. [Google Scholar] [CrossRef]
  4. De Moraes, S.A. A Ferrugem do Cafeeiro: Importância, Condições Predisponentes, Evolução e Situação no Brasil; Instituto Agronômico: Londrina, Brazil, 1983; p. 50. [Google Scholar]
  5. Garçon, C.L.P.; Zambolim, L.; Vale, F.X.R.; Mizubuti, E.S.G.; Altmann, T.; Paiva, S.B. Modelo de previsão da ferrugem (Hemileia vastatrix Berk. & Br.) do cafeeiro (Coffea arabica L.). In I Simpósio de Pesquisa dos Cafés do Brasil; Resumos Expandidos: Poços de Caldas, Brazil, 2000; Volume 1, pp. 230–234. Available online: http://www.sbicafe.ufv.br/handle/123456789/640 (accessed on 23 March 2022).
  6. Chalfoun, S.M.; de Lima, R.D. Influência do clima sobre a incidência de doenças infecciosas. Inf. Agropecuário 1986, 12, 31–36. [Google Scholar]
  7. Jorge, L.A.C.; Inamasu, R.Y. Detecção do greening dos citrus por imagens multiespectrais. In Agricultura de Precisão: Resultados de um Novo Olhar; Bernardi, A.C.C., Ed.; Embrapa: Brasília, Brazil, 2014; pp. 180–190. [Google Scholar]
  8. Lan, Y.; Huang, Z.; Deng, X.; Zhu, Z.; Huang, H.; Zheng, Z.; Lian, B.; Zeng, G.; Tong, Z. Comparison of machine learning methods for citrus greening detection on UAV multispectral images. Comput. Electron. Agric. 2020, 171, 105–234. [Google Scholar] [CrossRef]
  9. Santos, L.M.; Ferraz, G.A.F.; Santana, L.S.; Barbosa, B.D.S.; Xavier, L.A.G.; Andrade, M.T. Índice de Vegetação (ExGR) Aplicado a Imagens rgb Obtidas por UAV para Detecção de Doença em Cafeeiros, Proceedings of the X Simpósio de Pesquisa dos Cafés do Brasil, Vitoria, Brazil, 8 November 2019; Centro de Convenções de Vitoria: Vitoria, Brazil, 2019; ISSN 1984-9249. [Google Scholar]
  10. Pires, M.S.O.; Alves, M.C.; Pozza, E.A. Multispectral radiometric characterization of coffee rust epidemic in different irrigation management systems. Int. J. Appl. Earth Obs. Geoinf. 2020, 86, 102016. [Google Scholar] [CrossRef]
  11. Saleem, M.H.; Potgieter, J.; Arif, K.M. Plant Disease Detection and Classification by Deep Learning. Plants 2019, 8, 468. [Google Scholar] [CrossRef] [PubMed]
  12. Katsuhama, N.; Imai, M.; Naruse, N.; Takahashi, Y. Discrimination of areas infected with coffee leaf rust using a vegetation index. Remote Sens. Lett. 2018, 9, 1186–1194. [Google Scholar] [CrossRef]
  13. Carmo, G.J.S.; Castoldi, R.; Martins, G.D.; Jacinto, A.C.P.; Tebaldi, N.D.; Charlo, H.C.O.; Zampiroli, R. Detection of Lesions in Lettuce Caused by Pectobacterium carotovorum subsp. carotovorum by Supervised Classification Using Multispectral Images. Can. J. Remote Sens. 2022, 48, 144–157. [Google Scholar] [CrossRef]
  14. Alvares, C.A.; Stape, J.L.; Sentelhas, P.C.; de Moraes Gonçalves, J.L.; Sparovek, G. Köppen’s climate classification map for Brazil. Meteorol. Z. 2013, 22, 711–728. [Google Scholar] [CrossRef]
  15. Fazuoli, L.C.; Carvalho, C.H.S.; Carvalho, G.R.; Filho, O.G.; Pereira, A.A.; Bartholo, G.F.; Moura, W.M.; Silvarolla, M.B.; Braghini, M.T. Cultivares de Café Arábica de Porte Alto. Cultivares de Café: Origem, Características e Recomendações; Embrapa: Brasília, Brazil, 2008; pp. 227–252. [Google Scholar]
  16. Zambolim, L.; Chaves, M.C. Efeito de baixas temperaturas e do binomio temperatura-umidade relativa sobre a viabilidade dos uredósporos de Hemileia vastatrix Berk. Et Br. E Uromyces Phaseolitypica Arth. Exp. 1974, 17, 151–184. [Google Scholar]
  17. Shein, R.D.; Rotem, J. Temperature and humidity effects on uredospore viability. Mycologia 1965, 57, 397–403. [Google Scholar] [CrossRef]
  18. Schaepman-Strub, G.; Schaepman, M.E.; Painter, T.H.; Dangel, S.; Martonchik, J.V. Reflectance quantities in optical remote sensing—Definitions and case studies. Remote Sens. Environ. 2006, 103, 27–42. [Google Scholar] [CrossRef]
  19. Jacquemoud, S.; Baret, F. PROSPECT: A model of leaf optical properties spectra. Remote Sens. Environ. 1990, 34, 75–91. [Google Scholar] [CrossRef]
  20. Lichtenthaler, H.K.; Wellburn, A.R. Determinations of total carotenoids and chlorophylls a and b of leaf extracts in different solvents. Biochem. Soc. Trans. 1983, 11, 591–592. [Google Scholar] [CrossRef]
  21. Jiang, J.; Comar, A.; Burger, P.; Bancal, P.; Weiss, M.; Baret, F. Estimation of leaf traits from reflectance measurements: Comparison between methods based on vegetation indices and several versions of the PROSPECT model. Plant Methods 2018, 14, 23. [Google Scholar] [CrossRef]
  22. De Souza Echer, M.P.; Martins, F.R.; Pereira, E.B. A importância dos dados de cobertura de nuvens e de sua variabilidade: Metodologias para aquisição de dados. Rev. Bras. Ensino Física 2006, 28, 341–352. [Google Scholar] [CrossRef]
  23. Khanna, R.; Sa, I.; Nieto, J.; Siegwart, R. On field radiometric calibration for multispectral cameras. In Proceedings of the IEEE International Conference on Robotics and Automation, Marina Bay Sands Convention Centre, Singapore, 29 May–3 June 2017; pp. 6503–6509. [Google Scholar] [CrossRef]
  24. Hall, F.G.; Strebel, D.E.; Nickeson, J.E.; Goetz, S.J. Radiometric rectification: Toward a common radiometric response among multidate, multisensor images. Remote Sens. Environ. 1991, 35, 11–27. [Google Scholar] [CrossRef]
  25. Ponzoni, F.J.; Shimabukuro, Y.E.; Kuplich, T.M. Sensoriamento Remoto da Vegetação, 2nd ed.; Oficina de Textos: São Paulo, Brazil, 2012; Volume 1, p. 176. [Google Scholar]
  26. Gitelson, A.A.; Kaufman, Y.J.; Merzlyak, M.N. Use of a green channel in remote sensing of global vegetation from EOS-MODIS. Remote Sens. Environ. 1996, 58, 289–298. [Google Scholar] [CrossRef]
  27. Rouse, J.W.; Hass, R.H.; Schell, J.A.; Deering, D.W. Monitoring vegetation systems in the Great Plains with ERTS. In Proceedings of the Third ERTS Symposium, Washington, DC, USA, 10–14 December 1973; pp. 309–317. [Google Scholar]
  28. Zarate-Valdez, J.L.; Whiting, M.L.; Lampinen, B.D.; Metcalf, S.; Ustin, S.; Brown, P.H. Prediction of leaf area index in almonds by vegetation indexes. Comput. Electron. Agric. 2012, 85, 24–32. [Google Scholar] [CrossRef]
  29. Hunt, E.R.J.; Hively, W.D.; Fujikawa, S.; Linden, D.; Daughtry, C.S.; McCarty, G. Acquisition of nir-green-blue digital photographs from unmanned aircraft for crop monitoring. Remote Sens. 2010, 2, 290–305. [Google Scholar] [CrossRef]
  30. Perroca, M.G.; Gaidzinski, R.R. Avaliando a confiabilidade interavaliadores de um instrumento para classificação de pacientes: Coeficiente Kappa. Rev. Esc. Enferm. USP 2003, 37, 72–80. [Google Scholar] [CrossRef] [PubMed][Green Version]
  31. Emerson, R.; Lewis, C.M. The Dependence of the Quantum Yield of Chlorella Photosynthesis on Wave Length of Light. Am. J. Bot. 1943, 30, 165–178. [Google Scholar] [CrossRef]
  32. Chemura, A.; Mutanga, O.; Dube, T. Separability of Coffee Leaf Rust Infection Levels with Machine Learning Methods at Sentinel-2 MSI Spectral Resolutions. In Precision Agriculture; Springer: New York, NY, USA, 2017; pp. 1–23. [Google Scholar] [CrossRef]
  33. Pettai, H.; Oja, V.; Freiberg, A.; Laisk, A. Photosynthetic activity of far-red light in green plants. Biochim. Biophys. Acta Bioenerg. 2005, 1708, 311–321. [Google Scholar] [CrossRef] [PubMed]
  34. Jensen, J.R. Sensoriamento Remoto do Ambiente: Uma Perspectiva em Recursos Terrestres; Parêntese: São José dos Campos, Brazil, 2011. [Google Scholar]
  35. Velásquez, D.; Sánchez, A.; Sarmiento, S.; Toro, M.; Maiza, M.; Sierra, B. A Method for Detecting Coffee Leaf Rust through Wireless Sensor Networks, Remote Sensing, and Deep Learning: Case Study of the Caturra Variety in Colombia. Appl. Sci. 2020, 10, 697. [Google Scholar] [CrossRef]
  36. Da Silva Soares, R.R. Estudo de Propriedades da Clorofila a e da Feofitina a Visando a Terapia Fotodinâmica. Master’s Thesis, Universidade Estadual de Maringá, Maringá, Brazil, 2006. [Google Scholar]
  37. Björn, L.O.; Papageorgiou, G.C.; Blankenship, R.E. A viewpoint: Why chlorophyll a? Photosynth. Res. 2009, 99, 85–98. [Google Scholar] [CrossRef]
  38. Moreira, M.A. Fundamentos do Sensoriamento Remoto e Metodologias de Aplicação, 3rd ed.; Universidade Federal de Viçosa: Viçosa, Brazil, 2005; p. 320. [Google Scholar]
  39. Martins, G.D. Caracterização espectral e espacial de áreas infestadas por nematoides e Migdolus fryanus em cultura canavieira. Master’s Thesis, Universidade Estadual Paulista (Unesp), São Paulo, Brazil, 2013. [Google Scholar]
  40. Terentev, A.; Dolzhenko, V.; Fedotov, A.; Eremenko, D. Current state of Hyperspectral remote sensing for early plant disease detection: A rewiew. Sensors 2022, 22, 757. [Google Scholar] [CrossRef]
Figure 1. Study area: Location of the experimental area. (A) Brazil and the state of Minas Gerais, (B) Municipality of Monte Carmelo, (C) Aerial view of the Federal University of Uberlândia/Campus Monte Carmelo, (D) Experimental area in natural color (RGB) acquired using an unmanned aerial vehicle (UAV).
Agronomy 12 02911 g001
Figure 2. Flowchart of the methodology used in this study.
Agronomy 12 02911 g002
Figure 3. Coffee seedlings 15, 30, and 45 d after inoculation (DAI). Image of non-inoculated seedlings obtained by a Mapir Survey3W camera (red, green, and near infrared bands) at 15 DAI (A), non-inoculated seedlings in an RGB image at 15 DAI (B), inoculated seedlings at 15 DAI (G), inoculated seedling in an RGB image at 15 DAI (H), non-inoculated seedlings at 30 DAI (C), non-inoculated seedling in an RGB image at 30 DAI (D), inoculated seedlings at 30 DAI (I), inoculated seedlings in an RGB image at 30 DAI (J), non-inoculated seedlings at 45 DAI (E), non-inoculated seedlings in an RGB image at 45 DAI (F), inoculated seedlings at 45 DAI (K), and inoculated seedling in an RGB image at 45 DAI (L).
Agronomy 12 02911 g003
Figure 4. Distribution of minimum, maximum, and median values of significantly different physiological parameters at 15 (A), 30 (B), and 45 days (C) after inoculation.
Agronomy 12 02911 g004
Figure 5. Average reflectance values between inoculated and non-inoculated seedlings at 15, 30, and 45 days after inoculation of the bands: visible, near infrared, and average of the simulated reflectance curves (a); bands of red (R), green (G), and blue (B) (b), and the bands of red (R), green (G) and near infrared (N) (c).
Agronomy 12 02911 g005
Figure 6. Reflectance discrepancy values between inoculated and non-inoculated seedlings at 15, 30, and, 45 days after inoculation (DAI) of the bands: visible, near infrared (NVI), and medium (IVM) of the simulated reflectance curves; from the red (R), green (G), and blue (B) bands, and from the red (R), green (G), and near infrared (N) bands.
Agronomy 12 02911 g006
Figure 7. Average reflectance values of coffee seedlings after 15, 30, and 45 days after inoculation (DAI).
Agronomy 12 02911 g007
Figure 8. Spectral response of inoculated and non-inoculated coffee seedlings at 15, 30, and 45 days after inoculation (DAI) based on the average reflectance values of the RGN sensor images (red, green, and near infrared bands).
Agronomy 12 02911 g008
Figure 9. Spectral response of inoculated and non-inoculated coffee seedlings at 15, 30, and 45 days after inoculation (DAI) based on the average reflectance values of the RGB sensor images (red, green, and blue bands).
Agronomy 12 02911 g009
Table 1. Vegetation indices calculated from the bands of the studied sensors in the visible spectrum (R, G, and B) and near-infrared (NIR). LAI = leaf area index.
Vegetation IndexEquationApplicationSource
Green Normalized Difference Vegetation Index (GNDVI) GNDVI = B 850 B 550 B 850 + B 550 Chlorophyll, LAI, biomass, N uptake, and productivity[26]
Normalized Difference Vegetation Index (NDVI) NDVI = B 850 B 660 B 850 + B 660 Biomass, LAI, productivity, and photosynthetically active radiation[27,28]
Triangular Greenness Index (TGi) TGi = B 660 0.39 × B 550 0.61 × B 480 Chlorophyll[29]
Table 2. Supervised classification of inoculated and non-inoculated coffee seedlings with H. vastatrix, 15 days after inoculation (DAI).
15 DAI
SVMRN
Classified SubsetsEO (%)EC (%)OAKEO (%)EC (%)OAK
RGN2020800.62525750.5
RGN, NDVI, and GNDVI2020800.62525750.5
RGB2035720.42535700.4
RGB and TGI2045670.32540670.3
Table 3. Classification at 15, 30, and 45 days after inoculation (DAI).
Evaluation
Period
Algorithm RGNRGN, NDVI, and GNDVIRGBRGB and TGI
PredictionRealNon-InoculatedInoculatedNon-InoculatedInoculatedNon-InoculatedInoculatedNon-InoculatedInoculated
15 DAISVMnon-inoculated164164164164
inoculated416416713911
15 DAIRNnon-inoculated155155155155
inoculated515515713812
30 DAISVMnon-inoculated911812173155
inoculated713317317415
30 DAIRNnon-inoculated182164173155
inoculated812911515416
45 DAISVMnon-inoculated137128182173
inoculated515812182182
45 DAIRNnon-inoculated191191182182
inoculated164164155164
Table 4. Supervised classification of coffee seedlings inoculated and non-inoculated by H. vastatrix, at 30 days after inoculation (DAI), and omission errors (EO), commission error (EC), global accuracy (AG), and Kappa index (K).
30 DAI
SVMRN
Classified SubsetsEO (%)EC (%)OAKEO (%)EC (%)OAK
RGN5535550.11040760.5
RGN, NDVI, and GNDVI6015620.22045670.3
RGB1515850.72515800.6
RGB and TGI2520770.52520770.5
Table 5. Supervised classification of coffee seedlings inoculated and non-inoculated by H. vastatrix, at 45 days after inoculation (DAI), and omission errors (EO), commission error (EC), global accuracy (AG) and Kappa index (K).
45 DAI
SVMRN
Classified SubsetsEO (%)EC (%)OAKEO (%)EC (%)OAK
RGN3525700,458057.50.1
RGN, NDVI, and GNDVI4040600,258057.50.1
RGB1090500107557.50.1
RGB and TGI15904701080550.1
Publisher’s Note: MDPI stays neutral with regard to jurisdictional claims in published maps and institutional affiliations.