1. Introduction
Winter rye (
Secale cereale L.) is a crop plant from Poaceae family, of special importance in Northern and Western Europe. The origin of this crop is not specifically known, but researchers suspect that rye’s source was South-West Asia [
1,
2,
3]. Very high resistance of winter rye to adverse climatic and soil conditions is one aspect of this crop that makes it attractive to growers [
4]. For the most part, rye is grown in cool environments, especially in Northern and Eastern Europe [
4]. In 2020 rye production in North America was below 800,000 tonnes while in Europe almost 13,000,000 tonnes of rye grain was produced [
5]. A large portion of the harvested rye grain is used for baking bread and other uses include feed for livestock and distilling [
4,
6].
Previously, rye was widely used in Kentucky and the mid-south as a livestock feed but also for distilling and baking because of rye’s health-enhancing properties and unique spicy flavor [
7,
8,
9,
10]. The tradition of using rye and knowledge about growing rye disappeared with prohibition but also because of increased production of major crops [
4]. Rye was forced out of crop rotations in favor of wheat, and farmers lost their skills in growing this crop. Today there are many gaps in our knowledge of how to grow rye in Kentucky and the mid-South effectively, such that growers obtain high yields and satisfactory quality to meet distilling and baking standards. Distillers and bakers are demanding rye grain in the US market while rye grain production in the US dropped from ~27,000 tones to ~13,000 over 50 years (FAOSTAT). Currently most of rye in the US is imported from Canada and Europe [
5]. With decreased rye production, funding for rye research in the US has also declined, resulting in very little research done on rye over 50 years.
In Europe, where rye production has stayed on a relatively high level, agricultural and genetic research have continued uninterrupted. Continued improvement of rye varieties and rye crop management methods have resulted in significant increases in grain yield and production. Average rye grain yield in Europe increased from ~1.44 t/ha in 1970 to ~3.6 t/ha in 2020. In 2020 the average rye yield in the United States was more than 1 t/ha lower compared to Europe [
5]. The FAO database shows that in 2020, Germany’s average rye grain yield exceeded 5.5 t/ha and the second highest average yield was noted for Netherlands (4.26 t/ha). Such a big yield difference between Germany and other countries may be due to the strong focus on development of hybrid varieties [
11,
12].
In 2021, the harvested area of winter wheat in the United States was 10,305,030 hectares and while winter rye occupied 118,980 hectares, the harvested rye acreage in the US was only 1.15% of harvested winter wheat [
13]. In Kentucky’s popular double-cropping system, winter rye’s place in crop rotation would be that currently occupied by winter wheat, and its planting date would be determined by the harvest date of the previous corn or soybean crop.
While winter rye grows rapidly in the early spring, it is harvested later than winter wheat and barley, due to its threshing difficulties [
14]. In general, time of sowing has a strong influence on proper fall development and acquisition of low temperature tolerance for winter cereal crops [
15]. Plants require time and favorable soil temperature and moisture for even germination followed by cool weather to promote fall tillering ensure winter survival. In the 20th century it was already proven that planting too early or too late can influence winter resilience and affect grain yield of winter crops [
16,
17,
18,
19,
20]. The Ontario Ministry of Agriculture, Food and Rural Affairs (OMAFRA) reported that each day of delay from optimal planting date of cereal crops leads to decrease of 0.07 t/ha [
14]. Depending on planned use of winter rye, this crop can be sowed from late August to early November [
21]. Early planting increases the biomass of small grain crops [
22], and thus winter rye for forage or cover crop can be planted 2 to 8 weeks earlier than winter wheat. Previous studies indicate that rye for grain should be planted at a similar time as winter wheat or slightly later [
21]. Fall accumulation of biomass increases with increased growing degree days, which can be manipulated with planting date [
23], but is strongly related to latitude.
In general, the further from the equator, the shorter growing season is, and earlier fall planting is practiced to overcome this phenomenon. For Europe and the northern US, situated at latitudes similar to Germany (between 45° N and 55° N) typical winter rye planting time for grain is between September 15th and October 5th, depending on a climatic region. OMAFRA Agronomy Guide for Field Crops (2017) recommend wheat planting in Ontario province of Canada begin at the end of August in northern parts of the province and in southern area can be planted as late as mid-October. In Missouri, situated between 36° N and 40° N, rye is planted from late September to mid-October [
24], and in Kentucky (lying between 36° N and 39° N) it is recommended to plant winter wheat between October 10th and October 30th [
25].
To increase rye production in Kentucky, we need to develop a set of best management practices including planting date. The objectives of this study were to: (1) identify varieties and hybrids suitable for the US mid-south environment; (2) establish an optimal planting date of winter rye in this region and (3) quantify genotype x planting date interaction on yield, disease resistance, lodging and earliness.
3. Results
3.1. Days to Heading
Heading date was recorded as days after January 1. In this manuscript we use the term “earliness” as an indicator of maturity and define it in this way: the lower the number of days to heading, the earlier the entry. In 2019 the range of days to heading was from 104 to 129, and from 98 to 143 in 2020. In general, genotypes planted early reached heading earlier, and later plantings, headed relatively later (
Figure S1). There were few exceptions: in 2019 varieties Fl401 and Merced were damaged by early spring frost, and reached heading at a similar time in each planting date. The latest heading were hybrid varieties and high yielding AC Hazlet, and ND Dylan. The Kentucky lines (noted as a KYSC in
Figure S1), that were selected for Kentucky’s environment, were relatively early. On average, genotypes headed earlier in Adairville than in Lexington at all planting dates (
Table 2) The differences in earliness between planting dates were statistically significant, except for the Adairville early and intermediate planting (
Table 2). Additionally, variety, planting date, and environment × variety, environment × planting date, and variety × planting date interactions had a significant influence on earliness. (
Table 2).
3.2. Disease Resistance and Lodging
Statistical analysis of collected disease resistance and lodging data (
Table S1) showed that overall, there were significant differences in FHB resistance ratings between genotypes, planting dates, and their interaction (
p < 0.0001). We observed a statistically significant difference in Septoria resistance between locations in 2019 (
p = 0.0001), and 2020 (
p = 0.02). There was a significant difference in Septoria resistance between locations over planting dates in 2019 (
p = 0.002), but this was not significant in 2020, or in the overall analysis. The differences in Septoria resistance between planting dates and between genotypes were statistically significant in both seasons, but the planting date effect was not significant over all environments. There was a difference in lodging resistance of genotypes at different planting dates in 2019 (
p = 0.0001), but we did not find this interaction effect in 2020, or in the overall analysis. In 2019 some genotypes showed higher lodging resistance when planted early, and some when planted late or at the intermediate date. There was higher resistance to lodging in Lexington compared to Adairville (except for KYSC1503 that showed higher lodging resistance in Adairville) (
Figure S2). The highest lodging resistance in 2019 was observed in the early planted test, and the lowest at the intermediate planting dates in both locations. For all three planting dates, higher lodging resistance was observed in Lexington. In 2020 at Lexington, we observed very little lodging compared to the prior season or Adairville the same season. Thus, the effect of the variety × planting date that year was not significant (
p = 0.36).
3.3. Yield
There was significant variation in yield among genotypes in both seasons (
Table 3), and in both seasons, the best yielding varieties were hybrids: KWS Brasetto, KWS Bono, KWS Serafino and Daniello. The best yielding conventional varieties were ND Dylan and AC Hazlet (
Figure S3).
In both seasons, mean yield over all planting dates and genotypes was higher at Adairville (
Table S2,
Figure S4). In 2020, the Lexington early planting suffered the most from the May freeze, and this block was not harvested, and thus is not included in the statistical analysis of yield data. Almost all varieties yielded higher at Adairville in 2020 (
Figure S5). This may be due to the latitude difference in the two locations and difference in growth stage of the varieties. At the time of the freeze, rye at Adairville had already started to produce kernels, whereas rye in Lexington was at anthesis. Delicate anthers suffered extensive damage from the freeze, resulting in limited pollination and lower yield. Over both growing seasons certain varieties performed better at certain planting dates. Early planting was best for Elbon and KYSC1708. Seven varieties (AC Hazlet, Aventino, KWS Brasetto, Serafino, KYSC1503, KYSC1707PRN, and ND Dylan) yielded the best at the intermediate planting dates, and the rest yielded higher when planted late (
Figure 1,
Table S3). Out of four hybrid varieties tested, two yielded higher at intermediate and two at late planting.
3.4. Number of Tillers
Over all planting dates the mean number of tillers m
−2 varied from 366 to 885 (
Table S4). Given the influence of planting date on tiller production, it was not surprising that the analysis of variance showed statistically significant differences in number of tillers between planting dates (
p < 0.001). Differences among varieties were also significant (
p < 0.001), but no significant variety by planting date interaction were observed (
p = 0.24). The highest mean number of tillers was produced with early planting (604.5), then intermediate (551.5) and the lowest at late planting (515) (
Table 4). The lowest average number of tillers over the 3 planting dates was produced by the variety Merced (366) and the highest by Abruzzi (885).
We analyzed the relationship between the number of tillers per square meter and yield. Overall, the correlation was below 0.5 (
Table 4). The lowest correlation was found at early planting (0.39) and the highest at late planting (0.45). As the two varieties: Merced and Fl 401 were severely damaged by the freeze we conducted another correlation analysis without these varieties, suspecting that their damage and resulting poor performance may negatively influence the correlation. Surprisingly, the exclusion of Merced and Fl 401 caused a decrease in the correlations and leveraged the average yield and tiller number in all planting dates (
Table 4). We also analyzed this correlation considering conventional and hybrid varieties separately. In the case of conventional varieties, the correlation increased in all planting dates and overall analysis while the correlations in hybrid varieties except for late planting were negative; however, the correlations among hybrids were not significant.
3.5. Fusarium Head Blight and DON
In 2019 the results of DON content from three planting dates varied from 0.51 ppm (Aroostock-intermediate planting) to 7.2 ppm (Wheeler-late planting). The difference in average DON content between planting dates was not significant (
p = 0.79) and was 1.73, 1.92, 1.79 in early, intermediate, and late, respectively. The difference in DON between varieties over all planting dates was highly significant (
p < 0.001). The highest mean DON content was found for Wheeler (4.9 ppm) and the lowest for Aroostock (0.67 ppm); however, only one replication from each planting date was analyzed for the DON content, and results should not be used as a base for strong conclusions. We evaluated the correlation between DON content and other traits (earliness, yield, height, FHB index, and lodging) (
Table S5). The highest correlations of DON were found with height in early and intermediate planting (0.51,
p = 0.01 and 0.48,
p = 0.02, respectively). This is in contrast to wheat, where there is typically a negative correlation between DON and height, simply because the shorter plants are at greater risk for FHB.
Over all planting dates, varieties and environments, we found a strong positive correlation (0.68) between FHB index (0–9 scale) and earliness. The later the variety, the lower the index value.
Analysis of materials grown in the scab nursery in 2020 showed a positive correlation (0.46) between the heading date and FHB index, a similar correlation between the heading date and severity (0.45) and a negative correlation between heading date and vacuum sorted FDK (−0.57). Negative correlations of 0.34 and 0.32 were found between FHB index and severity and vacuum sorted FDK, respectively. Vacuum sorted FDK and optically sorted FDK results were correlated at −0.39.
The mean DON content in grain from the 2021 scab nursery was the lowest for Aroostock, Aventino, and Wrenz Abruzzi (2.43, 2.33, and 1.97 ppm, respectively), and the highest for KYSC1702, KYSC1706, and Daniello (6.33, 5.03, and 4.8 ppm, respectively), but overall, the differences in DON content between varieties was not significant (
p = 0.24) (
Table S6).
FHB index values were statistically different among varieties in all tests: 2019 and 2020 plots in Lexington and 2020 and 2021 scab nursery. Moreover, FHB index ratings for varieties were relatively consistent over years and in the scab nursery environment vs. non-inoculated plots (
Table S7). The FHB index variety mean correlation between the 2020 scab nursery and all 2019 planting date plots was 0.42, and between the 2020 scab nursery and 2019 Lexington planting date plots the correlation was 0.36. All other correlation coefficients were between 0.5 and 0.98.
3.6. Climate Data
Average daily temperatures during planting in Adairville in 2018 were 25.8 °C, 10.6 °C, 15 °C at the early, intermediate, and late plantings, respectively, and in 2019: 10.8 °C (E), 16.1 °C (I), and 8.6 °C (L). Cumulative precipitation (mm) from September 1st to date of planting was: 132.1 (E), 132.1 (I), and 212.1 (L) in 2018, and 93.0 (E), 97.8 (I), and 219.7 (L) in 2019. Cumulative precipitation (mm) in Adairville from planting to 31 December were: 324.4 (E), 324.4 (M), and 244.3 (L) in 2018, and 392.7 (E), 392.7 (M), and 265.9 (I) in 2019.
In Lexington, average daily temperatures during planting in 2018 were 24.7 °C, 7.8 °C, 10.8 °C at early, intermediate, and late planting, respectively, and in 2019: 20.3 °C (E), 19.5 °C (I), and 9.5 °C (L). Cumulative precipitation (mm) from September 1st to date of planting was: 338.8 (E), 375.7 (I), and 398.8 (L) in 2018, and 4.6 (E), 100.6 (I), and 196.3 (L) in 2019. Cumulative precipitation (mm) in Adairville from planting to 31 December were: 484.4 (E), 447.5 (M), and 424.4 (L) in 2018, and 474.5 (E), 385.1 (M), and 282.7 (I) in 2019.
There were no correlations found between average daily temperatures at planting, cumulative precipitation from September 1 to planting, cumulative precipitation from planting to 31 December, and number of tillers, earliness, or yield. We observed a very strong correlation (0.98) between earliness and spring GDD and a strong correlation (0.69) between FHB index and cumulative GDD from March 1st to heading, but this results from earliness and its correlation with FHB index. Cumulative fall GDD correlation with yield was −0.28.
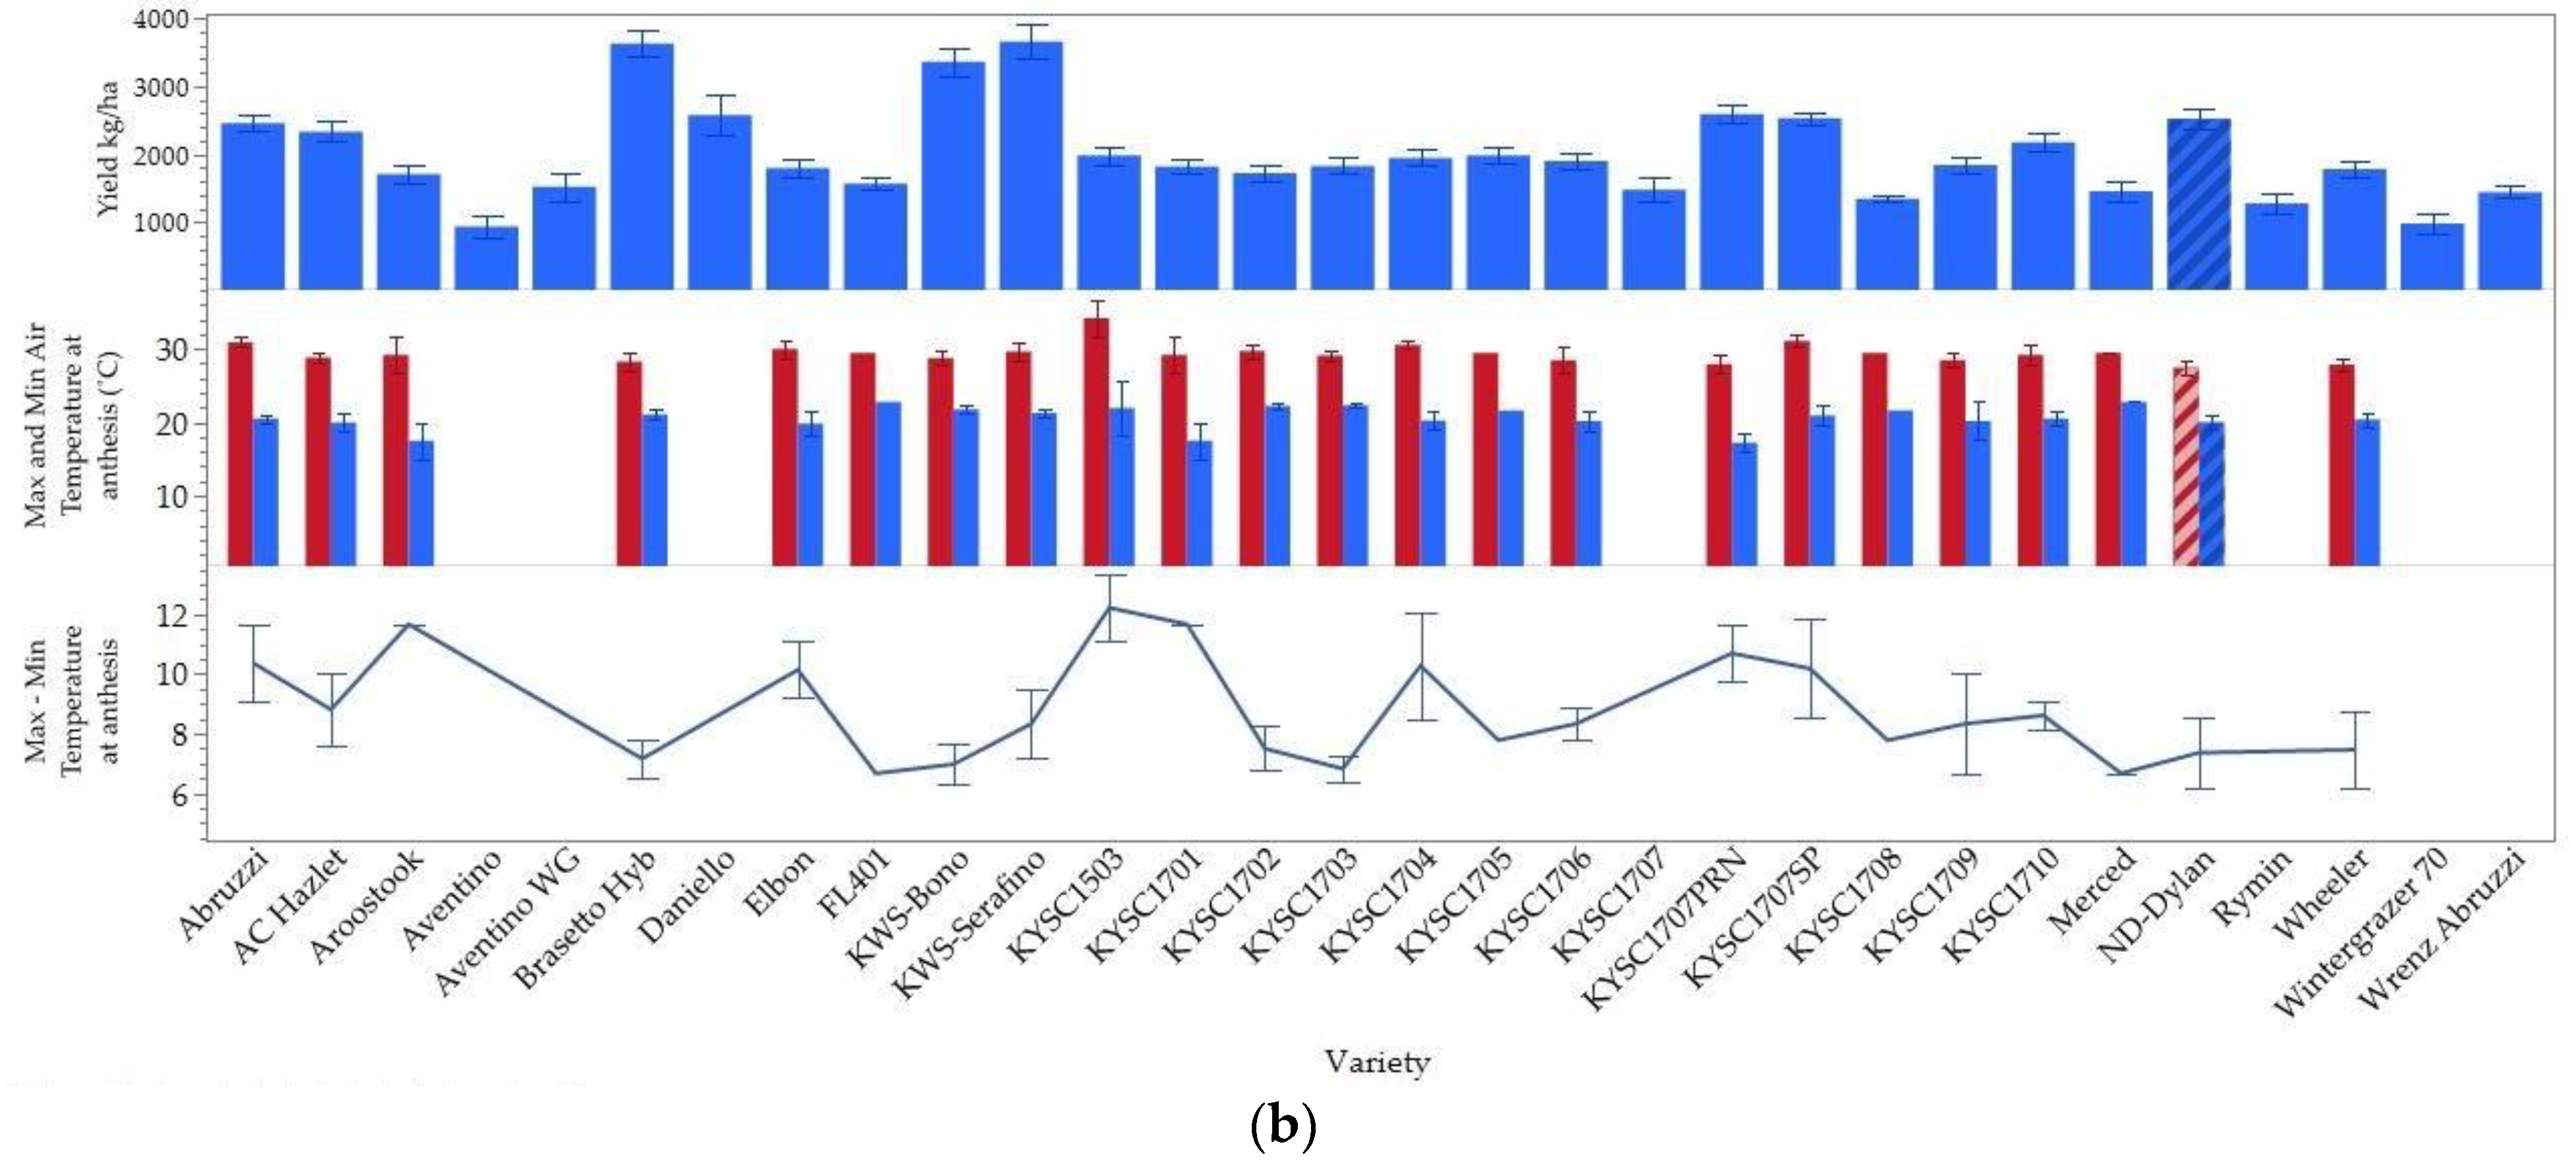
Figure 2 presents the yield and daily temperatures at heading over all plots, and daily temperatures at anthesis for the 99 plots for which we captured the anther extrusion date. For the highest yielding conventional varieties in Adairville in 2019 (ND-Dylan, AC-Hazlet, Abruzzi, and KYSC1707) the difference between maximum and minimum daily temperatures at anthesis ranged from 7.5 to 11 degrees. Similar mean differences between max and min daily temperatures at heading were found for these varieties over all environments. Similar values of the daily temperature amplitudes were found for other varieties that did not yield above average. There were no correlations found between maximum, minimum, or the difference between maximum and minimum daily temperature at anthesis and yield. In 2019 yield rank of the hybrids in Adairville was as follows: 1. KWS- Serafino, 2. KWS-Brasetto, and 3. KWS-Bono. The ranking of the mean daily air temperature amplitudes at anthesis was the same: the highest difference for Serafino, then Brasetto and Bono (
Figure 2b). A very strong positive correlation (0.75) was found between cumulative GDD from March 1st to heading date and anthesis date, which can be explained by earliness. When we looked at hybrid varieties and conventional varieties separately, we found a positive correlation between the maximum daily air temperatures at anthesis and yield (0.48) and the positive correlation between the difference between maximum and minimum daily air temperature at anthesis and yield (0.41) for hybrids, but no such correlations for conventional varieties (
Table S8).
We evaluated yield correlations with cumulative GDD and, cumulative precipitation during the 1st, 2nd, 3rd, 4th, and 5th weeks after heading and anthesis (if noted); there were no strong correlations found. The highest correlations with yield were found between cumulative GDD during 1 week after heading (0.38) and 5th week after heading (0.36), and negative correlation with cumulative GDD during 5th week after anthesis (−0.33) (
Table 5).
There were noticeable differences in yield between seasons and location, thus we were also evaluating yield correlations with climate components with growing season and location distinction (
Table 5). Season-wise, the highest yield correlations were found in 2020 with cumulative fall rainfall (−0.52), cumulative Fall GDD (−0.4), GDD cumulated during the 5th week after heading (0.37), rainfall cumulated during the 3rd week after heading (−0.36), maximum temperature at the heading day (−0.34), and cumulative spring GDD (0.32). We found a correlation of 0.44 between yield in Adairville and cumulative spring GDD, but in Lexington, this correlation was only 0.24. There was also big difference between the two locations in yield correlations with cumulative fall GDD (−0.33 in Lexington, vs. −0.09 in Adairville). There were yield correlations with cumulative GDD during particular weeks after heading in each location: in Lexington 0.54, 0.48, 0.45, 0.40, 0.39 during 1st, 2nd, 3rd, 4th, and 5th week after heading, respectively, and in Adairville: 0.50, 0.24, 0.36, 0.61, 0.47. Cumulative rainfall after heading correlations with yield were the highest during 1st week in Lexington (−0.37), 3rd week in 2020 (−0.36), 5th week in Lexington (0.34) and 3rd week in Adairville (−0.31).
3.7. Predicted Spirit Yield
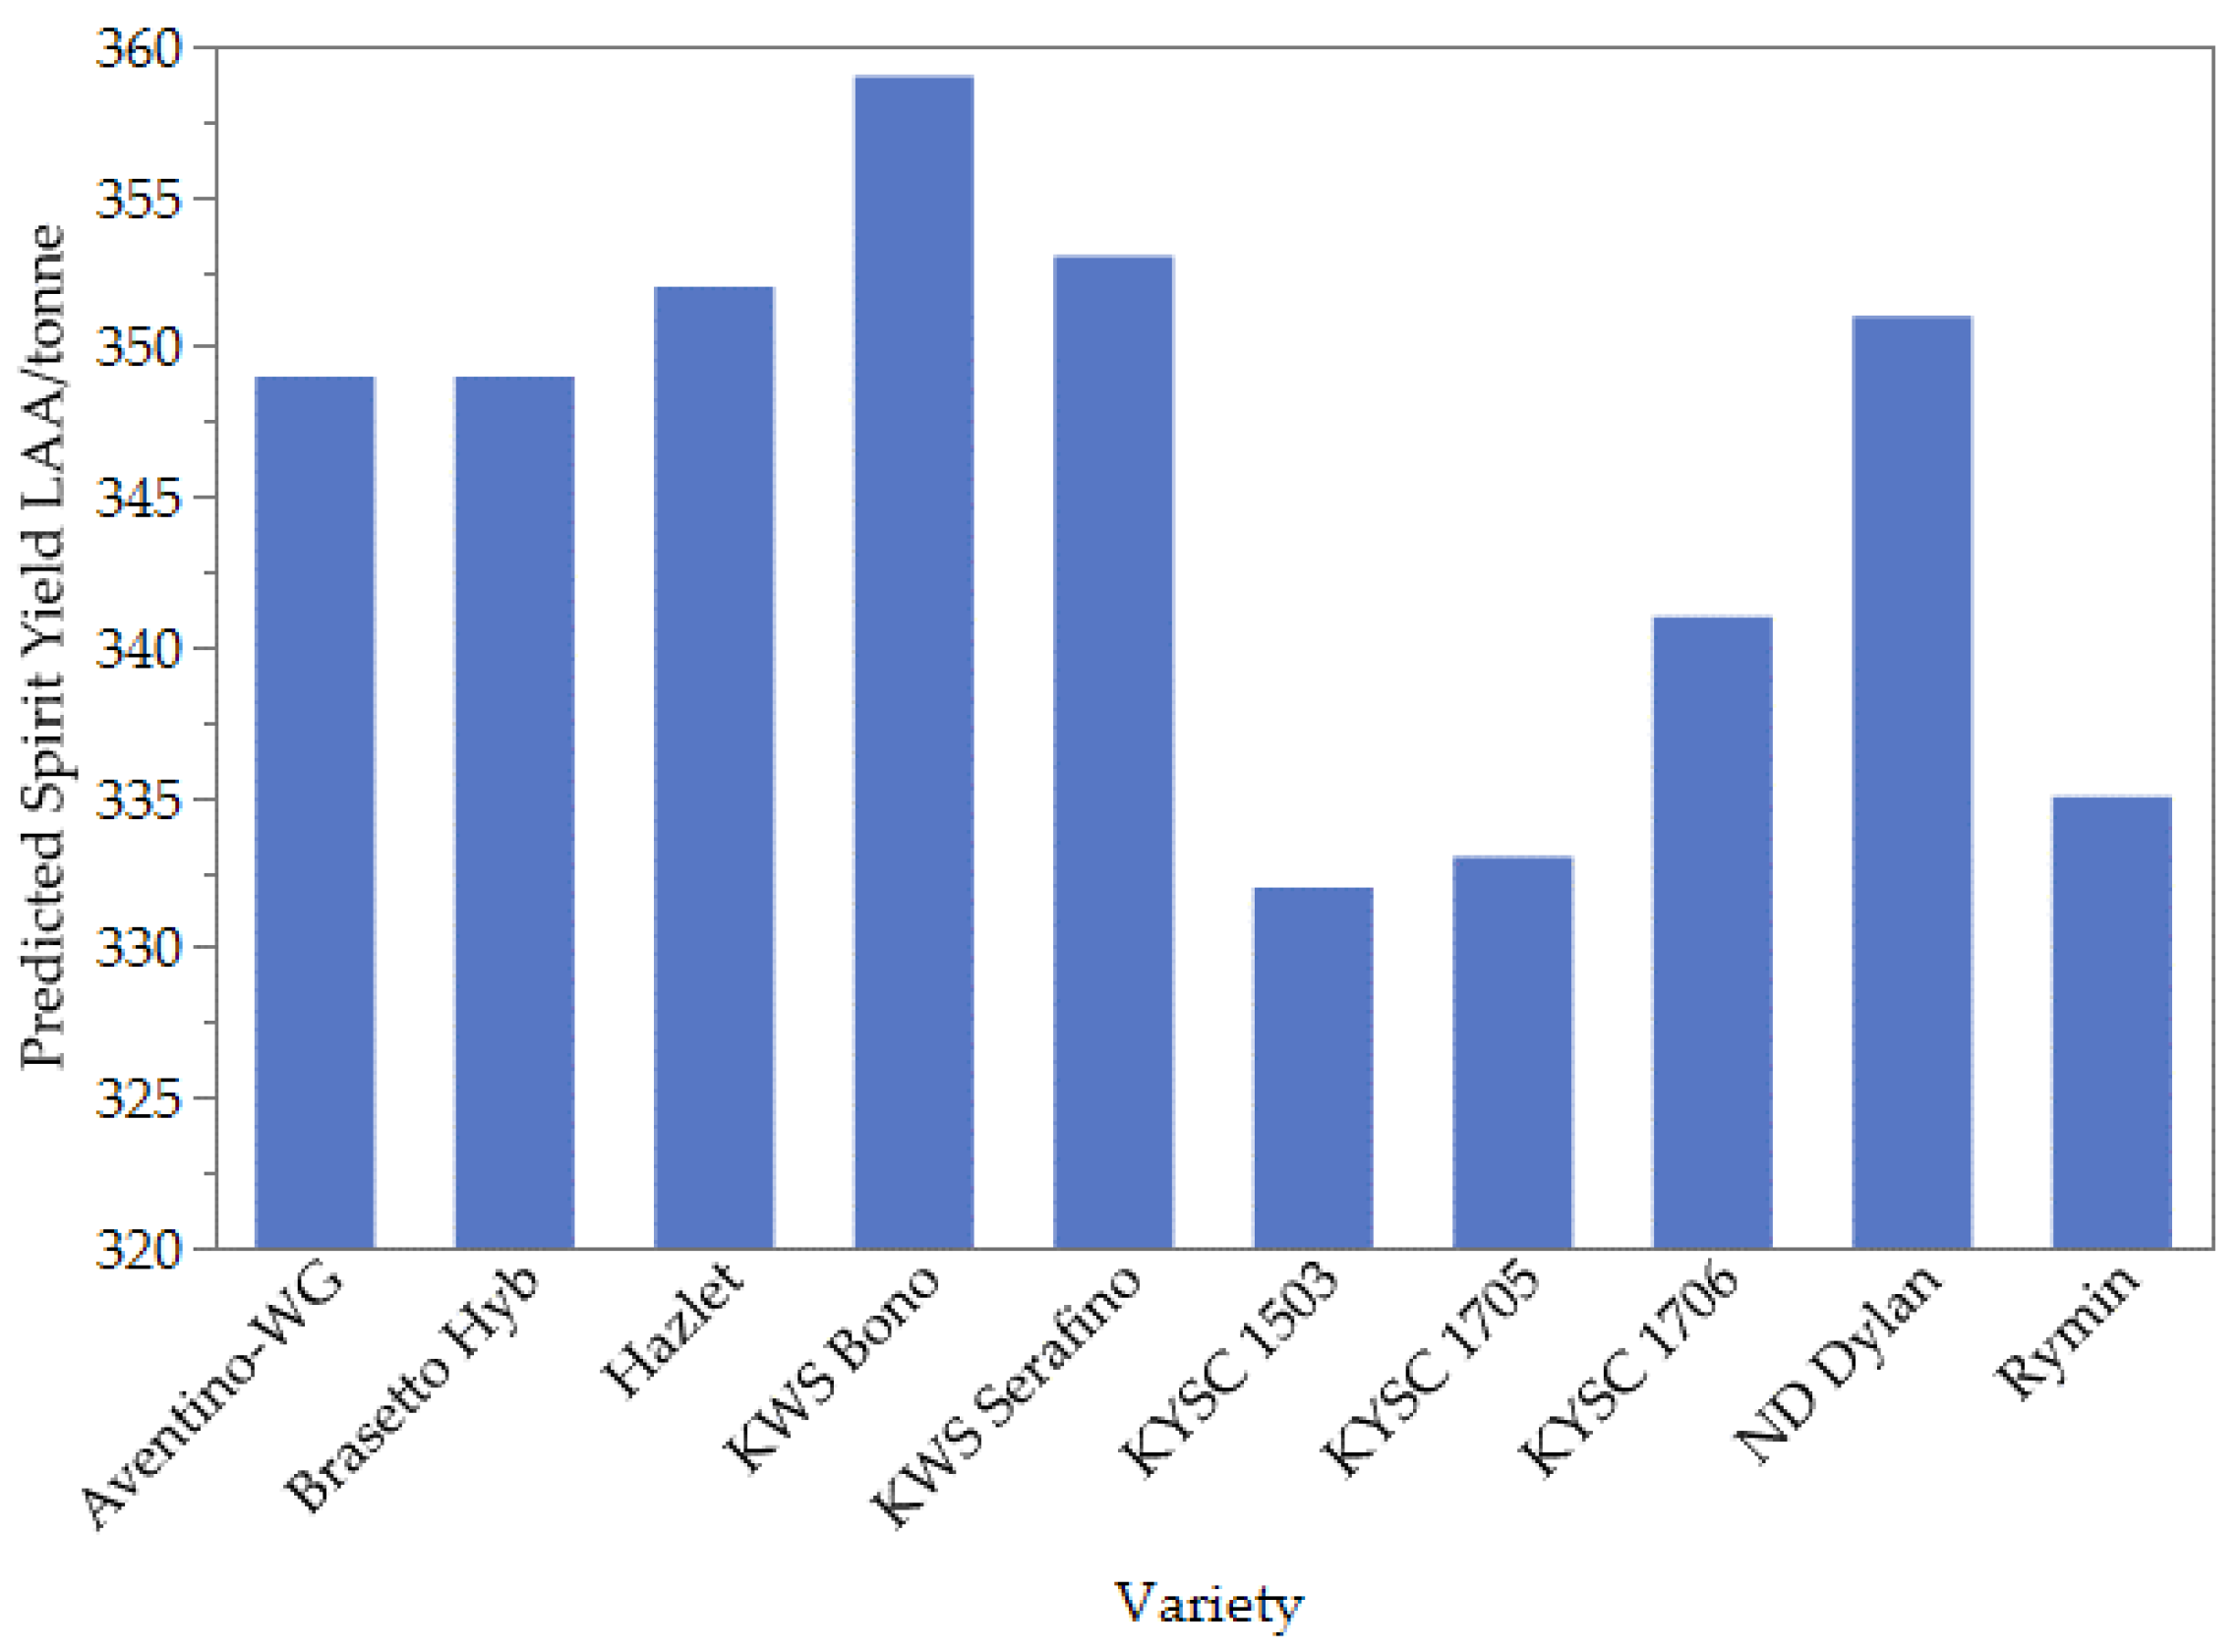
In general, predicted spirit yield was higher in 2019 than in 2020. Even though hybrid varieties yielded, on average at the highest levels, the highest spirit yield in 2019 was predicted for conventional variety: AC Hazlet. In 2020 the highest predicted alcohol yield was predicted for a hybrid variety: KWS Bono (
Figure 3 and
Figure 4). A very strong correlation of 0.95 (
p < 0.001) between protein content and predicted spirit yield over all tested varieties and a positive correlation of 0.54 (
p = 0.0028) between plump seeds and protein content were found.
3.8. Protein and Starch Content
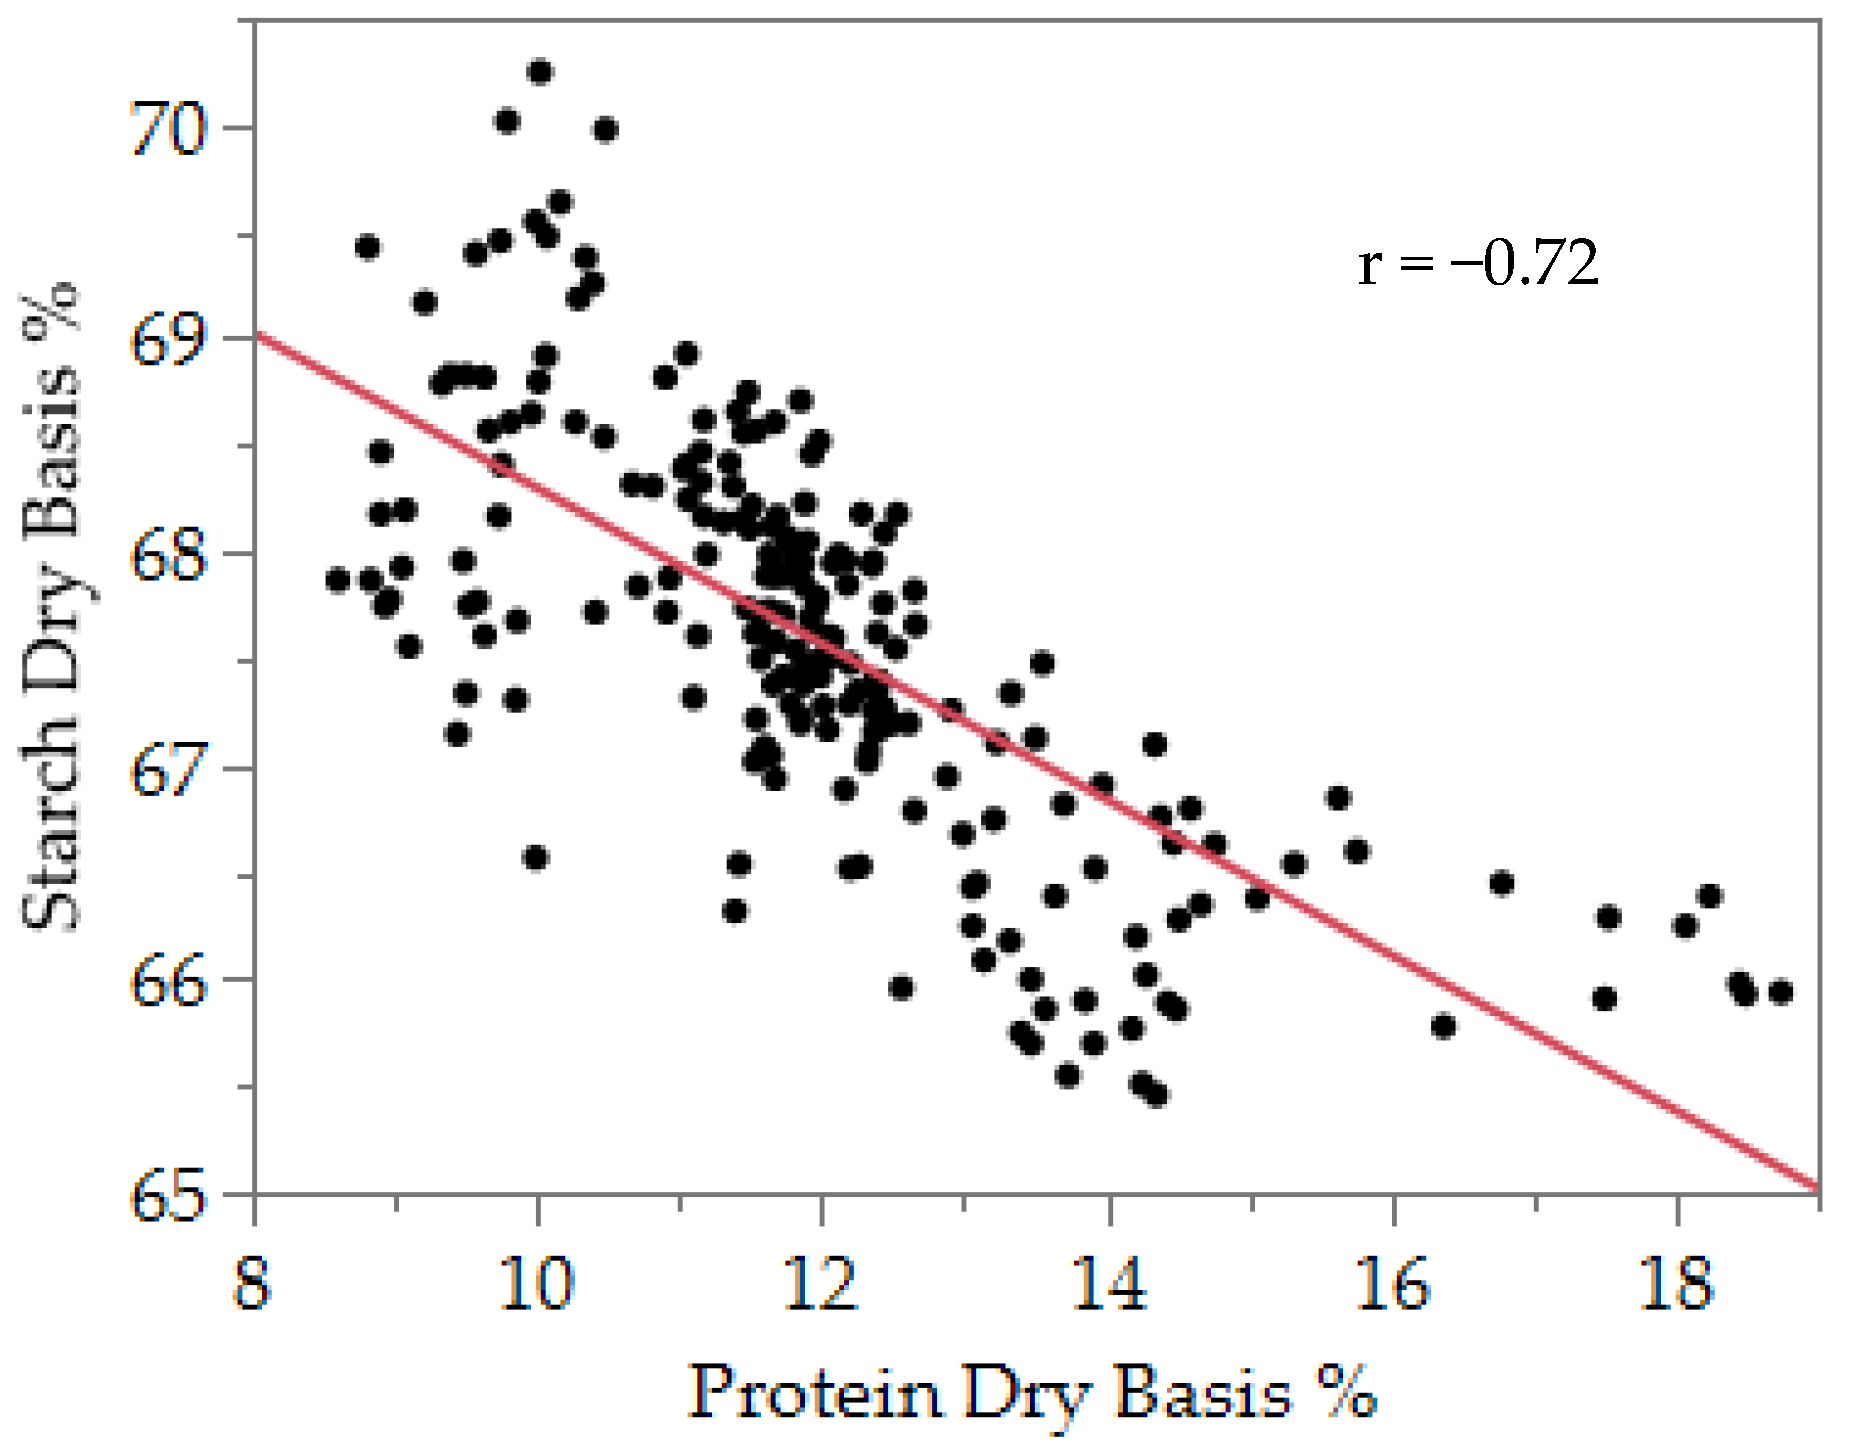
The results of protein content analysis showed a very strong negative correlation between protein content and starch content (dry weight basis;
Figure 5). The Least Squares analysis showed that genotype had the biggest impact on protein (and starch) content; however, the difference in protein content between planting dates also was highly significant (
p = 0.0025). Protein content varied between 8.6 and 18.74% (dry weight basis), and starch content (dry weight basis) was between 65.46 and 70.25%. The highest mean protein content was observed in late planting (12.27%), then in early planting (11.95%) and the lowest at the intermediate planting date (11.83%) (
Table 6).
4. Discussion
In this study we observed a wide range of maturity among varieties tested. Investigators at the University of Vermont also found statistically significant differences in heading dates between winter rye varieties tested in their 2020 variety trial [
31]. In the rotation involving double-crop soybeans, farmers prefer early maturing varieties of winter cereals, since double-crop soybean requires at least 90 days free from frost to reach physiological maturity [
24]. Kantar and Porter (2014) concluded from their study that for rye’s earliness the accumulated number of growing degree days before winter was more important than biomass accumulated in the fall. Our study has shown that early planted rye headed relatively earlier compared to intermediate and late planting date. However, we may encounter the problem of spring freeze damage of early jointing or heading rye like we did in our 2019 experiment and in the 2020 early planting.
Analysis of variance showed significant differences in yield both growing seasons between locations (
p < 0.001), varieties (
p < 0.001), planting dates (
p < 0.001), and due to variety × location interaction (
p < 0.001) (
Table S2). One of the main goals of variety improvement is increased yield [
32]; varieties tested in this study were as old as Elbon (released in 1956) and as new as KWS Serafino (2017), and significant differences in yield between varieties were expected. Laidig et all (2017) reported that over 26 years of breeding, yield of hybrid rye varieties increased by ~23% and conventional varieties ~18%. In this study a higher mean yield of all genotypes was achieved at Adairville. This may be due to a slight difference in latitude and suggests that rye requires more days for development and grain production. Earlier scientists reported that day length has an influence on tillering in cereal plants [
33]. Very early studies have shown that planting too early or too late reduces cold resistance and overall performance [
16,
17,
18,
20]. In our study the 2018/2019 growing season showed that rye performed better when planted early, but in 2019/2020, a severe May freeze caused extensive damage in early planted rye and the best planting date was the late one. It is interesting that in this experiment the intermediate planting date was not the best one, as earlier studies would suggest. Fowler (1982), in a similar study in Canada, also found that in winter wheat’s planting date influence on varietal performance was not consistent over 3 years of the experiment. Recent articles also reported inconsistent results of planting date studies for winter malting barley winter rye and triticale [
19,
34]. Yield response of rye varieties to planting dates was significantly different in 2018–2019 (
p < 0.001), but not significant the following season. At Lexington the average yield was significantly highest in the late planting treatment (
p < 0.0001). In Adairville the average yield was also highest in the late planting, but the difference was not statistically significant (
p = 0.673). This inconsistency may reflect exclusion of the early planting block in Lexington from analysis, due to 2020 severe freeze damage.
Over two years of tests, two varieties showed the best performance when planted early, seven at the intermediate planting date, and the rest of varieties had their best yields when planted late. In terms of variety x planting date interaction, it was highly significant in the first year and non-significant in the 2019/20 season (
Table S2). Two factors could account for this discrepancy: (i) in 2019/20 the difference between the early and intermediate planting dates was a mere 2 days and (ii) the severe spring freeze in 2020. We also wondered about the difference between hybrids and conventional varieties in terms of response to planting date. Over all environments there were no statistically significant (
p = 0.0652) differences in hybrid varieties yield between planting dates, but conventional varieties’ yield response to planting dates was significantly different (
p < 0.001). The highest average yield of conventional varieties was achieved with late planting. For the conventional varieties, the average yield of each planting date was significantly different, but for hybrids the difference between intermediate and late planting was not significant (
p = 0.9338) (
Table 4). Because of the differences between varieties that we observed in our study, we think that a planting date test should be continued in multiple environments for new released winter rye varieties along with varieties already known to provide best recommendation for genotype x environment combinations.
Planting date can have a profound effect on the development of winter crops. Inappropriate plant development before winter (too few tillers produced or too much growth before winter) can affect their cold resistance and increase disease susceptibility [
15]. Kelly (2001) [
35] reported that in their wheat planting dates study the highest barley yellow dwarf virus infection was found in early planted wheat. A disease of special attention in the US that results in considerable yield and quality loss in small grain crops is Fusarium Head Blight (FHB, caused by
Fusarium graminearum) [
36]. Results of our study have shown that planting date did not influence rye’s susceptibility to FHB, but we found significant differences in leaf blotch (caused by
Septoria tritici) ratings. In both locations leaf blotch symptoms were the most intense in intermediate planting. However, we found a strong positive correlation between FHB resistance and number of days to heading. Other words: the later the variety, the lower the FHB rating. Although rye is known for its high disease resistance [
21], in the case of FHB, the lower disease rate may be due to plant’s developmental escape from infection. According to Rajkumara’s review article (2008) [
37] planting date does not have as strong an impact on cereal’s lodging as nitrogen applications; however, delayed wheat planting has been reported to reduce lodging [
38]. Our study shows the opposite relationship in rye. The highest lodging resistance was observed in early planting. This result can be explained with spring freeze damage and plants recovery time of early planting resulted in shorter internodes and more steady stems.
Winter rye grain used to be successfully produced in Kentucky and one question that is being asked over and over is why Kentucky yield levels are so much lower than those in Europe or Canada. We suspect that the changing climate may have a strong influence on this situation. The past decade has been the warmest period of time ever recorded [
39]. According to the NOAA (National Oceanic and Atmospheric Administration) 2022 State Climate Summary, between 2016 and 2020 was observed the warmest 5-year period in Kentucky [
40]. Moreover, less than two nights per year when temperature dropped below −17 °C (~0 °F), over the last 30 years, were recorded. On the other hand, heat events in Kentucky are predicted to be more intense, which may disturb grain set and fill [
40,
41]. The climate’s change to warmer winters and an earlier beginning of spring is leading to increased pathogen survival, thus, higher risk of crop disease infection [
41]. In this study we wanted to take a closer look at the influence of temperature and precipitation at particular periods of plant development. Over all environments no strong correlations between yield and GDD accumulated during particular weeks of grain fill were found, but yield results were different between locations and seasons so we were curious about yield correlations within seasons and each location. We found moderate yield correlations with accumulated GDD during the 1st week after heading in both locations, in the 2nd and 3rd week in Lexington and during the 4th week after heading, which is an intense grain fill period [
42], in both locations. In 2019, while screening farmers’ rye plantings, we observed good anther extrusion, pollen release, and kernel differentiation, but we noticed that approximately 50% of kernels were aborted later on (anecdotal information, Sam Halcomb—Walnut Grove Farms, Chad Lee and Elzbieta Szuleta—University of Kentucky). Plants affected by heat stress are forced to intensification of respiration, consuming the products of photosynthesis instead of using them to build and activate reproductive cells [
43]. We were hoping to find the reason of such high rate of aborted kernels in Adairville 2019. We suspect that heat stress during heading and anthesis negatively influenced fertilization and/or later grain fill. In fact, pollen is more sensitive to heat stress than other plant tissues [
44]. We looked at the maximum and minimum daily temperatures during heading and anthesis, but we did not find any significant correlations with yield. We observed moderate positive yield correlations of 0.6 with accumulated GDD during the first week, and 0.62 during the third week after heading in this particular environment (Adairville, 2019). Similar correlations were found in Lexington 2020. It seems that cumulative GDD have more importance right after heading and about 4 weeks after heading when cell differentiation and grain fill occur, respectively, than total GDD accumulated from heading to maturity.
We found a strong negative correlation between fall cumulative GDD and yield in Lexington, 2019/2020 (−0.81), while in previous season this correlation was only 0.1. In fall 2019 the maximum daily temperatures in Lexington were higher throughout the whole fall compared to fall 2018, and the minimum daily temperatures were lower in fall 2019 than 2018. The average cumulative fall GDD was slightly, but not significantly higher in 2019, but the fall daily temperature amplitudes were significantly (p = 0.004) higher in 2019. Did warm days and cooler nights in fall caused yield decline? There was another weather factor that caught our attention and had a very strong impact on the 2020 yield in Lexington. The May freeze caused serious yield loss, especially with early planting. Although we did not collect anthesis data, we noticed that the freeze occurred after the early planting block headed, right before anthesis, very likely damaging pollen, resulting in sterility.
Multiple studies have shown that grain protein content in wheat increases as the planting date is delayed in both: winter and spring wheat [
44,
45,
46,
47]. Our results showed that also for winter rye, a later planting date is associated with an increase of grain protein content.
Optimal planting dates for winter rye in a specific region depend on fall weather conditions that are difficult to predict. Thus, it is difficult to provide a recommendation for winter rye planting date with certainty. Climate and yield correlations were inconsistent between tested environments, and we cannot conclude what weather components could explain rye’s performance in Kentucky. However, some correlations indicate that the influence of temperatures during the grain filling period is critical, and this aspect of environment and rye physiology is worth further investigation. Hybrid varieties are less sensitive to planting date and produce statistically higher grain yield than conventional varieties, but farmers cannot replant grain produced by hybrids. This leads to higher expense for seed compared with conventional varieties and growers need to weigh the risk of conventional varieties performance inconsistency, with their earliness, and the cost of seed. The best performing conventional varieties in Western Kentucky were AC-Hazlet and ND-Dylan and in Central Kentucky- Abruzzi, ND-Dylan, and Kentucky lines: KYSC1503, KYSC1704 and KYSC1710. Our study showed that for most of the tested varieties, intermediate and late planting dates were best. However, as has been observed in many other planting date studies, and in crop species other than rye, the results of the study were inconsistent over environments, and we cannot provide precise planting date recommendations for rye in Kentucky.


 ,
, 


