Article

Light Interception and Radiation Use Efficiency of Three Cassava Genotypes with Different Plant Types and Seasonal Variations

by
Supattra Mahakosee
1,2,
Sanun Jogloy
1,3,
Nimitr Vorasoot
1,
Piyada Theerakulpisut
4,
Banyong Toomsan
1,
Carl Corley Holbrook
5,
Craig K. Kvien
6 and
Poramate Banterng
1,7,*
1
Department of Agronomy, Faculty of Agriculture, Khon Kaen University, Khon Kaen 40002, Thailand
2
Faculty of Innovative Agriculture and Technology (Established Project), Institute of Interdisciplinary Studies, Rajamangala University of Technology Isan, Nakhon Ratchasima 30000, Thailand
3
Peanut, Jerusalem Artichoke, and Cassava Improvement Research Group, Khon Kaen 40002, Thailand
4
Department of Biology, Faculty of Science, Khon Kaen University, Khon Kaen 40002, Thailand
5
USDA-ARS, Crop Genetics and Breeding Research Unit, Coastal Plain Experimental Station, Tifton, GA 31793, USA
6
Crop & Soil Sciences, The University of Georgia, Tifton, GA 31793, USA
7
Plant Breeding Research Center for Sustainable Agriculture, Faculty of Agriculture, Khon Kaen University, Khon Kaen 40002, Thailand
*
Author to whom correspondence should be addressed.
Agronomy 2022, 12(11), 2888; https://doi.org/10.3390/agronomy12112888
Submission received: 28 October 2022 / Revised: 17 November 2022 / Accepted: 17 November 2022 / Published: 18 November 2022
(This article belongs to the Special Issue Crop Productivity and Energy Balance in Large-Scale Fields)

Abstract

:
The yield potential of cassava might be increased by enhancing light interception and the ability to convert energy into biomass and yield, which is described as radiation use efficiency (RUE). The objective of this study was to determine light interception, extinction coefficient (k), and RUE of three cassava genotypes (Kasetsart 50 (KU50), Rayong 11 (RY11), and CMR38-125-77) under seasonal variations. The field experiments were conducted in a randomized complete block design with four replications, using two planting dates for 2 years at Khon Kaen, Thailand. Data were recorded for weather conditions, light interception, leaf area index (LAI), and biomass. Solar radiation interception, RUE, and k were calculated. Light interception of the crop planted in May sharply increased in the early growth stage, whereas the crop planted in November slowly increased and could maintain higher light interception from the mid–late growth stages. Light interception and LAI had a moderate to high coefficient of determination (R2 = 0.61–0.89) for three cassava genotypes and all planting dates. The k values ranged from 0.59 to 0.94, varying by genotypes and planting dates, indicating that the leaf orientation of the three cassava genotypes was horizontally oriented. The relationship between biomass accumulation and cumulative solar radiation produced a high value of R2 (0.86–0.99). The RUE for biomass (RUEbi) varied by genotype and planting date, ranging from 0.66 g MJ−1 to 0.97 g MJ−1. However, the RUE for storage root dry weight (RUEsr) ranged from 0.29 g MJ−1 to 0.66 g MJ−1. The RUEbi and RUEsr in each genotype on each planting date were significantly different. The highest RUEbi and RUEsr were found at 4–6 and 7–9 MAP for almost all genotypes and planting dates, except for the crop planted in November 2015, when both RY11 and CMR38-125-77 had the highest RUEbi at 10–12 MAP. RY11 had a lower LAI compared to other genotypes, which contributed to lower light disruption and lower RUEbi and RUEsr. KU50 and CMR38-125-77 could maintain canopy light interception during canopy development and storage root accumulation stages and had high RUEbi and RUEsr, resulting in high biomass and crop yield.

1. Introduction

Cassava (Manihot esculenta Crantz) is an important starch crop worldwide and is mostly grown in tropical and sub-tropical regions (~30° N to ~30° S). The products from cassava roots and leaves not only serve human consumption but are also used as animal feed and raw materials for paper, textiles, alcoholic drinks, and bioethanol [1,2]. Although the demand for cassava has rapidly increased for several industries [3], the cassava growing area has decreased due to the competition of other industrial crops such as sugarcane and maize [4]. In the case of yield potential under optimum conditions, cassava has the greatest potential for energy production compared with other major staple food crops in the tropics [5,6]. Recently, cassava yields reached 80–90 t ha−1 in experimental plots [2]; however, in the farmer fields, cassava yield is still lower than expected. Phoncharoen et al. [7] emphasized that different climatic factors, such as temperature, solar radiation, and relative humidity, during crop growth affected cassava yield and total biomass. Cassava yield could be increased by crop management, such as irrigation and fertilizer application, but this increases the cost of production. Yield improvement for cassava could also be achieved by conventional breeding programs [3]. Selection for a good genotype with high yield potential and adaptability to unfavorable environmental conditions is one of the main breeding objectives for cassava improvement.
Previous reports demonstrated that the RUE traits had high positive correlations with crop yield and biomass production in several crops, such as cotton, maize, rice, and cassava [8,9,10,11,12]. However, RUE was strongly dependent on light interception, which is a combination between light intensity and the area of intercepted light [13,14,15,16]. Variation in light intensity depends on season and latitude, while the area intercepting light is dependent largely on plant canopy architecture consisting of canopy structure, canopy size, canopy shape, and orientation of leaves [15,17,18,19]. However, the largest canopy did not result in the highest yield of cassava [20]. Genotypes with good canopy structure and adjustment of leaf arrangement and leaf angle may help increase the light intercepted area and increase the photosynthetic capacity of the plant canopy [21,22,23]. The appropriate leaf arrangement and leaf angle for greater light interception depend on crop species and management. Erectophile canopy has greater light interception than a planophile canopy in chickpeas [24], and a larger leaf area genotype could produce more assimilates and increase grain yield in maize [25]. The estimation of the leaf angle in the canopy directly was too difficult; however, the k by the relation between light penetration and LAI could predict the leaf angle in the plant canopy [26]. In a study of light interception, the k and RUE for cassava have been reported by Pellet and El-Sharkawy [9]. Long-term breeding programs for high-yield cassava have been done in several areas of the world. However, information on light interception, the k, and RUE is limited in the literature. Therefore, this study aimed to determine light interception, k, and RUE of three cassava genotypes under seasonal variations. The information from this study might be used as a criterion for selecting an appropriate cassava canopy with a high light interception and RUE genotypes in breeding programs.

2. Materials and Methods

2.1. Experimental Design and Plant Materials

Field experiments were conducted at the Field Crop Research Station of Khon Kaen University, Thailand (16°47′ N and 102°81′ E, 195 m above sea level) from 2015 to 2016 and 2016 to 2017. Three cassava genotypes consisting of Kasetsart 50 (KU50), Rayong 11 (RY11), and CMR38-125-77, with different canopy structures and internode lengths, were arranged in a randomized complete block design with 4 replications for two planting dates and two years. A planting date of May represented the rainy season, and November represented to post rainy season. Plot size was 28 × 7 m2, rows were ridged with a 1 m row spacing, and plant spacing was 1 m within a row.
Soil hardpans were broken before planting at 30–60 cm depth. Sunn hemp (Crotalaria juncea L.) was grown as green manure, and cattle manure at the rate of 6250 kg ha−1 was applied. Healthy and uniform cassava stems were selected from the multiplication field for each planting date. The cassava stems were cut into 20 cm long pieces and the stalks were soaked in the thiamethoxam (3-(2-chloro-thiazol-5-ylmethyl)-5-methyl-(1,3,5)-oxadiazinan-4-ylidene-N-nitroamine 25% WG) at the rate of 4 g 20 L−1 water, for 20 min, to prevent pink mealybug (Phenacoccus manihoti Matile-Ferrero). Stalks were incubated in a gunnysack for 3 days before planting. Single stalks were buried to half their length on the ridge row. An overhead sprinkler irrigation system was installed to supply water for the cassava crop from planting to harvesting. Weeds were controlled by hand weeding at 1 and 2 MAP. Fertilizer was applied 2 times after weed control by calculating minimized rates of N:P2O5:K2O following Howeler [27]. Pests and diseases were controlled as necessary.

2.2. Data Collections

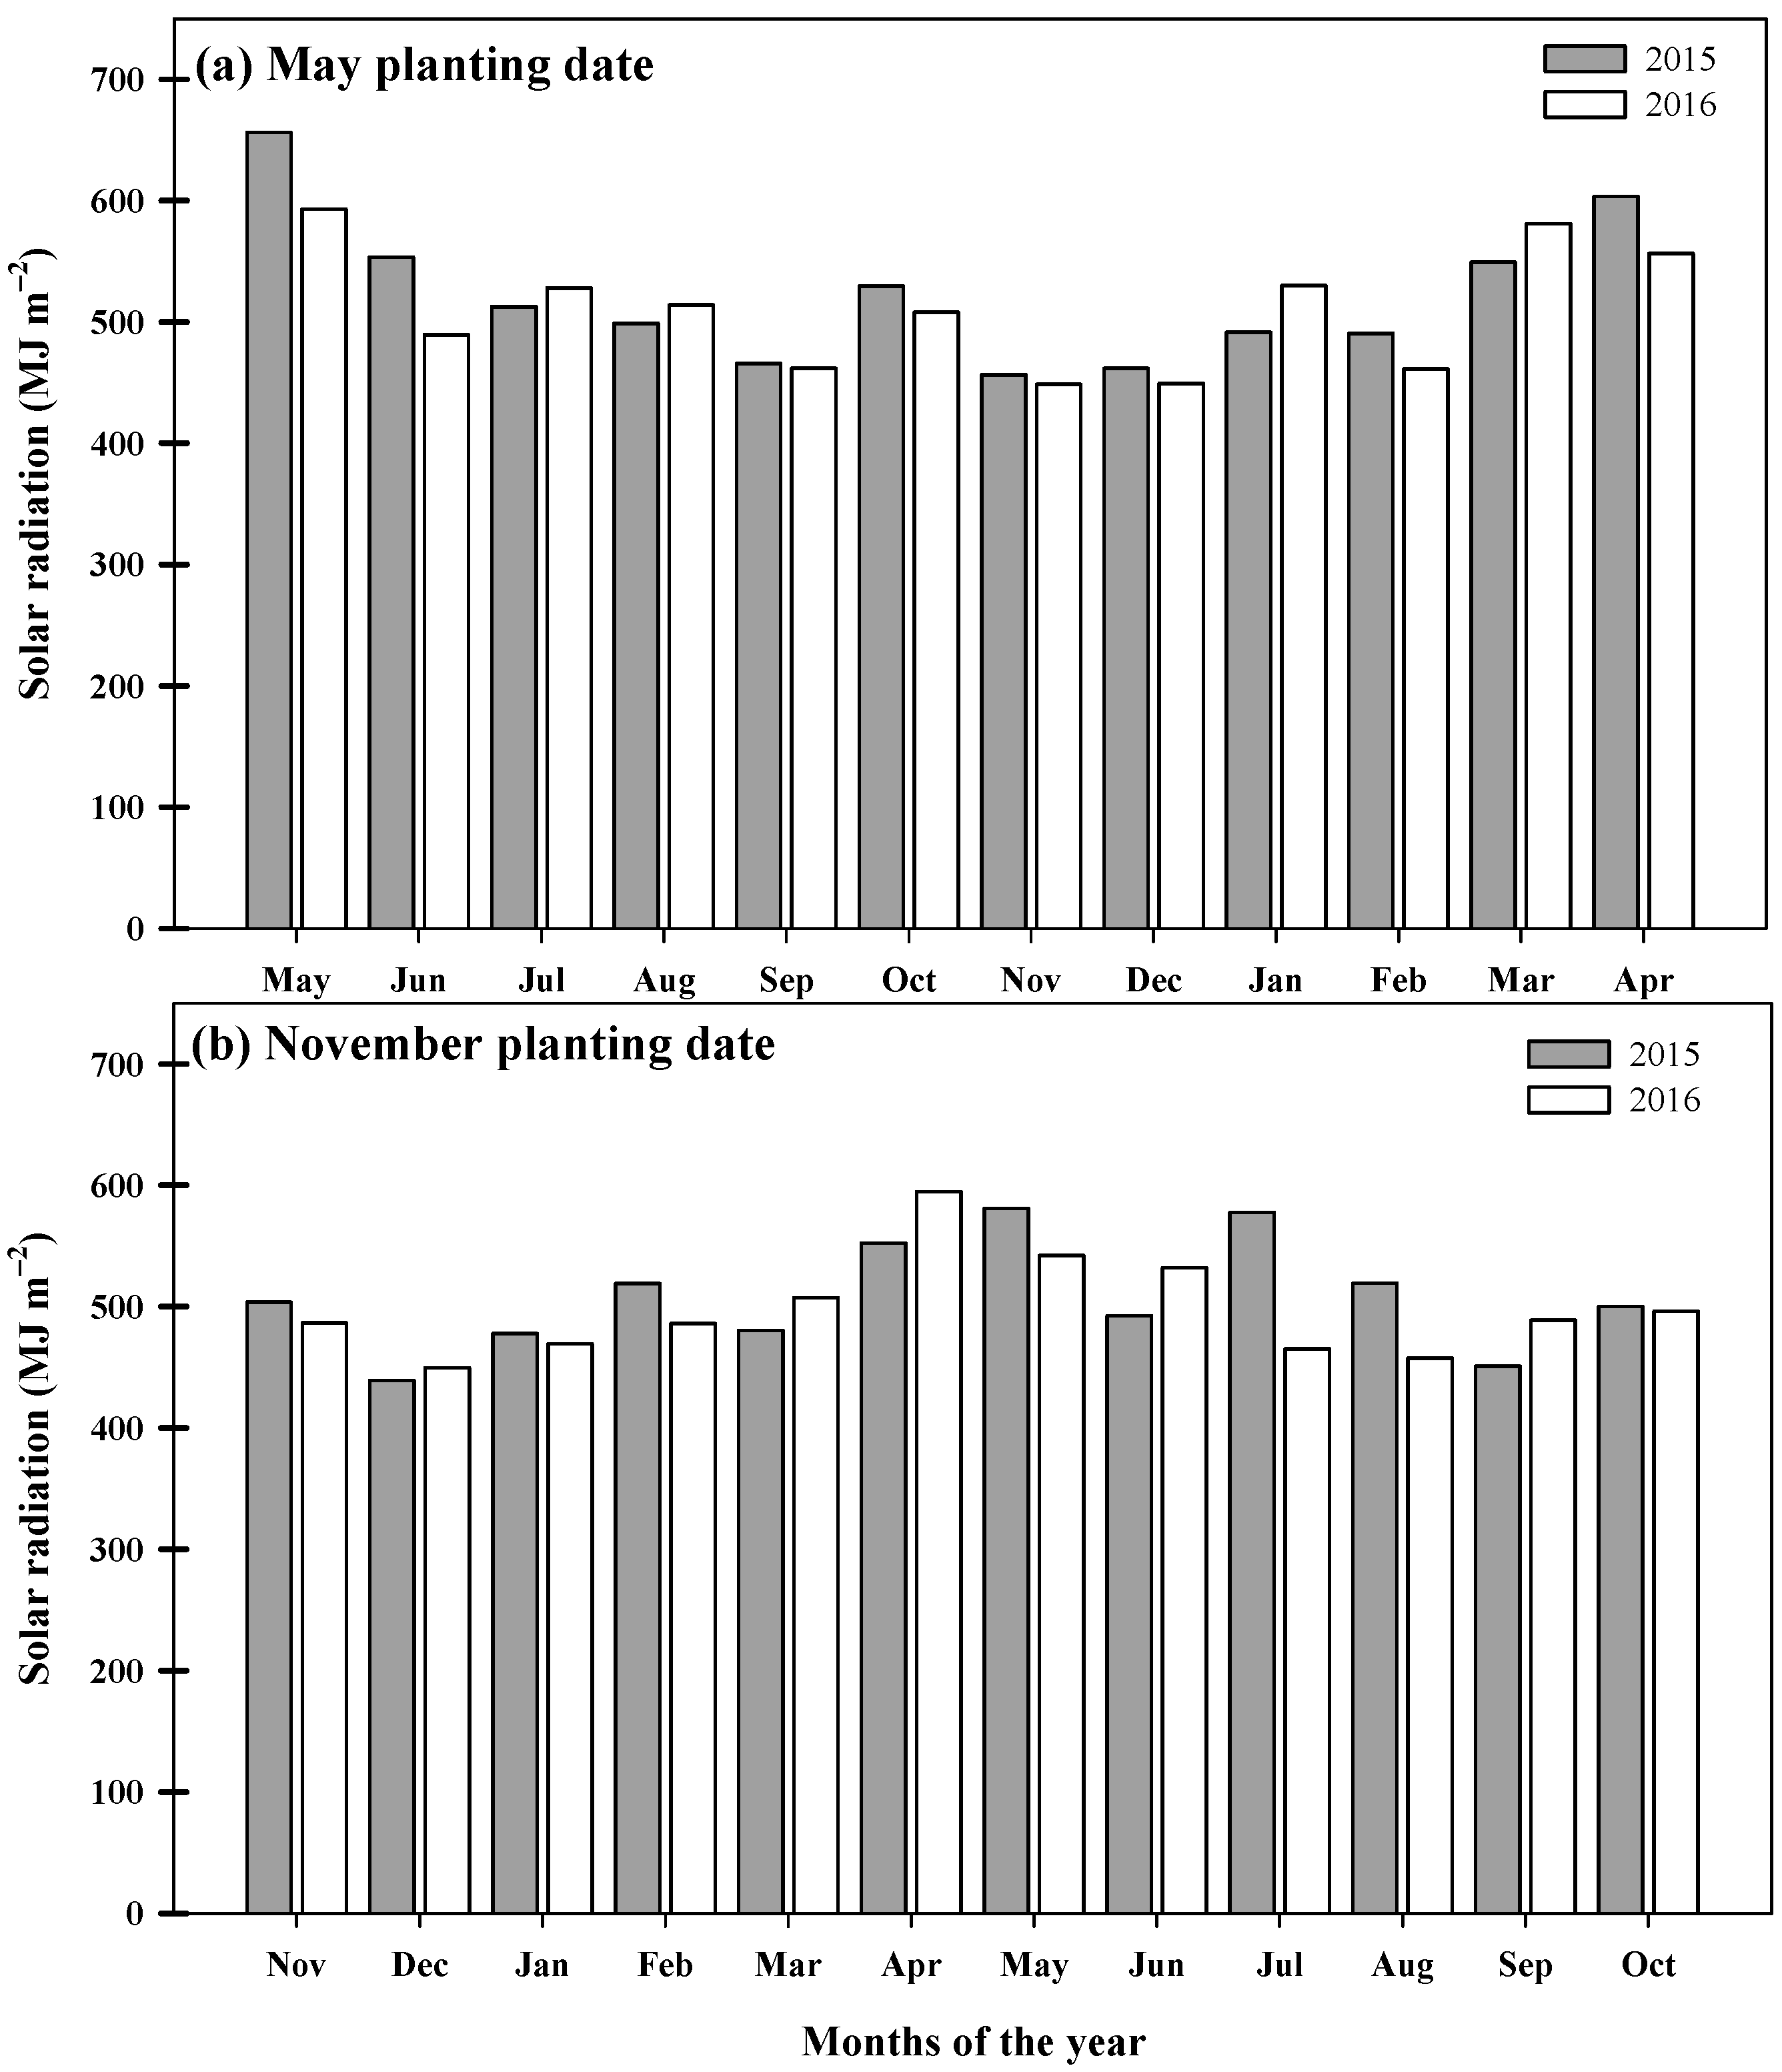
2.2.1. Weather Conditions

Weather data were recorded by an automatic data logger (Watch Dog 2700) (Watchdog, PCE group, PCE Germany, Meschede, Germany) that was installed in the field experiments (i.e., minimum and maximum temperature, daily rainfall, relative humidity, and photosynthetically active radiation (PAR, 400–700 nm)). Daily solar radiation was converted from daily PAR each day [28]. Maximum and minimum temperatures for cassava planted in May of 2015 ranged from 16.4 to 43.9 °C and from 8.9 to 29.5 °C, respectively, and relative humidity ranged from 22.9 to 92.8%. For November 2015, the maximum temperatures were 16.8 to 43.9 °C, the minimum temperatures were 8.9 to 29.5 °C, and relative humidity ranged from 22.9 to 92.3%. Maximum and minimum temperatures for the crop planted in May 2016 ranged from 24.5 to 39.8 °C and from 14.0 to 27.3 °C, respectively. Relative humidity was 33.0 to 92.3%. For November 2016 planting, the maximum temperatures ranged from 24.5 to 39.8 °C, the minimum temperatures ranged from 14.0 to 27.3 °C, and relative humidity ranged from 33.0 to 99.6%.
The total amount of rainfall for the crops planted in May was 883 mm (2015) and 1176 mm (2016), and for the November planting date was 1122 mm (2015) and 1469.3 mm (2016). The solar radiation from planting to harvest for the May 2015 planting ranged from 6.4 to 25.4 MJ m−2d−1, and the total solar radiation was 6268.7 MJ m−2. For the crop planted in November 2015, the solar radiation ranged from 5.4 to 24.5 MJ m−2 d−1 with a total of 6093.0 MJ m−2. In the year 2016, solar radiation ranged from 5.4 to 24.5 MJ m−2 d−1, and the total was 6120.0 MJ m−2 (May planting); however, the November planting crop had solar radiation ranging from 7.7 to 24.8 MJ m−2 d−1, and the total amount of solar radiation was 5974.5 MJ m−2 (Figure 1).

2.2.2. Soil Physical and Chemical Properties

The soil samples at depths of 0–30 cm were taken to analyze the soil’s physical and chemical properties. The Yasothon soil series (Typic Paleustult) with loamy sand and sandy loam was found in all experimental plots. Soil pH ranged from 7.01 to 7.41 except for the November 2015 planting date, when soil pH ranged from 6.27 to 6.50. The soil of the four planting dates had organic matter ranging from 0.44 to 0.53% and total nitrogen ranging from 0.013 to 0.037%. The available phosphorus in all four planting dates ranged from 51.6 to 88.5 mg kg−1. The critical level of available phosphorus in the soil is about 4–6 mg kg−1 (Bray II-extractable phosphorus) [27]. Thus, the soil in this experiment had sufficient phosphorus for all planting dates. For soils used in all four planting dates, exchangeable potassium ranged from 30.8 to 54.6 mg kg−1 at 0–30 cm soil depth. Therefore, the soil in this experiment had insufficient exchangeable potassium.

2.2.3. Light Interception and Cumulative Solar Radiation

Light interception was defined by light penetration through the plant canopy. The light penetration could be calculated by measuring PAR light above the canopy and below the canopy (under the plant and between row) by using a 1.0 m line quantum sensor (Licor 191) and data logger (LI-1500, LI-COR) [29]. A set of data consisted of three measurements at three times per plot. The data were recorded under clear sky conditions at near noon (11.30 am–1.00 pm) at monthly intervals after 1 MAP until harvested (12 MAP). Light interception percentages were calculated by [PAR (above the plant canopy)—PAR (average below the plant canopy)] × 100 divided by PAR (above the plant canopy).
The cumulative solar radiation intercepted was calculated from the amount of solar radiation in each month (recorded by weather station) multiplied by the percentage of intercepted light of the cassava canopy for each genotype in each month’s measurement. The data of solar radiation intercepted for each genotype were summarized.

2.2.4. Leaf Area Index (LAI) and Extinction Coefficient (k)

LAI in each plot was measured at one-month intervals in the 6 × 7 m2 area by using the LAI-2000 Plant Canopy Analyzer (LI-COR, Lincoln, NE, USA) under overcast and/or clear sky conditions [30]. Three readings were taken in each subplot, and the data were averaged. The relationship between the percentage of light interception and the LAI was calculated using the equation proposed by Monsi and Saeki [26];
ln (I/Io) = −k • LAI
where I = light received at below the plant canopy, Io = incoming light just above the plant canopy, k = extinction coefficient, which indicates the leaf arrangement in a canopy [31,32].

2.2.5. Total Biomass and Yield

Data on biomass and storage root dry weight in each genotype were recorded from six plants in the sampling area (6 m2) of each plot at one-month intervals from one month continuing to harvest for the crop planted in May and November in the year 2015. However, for both planting dates in the year 2016, the data for biomass and storage root dry weight were recorded 8 times at 1, 3, 4, 6, 8, 9, 10, and 12 MAP. At the final harvest (12 MAP), the data were recorded from 18 plants (18 m2) in each plot. The plant samples in each sampling date were separated into leaves, petioles, stems, and storage roots. The total fresh weight of each plant part was recorded immediately, and a sample of more than 10% for each plant part was oven-dried at 80 °C for 72 h or until the weight was constant to determine dry weight. Data on the storage root dry weight of each plot were recorded, and the total biomass in each plot was calculated.

2.2.6. Radiation Use Efficiency (RUE)

The coefficient of the linear regression between biomass and cumulative solar radiation could be referred to as RUE for all crop growth cycles. The RUE for biomass (RUEbi) and RUE for storage root (RUEsr) in each growth stage were considered. The RUE of each subplot in every 3 months intervals (0–3, 4–6, 7–9, and 10–12 MAP, followed by cassava growth stages as described by Alves [33]), was calculated by biomass and storage root dry weight (g m−2) divided by the cumulative solar radiation intercepted (MJ m−2) by the canopy of each subplot in each sampling time.

2.3. Statistical Analysis

Data on cumulative solar radiation, RUEbi, and RUEsr in each crop growth stage for all genotypes in each planting date and each year were analyzed following a randomized complete block design (RCBD). Mean comparisons based on the least significant difference (LSD) were conducted for all crop growth stages and planting dates. The regression analysis was carried out to determine the relationship between light interception and LAI, accumulation of biomass, and cumulative radiation. The extinction coefficient (k) was determined by the relationship between ln(I/Io) and LAI. All of the statistical analyses were performed using Statistix 10 program [34] and by following the procedure described by Gomez and Gomez [35].

3. Results

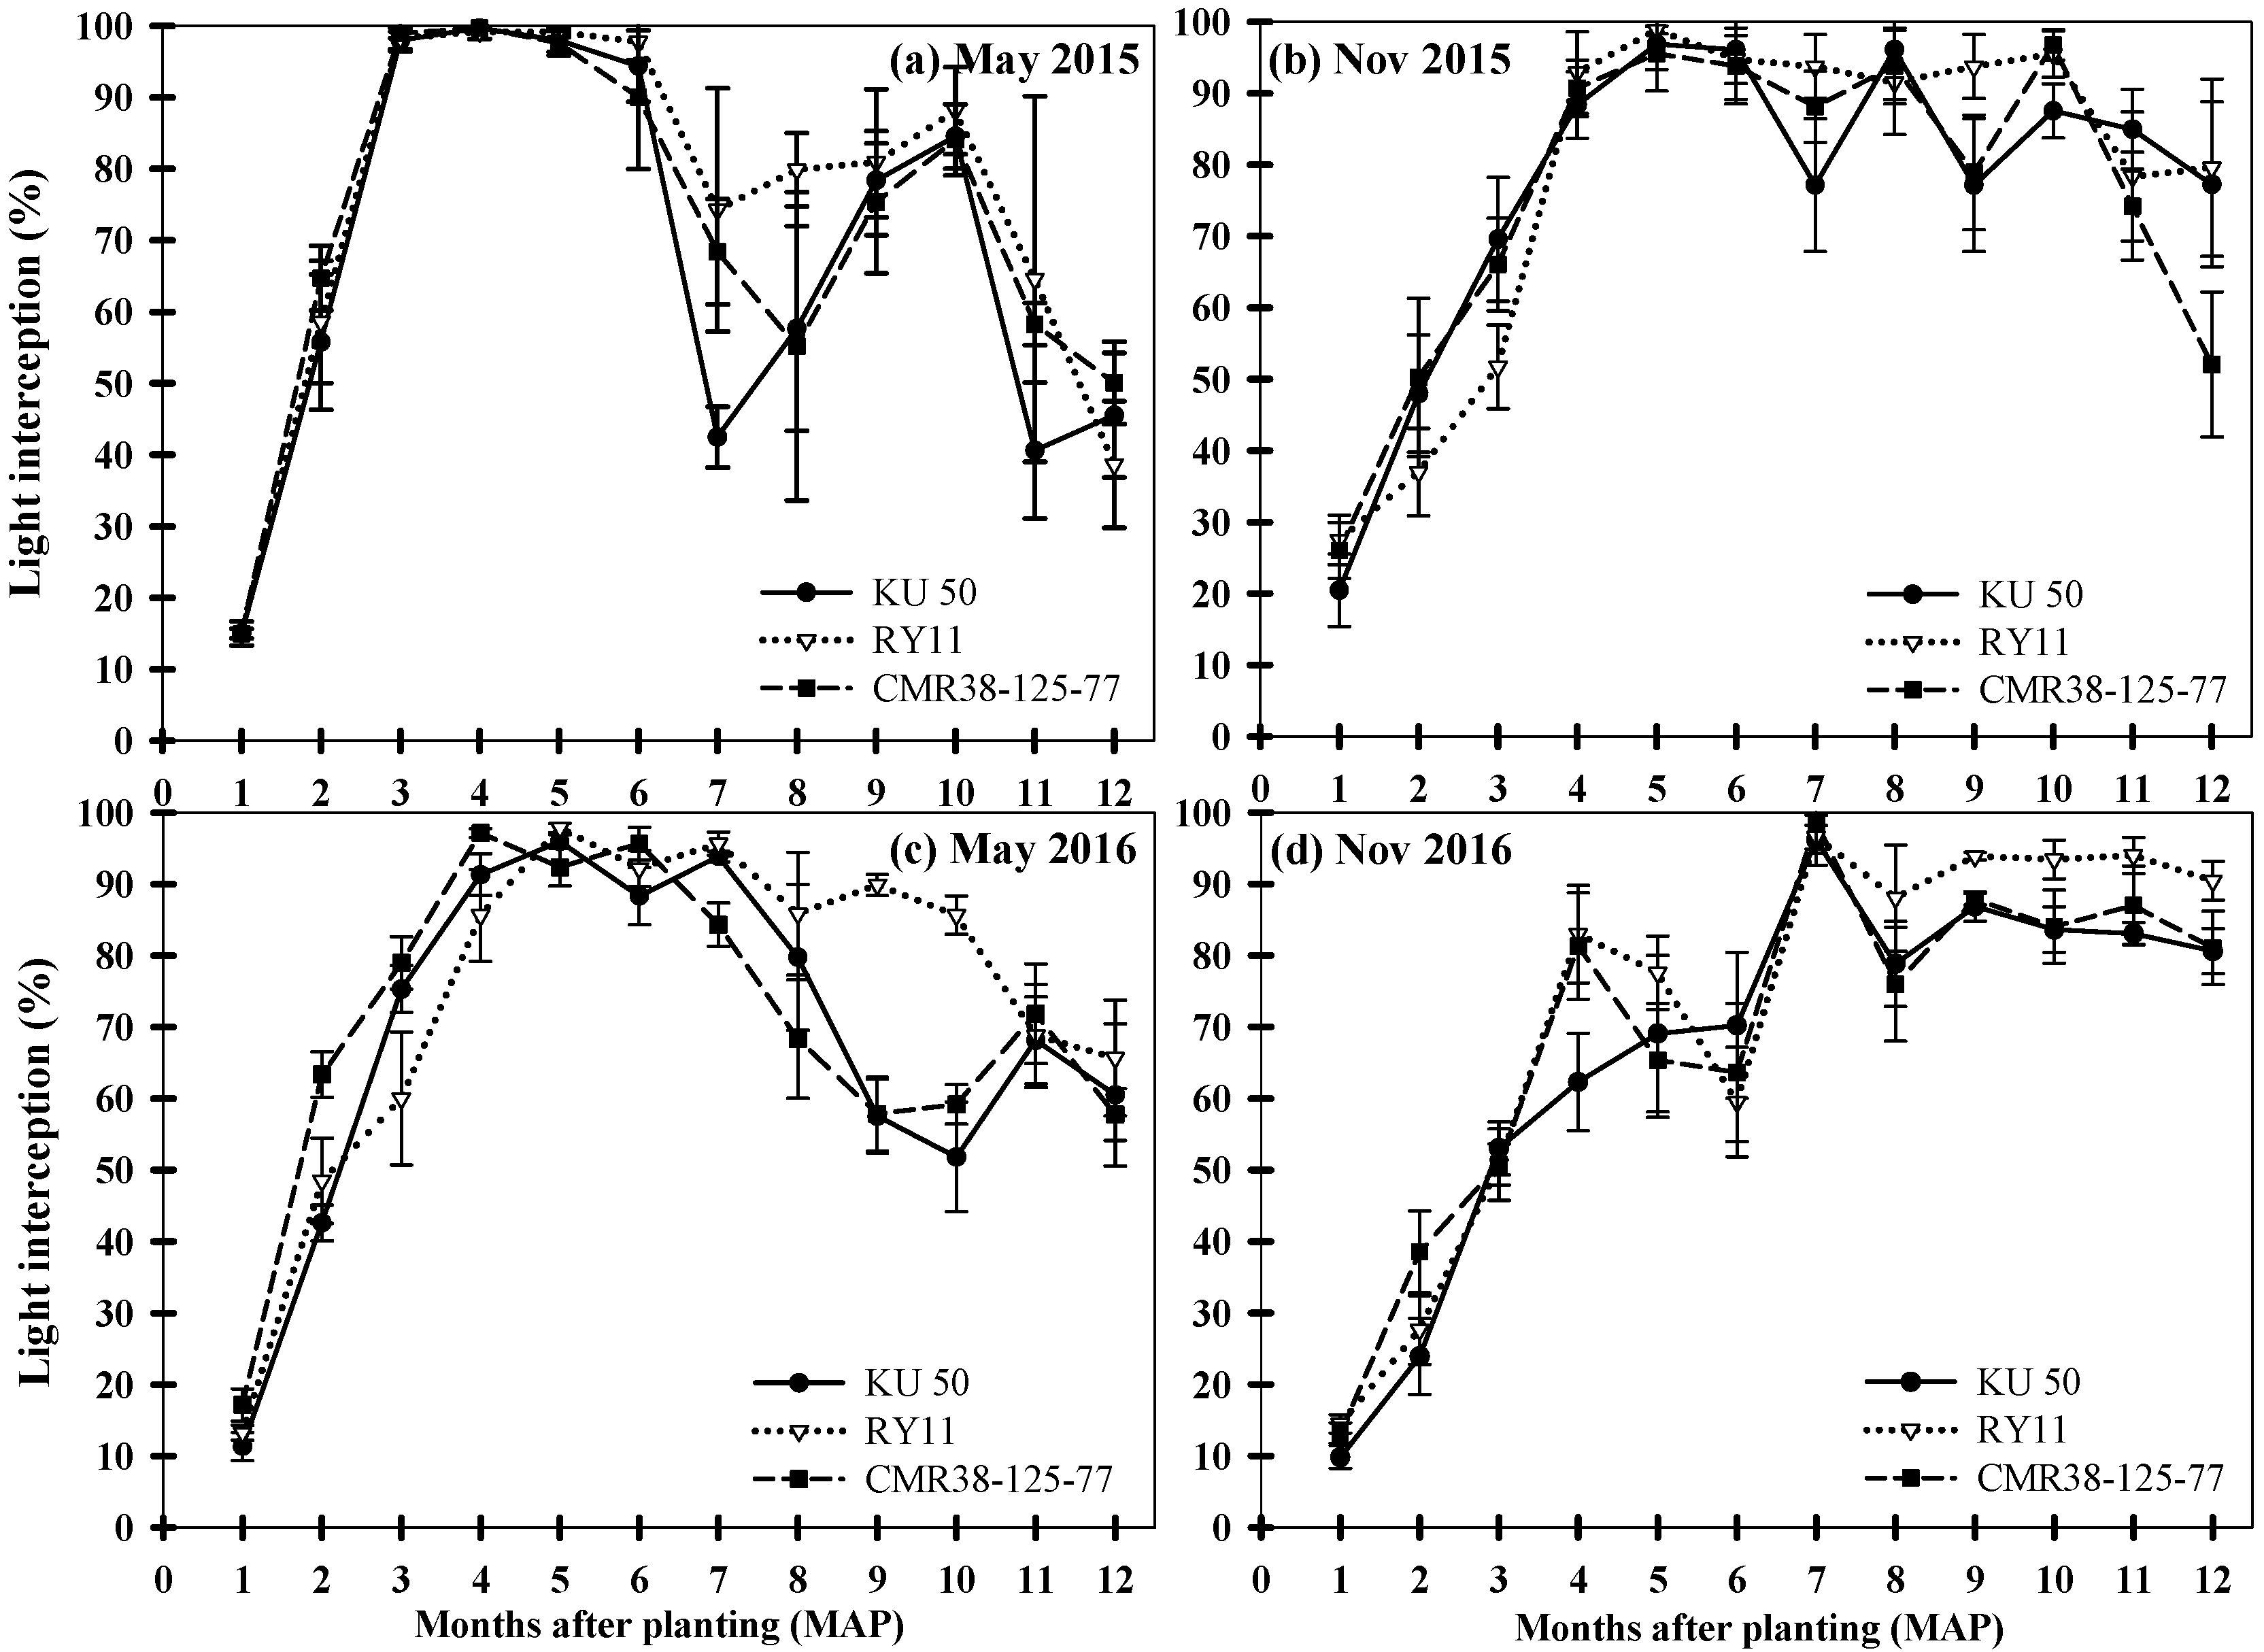
3.1. Light Interception

There was a sharp increase in light interception for the crop planted in May 2015 for all three genotypes that peaked at 3–6 MAP. After that, light interception slightly declined at 7 MAP (Figure 2a). During the late growth stage, RY11 had a higher light interception percentage than KU50 and CMR38-125-77. However, for the November 2015 planting, all three cassava genotypes had slightly increased light interception that peaked at 5 MAP and was then maintained at a light interception of more than 50% until harvest (Figure 2b). RY11 seems to maintain a higher light interception percentage than the other genotypes.
The pattern of light interception for the crops planted in 2016 was similar to 2015 for both May and November plantings. In May 2016, RY11 had a higher light interception percentage than KU50 and CMR38-125-77 during the late growth stage (Figure 2c). However, the crops planted in November 2016 had slightly increased light interception that peaked at 7 MAP, and after that, the crop maintained light interception of more than 80% until harvest (Figure 2d).
Figure 2. Light interception percentage of 3 cassava genotypes planted in May and November 2015 (a,b) and 2016 (c,d).
Agronomy 12 02888 g002

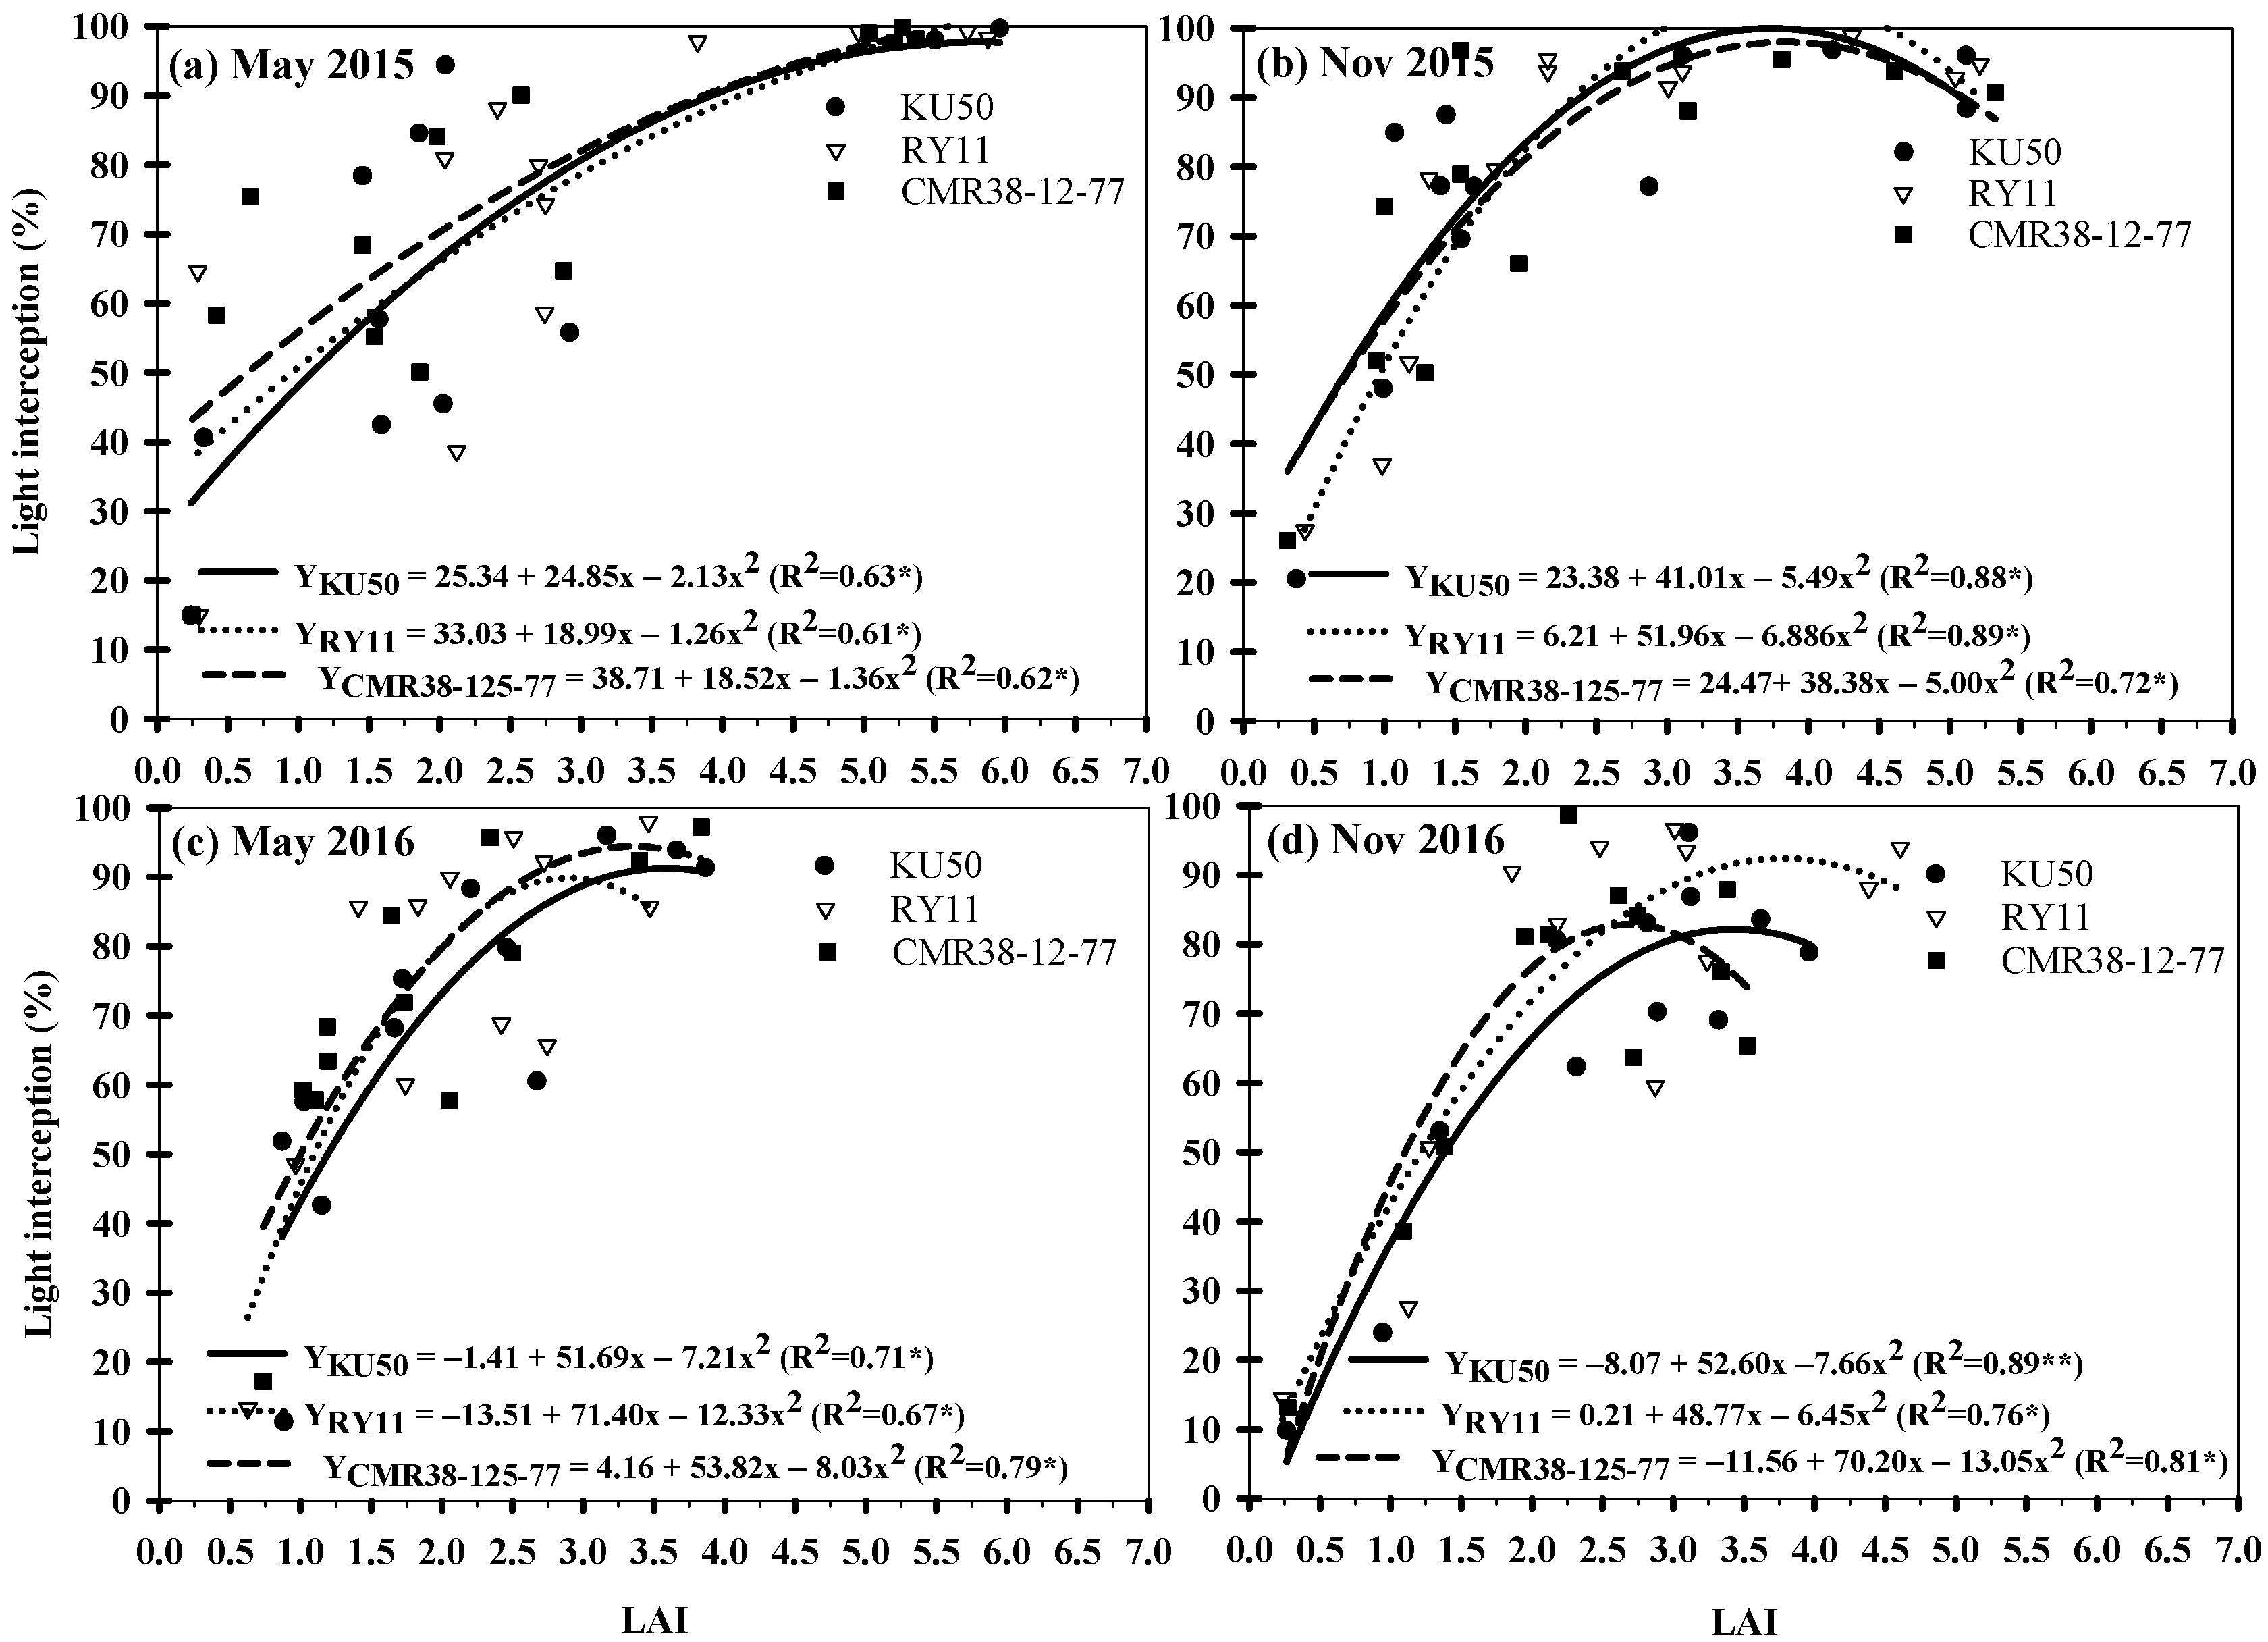
3.2. Light Interception and LAI

A multiple regression analysis was performed to evaluate the relationship between light interception and LAI. The correlation between light interception and LAI was positive and highly significant for all genotypes and planting dates. The determination coefficient (R2) for regression analysis between light interception and LAI was moderate to high (0.61–0.89) (Figure 3). In May 2015, the light interception for KU50 increased by 24.85% with increasing LAI 1 unit, whereas those of RY11 and CMR38-125-77 increased by 18.99% and 18.52%, respectively (Figure 3a). However, maximum light interceptions were observed when LAIs were 5.0–6.0. The crops planted in November 2015 had a higher potential to intercept light than the crops planted in May 2015 for all three genotypes. KU50 could increase light interception by 41.01%, while those of RY11 and CMR38-125-77 increased interception by 51.96% and 38.38%, respectively (Figure 3b). The light interception reached the maximum when LAIs were 3.0–4.0; however, the light interception declined when LAIs were over 4.0.
For the crops planted in May 2016, the correlation between LAI and light interception was positive and significant for all genotypes. However, the highest light interceptions were observed when LAIs were 3.0 to 4.0 (Figure 3c). For RY11, a 1 unit increase in LAI resulted in a 71.40% increase in light interception, which was higher than KU50 (51.69%) and CMR38-125-77 (53.82%). In November 2016, the highest light interception reached the peak when LAI was 2.5 for CMR38-125-77, while the highest for KU50 and RY11 were 3.0 to 4.0, respectively (Figure 3d). CMR38-125-77 had the highest performance of intercepted light.
Figure 3. Regression analysis for LAI and light interception (%) of 3 cassava genotypes planted in May and November 2015 (a,b) and 2016 (c,d). *, ** = significant at p < 0.05 and p < 0.01 probability levels, respectively.
Agronomy 12 02888 g003

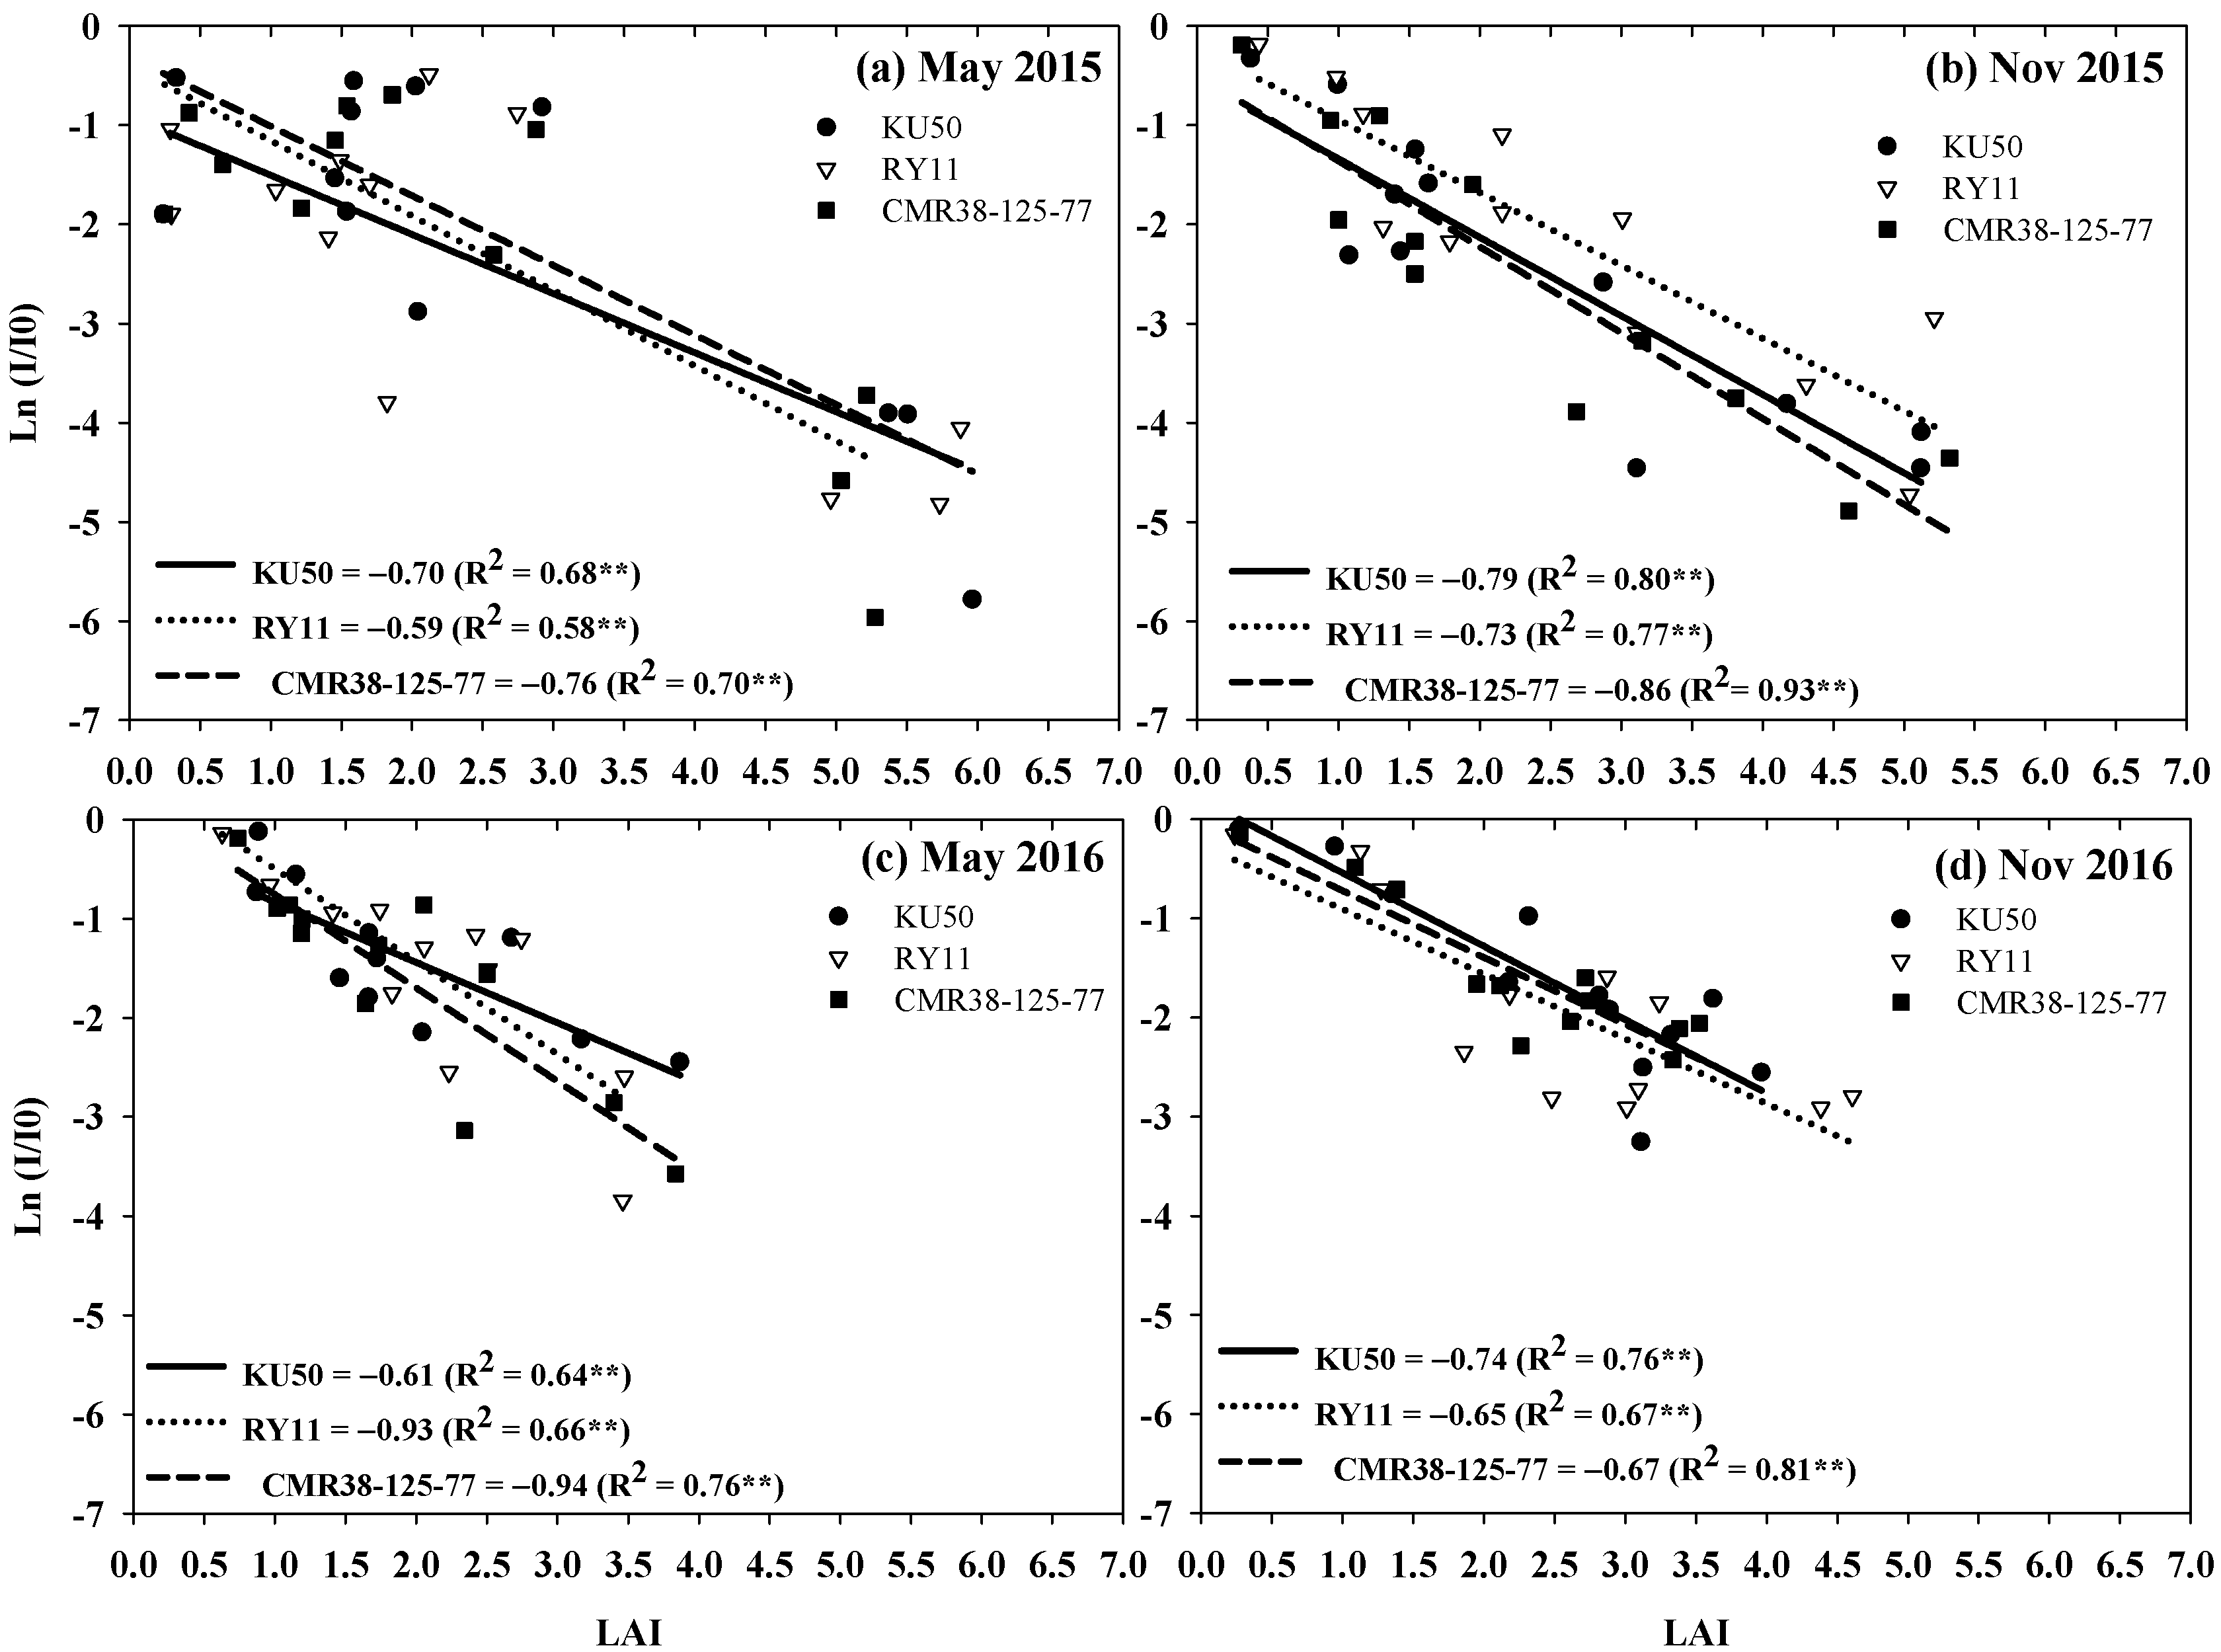
3.3. Extinction Coefficient (k)

In this study, the linear regression plotted against LAI and Ln (I/Io) showed a moderate to high determination coefficient (R2 = 0.58–0.93). The slope of regression is referred to as k. The k values in this study ranged from 0.59 to 0.94 depending on genotype and planting date. For the crop planted in May 2015, RY11 (0.59) had a lower k value than KU50 (0.70) and CMR38-125-77 (0.76) (Figure 4a). The results indicated that the angle between leaf and sunlight of RY11 was smaller than for KU50 and CMR38-125-77. However, for the November 2015 planting, the k values of three genotypes were high (0.79 (KU50), 0.73 (RY11), and 0.86 for CMR38-125-77) with a high determination coefficient (R2 = 0.77–0.93), indicating that leaf position in the canopy was in a horizontal position (Figure 4b). For the crop planted in May 2016, the k value of KU50 (0.61) was smaller than CMR38-125-77 (0.94) and RY11 (0.93) (Figure 4c). However, for the crop planting in November 2016, the k value for KU50 (0.74) was higher than RY11 (0.65) and CMR38-125-77 (0.67) (Figure 4d).

3.4. Cumulative Solar Radiation Interception

The cumulative solar radiation interceptions were calculated from the amount of solar radiation in each crop growth stage and the percent intercepted over time. Genotypes were not significantly different for the total amount of solar radiation interceptions within planting date for all 4 planting dates, however, different growth stages within genotypes were significantly different (Table 1).
For the crop planted in May 2015, the cumulative solar radiation interceptions among genotypes were not significantly different in each crop growth stage. However, among the crop growth stages within genotypes, a significant difference for cumulative solar radiation interceptions were observed in all three genotypes. The highest cumulative solar radiation interceptions were observed during canopy development (4–6 MAP) for all three genotypes (1429–1474 MJ m−2).
For the crop planted in November 2015, genotypes were not significantly different for cumulative solar radiation interceptions in each crop growth stage. However, the cumulative solar radiation interceptions in each crop growth stage within genotypes were significantly different. All three genotypes showed the highest cumulative solar radiation interceptions during canopy development (4–6 MAP) (1448–1480 MJ m−2) and at the storage root accumulation stage (7–9 MAP) (1367–1537 MJ m−2).
For May 2016, the cumulative solar radiation interceptions were significantly different among genotypes in 0–3 MAP and 7–9 MAP growth stages, CMR38-125-77 had the highest cumulative solar radiation interceptions during 0–3 MAP (829 MJ m−2), and RY11 had the greatest value of cumulative solar radiation interception during 7–9 MAP (1292 MJ m−2). Significant differences were recorded among the growth stages for each genotype. The highest cumulative solar radiation interception was observed during 4–6 MAP for KU50 (1361 MJ m−2) and CMR38-125-77 (1412 MJ m−2). For RY11, the highest performance was recorded for both 4–6 and 7–9 MAP.
Table 1. Cumulative solar radiation interception (MJ m−2) of 3 cassava genotypes in different growth stages for May and November plants for 2 years.
Genotypes/Plant Age0–3 MAP4–6 MAP7–9 MAP10–12 MAPF-TestTotal
May-15
Kasetsart 50910b1454a846b913b**4121
Rayong 11927b1474a1105b1021b**4526
CMR38-125-77964b1429a938b1035b**4365
F-testns ns ns ns ns
Nov-15
Kasetsart 50646c1455a1367a1224b**4691
Rayong 11548c1480a1537a1247b**4811
CMR38-125-77667c1448a1430a1098b**4642
F-testns ns ns ns ns
May-16
Kasetsart 50674B c1361a1084B b972b**4091
Rayong 11633B c1361a1292A ab1160b**4445
CMR38-125-77829A c1412a992B cb1012b**4245
F-test* ns ** ns ns
Nov-16
Kasetsart 50404c1071b1345a1189B b**4008
Rayong 11433c1151b1429a1336A a**4347
CMR38-125-77476c1105b1348a1212B ab**4140
F-testns ns ns * ns
ns, *, ** = non-significant and significant at p < 0.05 and p < 0.01 probability levels, respectively. Means with the same capital letters in each column and small letters in each row are not significantly different by least significant difference (p < 0.05).
For the November 2016 planting, KU50 (1345 MJ m−2) and CMR38-125-77 (1348 MJ m−2) had the highest cumulative solar radiation interceptions during 7–9 MAP, whereas RY11 had the highest cumulative solar radiation interceptions for both 7–9 (1429 MJ m−2) and 10–12 MAP (1336 MJ m−2). However, during 10–12 MAP, RY11 had significantly greater cumulative solar radiation interceptions than those of KU50 and CMR38-125-77.

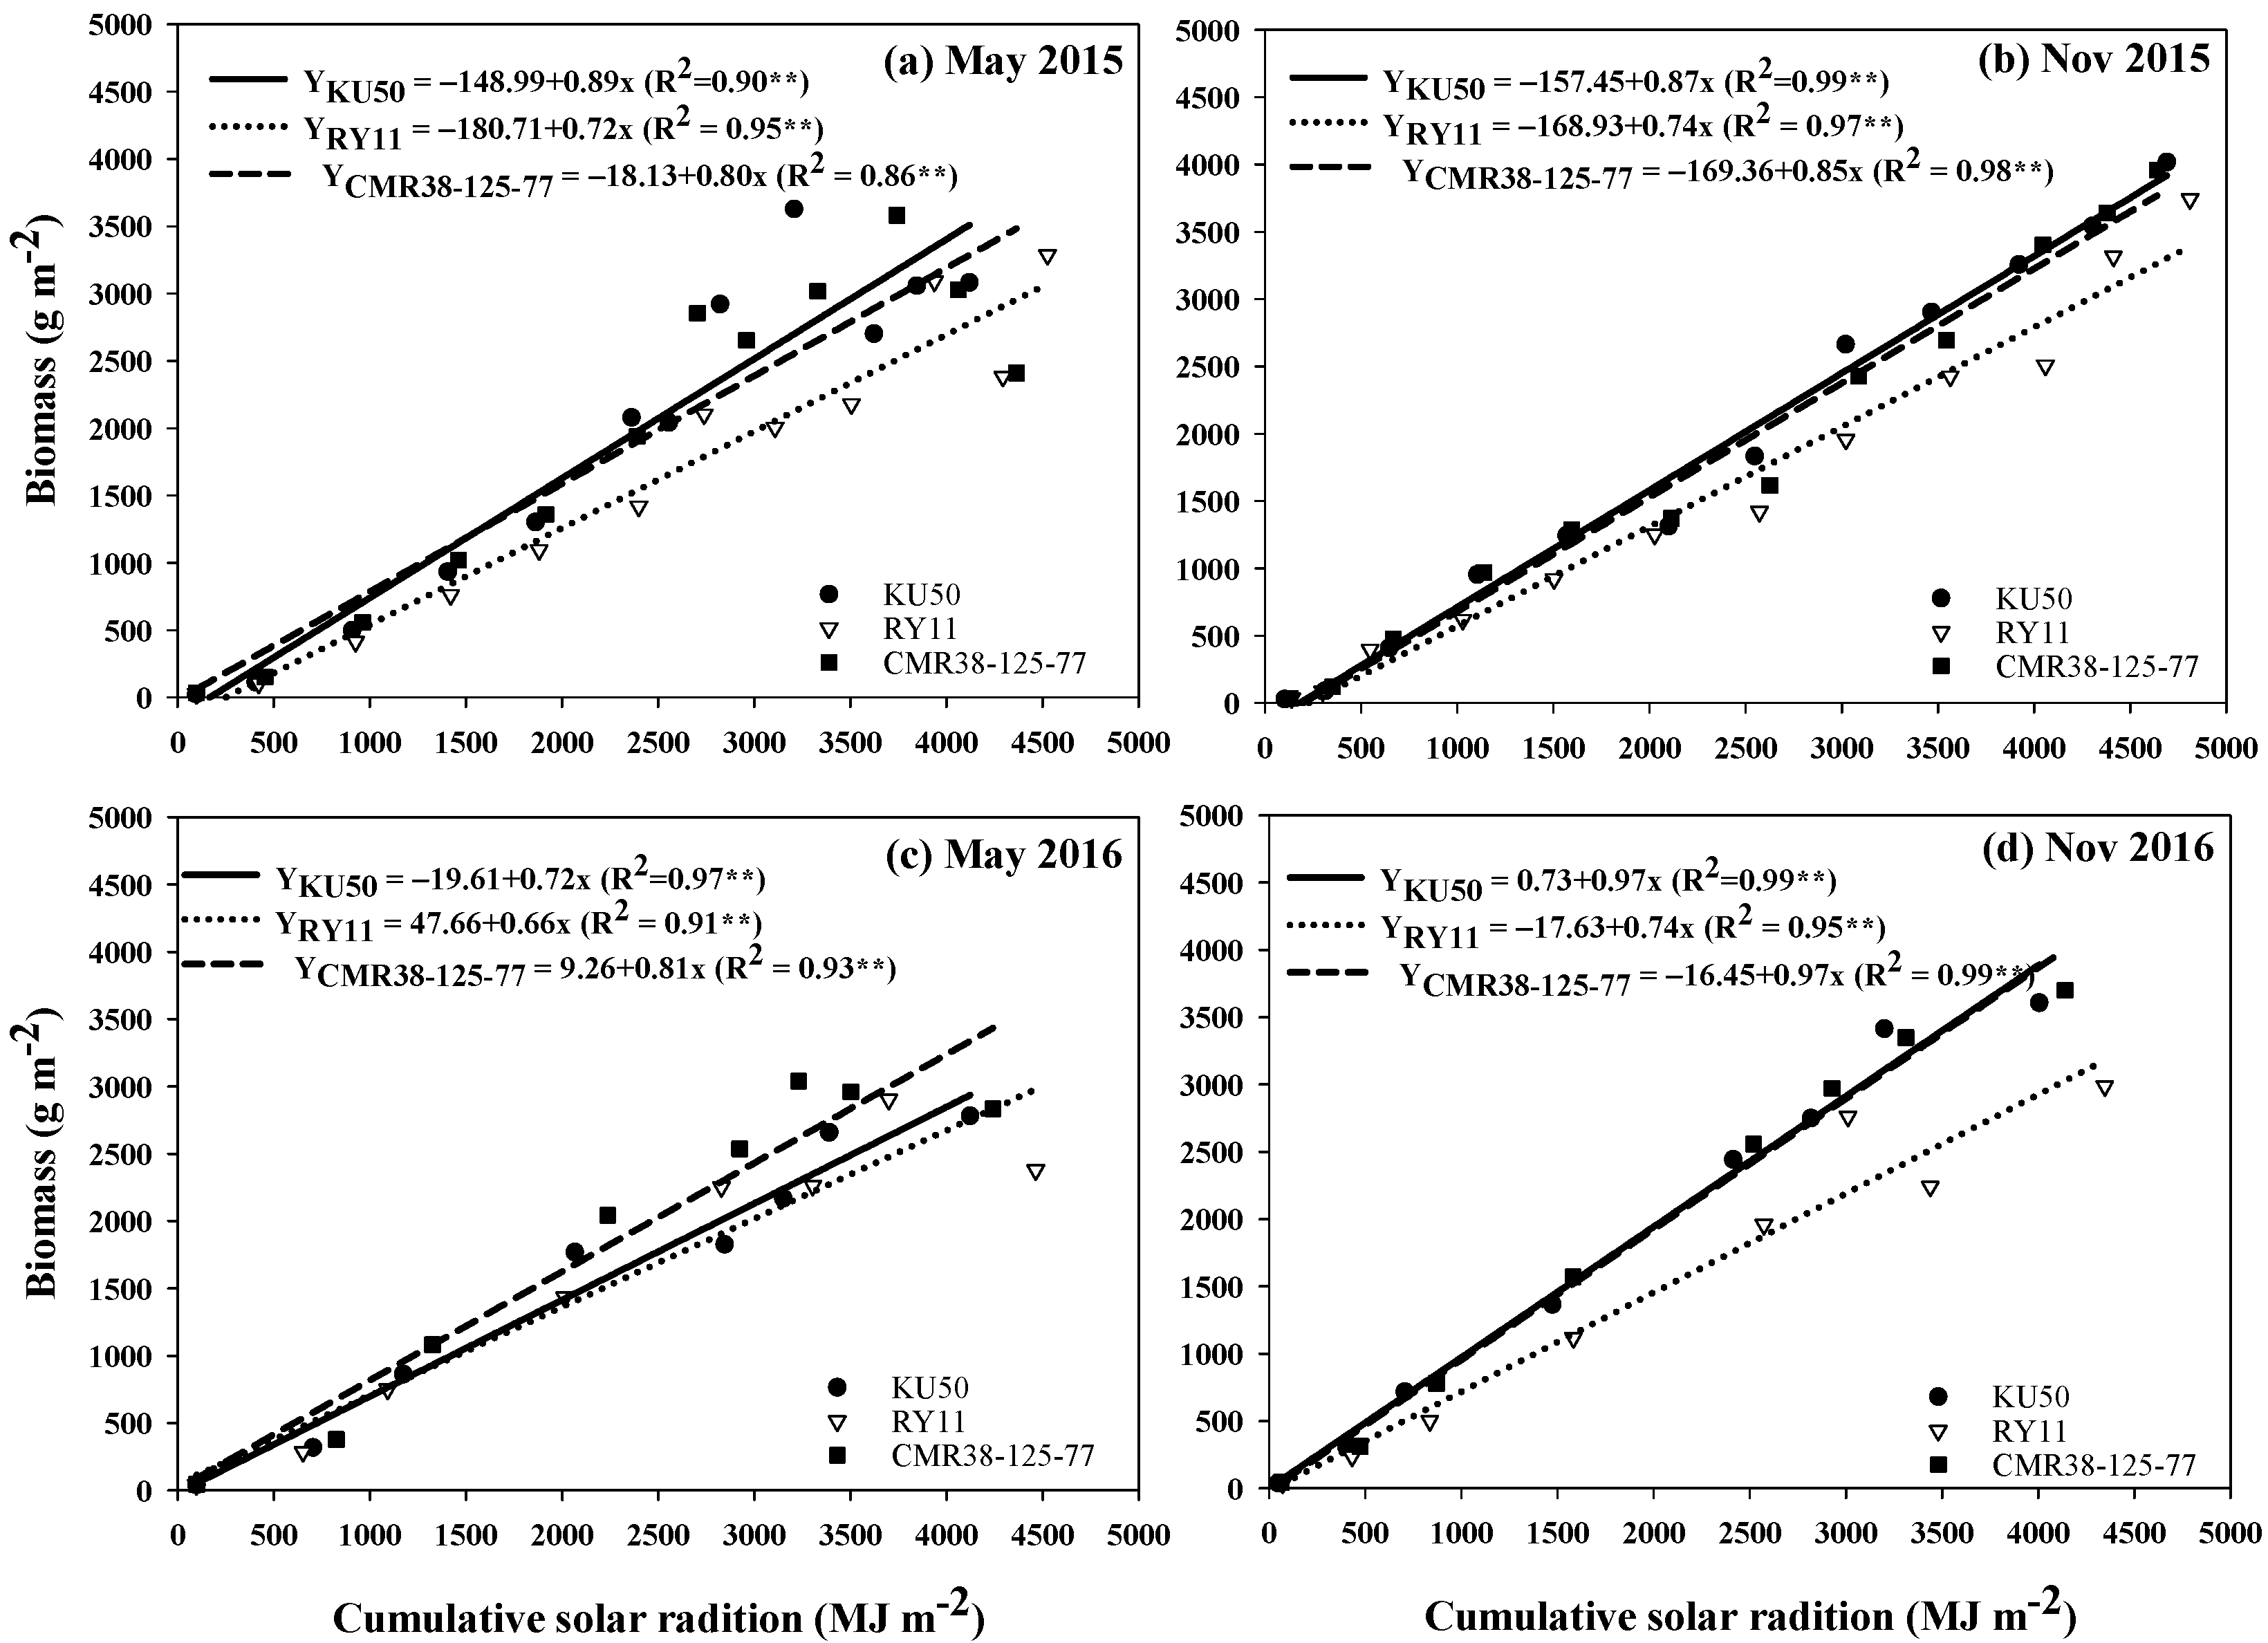
3.5. Biomass and Cumulative Solar Radiation

The linear regressions between biomass accumulation and cumulative solar radiation are presented in Figure 5. The slope of regression could be referred to as RUEbi for the cassava crops. Biomass accumulation increased with increasing cumulative solar radiation with a high determination coefficient (R2 = 0.86–0.99), indicating that the cumulative solar radiation could predict the total biomass of cassava with high precision. In May 2015, all three cassava genotypes had higher determination coefficients (R2 = 0.86–0.95) (Figure 5a). However, biomass accumulation of RY11 increased 0.72 g MJ−1, was lower than KU50 (0.98 g MJ−1) and CMR38-125-77 (0.80 g MJ−1), respectively. Likewise, in the November 2015 planting, KU50 (0.87 g MJ−1) and CMR38-125-77 (0.85 g MJ−1) had higher efficiency to convert solar radiation to biomass than RY11 (0.74 g MJ−1) (Figure 5b).
The patterns of regression for biomass and cumulative solar radiation in the year 2016 were similar to the year 2015 for both May and November plantings. In May 2016, the cassava genotypes were slightly different in RUEbi. CMR38-125-77 (0.81 g MJ−1) had higher performance in converting solar radiation to biomass than KU50 (0.72 g MJ−1) and RY11 (0.66 g MJ−1) (Figure 5c). However, in November 2016, KU50 (0.97 g MJ−1) and CMR38-125-77 (0.97 g MJ−1) were more efficient in converting solar radiation to biomass than RY11 (0.74 g MJ−1) (Figure 5d).
Figure 5. Regression analysis for biomass and cumulative solar radiation of 3 cassava genotypes planted in May and November 2015 (a,b) and 2016 (c,d). ** = significant at p < 0.01 probability levels.
Agronomy 12 02888 g005

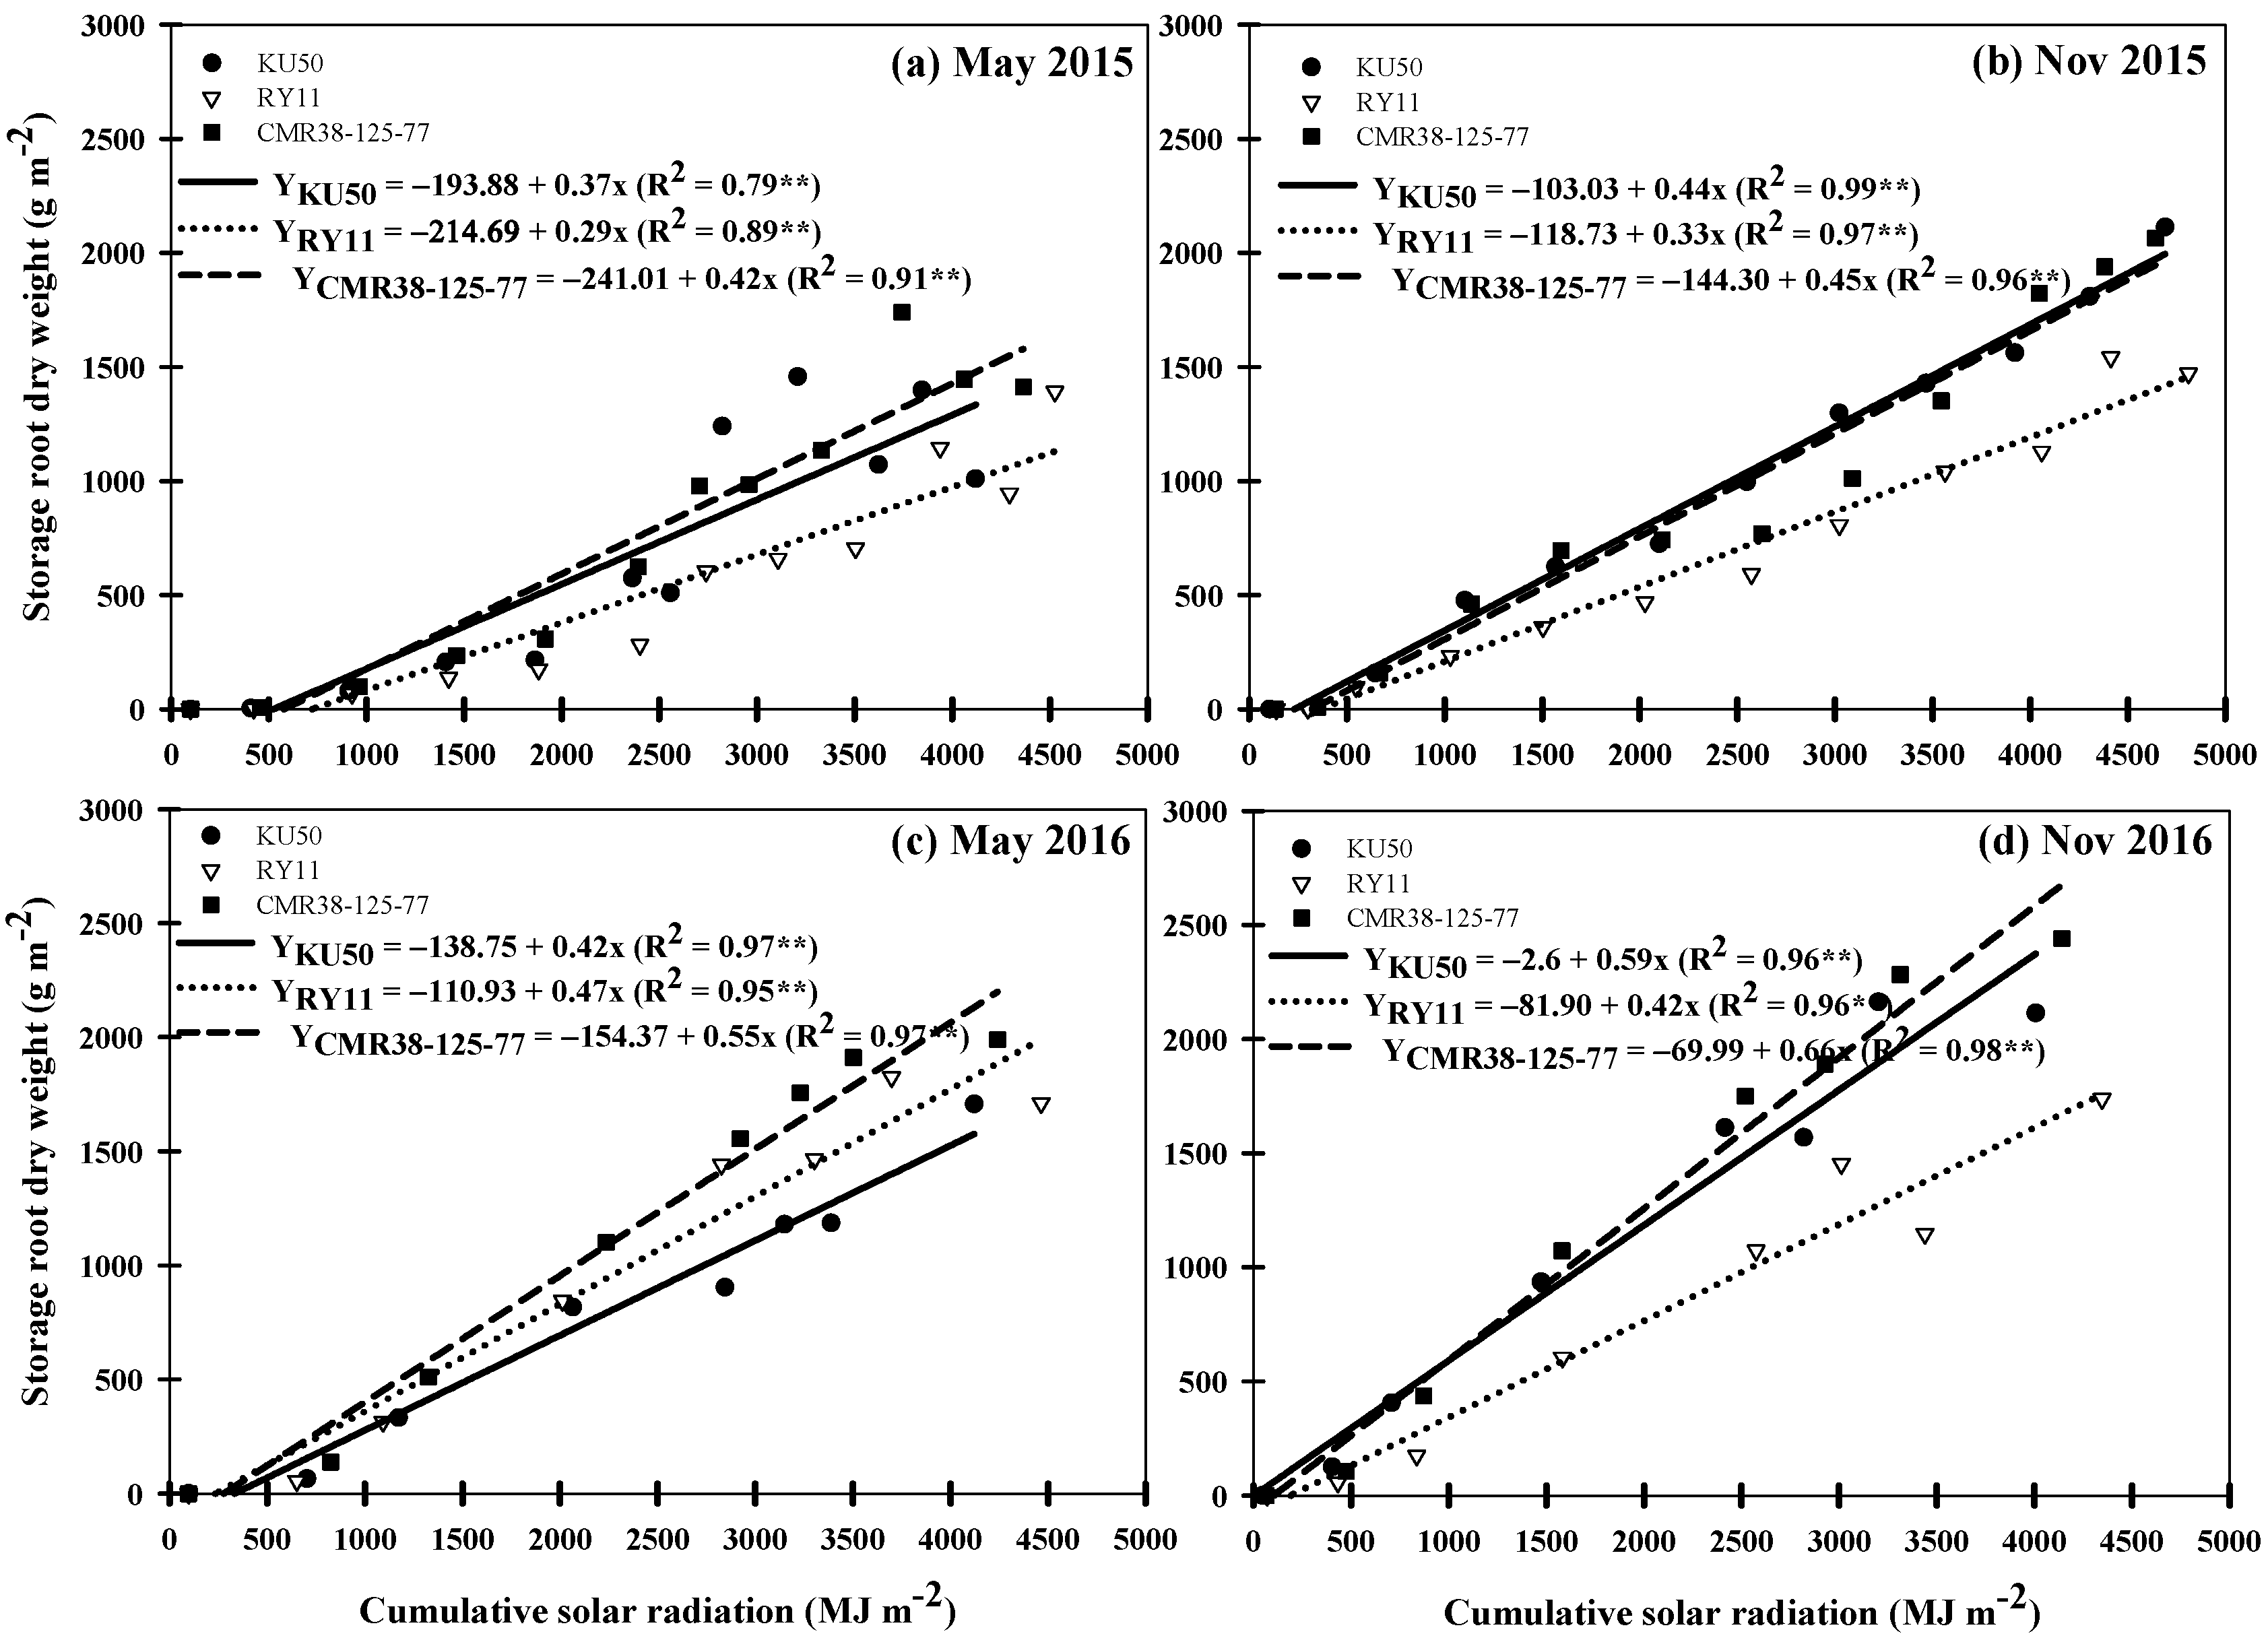
3.6. Storage Root Dry Weight and Cumulative Solar Radiation

In this study, the cumulative solar radiation was significantly (p < 0.01) and positively correlated with storage root accumulation for all three genotypes with high R2 values (0.79–0.99). The storage root dry weight increased with increasing cumulative solar radiation. The patterns of regression between cumulative solar radiation and storage root dry weight for all three genotypes were similar in most planting dates except for May 2016, when KU50 had a lower converting ability. For the crop planted in May 2015, CMR38-125-77 (0.42 g MJ−1) had a higher ability to convert solar radiation to storage root than KU50 (0.37 g MJ−1) and RY11 (0.29 g MJ−1) (Figure 6a). In November 2015 planting, both KU50 (0.45 g MJ−1) and CMR38-125-77 (0.44 g MJ−1) had a higher converting ability than RY11 (0.33 g MJ−1) (Figure 6b), whereas in May 2016, KU50 (0.42 g MJ−1) showed lower ability than those of CMR38-125-77 (0.55 g MJ−1) and RY11 (0.47 g MJ−1) (Figure 6c). However, in November 2016, CMR38-125-77 (0.66 g MJ−1) and KU50 (0.59 g MJ−1) showed higher converting ability than RY11 (0.42 g MJ−1) (Figure 6d).

3.7. Radiation Use Efficiency for Biomass (RUEbi)

For the crop planted in May 2015, RUEbi ranged from 0.44–1.31 g MJ−1 (Table 2). Among genotypes, the RUEbi was not significantly different in each crop growth stage, except for the canopy development stage (4–6 MAP) when KU50 (1.09 g MJ−1) and CMR38-125-77 (0.97 g MJ−1) had higher RUEbi than RY11 (0.68 g MJ−1). However, among the crop growth stages, only KU50 showed a significant difference for RUEbi. The highest RUEbi was 1.31 g MJ−1 at 7–9 MAP and 1.09 at 4–6 MAP.
In November 2015, a significant difference for RUEbi among genotypes was observed during 7–9 MAP. KU50 (1.17 g MJ−1) and CMR38-125-77 (0.93 g MJ−1) had higher RUEbi than RY11 (0.77 g MJ−1). Among crop growth stages, there were significant differences for RUEbi in each genotype. KU50 had the highest RUEbi at 7–9 MAP (1.17 g MJ−1), whereas RY11 (1.06 g MJ−1) and CMR38-125-77 (1.16 g MJ−1) had the highest RUEbi at 10–12 MAP.
The RUEbi among genotypes within growth stages were not significantly different for both May and November plantings in 2016. However, in May 2016, CMR38-125-77 showed a significant difference in RUEbi among crop growth stages. This genotype showed higher RUEbi 4–6 (1.16 g MJ−1) and 7–9 MAP (0.77 g MJ−1) than those in 0–3 and 10–12 MAP. Among the crop growth stages in November 2016 planted crops, there were significant differences for RUEbi for almost all genotypes, except for KU50. RY11 had the highest RUEbi during 7–9 MAP (1.16 g MJ−1), whereas CMR38-125-77 exhibited higher RUEbi at 4–6 (1.19 g MJ−1) and 7–9 MAP (1.05 g MJ−1).
Table 2. Radiation use efficiency (g MJ−1) for biomass of 3 cassava genotypes in different growth stages for May and November plants for 2 years.
Genotypes/Plant Age0–3 MAP4–6 MAP7–9 MAP10–12 MAPF-Test
May-15
Kasetsart 500.55bc1.09A ab1.31a0.44c*
Rayong 110.45 0.68B0.68 1.18 ns
CMR38-125-770.58 0.97A0.49 0.59 ns
F-testns * ns ns
Nov-15
Kasetsart 500.63c0.62c1.17A a0.92b**
Rayong 110.72b0.58b0.77B b1.06a**
CMR38-125-770.72c0.62c0.93AB b1.16a**
F-testns ns * ns
May-16
Kasetsart 500.49 0.95 0.48 0.85 ns
Rayong 110.47 0.74 0.70 0.37 ns
CMR38-125-770.46b1.16a0.77ab0.32b*
F-testns ns ns ns
Nov-16
Kasetsart 500.75 1.01 1.02 0.73 ns
Rayong 110.55bc0.77b1.16a0.28c**
CMR38-125-770.61b1.19a1.05a0.59b**
F-testns ns ns ns
ns, *, ** = non-significant and significant at p < 0.05 and p < 0.01 probability levels, respectively. Means with the same capital letters in each column and small letters in each row are not significantly different by least significant difference (p < 0.05).

3.8. Radiation Use Efficiency for Storage Root Dry Weight (RUEsr)

The RUEsr for each genotype and each crop growth stage are shown in Table 3. The RUEsr in this study ranged from 0.08–0.94 g MJ−1. For the crop planted in May 2015, there were significant differences among genotypes for RUEsr at 4–6 and 7–9 MAP. KU50 and CMR38-125-77 had higher RUEsr than RY11 at 4–6 MAP, whereas during 7–9 MAP, KU50 had the highest RUEsr (0.94 g MJ−1). However, the data showed significant differences in RUEsr among crop growth stages in each genotype. The highest RUEsr were found at 7–9 MAP for KU50 (0.94 g MJ−1) and CMR38-125-77 (0.56 g MJ−1), whereas RY11 had the highest RUEsr during 10–12 MAP (0.71 g MJ−1).
For the November 2015 planting, there were no significant differences among genotypes for almost all the crop growth stages except for 4–6 MAP. After this growth stage, KU50 (0.39 g MJ−1) and CMR38-125-77 (0.41 g MJ−1) had higher RUEsr than RY11 (0.25 g MJ−1). Comparisons for RUEsr among growth stages in each genotype showed significant differences. KU50 had higher RUEsr for almost all crop growth stages, except for during 0–3 MAP. RY11 showed the highest RUEsr at 7–9 and was also high at 10–12 MAP. CMR38-125-77 had the greatest RUEsr at 10–12 MAP (0.66 g MJ−1).
For the crop planted in May 2016, a significant difference among genotypes were found at 10–12 MAP, when KU50 had the highest RUEsr (0.55 g MJ−1). The RUEsr among crop growth stages were not significantly different for both RY11 and CMR38-125-77, however, KU50 showed the greatest performance in 4–6 (0.56 g MJ−1) and 10–12 MAP (0.55 g MJ−1). For the November 2016 planting, KU50 and CMR38-125-77 exhibited greater RUEsr than RY11 during 4–6 MAP. However, among the crop growth stages, the RUEsr were significantly different for RY11 and CMR38-125-77. The best performance for RUEsr was shown at 4–6 (0.47 g MJ−1) and 7–9 MAP (0.61 g MJ−1) for RY11, and 4–6 MAP for CMR38-125-77 (0.90 g MJ−1).
Table 3. Radiation use efficiency (g MJ−1) for storage root dry weight of 3 cassava genotypes in different growth stages for May and November plants for 2 years.
Genotypes/Plant Age0–3 MAP4–6 MAP7–9 MAP10–12 MAPF-Test
May-15
Kasetsart 500.09c0.34AB b0.94A a0.48b**
Rayong 110.08b0.15B b0.38B b0.71a*
CMR38-125-770.11c0.37A ab0.56B a0.27bc**
F-testns ** ** ns
Nov-15
Kasetsart 500.25b0.39A ab0.52a0.56a*
Rayong 110.18c0.25B bc0.38a0.35ab*
CMR38-125-770.24c0.41A bc0.43b0.66a**
F-testns * ns ns
May-16
Kasetsart 500.10c0.56a0.33b0.55A a*
Rayong 110.09 0.55 0.52 0.21Bns
CMR38-125-770.17 0.69 0.67 0.23Bns
F-testns ns ns *
Nov-16
Kasetsart 500.33 0.76A0.46 0.47 ns
Rayong 110.14b0.47B ab0.61a0.21b*
CMR38-125-770.22c0.90A a0.62b0.44bc**
F-testns * ns ns
ns, *, ** = non-significant and significant at p < 0.05 and p < 0.01 probability levels, respectively. Means with the same capital letters in each column and small letters in each row are not significantly different by least significant difference (p < 0.05).

4. Discussion

The plants with different canopy architectures led to differences in the area of intercepted light and affected the RUE. In this study, the crop planted in May (3–6 MAP) could reach maximum light interception earlier than the crop planted in November (5 and 7 MAP for 2015 and 2016, respectively). The different peaks for light interception due to variation of crop canopy varied by climatic factors during the crop growth stages. The crop planted in May grew rapidly in the early growth stages because they were subjected to high temperature, high relative humidity, and high solar radiation during the early growth stages, whereas, during early growth for the crop planted in November, the canopy establishment was slower caused mainly by low temperature, low humidity and low solar radiation [36]. The previous studies reported that high temperature and high solar radiation increased canopy size due to increasing new leaf emergence, leaf growth, and expansion, and increasing in LAI [37,38,39,40,41]. Canopy development of cassava planted in May grew faster than those of November plantings in the early growth stages resulting in greater light interception earlier than the crop planted in November. However, light interception for the crop planted in May declined slowly during the mid and late growth stages, which was mainly due to low temperature and low RH, resulting in the falling of old leaves and delaying the formation of new leaves, contributing to smaller canopy size and LAI [35,40]. Although in the May planting, the three genotypes were not significantly different for light interception during early growth stages, at the mid and late growth stages, RY11 had higher light interception than other genotypes. This might be because RY11 maintained a higher canopy size and LAI at the mid and late growth stages than KU50 and CMR38-125-77. However, for the crop planted in November, all three genotypes were not significantly different in light interception for all crop cycles, although RY11 tended to have a higher light interception than other genotypes during the late growth stage. Although light interception was correlated to LAI, the largest LAI does not result in the highest light interception in several crops [11,40].
In this study, the relationship between LAI and light interception could be explained by quadratic regressions, with a moderate to high degree of determination (R2 = 0.61–0.89), varying by genotypes, planting dates, and years. The light interception was increased when increasing LAI. KU50 and CMR38-125-77 planted in November had higher increases in light interception than the crop planted in May of both years. For RY11, the crop planted in May 2016 had a higher performance than other planting dates. Moreover, the maximum light interceptions appeared when LAI was 2.5–4.0 for most genotypes and planting dates, except for May 2015, when LAI was 5.0–6.0. The highest LAI occurred in May 2015 due to a larger canopy size because the crop was subjected to higher temperatures and higher solar radiation than the crop planted in May 2016 [36].
After reaching the peak, light interception declined for all genotypes and all planting dates, even though LAIs increased. In the 2015 May planting, increasing LAI more than 5.0–6.0 decreased light interception by 1.26–2.13%, and KU50 had a higher reduction of light interception than other genotypes. However, in May 2016, the light interception was reduced when LAI was higher than 3.5 for KU50 and CMR38-125-77, whereas in RY11, the light interception was reduced earlier, when LAI was 2.5. In November 2015, the crop’s light interception declined when LAI was higher than 4.0 for all three genotypes. However, in November 2016, the LAI of CMR38-125-77 could reach the maximum light interception earlier than other genotypes, when LAI was 2.5. After that, the ability to intercept light declined, having a higher reduction of light interception (13.05%) than KU50 (7.66%) and RY11 (6.45%). In terms of optimum LAI, the results agreed with other reports, which found that the optimum LAI was 3.0–3.5 [2,35,42]. Cassava intercepts about 90% of the total solar radiation when it reaches LAI of 3.0–4.0 [9,40]. However, the same LAIs may not provide the same light interception [9] due to leaf positioning, leaf curving, and leaf angle differences among genotypes.
The relationships between light transmission (ln I/Io) and LAI were explained by the k value, which is referred to as the leaf angle of plants [26]. In this study, k values ranged from 0.59–0.94, varying with genotype and planting date. Likewise, other reports revealed that k values in cassava generally fall between 0.60 and 0.88 when full canopy cover has been reached [39,40,42]. A report by Pellet and El-Sharkawy [9] showed k values ranging from 0.50–0.78 depending on varieties and fertilizer applications. CM 523-7 and M Col 1684 cassava genotypes exhibited increased k values when fertilized. In the present study, the crops planted in May 2015 for all genotypes had lower k values than those the crops planted in November 2015, whereas in the year 2016, the crops planted in May had higher k values than those planted in November, except for KU50. Furthermore, the k values were more than 0.5, indicating that the leaf position for all three genotypes in this study displayed a horizontal position. According to Boote and Loomis [43], large leaf size and horizontal leaf position could receive higher solar radiation than small leaves in a vertical position. The smaller k values in the May plantings might result in lower light interception than in the November plantings and may contribute to lower biomass and yield. However, the variation in k values was not consistent but depended on genotype and seasonal variations [44]. A study by O’Connell et al. [45] reported that the effects of seasonal conditions were minimal on the k values and RUE for wheat and pea. However, both wheat and pea are short-cycle crops, whereas cassava has a long-life cycle and is subjected to various seasons throughout the year. Additionally, cassava leaves adjust petioles and leaf blades to track or avoid solar radiation [46]. The seasonal variation might affect the k values, and the responses of cassava with different canopy structures are different.
In this study, RY11 had higher light interception than KU50 and CMR38-125-77; however, the penetration into the lower part of the canopy was lower than other genotypes [47]. This is presumably due to RY11 being an early forking type, starting about 57 days after planting, and the forking levels at least two times more than the other genotypes [48]. Although forking produced more apexes and more leaves, leaf size after forking is smaller, with shorter petioles than the leaves on the main stem [33]. Moreover, RY11 had a shorter internode length than the other genotypes, resulting in a dense canopy and contributing to lower light penetration. Even though both KU50 and CMR38-125-77 were forking types similar to RY11, their first forking occurred later than RY11 [48]. As a result of forking behavior, the light penetrated the lower parts of the canopy, contributing to all leaves in the canopy having more to intercept light and greater photosynthetic capacity in KU50 and CMR38-125-77.
Due to variations in canopy structure, LAI and k in different planting dates affected the ability to intercept light and contributed to cumulative solar radiation interception. Several reports revealed that cumulative solar radiation interception was positive and highly correlated to biomass production and crop yields, which is referred to as RUE. The RUEbi in this study ranged from 0.66 to 0.97 g MJ−1, and RUEsr was from 0.37 to 0.66 g MJ−1. A previous study reported that RUEbi was 1.15–2.30 g MJ−1 [9] and RUEsr was 0.69–0.94 g MJ−1 and varied by genotype [41,49]. For crops planted in May for both 2015 and 2016, the RUEbi and RUEsr for the total crop cycle in all three genotypes were not significantly different, although RY11 tended to be lower than the other genotypes. However, for the November plantings for both years, KU50 and CMR38-125-77 had higher RUEbi and RUEsr than those of RY11. For the crop planted in May 2015, KU50 and CMR38-125-77 had higher RUEbi than RY11 during the canopy development stage (4–6 MAP) with significant differences.
Mahakosee et al. [47] reported that crops planted in May had lower biomass and yield than November plantings for most genotypes except RY11. Although in the early growth stage, the crop planted in May had a larger canopy size and reached light interception earlier than the crop planted in November. In contrast, the crop planted in November could maintain canopy size and light interception during the mid to late growth stages, and the greatest cumulative solar radiation interception started from canopy development and continued to the storage root accumulation stage. This provided for higher biomass and yield in the November planting. For the May planting, three cassava genotypes were not significantly different for biomass and yields, whereas the November planting, KU50, and CMR38-125-77 had higher biomass and yields than RY11, even though the LAIs, light interception, and cumulative solar radiation interception for all three genotypes were similar. Due to the denser canopy, less light was available for lower canopy leaves of RY11, resulting in low leaf photosynthesis capacity.

5. Conclusions

Cassava genotypes with different canopy structures differed in light interception capacity and RUE. The cumulative solar radiation interception was significantly different among crop growth stages. For the May planting, the highest radiation interception occurred during 4–6 MAP, whereas, when planted in November, the crop canopy intercepted more solar radiation during 4–6 and 7–9 MAP. The RUEbi varied by genotype and planting date and ranged from 0.66 (RY11, May 2016) to 0.97 (KU50 and CMR38-125-77, November 2016). However, the RUEsr ranged from 0.29 (RY11) to 0.66 (CMR38-125-77). The RUEbi and RUEsr in each genotype on each planting date were significantly different. The highest RUEbi and RUEsr were found at 4–6 and 7–9 MAP for almost all genotypes and planting dates, except for the crop planted in November 2015, when both RY11 and CMR38-125-77 had the highest RUEbi at 10–12 MAP. KU50 and CMR38-125-77 could maintain canopy light interception during canopy development and storage root accumulation stages and had high RUEbi and RUEsr, resulting in high biomass and crop yield. Our study suggests that the selection of appropriate cassava canopy during canopy development and storage root accumulation stages with a high light interception and RUE could be used as a criterion for selecting genotypes in breeding programs.

Author Contributions

Conceptualization, S.J., P.B., P.T., B.T., C.C.H., C.K.K. and N.V.; methodology, S.J. and N.V.; formal analysis, S.M.; investigation, S.M.; resources, P.B.; data curation, S.M.; writing—original draft preparation, S.M.; writing—review and editing, S.M., S.J., P.T., B.T., C.C.H., C.K.K. and P.B.; supervision, S.J. and P.B. All authors have read and agreed to the published version of the manuscript.

Funding

This project was financially supported by the Thai Royal Golden Jubilee Ph.D. Program (grant no. PHD/0031/2559) and the National Science and Technology Development Agency (NSTDA) Thailand.

Institutional Review Board Statement

Not applicable.

Data Availability Statement

Not applicable.

Acknowledgments

Acknowledgement is extended to the Peanut, Jerusalem Artichoke, and Cassava improvement Research Group, Khon Kaen University, Thailand.

Conflicts of Interest

The authors declare no conflict of interest.

References

  1. Falade, K.O.; Akingbala, J.O. Utilization of cassava for food. Food Rev. Int. 2010, 27, 51–83. [Google Scholar] [CrossRef]
  2. El-Sharkawy, M.A. Cassava biology and physiology. Plant Mol. Biol. 2004, 56, 481–501. [Google Scholar] [CrossRef] [PubMed]
  3. Malik, A.I.; Kongsil, P.; Nguyễn, V.A.; Ou, W.; Sholihin-Srean, P.; Sheela, M.N.; López-Lavalle, L.A.B.; Utsumi, Y.; Lu, C.; Kittipadakul, P.; et al. Cassava breeding and agronomy in Asia: 50 years of history and future directions. Breed. Sci. 2020, 70, 145–166. [Google Scholar] [CrossRef] [PubMed] [Green Version]
  4. Office of Agricultural Economics. Agricultural Production Index. Available online: http://www.oae.go.th/view/1/Home/EN-US (accessed on 23 January 2019).
  5. De Vries, C.A.; Ferwerda, J.D.; Flach, M. Choice of food crop in relation to actual and potential production in the tropics. Neth. J. Agric. Sci. 1967, 19, 241–248. [Google Scholar] [CrossRef]
  6. El-Sharkawy, M.A. Drought-tolerant cassava for Africa, Asia, and Latin-America. BioScience 1993, 43, 441–451. [Google Scholar] [CrossRef]
  7. Phoncharoen, P.; Banterng, P.; Vorasoot, N.; Jogloy, S.; Theerakulpisut, P.; Hoogenboom, G. Growth rates and yields of cassava at different planting dates in a tropical savanna climate. Sci. Agric. 2019, 76, 376–388. [Google Scholar] [CrossRef] [Green Version]
  8. Monteith, J.L. Validity of the correlation between intercepted radiation and biomass. Agric. For. Meteorol. 1994, 68, 213–220. [Google Scholar] [CrossRef]
  9. Pellet, D.; El-Sharkawy, M.A. Cassava varietal response to fertilization: Growth dynamic and implications for cropping sustainability. Exp. Agric. 1997, 33, 353–365. [Google Scholar] [CrossRef]
  10. Gonias, E.D.; Oosterhuis, D.M.; Bibi, A.C.; Roberts, B.A. Radiation use efficiency of cotton in contrasting environments. Am. J. Plant Sci. 2012, 3, 649–654. [Google Scholar] [CrossRef] [Green Version]
  11. Raghuveera Rao, P.; Sailaja, B.; Desiraju, S.; Nageswara Rao, D.; Voleti, S.R.; Satyanarayana Reddy, P.; Sudarsana Rao, G.V. Variable radiation use efficiency in rice cultures grown at different locations. Indian J. Plant Physiol. 2012, 17, 57–60. [Google Scholar]
  12. Liu, X.; Rahman, T.; Yang, F.; Song, C.; Yong, T.; Liu, J.; Zhang, C.; Yang, W. PAR interception and utilization in different maize and soybean intercropping patterns. PLoS ONE 2017, 12, e0169218. [Google Scholar] [CrossRef]
  13. Monteith, J.L.; Moss, C.J. Climate and the efficiency of crop production in Britain. Philos. Trans. R. Soc. 1977, 281, 277–294. [Google Scholar] [CrossRef]
  14. Long, S.P.; Zhu, X.G.; Naidu, S.L.; Ort, D.R. Can improvement in photosynthesis increase crop yields? Plant Cell Environ. 2006, 29, 315–330. [Google Scholar] [CrossRef]
  15. Niinemets, U. Photosynthesis and resource distribution through plant canopies. Plant Cell Environ. 2007, 30, 1052–1071. [Google Scholar] [CrossRef]
  16. Reynolds, M.; Bonnett, D.; Chapman, S.C.; Furbank, R.T.; Manes, Y.; Mather, D.E.; Parry, M.A. Raising yield potential of wheat. I. Overview of a consortium approach and breeding strategies. J. Exp. Bot. 2011, 62, 439–452. [Google Scholar] [CrossRef] [Green Version]
  17. Wolf, D.D.; Carson, E.; Brown, R.H. Light interception efficiency measurements. J. Agron. Educ. 1972, 1, 40–42. [Google Scholar] [CrossRef]
  18. Vos, J.; Evers, J.B.; Buck-Sorlin, G.H.; Andrieu, B.; Chelle, M.; de Visser, P.H.B. Functional–structural plant modelling: A new versatile tool in crop science. J. Exp. Bot. 2010, 61, 2101–2115. [Google Scholar] [CrossRef]
  19. Tumuhimbise, R.; Melis, R.; Shanahan, P.; Kawuki, R. Genotype × environment interaction effects on early fresh storage root yield and related traits in cassava. Crop J. 2014, 2, 329–337. [Google Scholar] [CrossRef] [Green Version]
  20. Lahai, T.; Ekanayake, I.J.; Koroma, J.P.C. Influence of canopy structure on yield of cassava cultivars at various toposequences of an inland valley agro ecosystem. J. Agric. Biotechnol. Sustain. Dev. 2013, 5, 36–47. [Google Scholar] [CrossRef] [Green Version]
  21. Werner, C.; Ryel, R.J.; Correia, O.; Beyschlag, W. Structural and functional variability within the canopy and its relevance for carbon gain and stress avoidance. Acta Oecologica 2001, 22, 129–138. [Google Scholar] [CrossRef]
  22. Zhang, Z.; Zhou, X.B.; Chen, Y.H. Effects of irrigation and precision planting patterns on photosynthetic product of wheat. Agron. J. 2016, 108, 2322–2328. [Google Scholar] [CrossRef]
  23. De Souza, A.P.; Massenburg, L.N.; Jaiswal, D.; Cheng, S.; Shekar, R.; Long, S.P. Rooting for cassava: Insights into photosynthesis and associated physiology as a route to improve yield potential. New Phytol. 2016, 213, 50–65. [Google Scholar] [CrossRef] [PubMed]
  24. Hughes, G.; Keatinge, J.D.H.; Cooper, P.J.M.; Dee, N.F. Solar radiation interception and utilization by chickpea (Cicer arietinum L.) crops in northern Syria. J. Agric. Sci. 1987, 108, 419–424. [Google Scholar] [CrossRef]
  25. Hunter, R.B. Increased leaf area (source) and yield of maize in short-season areas. Crop Sci. 1980, 20, 571–574. [Google Scholar] [CrossRef]
  26. Monsi, M.; Saeki, T. On the factor light in plant communities and its importance for matter production. Ann. Bot. 2005, 95, 549–567. [Google Scholar] [CrossRef] [Green Version]
  27. Howeler, R.H. Cassava mineral nutrition and fertilization. In Cassava: Biology, Production and Utilization; Hillocks, R.J., Thresh, J.M., Bellotti, A.C., Eds.; CABI Publishing: New York, NY, USA, 2002; pp. 115–147. [Google Scholar]
  28. Monteith, J.L. Solar radiation and productivity in tropical ecosystems. J. Appl. Ecol. 1972, 9, 747–766. [Google Scholar] [CrossRef] [Green Version]
  29. LI-COR Inc. LAI-2000 Plant Canopy Analyzer Instruction/Operating Manual; LI-COR Inc.: Lincoln, NE, USA, 1992. [Google Scholar]
  30. LI-COR Inc. LI-191SA Line Quantum Sensor Brochure; LI-COR Inc.: Lincoln, NE, USA, 2015. [Google Scholar]
  31. Cooper, J.P. Photosynthetic efficiency of the whole plant. In Food Production and Consumption: The Efficiency of Human Food Chains and Nutrient Cycles; Duckham, A.N., Jones, J.G.W., Roberts, E.H., Eds.; North-Holland Publishing Company: Amsterdam, The Netherlands, 1976; pp. 107–126. [Google Scholar]
  32. Hay, R.; Walker, A. An Introduction to the Physiology of Crop Yield; Longmans: London, UK, 1989; p. 292. [Google Scholar]
  33. Alves, A.A.C. Cassava botany and physiology. In Cassava: Biology, Production and Utilization; Hillocks, R.J., Thresh, J.M., Bellotti, A.C., Eds.; CABI Publishing: New York, NY, USA, 2002; pp. 67–89. [Google Scholar]
  34. Statistix, Version 10; Analytical Software: Tallahassee, FL, USA, 2013.
  35. Gomez, K.A.; Gomez, A.A. Statistical Procedures for Agricultural Research; John Wiley & Sons: New York, NY, USA, 1984; pp. 1–628. [Google Scholar]
  36. Mahakosee, S.; Jogloy, S.; Vorasoot, N.; Theerakulpisut, P.; Banterng, P.; Kesmala, T.; Holbrook, C.C.; Kvien, C. Seasonal variations in canopy size and yield of Rayong 9 cassava genotype under rainfed and irrigated conditions. Agronomy 2019, 9, 362. [Google Scholar] [CrossRef] [Green Version]
  37. Irikura, V.; Cock, J.H.; Kawano, K. The physiological basis of genotype-temperature interactions in cassava. Field Crops Res. 1979, 2, 227–239. [Google Scholar] [CrossRef]
  38. Keating, B.A.; Evenson, J.P.; Fukai, S. Environmental effects on growth and developments of cassava (Manihot esculenta Crantz.). I. Crop development. Field Crops Res. 1982, 5, 271–281. [Google Scholar] [CrossRef]
  39. Fukai, S.; Alcoy, A.B.; Llamelo, A.B.; Patterson, R.D. Effects of solar radiation on growth of cassava (Manihot esculenta Crantz.). I. Canopy development and dry matter growth. Field Crops Res. 1984, 9, 347–360. [Google Scholar] [CrossRef]
  40. Veltkamp, H.J. Physiological Causes of Yield Variation in Cassava (Manihot Esculenta Crantz). Ph.D. Thesis, University of Wageningen, Wageningen, The Netherlands, 1985; p. 132. [Google Scholar]
  41. El-Sharkawy, M.A.; De Tafur, S.M.; Cadavid, L.F. Potential photosynthesis of cassava as affected by growth conditions. Crop Sci. 1992, 32, 1336–1342. [Google Scholar] [CrossRef]
  42. Cock, J.H.; Franklin, D.; Sandoval, G.; Juri, P. The ideal cassava plant for maximum yield. Crop Sci. 1979, 19, 271–279. [Google Scholar] [CrossRef]
  43. Boote, K.J.; Loomis, R.S. (Eds.) The prediction of canopy assimilation. In Modeling Crop Photosynthesis—From Biochemistry to Canopy; No. 19; CSSA: Fitchburg, WI, USA, 1991; pp. 109–137. [Google Scholar]
  44. Pradhan, S.; Sehgal, V.K.; Bandyopadhyay, K.K.; Panigrahi, P.; Parihar, C.M.; Jat, S.L. Radiation interception, extinction coefficient and use efficiency of wheat crop at various irrigation and nitrogen levels in a semi-arid location. Indian J. Plant Physiol. 2018, 23, 416–425. [Google Scholar] [CrossRef] [Green Version]
  45. O’Connell, M.G.; O’Leary, G.J.; Whitfield, D.M.; Connor, D.J. Interception of photosynthetically active radiation and radiation-use efficiency of wheat, field pea and mustard in a semi-arid environment. Field Crops Res. 2004, 85, 111–124. [Google Scholar] [CrossRef]
  46. El-Sharkawy, M.A.; Cock, J.H. Water use efficiency of cassava. I. Effects of air humidity and water stress on stomatal conductance and gas exchange. Crop Sci. 1984, 24, 497–502. [Google Scholar] [CrossRef]
  47. Mahakosee, S.; Jogloy, S.; Vorasoot, N.; Theerakulpisut, P.; Banterng, P.; Holbrook, C.C.; Kvien, C. Seasonal variation in canopy size, light penetration and photosynthesis of three cassava genotypes with different canopy architectures. Agronomy 2020, 10, 1554. [Google Scholar] [CrossRef]
  48. Phoncharoen, P.; Banterng, P.; Vorasoot, N.; Jogloy, S.; Theerakulpisut, P.; Hoogenboom, G. The impact of seasonal environments in a tropical savanna climate on forking, leaf area index, and biomass of cassava genotypes. Agronomy 2019, 9, 19. [Google Scholar] [CrossRef] [Green Version]
  49. El-Sharkawy, M.A.; Cadavid, L.F. Response of cassava to prolonged water stress imposed at different stages of growth. Exp. Agric. 2002, 38, 333–350. [Google Scholar] [CrossRef]
Figure 1. Solar radiation (MJ m−2) in each month during the crop cycle in (a) May and (b) November in 2015 and 2016.
Agronomy 12 02888 g001
Figure 4. Regression analysis for ln(I/Io) and LAI of 3 cassava genotypes planted in May and November 2015 (a,b) and 2016 (c,d). ** = significant at p < 0.01 probability levels.
Agronomy 12 02888 g004
Figure 6. Regression analysis for storage root dry weight and cumulative solar radiation of 3 cassava genotypes planted in May and November 2015 (a,b) and 2016 (c,d). ** = significant at p < 0.01 probability levels.
Agronomy 12 02888 g006
Publisher’s Note: MDPI stays neutral with regard to jurisdictional claims in published maps and institutional affiliations.

