Article

Effects of Different Deproteinization Methods on the Antioxidant Activity of Polysaccharides from Flos Sophorae Immaturus Obtained by Ultrasonic Microwave Synergistic Extraction

1
College of Pharmacy and Food Science, Zhuhai College of Science and Technology, Zhuhai 519041, China
2
College of Life Science, Jilin University, Changchun 130012, China
*
Author to whom correspondence should be addressed.
These authors contributed equally to this work.
Agronomy 2022, 12(11), 2740; https://doi.org/10.3390/agronomy12112740
Submission received: 10 October 2022 / Revised: 27 October 2022 / Accepted: 31 October 2022 / Published: 4 November 2022

Abstract

:
Flos Sophorae Immaturus (FSI) serves as one of the Chinese medicinal herbs of homologous provenance, whose polysaccharides constitute part of the active compounds that exert their pharmacological properties. Single-factor and response surface methodology were employed to investigate optimal extraction conditions for the ultrasonic-microwave synergistic extraction (UMSE) of polysaccharides from FSI (PFSI), which were deproteinized by Sevage, papain, and trichloroacetic acid methods, and the antioxidant potential of PFSI by contrasting deproteinization methods based on free-radical scavenging capacity. The optimum conditions for UMSE extraction of PFSI were 500 W microwave power, 265.887 W ultrasonic power, 20.078 min extraction time, and 94.995:1 liquid-to-material ratio. Meanwhile, the sequence of the single factors on the yield of polysaccharides indicated that microwave power > extraction time > D liquid to material ratio > B ultrasonic power, and that the obtained average value of polysaccharide yield was 37.05%, which was analogous to the predicted value of 37.17%, indicating that the optimization method was reasonable. In vitro, the antioxidant assay demonstrated that PFSI, with or without deproteinization, had a definite capability to scavenge oxidative free radicals. This research provides a theoretical basis for the industrial production of PFSI as a natural antioxidant, and a scientific basis for its industrial development.

1. Introduction

The international academic community has spoken of the 21st century as the ‘century of polysaccharides’. Scientifically experimental studies have proved that many plant polysaccharides have biological activities, including immunomodulation, anti-tumor, hypoglycemia, hypolipidaemia, anti-radiation, anti-bacterial, anti-viral, liver protection, etc. [1,2,3]. This is why plant polysaccharides have long been used widely in the fields of medicine, catering, and everyday life. They are compounds composed of many identical or different monosaccharides with α or β glycosidic bonds and are universally found in plants, including starch, cellulose, polysaccharides, and pectin [4]. The traditional extraction methods are based on solvent extraction and acid-base extraction, but the yield of traditional extraction methods remains low and they can destroy the structure of the active ingredients, which is why the search for a green, low-cost, and high-yield extraction method is an important way to industrialize polysaccharides [5,6,7]. The prevalent extraction methods for plant polysaccharides are primarily divided into traditional and emerging extraction methods. The ultrasonic-microwave synergistic extraction (UMSE) method [8,9,10] has been developed as a new technology relying on ultrasonic-assisted and microwave-assisted methods. These have the characteristics of short extraction time, speed, and high efficiency.
Flos Sophorae Immaturus (FSI) generally refers to the dried buds and flowers of Sophora japonica L. It is ovate or elliptical in shape, with yellowish-white unopened petals in the upper part of the calyx and several longitudinal stripes on the underside of the calyx. In Chinese medicine, the flowers of Sophora japonica frequently feature in the same way as the buds, with FSI being the buds harvested in summer when the flowers are still open, and Sophora japonica L. being the buds harvested when the flowers are blooming. First, it is applied to blood in the stool, hemorrhoids, bloody dysentery, collapse, vomiting, epistaxis, liver fever, dizziness, and headache [11,12]. Past studies have suggested that the main components of FSI include flavonoids [13], saponins [14], fatty acids [15], polysaccharides [16], volatile components [17], and other ingredients whose active ingredients have been proven to have definite pharmacological functions [18]. Polysaccharides contribute to the pharmacological effects of FSI, such as hypoglycemia and hypotension, antioxidant and anti-aging, antibacterial and antimicrobial, anti-tumor, and other pharmacological agents. At present, the extraction methods of FSI polysaccharides (PFSI) focus on the hot leaching method, hot water reflux extraction method, ultrasonic extraction method, and complex enzyme extraction method [16]. However, due to the shortcomings of PFSI extraction by traditional extraction methods, such as hot water leaching and ultrasonic extraction, the efficiency of PFSI extraction has been inefficient, with long extraction times and the destruction of active ingredients.
The widely recognized free radical theory of ageing (FRTA) proposes that the accumulation of oxidative damage triggered by reactive oxygen species (ROS) occurs as a principal consequence of aging [19,20,21]. According to this theory, oxygen-derived free radicals indirectly cause age-related impairments through oxidative damage to biomolecules, with mitochondria being the prime subject of free radical assaults. Recently, during the current campaign to identify new natural antioxidants, various polysaccharides obtained from plants, algae, and microorganisms have been documented to exhibit potent antioxidant properties and promising applications as antioxidants of choice [22,23,24,25,26]. Therefore, protection of that system provided through dietary antioxidant supplementation probably features an appreciable amount in the attainment of healthy aging [27]. It has been shown that the separation and purification of polysaccharides can increase their bioactivity to some extent [28,29,30,31]. Hence, in this study, different deproteinization methods of PFSI were isolated and purified separately to screen the process for the best deproteinization method using antioxidant activity (free radical scavenging capacity) as an indicator. The purpose is to establish a theoretical basis for the industrial production of PFSI in such a way as to qualify as an antioxidant in the future.

2. Materials and Methods

2.1. Materials

FSI harvested in August 2021 was authenticated by Zhang Runrong, senior engineer of traditional Chinese medicine, College of Pharmacy and Food Science, Zhuhai College of Science and Technology, Zhuhai, Guangdong Province, China (Production batch: 20210820; Shandong Bozhou R&B Food Sales Co.; Shandong, China); papain (800 U/mg) and Vitamin C (VC) (Shanghai Yuanye Biotechnology Co., Ltd.; Shanghai, China); phenol, sulphuric acid, anhydrous ethanol, trichloromethane, trichloroacetic acid (TCA), and n-butanol (AR, Sinopharm Chemical Reagent Co., Ltd., Shanghai, China).

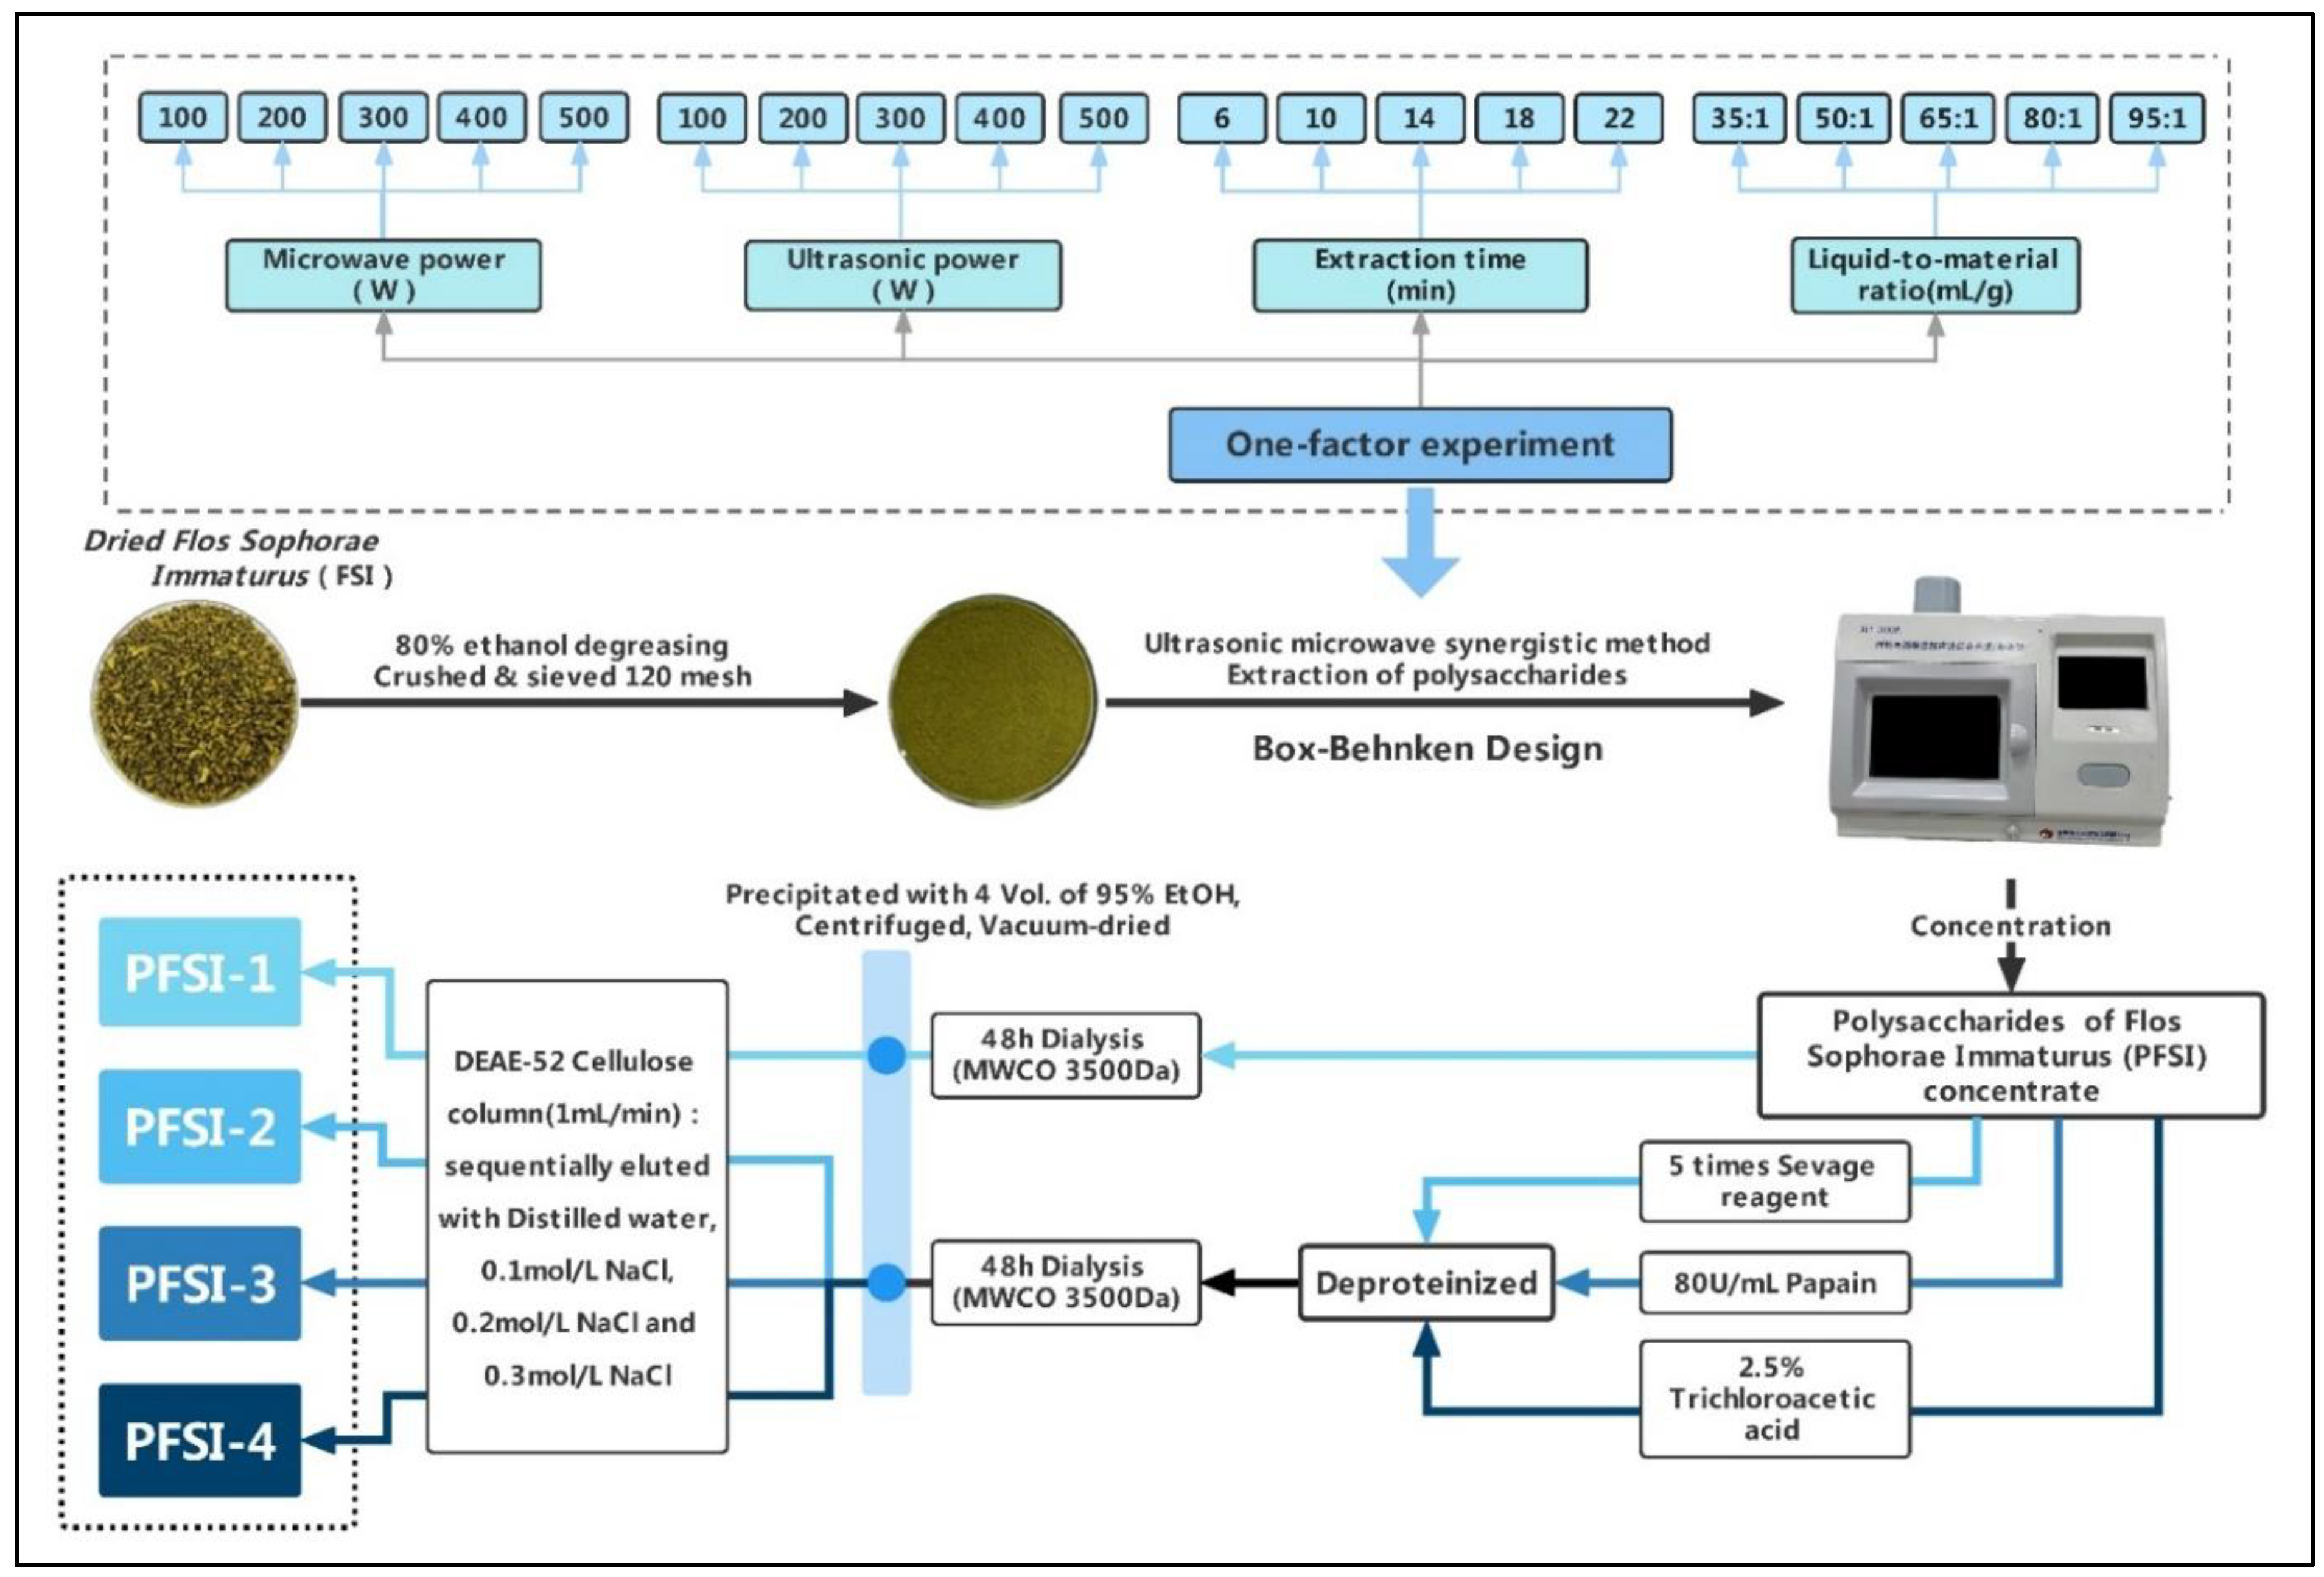
2.2. The Process Investigation of the UMSE Method to Obtain PFSI

The rootless and leafless FSIs were separated and degreased overnight by soaking in an 80% ethanol solution. Crushed FSI material was sifted through 40, 60, 80, 100, and 120 mesh sieves, dried at 60 °C and dispensed for consumption. We weighed 0.5 g of pretreated FSI powder in a 50 mL centrifuge tube, added distilled water (temperature: 95 ± 5 °C) as the extraction solution, mixed it with deionized water at a certain ratio, and extracted PFSI by the UMSE method (setting parameter: temperature 100 °C). We centrifuged it at 8000 r/min for 5 min, kept the supernatant, cooled it at room temperature and centrifuged for 10 min (8000 rpm/min), then transferred the supernatant. Samples were diluted and assayed for the concentration of total saccharides recovered. In this experiment, the PFSI content was determined by the phenol–sulphuric acid approach. It was calculated to retrieve the total saccharide extraction percentage as presented in Equation (1), where Y is the yield of polysaccharide (%), V is the total volume of sample solution (mL), C is the concentration of polysaccharide (mg/mL), D is the dilution factor, and m is the mass of the weighed sample (g).
Y   ( % ) = V × C × D m × 10 3 × 100
The concentrates were deproteinized by three different methods: Sevage reagent 5 times, 80 U/mL papain, and 2.5% TCA. The obtained deproteinized polysaccharide solution was kept in a 3000 Da dialysis bag and permeated under running water for 48 h. The dialyzed polysaccharide resolution gained by centrifugation at 6000 rpm/min for 10 min, with supernatant added to 4 times the volume of 95% ethanol and stored overnight. After discarding the supernatant, the solution containing the precipitate was centrifuged at 6000 rpm for 5 min, then condensed and desiccated under reduced pressure. Finally, the precipitate was purified using a cotton DEAE-52 cellulose column. PFSI-2, PFSI-3, and PFSI-4 was granted after purification, respectively. PFSI-1 was purified in exactly the same way, except for the subsequent isolation without deproteinization. Extraction, isolation, and purification procedures for PFSI-1, PFSI-2, PFSI-3, and PFSI-4 are illustrated in Figure 1.

2.3. One-Factor Experiment for Extraction

2.3.1. Effect of Microwave Power on Extraction

We weighed 60 mesh FSI powder 0.50 g in 5 portions; distilled water was used as a solvent; the ratio of material to liquid was 50:1; ultrasonic power was 200 W; with an extraction time of 10 min, followed by extraction at a microwave power of 100 W, 200 W, 300 W, 400 W, 500 W, and 600 W, respectively. Each experiment was repeated three times and the total sugar content was determined by the phenol–sulphuric acid method, which was repeated three times as an average to calculate the percentage of polysaccharide extraction.

2.3.2. Effect of Ultrasonic Power on Extraction

The process was the same as in Section 2.3.1 above, except that the extraction was carried out at ultrasonic power of 100 W, 200 W, 300 W, 400 W, and 500 W.

2.3.3. Effect of Particle Diameter on Extraction

The process was the same as in Section 2.3.1 above, excluding the weighing of screened at 40, 60, 80, 100, and 120 mesh FSI.

2.3.4. Effect of Liquid-to-Material Ratio on Extraction

The process was the same as in Section 2.3.1 above, but with liquid-to-material ratios of 35:1, 50:1, 65:1, 80:1, and 95:1.

2.3.5. Effect of Time on Extraction

The process was the same as in Section 2.3.1 above, but with supplementary extraction times of 6, 10, 14, 18, and 22 min.

2.4. Design of RSM

Based on the findings of the single-factor experiments, the microwave power, ultrasonic power, liquid-to-material ratio, powder particle size, and extraction time were determined as process parameters. The ultimate four-factor, three-level (microwave power, ultrasonic power, extraction time, and liquid-to-material ratio) experimental design of the single-factor experiments was selected in accordance with the limitations of the powder pulverization process to evaluate the polysaccharide extraction yields as the indicators, utilizing Box-Behnken’s central combinatorial experimental design principle. The factors affecting the polysaccharide yield were evaluated in terms of their main effects, mutual effects, and quadratic effects.
A multivariate regression equation was fitted to the empirical data with complete quadratic polynomial equations to assess the functional relationships attained between the polysaccharide yields and the individual experimental factors, as shown in Equation (2), where Y is the predicted response value for polysaccharide extraction rate; A0 is a constant; Ai is a linear coefficient; Aii is a quadratic coefficient; Aij is an interaction regression coefficient; and X and Xi are independent variables.
Y = A 0 +   A i i i = 1 3     X i X i +   i = 1     3     j = i + 1 3 A i i X i X

2.5. In Vitro Antioxidant Effect of PFSI

2.5.1. Measurement of DPPH· Radical Scavenging Rate

Sample reaction group: The sample solutions of PFSI-1, PFSI-2, PFSI-3 and PFSI-4 with concentration gradients of 0.01, 0.05, 0.1, 0.25, 0.5, 0.75, 1.0, 1.5, 2.0, 3.0, 4.0, 6.0 and 8.0 mg/mL were prepared in a 5 mL centrifuge tube and mixed thoroughly with 0.2 mmol DPPH in anhydrous ethanol. The sample solutions were mixed thoroughly in the same volume of anhydrous ethanol solution with 0.2 mmol DPPH in a 5 mL centrifuge tube, and then centrifuged at 6000 rpm/min for 5 min and operated three times in parallel. The supernatant was taken at 517 nm and the absorbance value was measured as As. Sample control group: an identical volume of sample solution as the DPPH solution, otherwise operated as in the sample reaction group, with an absorbance of Asc.
Blank reaction group: Evaporated water volume is the equivalent of DPPH solution, other operations as in the sample reaction group, absorbance is Ab. Blank control group: distilled water volume in the same volume as anhydrous ethanol; in other operations as in the reaction group; the absorbance value was Abc.
The same product reaction group of VC standard solution and the sample control group were operating as a control experiment. Clearance was determined according to Equation (3).
Free   radical   scavenging   rate   ( % ) = 1   A s A s c A b A b c   ×   100

2.5.2. Measurement of ·OH Radical Scavenging Rate

Sample reaction group: PFSI-1, PFSI-2, PFSI-3 and PFSI-4 were prepared in a 5 mL centrifuge tube with a concentration gradient of 0.01, 0.05, 0.1, 0.25, 0.5, 0.75, 1.0, 1.5, 2.0, 3.0, 4.0, 6.0 and 8.0 mg/mL, and then 9.0 mmol/L FeSO4 solution, 9.0 mmol/L salicylic acid-ethanol solution and 0.50 mL of 9.0 mmol/L H2O2 solution were added to start the reaction. The absorbance was measured at 510 nm as As. Sample control group: 0.50 mL of each sample solution was added with 0.50 mL of FeSO4, 0.50 mL of salicylic acid-ethanol solution, and 0.50 mL of H2O2 solution, and other operations were performed as in the sample reaction group, and the absorbance value was Asc.
Blank reaction group: 0.50 mL distilled water plus 0.50 mL FeSO4, 0.50 mL salicylic acid-ethanol solution, and 0.50 mL H2O2 solution; other operations as for the sample reaction group, absorbance value Ab. Blank control group: 0.50 mL distilled water plus 1.00 mL distilled water and 0.50 mL anhydrous ethanol, otherwise operated as in the sample reaction group, absorbance value Abc. The control group was operated as in Section 2.5.1 above, and the formula was calculated as in Equation (3).

2.5.3. Measurement of ABTS· Radical Scavenging Rate

Sample reaction group: 7.0 mmol/mL of ABTS solution and 2.45 mmol/mL of potassium persulphate solution were mixed and placed in a 100 mL brown flask at room temperature and protected from light overnight to form the ABTS stock solution. Dilute 10.0 mL of ABTS stock solution with phosphate buffer (10 mmol/L, pH = 7.4) until it reaches an absorbance of 0.7 ± 0.02 at OD734 nm. A concentration gradient of 0.01, 0.05, 0.1, 0.25, 0.5, 0.75, 1.0, 1.5, 2.0, 3.0, 4.0, 6.0 and 8.0 mg/mL of PFSI-1, PFSI-2, PFSI-3 and PFSI-4 was prepared and 0.5 mL of sample solution and 1.50 mL of ABTS working solution was added to each of the 5 mL centrifuge tubes. ABTS working solution and the reaction was carried out at room temperature for 10 min and the absorbance value was measured as As. Sample control group: 1.50 mL of potassium persulphate solution was added to each of the different concentrations of the sample solutions, and the other operations were performed as in the sample reaction group, with the absorbance value as Asc.
Blank reaction group: 0.50 mL distilled water plus 1.50 mL ABTS working solution, other operations as for the sample reaction group, absorbance value as Ab. Blank control group: 0.50 mL distilled water plus 1.50 mL potassium persulphate solution, otherwise operated as for the sample reaction group, with an absorbance value of Abc. The control group was operated as in Section 2.5.1 and the formula was calculated as in Equation (3).

2.5.4. Measurement of Ferric-Reducing Antioxidant Power

Sample reaction group: 0.01, 0.05, 0.1, 0.25, 0.5, 0.75, 1.0, 1.5, 2.0, 3.0, 4.0, 6.0 and 8.0 mg/mL of PFSI-1, PFSI-2, PFSI-3 and PFSI-4 were placed into a 15 mL centrifuge tube, and 1.00 mL of phosphate buffer solution (0.2 mmol/L, pH = 6.6) and 1.00 mL of 1% potassium ferricyanide solution (K3Fe(CN)6 were sequentially charged. After mixing, the supernatant was centrifuged at 6000 rpm for 10 min. The supernatant was spiked with 3.5 mL of distilled water and 2.5 mL of 0.1% FeCl3 solution, protected from light for 30 min, and the absorbance value of AS was measured at 700 nm.
Positive control group: 0.01, 0.05, 0.1, 0.25, 0.5, 0.75, 1.0, 1.5, 2.0, 3.0, 4.0, 6.0, 8.0 mg/mL of ascorbic acid standard solution, other operations as in the sample reaction group, absorbance value was AC. Blank reaction group: 0.5 mL of distilled water was taken, other operations were as in the sample group, and the absorbance value was Ab. The ferric-reducing antioxidant power (FRAP) was estimated by comparing the absorbance values of the sample reaction group (ASAb) with those of the positive control group (ACAb).

2.6. Statistical Analysis

Data are shown as mean ± SEM, and statistical analysis was performed using Origin 2021, Graphpad Prism 8, Design-Expert 12, and EXCEL 2019. To compare the differences among multiple groups, a one-way analysis of variance (ANOVA) was performed using this software.

3. Results

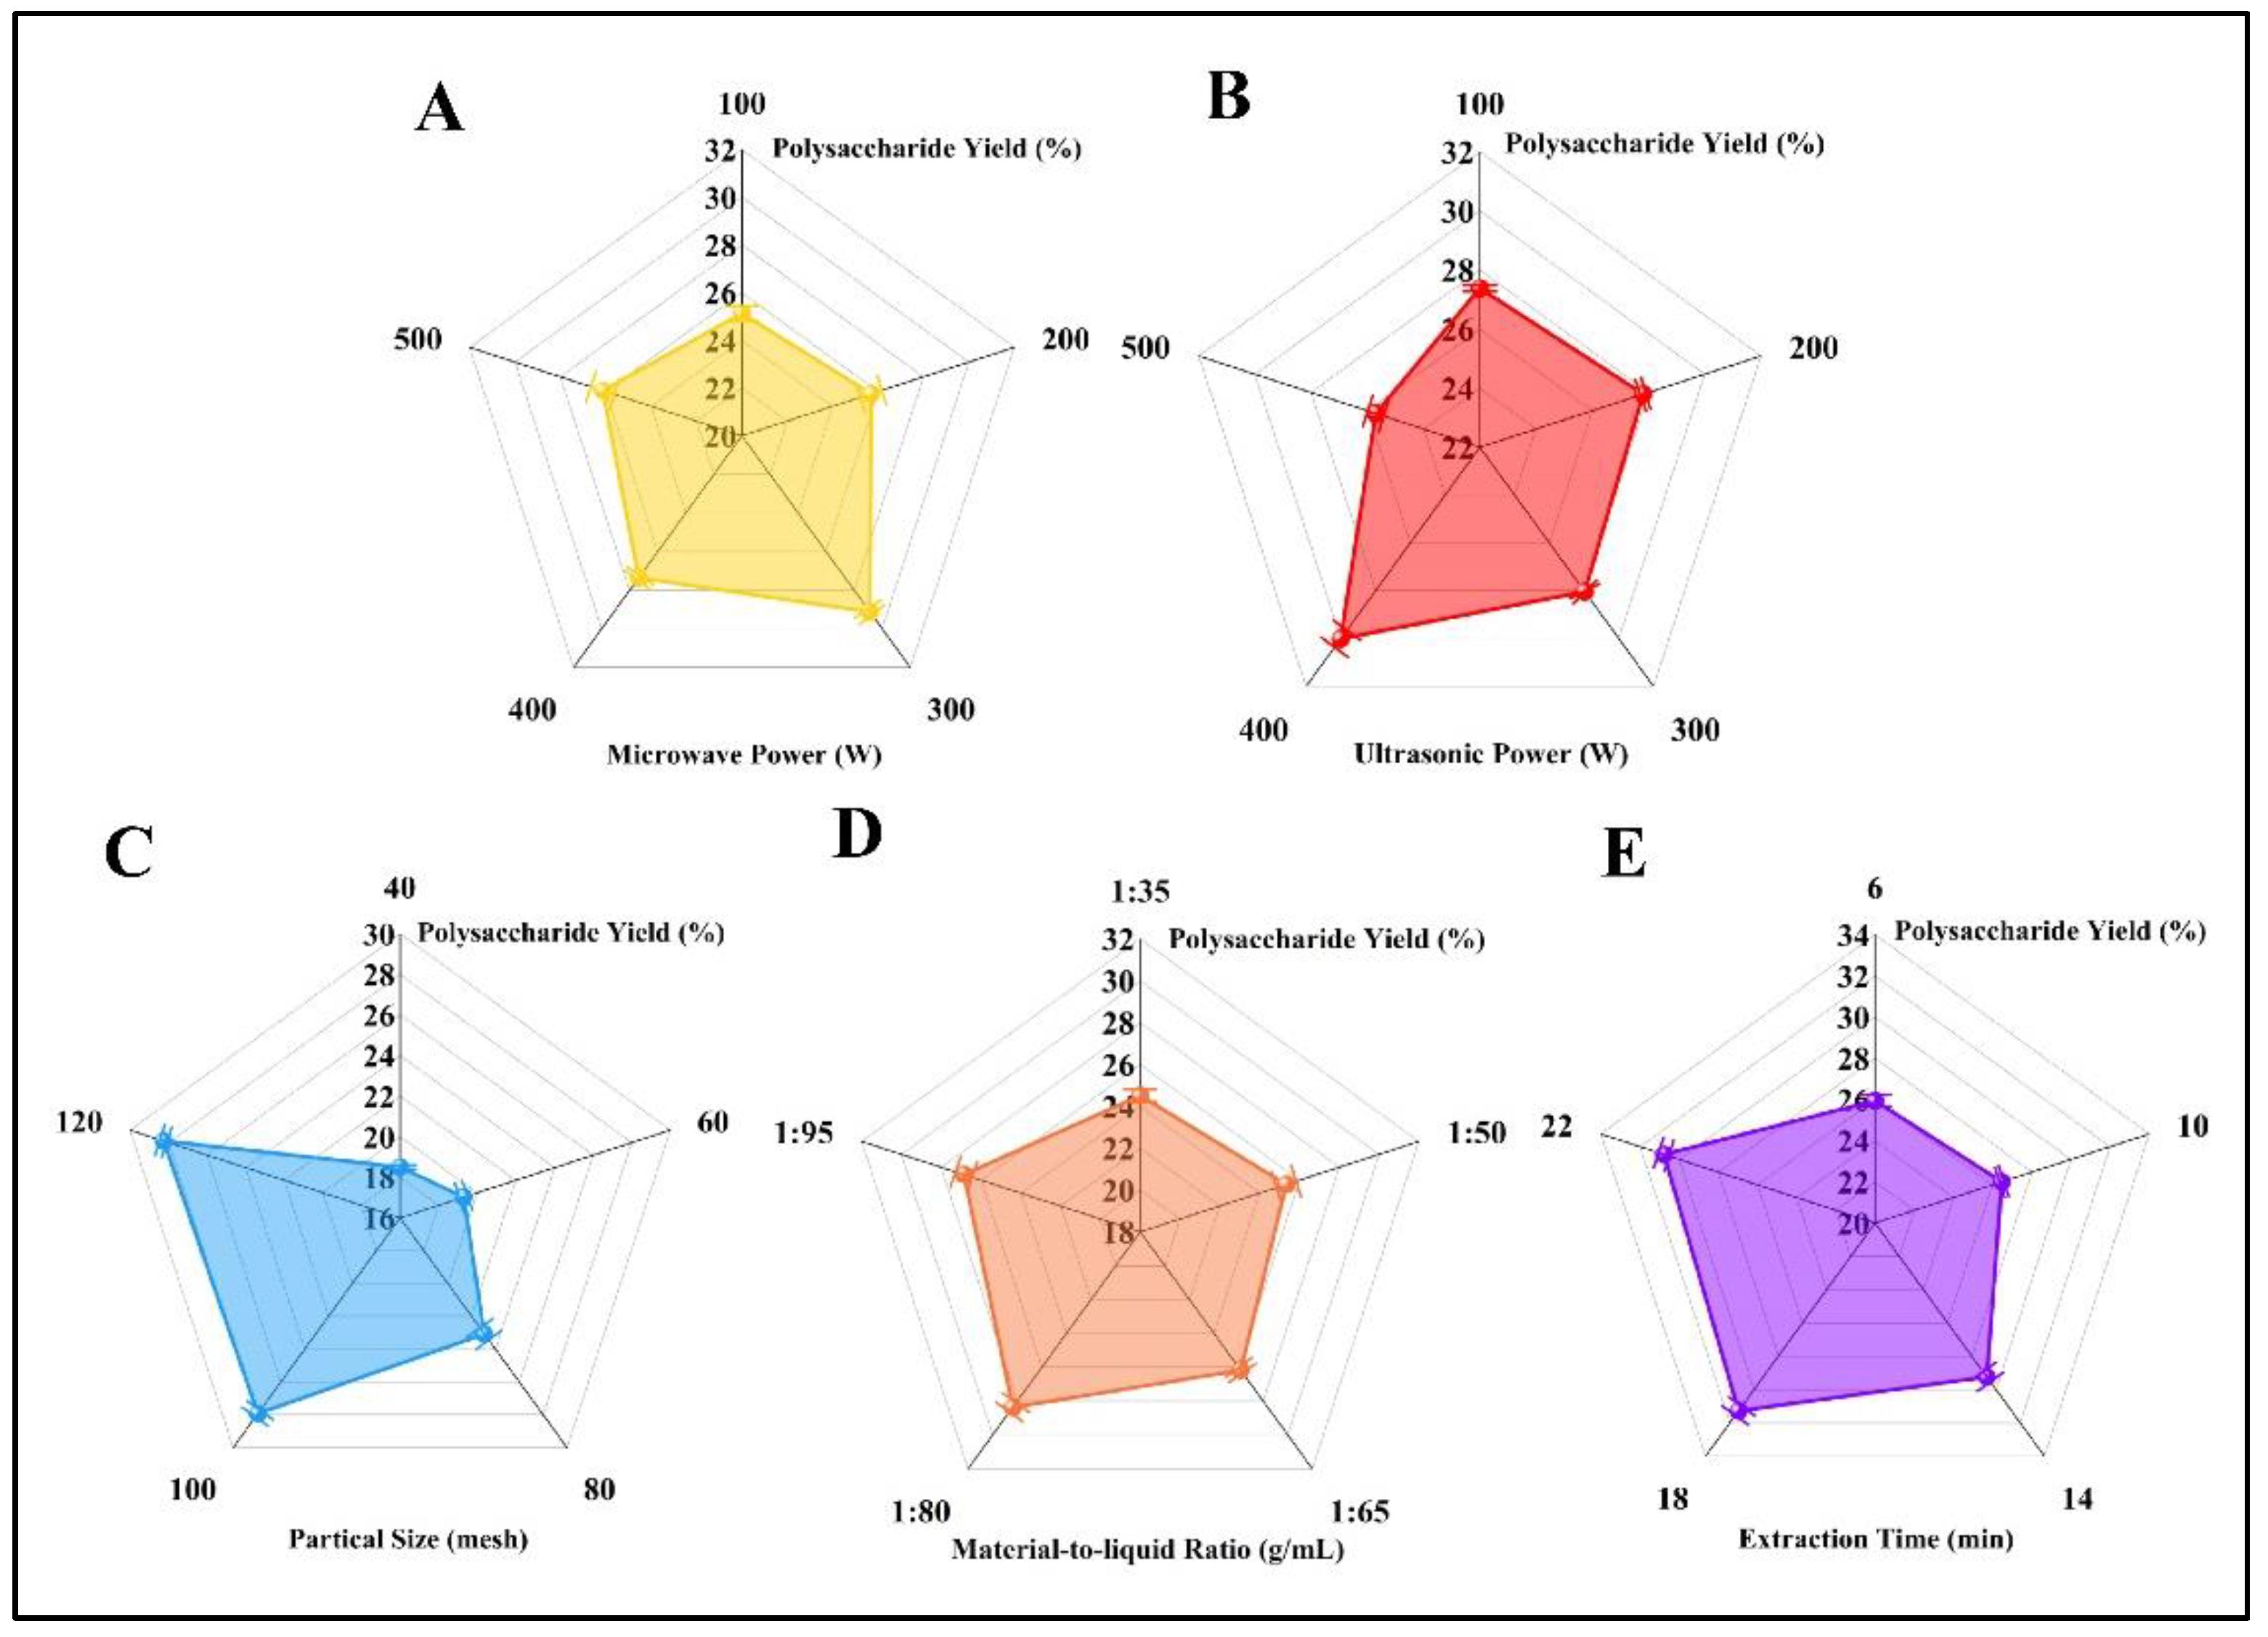
3.1. Analysis of One-Factor Experiment

3.1.1. Analysis of Microwave Power on Extraction

The influence of microwave power on the extraction ratio of PFSI is shown in Figure 2A. With the microwave power between 100 and 300 W, the concentration of PFSI extraction showed an upwards trend with the increase in microwave power; when the microwave power exceeded 300 W, the withdrawal ratio of PFSI showed a downwards trend with the elevated microwave power. Hence, microwave power of 300 W was considered the optimum extraction parameter.

3.1.2. Analysis of Ultrasound Power on Extraction

Figure 2B shows the effect of ultrasound power on the extraction of PFSI. After reaching 400 W, the yield of polysaccharides reached their highest level, then decreased when the ultrasonic power was increased again. Consequently, the best extraction parameter was the ultrasonic power of 400 W.

3.1.3. Analysis of Particle Diameter on Extraction

Figure 2C demonstrates the impact of particle diameter sizes on the extraction rate of PFSI. The yield of polysaccharides rose with the increase in powder particle size, and the contact area of the solute surface area and solution expanded with the increase in particle diameter, which was more conducive to the dissolution of polysaccharides. This process investigation considered the extraction optimization to be maximized, therefore a sieved 120 mesh FSI powder was selected and was not included in the validation of the four-factor and three-level experiments in the later RSM.

3.1.4. Analysis of Liquid-to-Material Ratio on Extraction

The remarkable effect of the liquid-to-material ratio on the yield of polysaccharides is illustrated in Figure 2D. The yield of polysaccharides increased with the increase in the liquid-to-material ratio from 35:1 to 95:1. Thereafter, the polysaccharide yield did not increase despite the liquid-to-material ratio being continually enhanced. The principal reason was that the leaching of polysaccharides was more favorable because the contact area between the solute and the solution was enlarged with that ratio, but at more than 1:80, the polysaccharides were already solubilized and fully leached out. For this reason, 1:80 was chosen as the optimum extraction parameter for polysaccharide extraction.

3.1.5. Analysis of Time on Extraction

Figure 2E reveals the effect of time of exploitation on the extraction of PFSI-1 at 300 W microwave power, 400 W ultrasonic power, and 95:1 liquid-to-material ratio, which demonstrated that the polysaccharide yield rose with increasing extraction time from 6 to 18 min. After 18 min of extraction, the amount of polysaccharide obtained did not obviously increase. Considering the extraction cost, the extraction time of 18 min was considered the best extraction parameter for polysaccharide extraction.

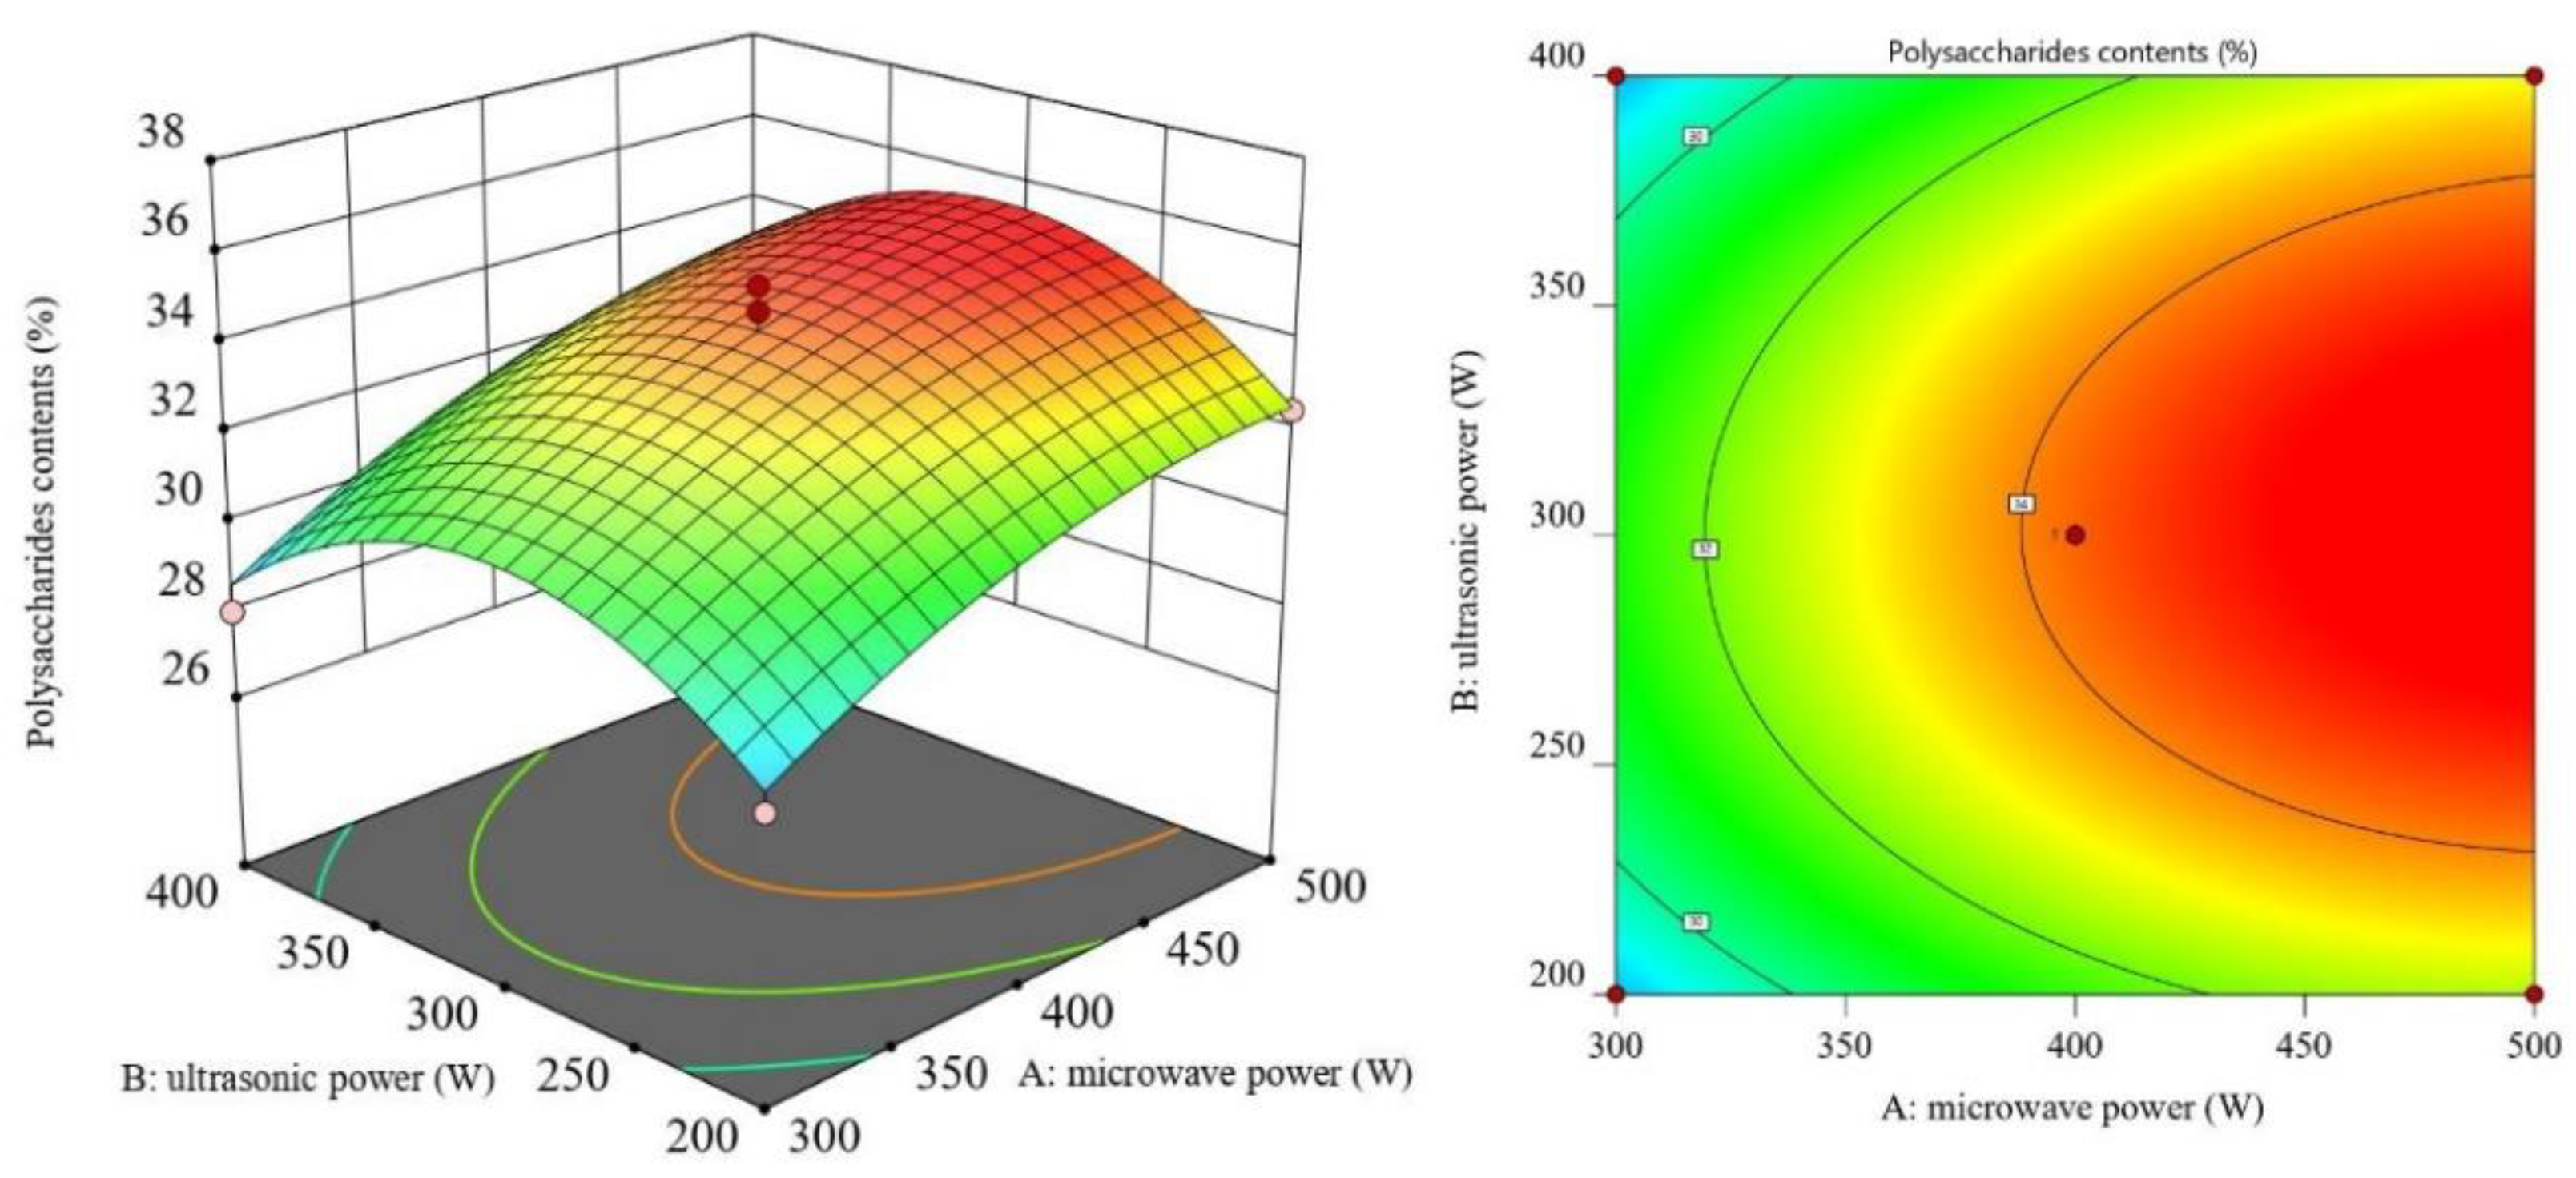
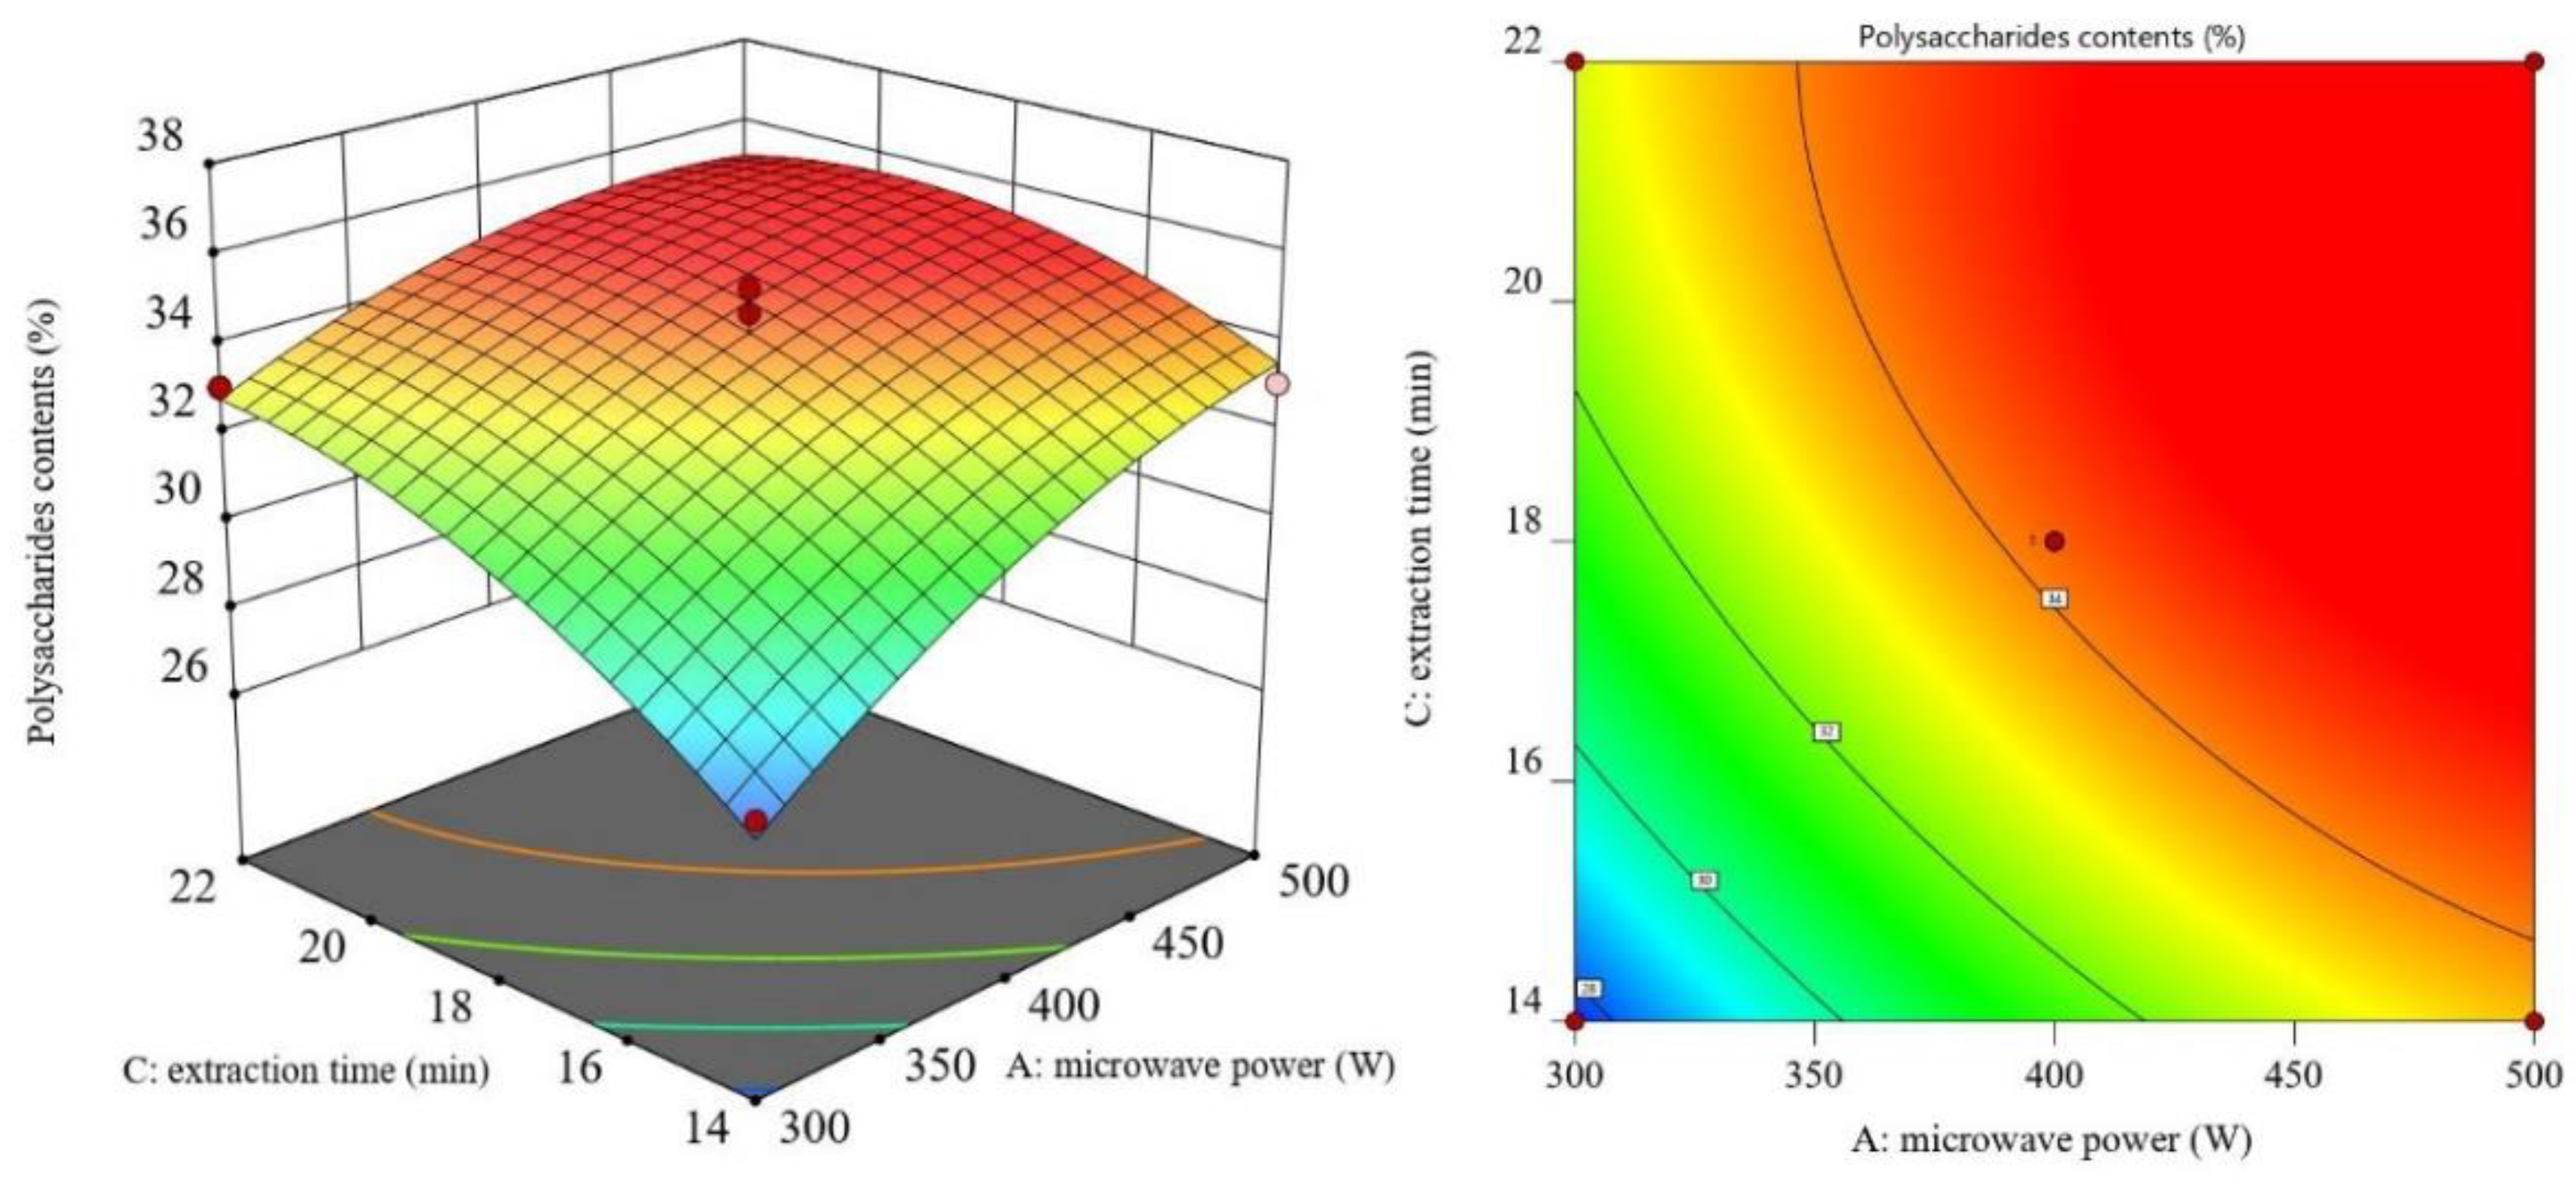
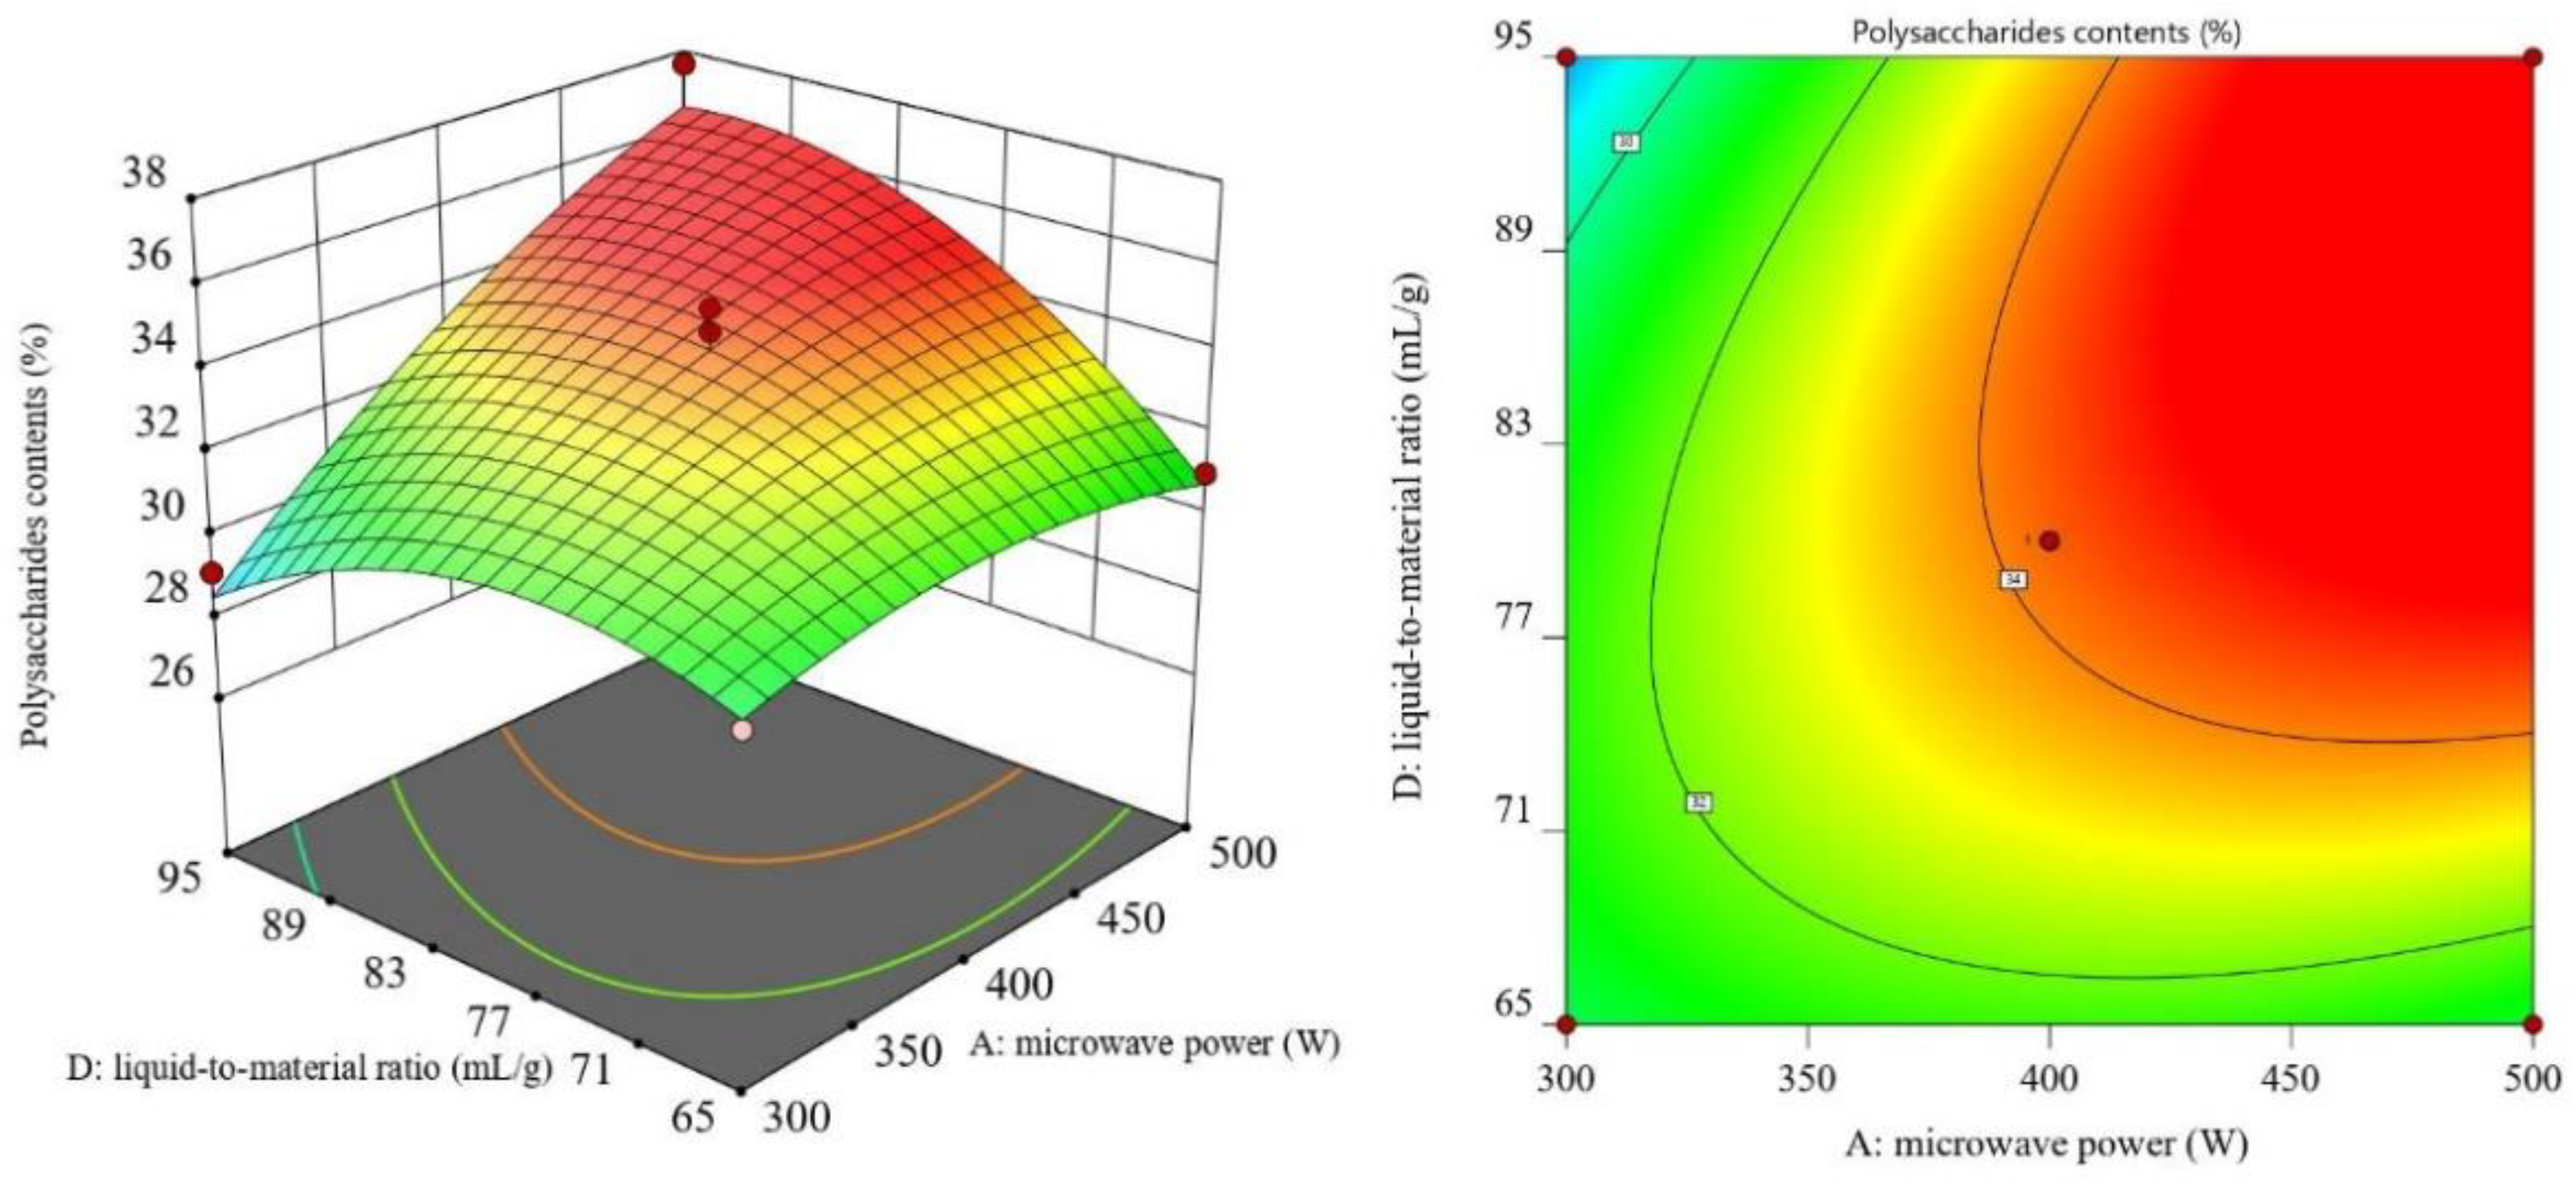
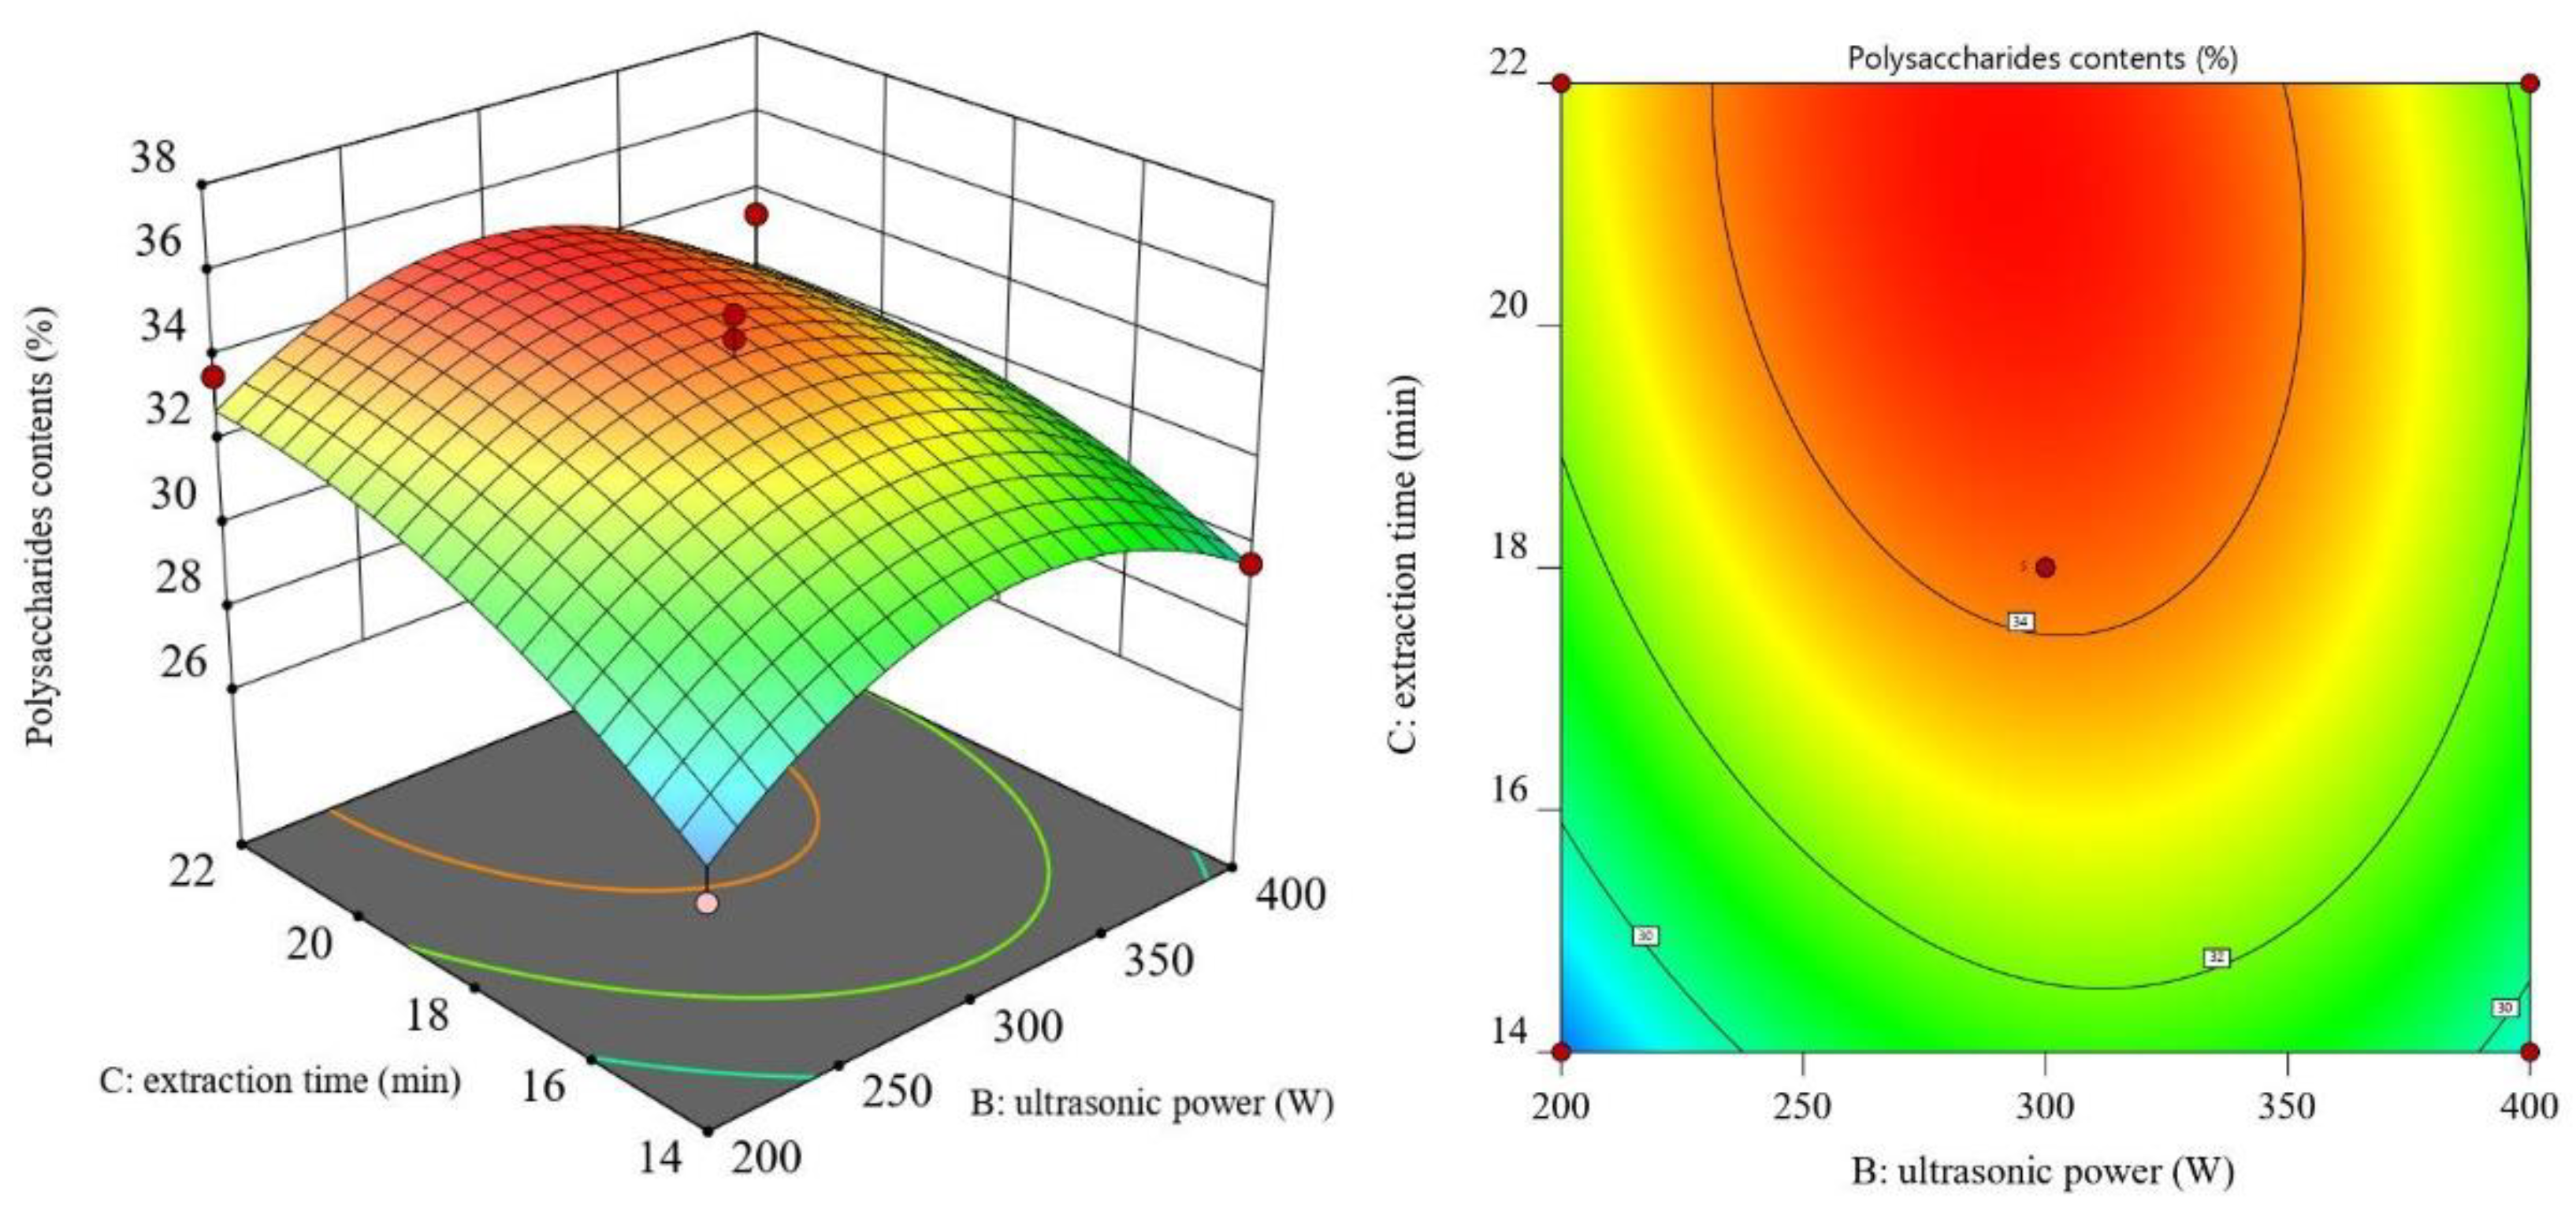
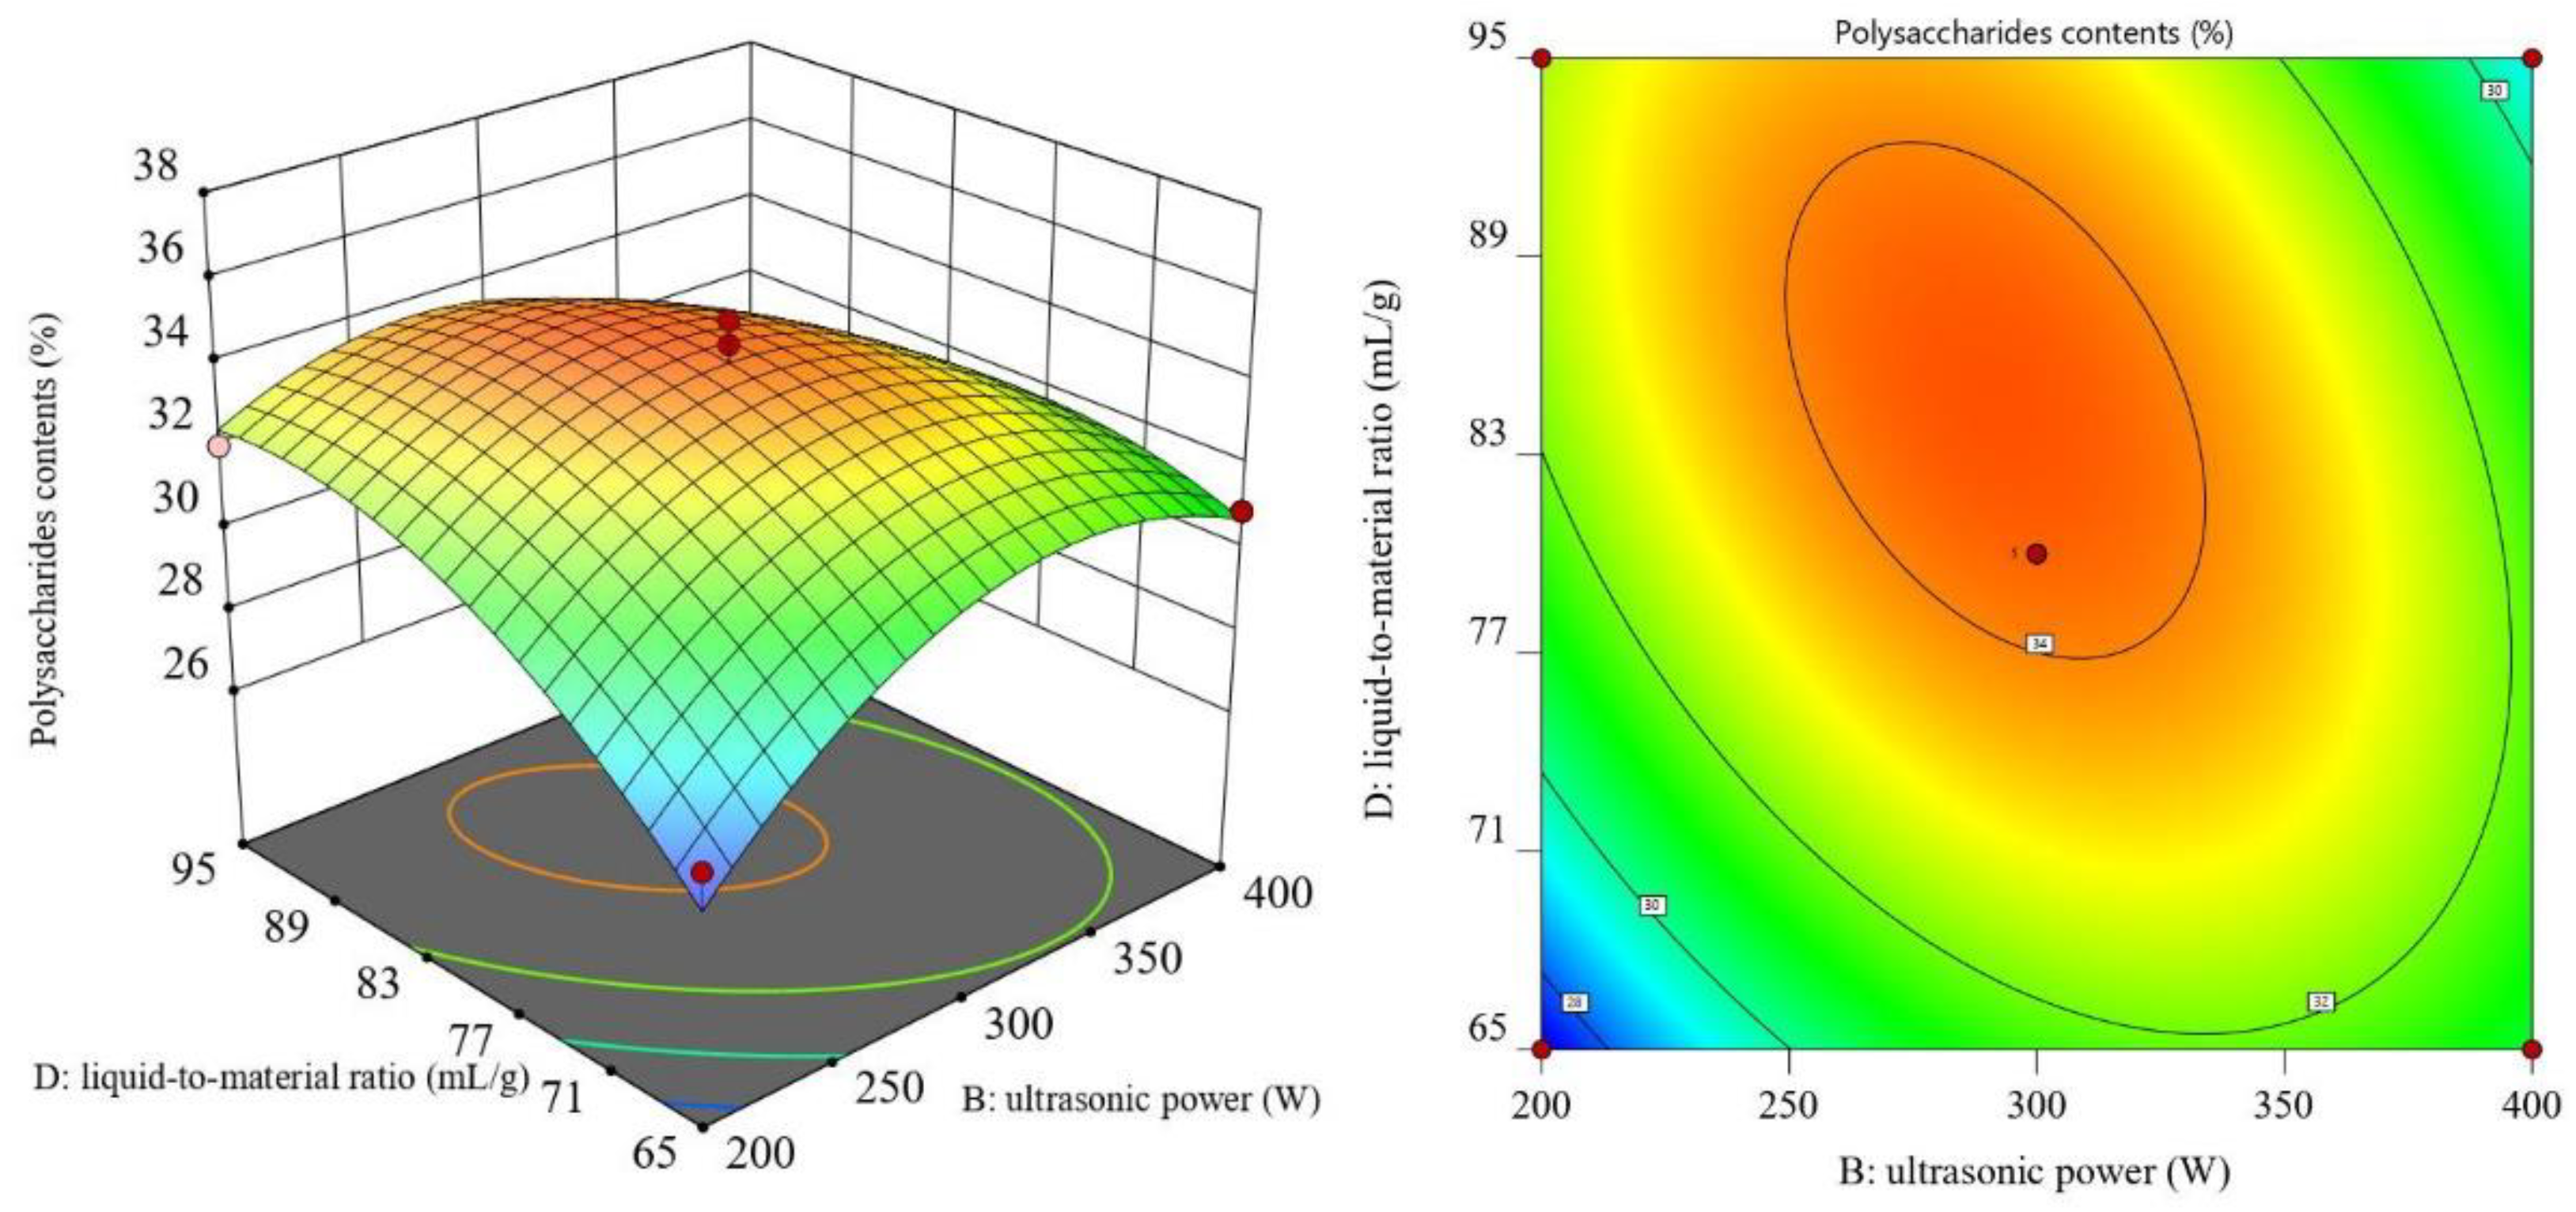
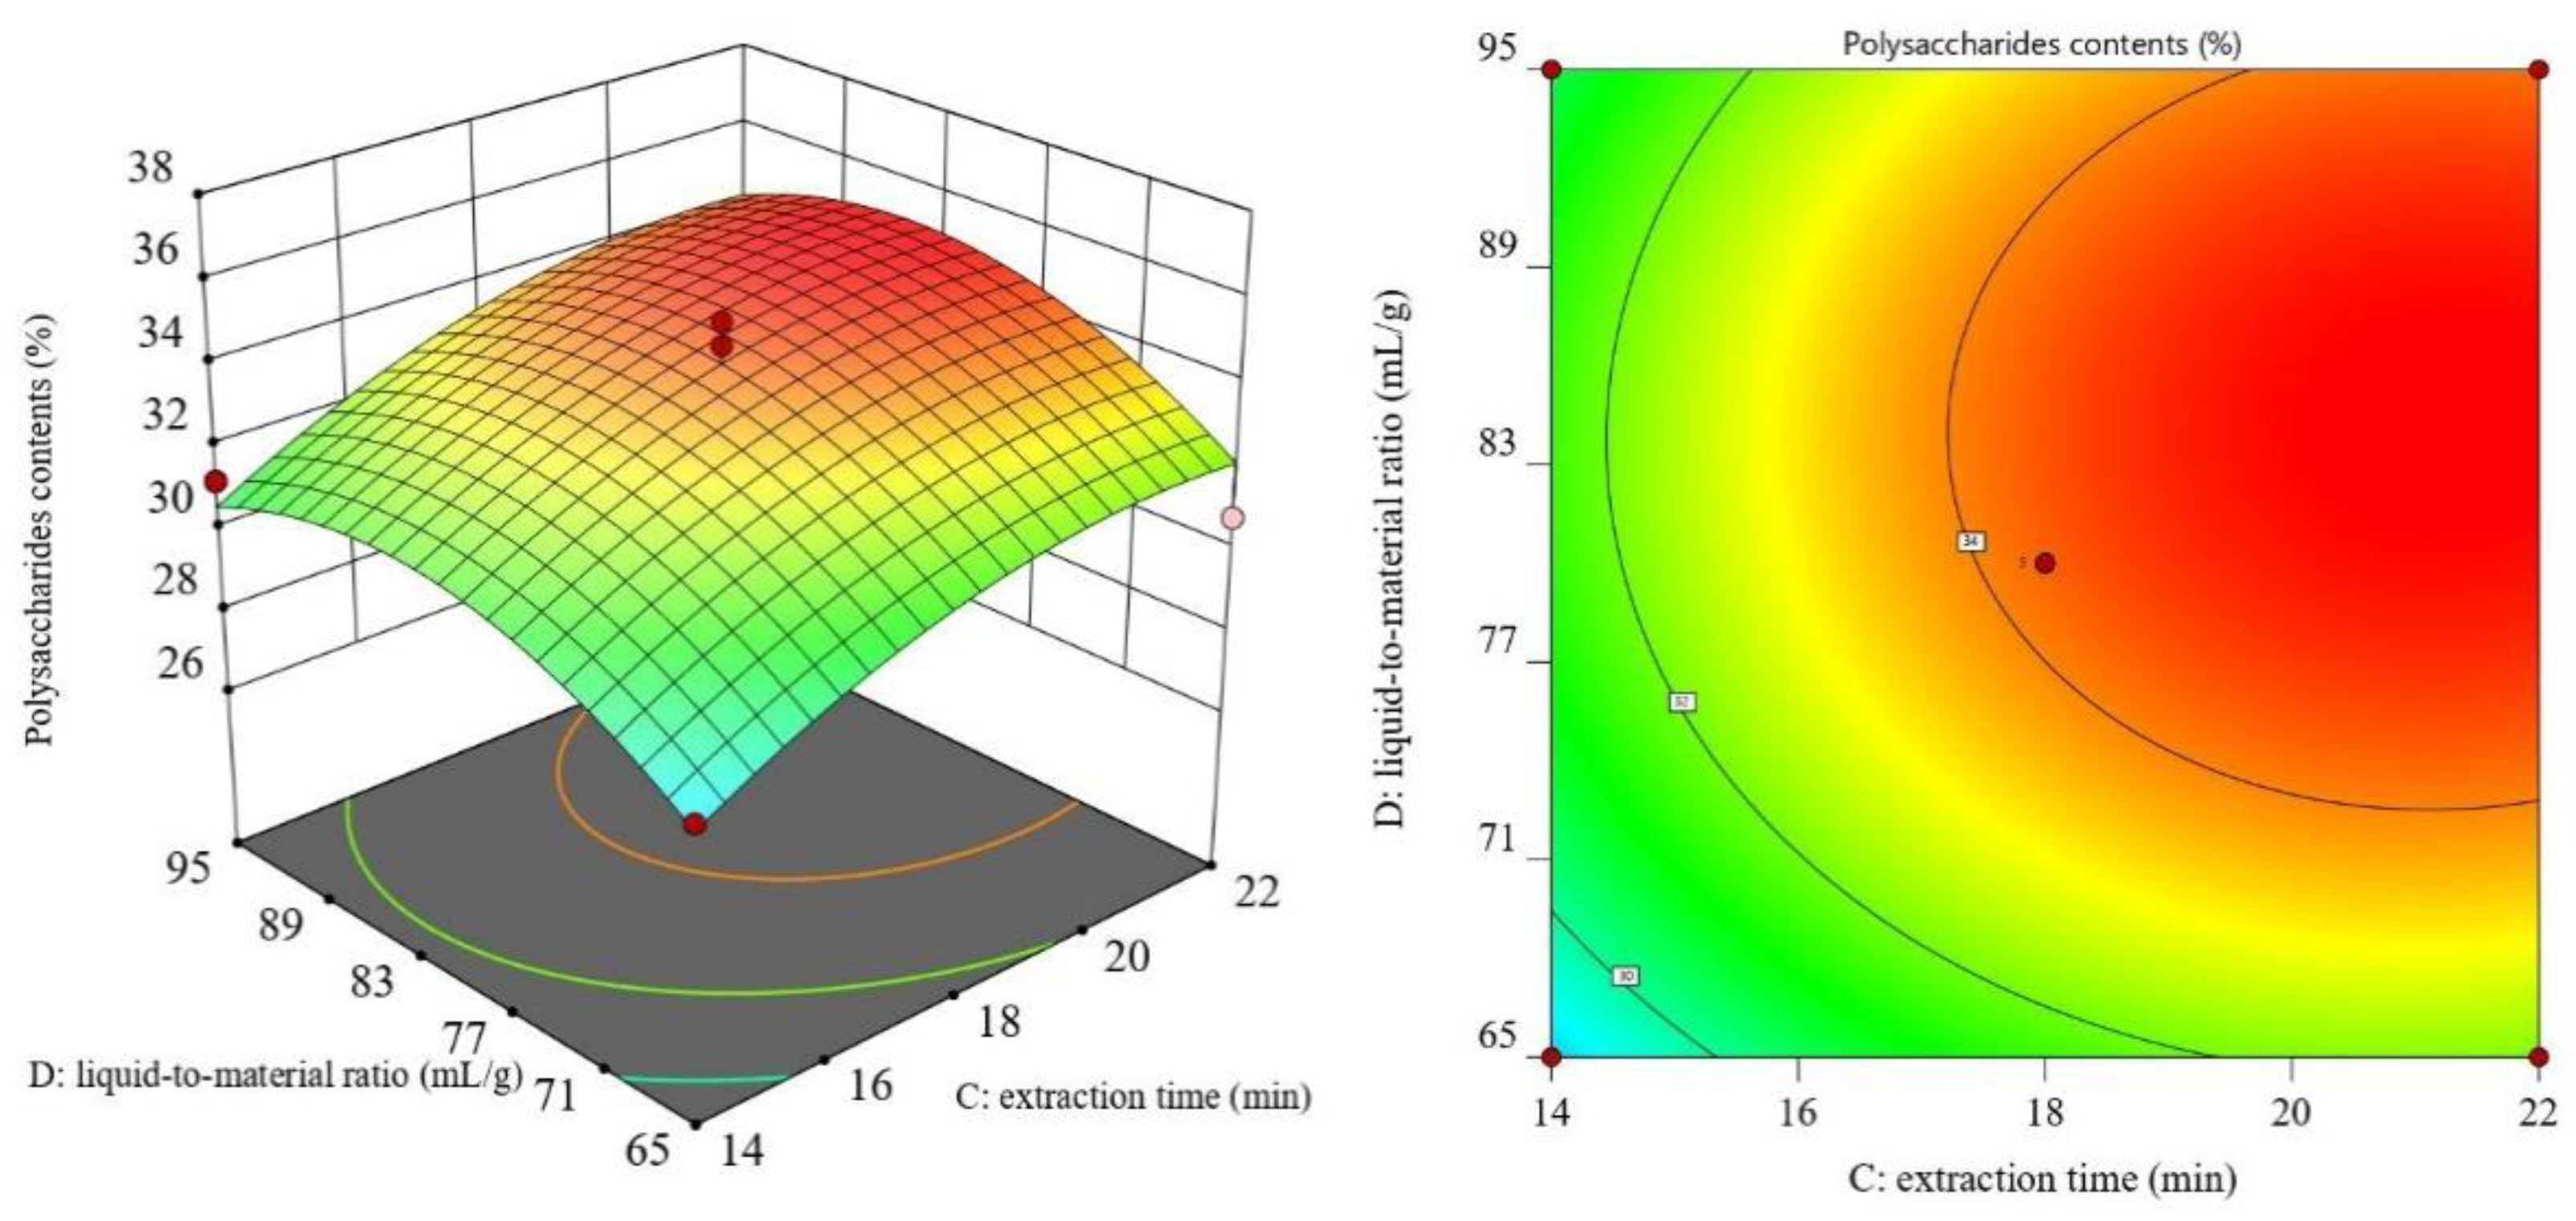
3.2. RSM Results and ANOVA

On the basis of the results of the single-factor assay, a four-factor, three-level experiment was selected, as shown in Table 1. The Box-Behnken central combination principle was implemented to devise the RSM employing polysaccharide yield as the response value (Table 2), and ANOVA and quadratic polynomial regression equations were fitted (Table 3). The data were calculated using Design expert 12 software to obtain the Y (polysaccharide yield) regression equation (Y = −103.31 + 0.0233 A + 0.2738 B + 4.08 C + 1.112 D + 0.000015 AB − 0.0022 AC + 0.0013 AD − 0.0015 BC − 0.0012 BD + 0.0013 CD − 0.00009 A2 − 0.00026 B2 − 0.067 C2 − 0.0078 D2).
As can be seen from Table 3, the F value of 12.97, p < 0.01, reached a highly conspicuous level and the difference in the misfit term was p = 0.1964 > 0.05, which was not prominent, suggesting that the model fit was good and the experimental error was small. This indicated that the model could be applied to the determination of PFSI yields. In addition, it is possible to establish from Table 3 that A, C, D, AD, BD, A2, B2, and D2 are highly conspicuous (p < 0.01), C2 is significantly different (p < 0.05), and the remaining terms are not remarkable. Depending on the magnitude of the F-value, one may conclude that the order of the effectiveness of the experimental factors on the polysaccharide yield was A (microwave power) > C (extraction time) > D (liquid-to-material ratio) > B (ultrasonic power).
The corresponding response surface and contours were plotted in the regression equation model (Figure 3, Figure 4, Figure 5, Figure 6, Figure 7 and Figure 8) to visualize the relationship between the response surface and the interaction of the various factors so that the optimum process parameters and the interaction between the parameters could be identified. From the response surface and contour plots, it can be observed that the interaction between microwave power and extraction time has a noticeable contribution to the PFSI yield.

3.3. Optimal Process Conditions and Validation Experiments

The optimum conditions for PFSI extraction were obtained by response surface methodology: microwave power 500 W, ultrasonic power 265.887 W, extraction time 20.078 min, liquid-to-material ratio 94.995:1, and the predicted polysaccharide yield was 37.062%. The optimum extraction process was set at 500 W microwave power, 270 W ultrasonic power, 20 min extraction time, and 95:1 liquid-to-material ratio. The average value was 37.05%, which was similar to the predicted value of 37.17%, indicating that the optimized output was reasonable. The optimized conditions for PFSI extraction gained by RSM were retrieved and PFSI-1, PFSI-2, PFSI-3, and PFSI-4 were obtained successively.

3.4. Analysis of PFSI In Vitro Antioxidant

3.4.1. Analysis of DPPH· Radical Scavenging Rate

As illustrated in Table 4 and Figure 9, PFSI-1, PFSI-2, PFSI-3, and PFSI-4 showed significant differences (p < 0.05) in DPPH scavenging ability compared with VC in the concentration range of 0~8 mg/mL, and all of them increased with the rise in concentration and had certain DPPH· radical scavenging ability. The increasing trend of DPPH· radical scavenging rate was stable at a concentration of 4.0 mg/mL for PFSI-1, at a concentration of 0.5 mg/mL for PFSI-3, and at a concentration of 1.0 mg/mL for PFSI-4. With PFSI-2 at a concentration of 8.0 mg/mL, the DPPH· radical scavenging rate compared to VC achieved a similar DPPH radical scavenging rate. The maximum DPPH radical scavenging rate of PFSI-2 > PFSI-1 > PFSI-4 > PFSI-3 can be judged from the magnitude of the maximum DPPH radical scavenging rate, implying that both have certain DPPH radical scavenging ability.

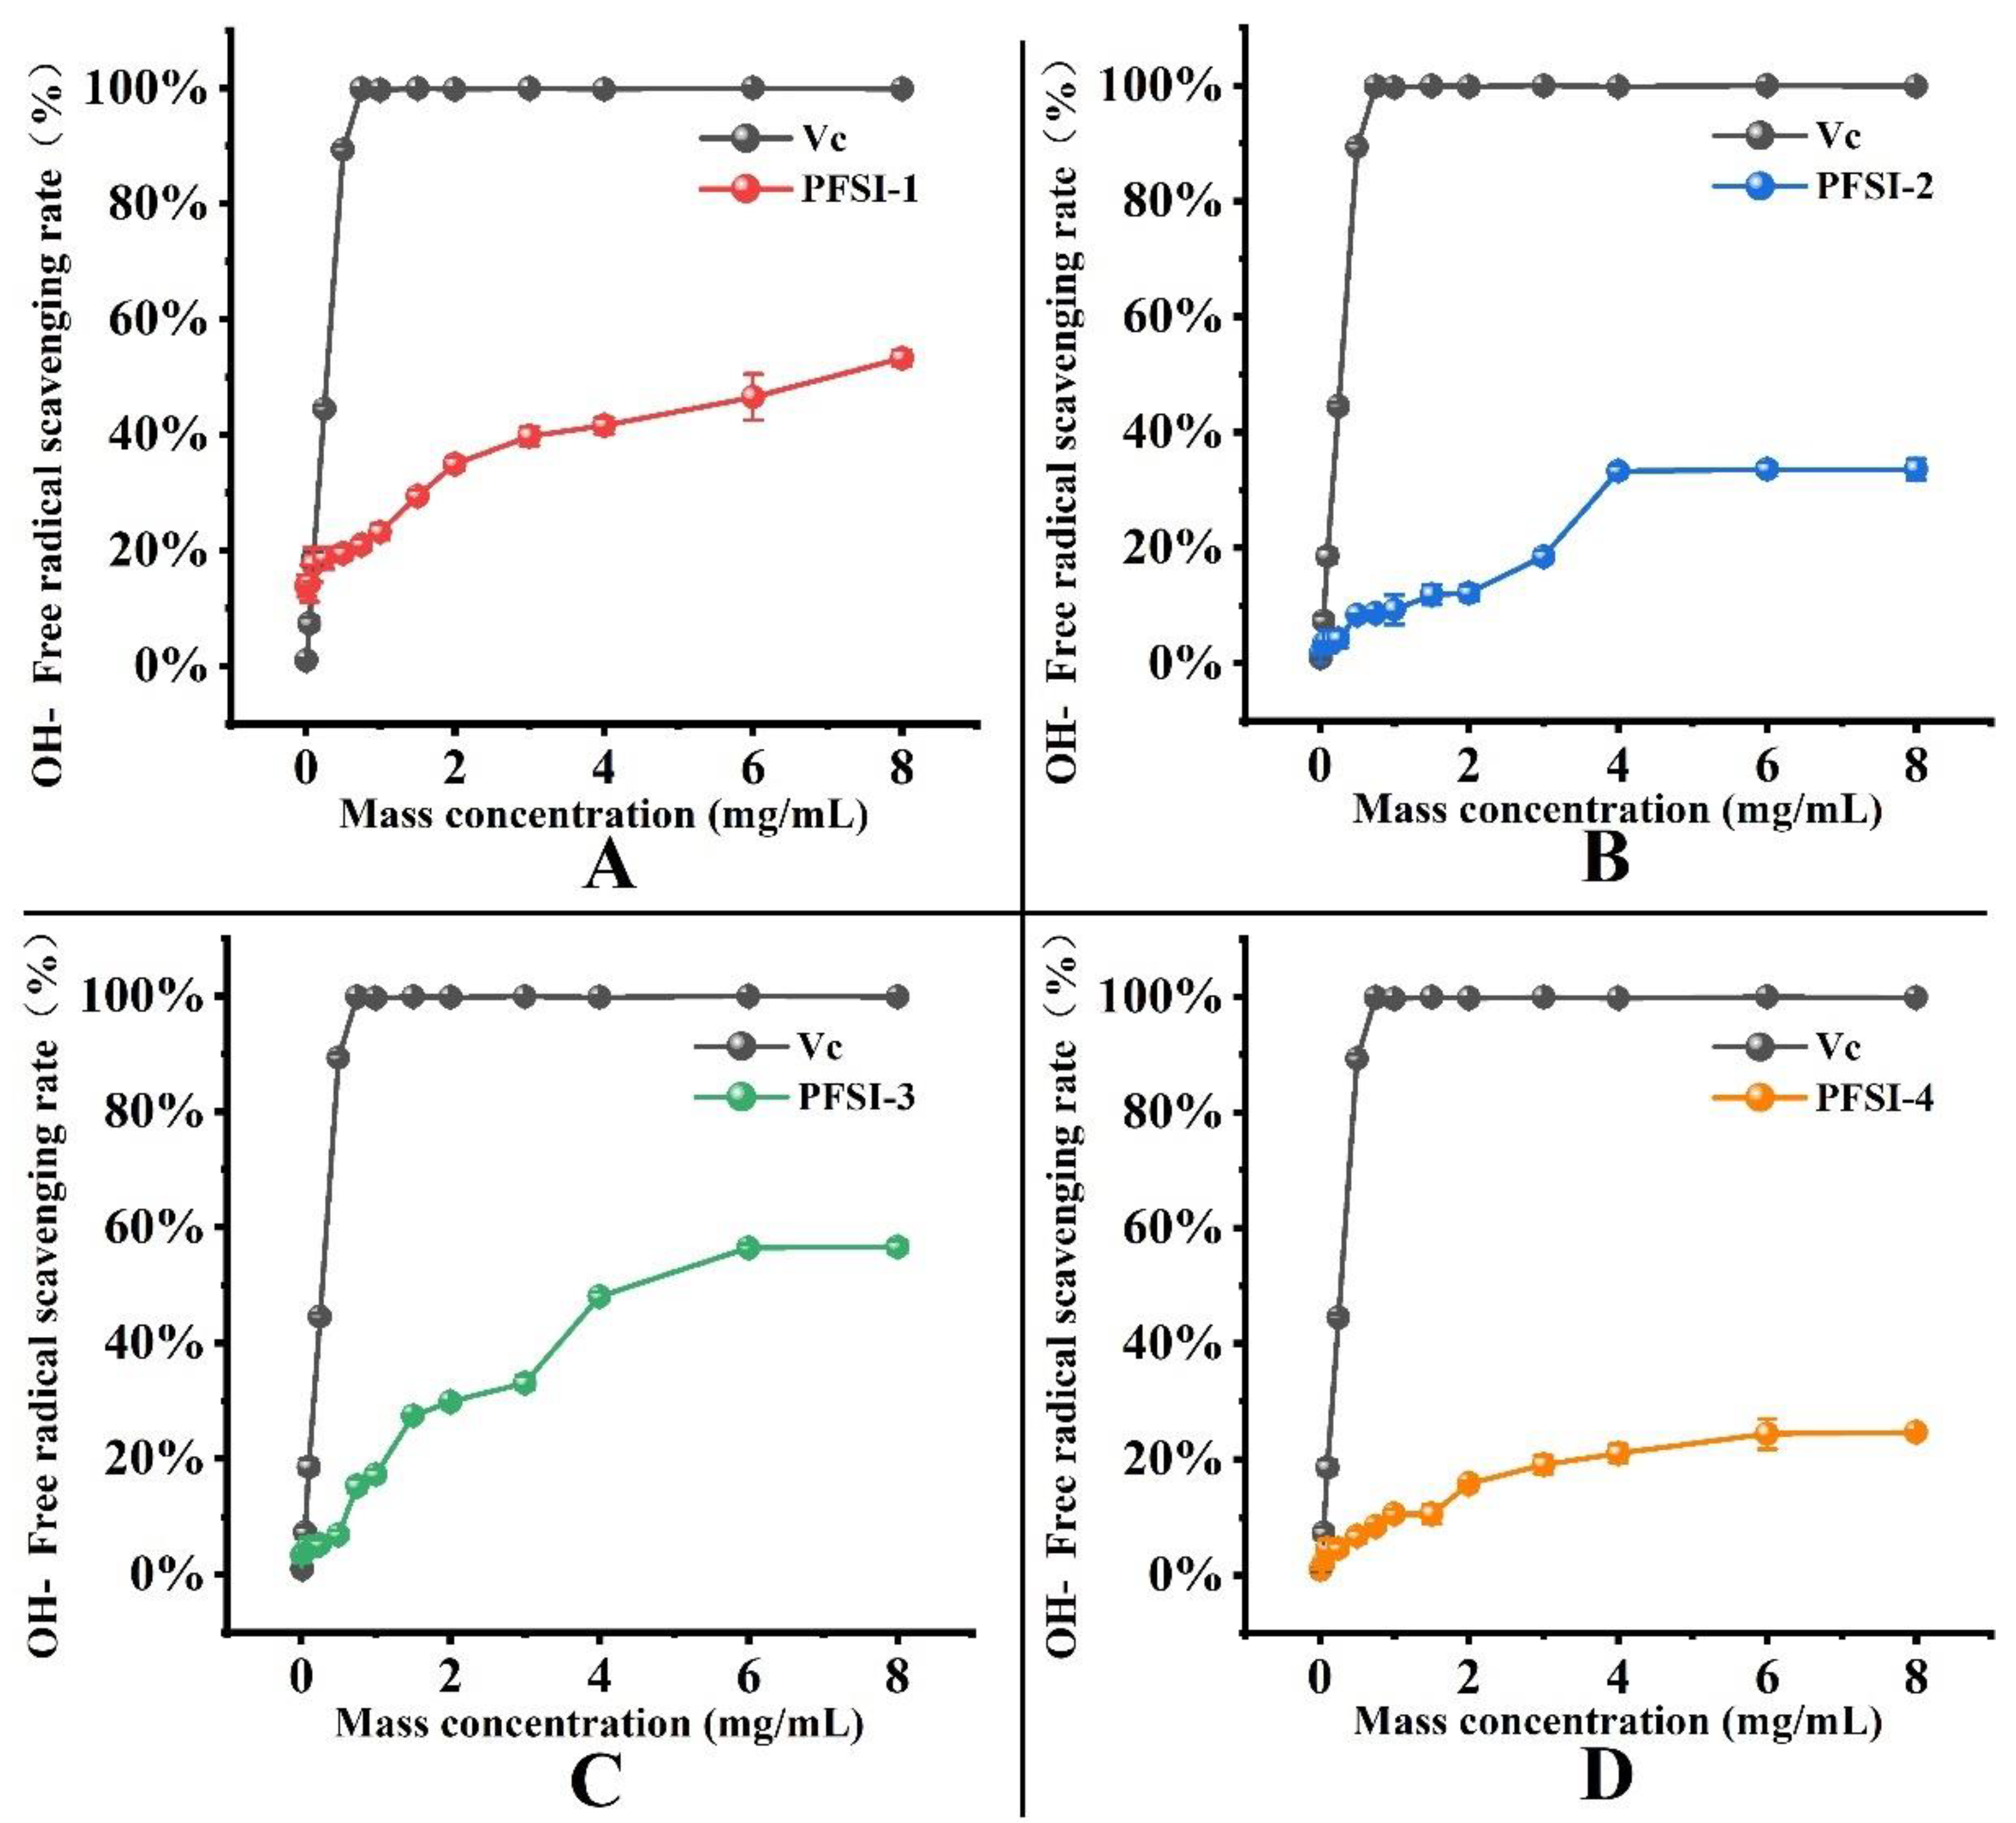
3.4.2. Analysis of ·OH Radical Scavenging Rate

As shown in Table 5 and Figure 10, the scavenging rate of ·OH radicals of the four species escalated with an increased polysaccharide concentration range (0.01~8 mg/mL). At a concentration of 4 mg/mL, the ·OH radical scavenging rates of PFSI-2 and PFSI-4 had reached a plateau with no prominent increase. PFSI-1 and PFSI-3 reached 8 mg/mL with similar scavenging rates. The maximum DPPH scavenging rate of PFSI-3 > PFSI-1 > PFSI-2 > PFSI-4 suggested that both had some ·OH radical scavenging ability, whereas the ·OH radical scavenging ability of PFSI-3 was stronger.

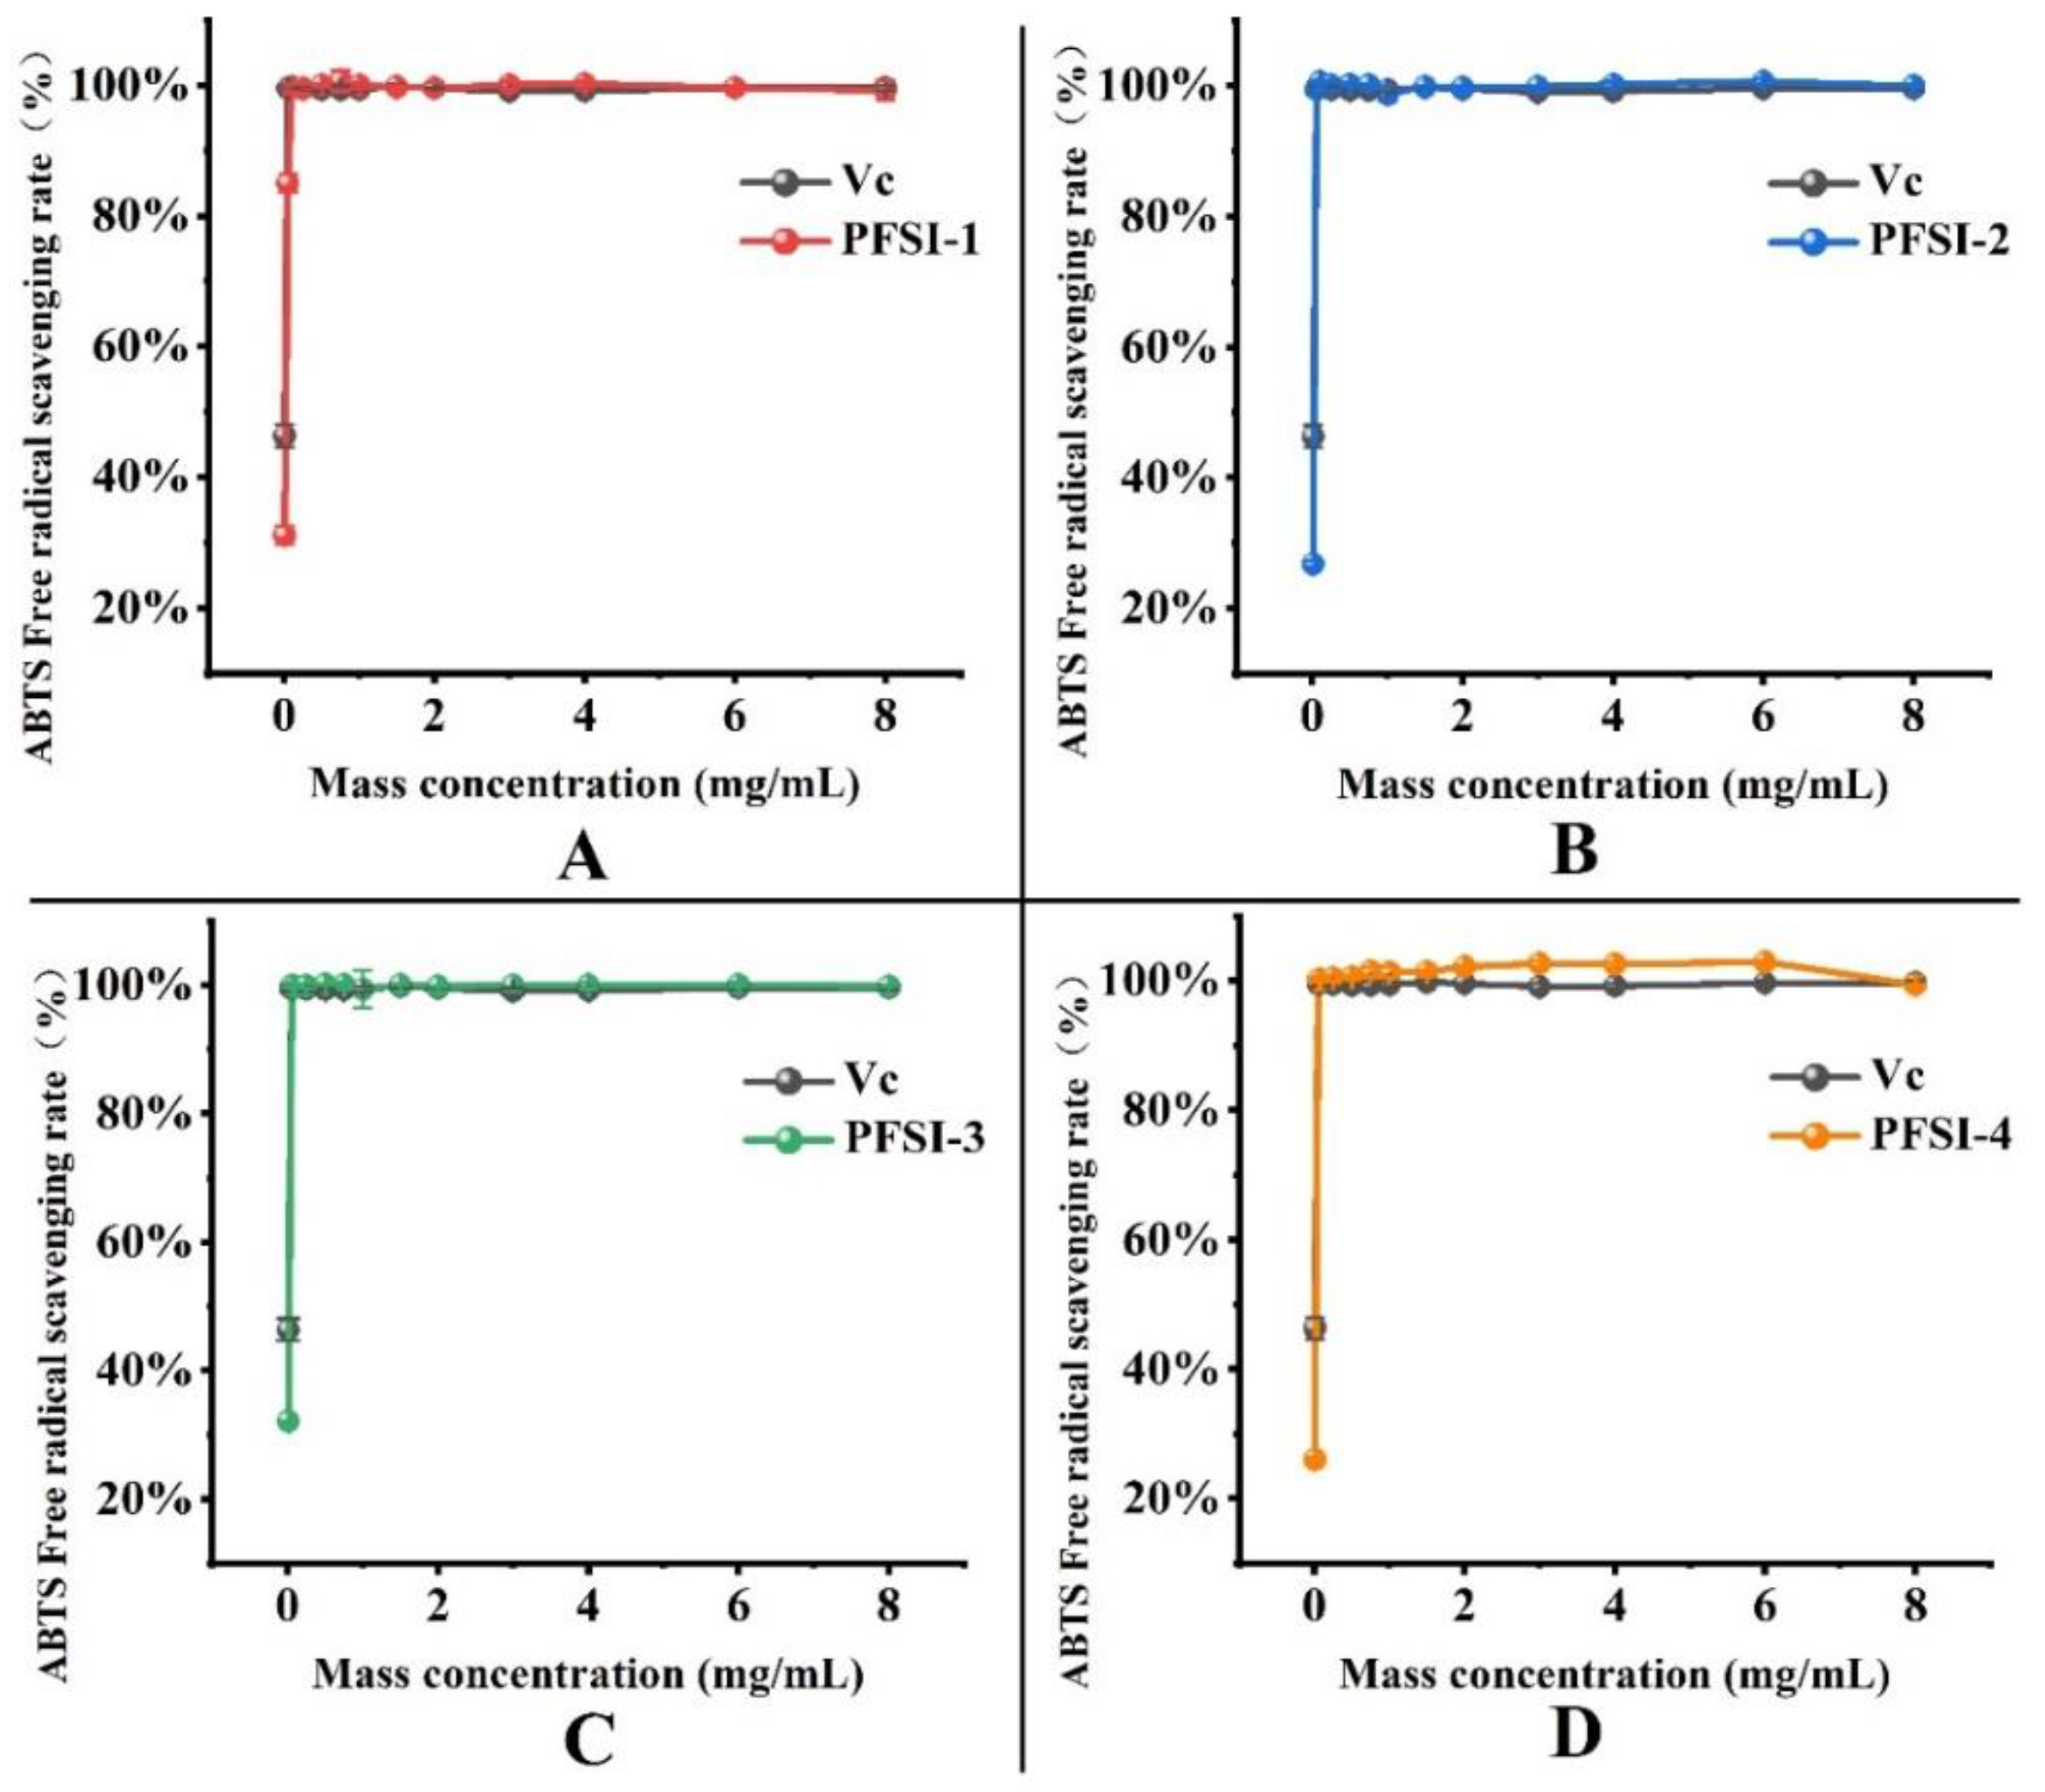
3.4.3. Analysis of ABTS· Radical Scavenging Rate

As depicted in Table 6 and Figure 11, the overall trend in the scavenging rates of PFSI-1, PFSI-2, PFSI-3, and PFSI-4 compared to VC was found to reach similar ABTS· radical scavenging rates. At a concentration of 0.05 mg/mL, PFSI-2, PFSI-,3 and PFSI-4 ABTS· radical scavenging rates reached a plateau. The ABTS· radical scavenging rate of PFSI-1 plateaued at a concentration of 0.1 mg/mL. At concentrations of 1.0~8.0 mg/mL, the ABTS· radical scavenging capacity of PFSI-4 was slightly higher than that of VC. When concentrations of 0.01~8 mg/mL were compared by the magnitude of the maximum ABTS· scavenging rate, there was almost no difference between VC and PFSI-1, PFSI-2, PFSI-3, or PFSI-4. It was demonstrated that all had some ABTS· radical scavenging ability.

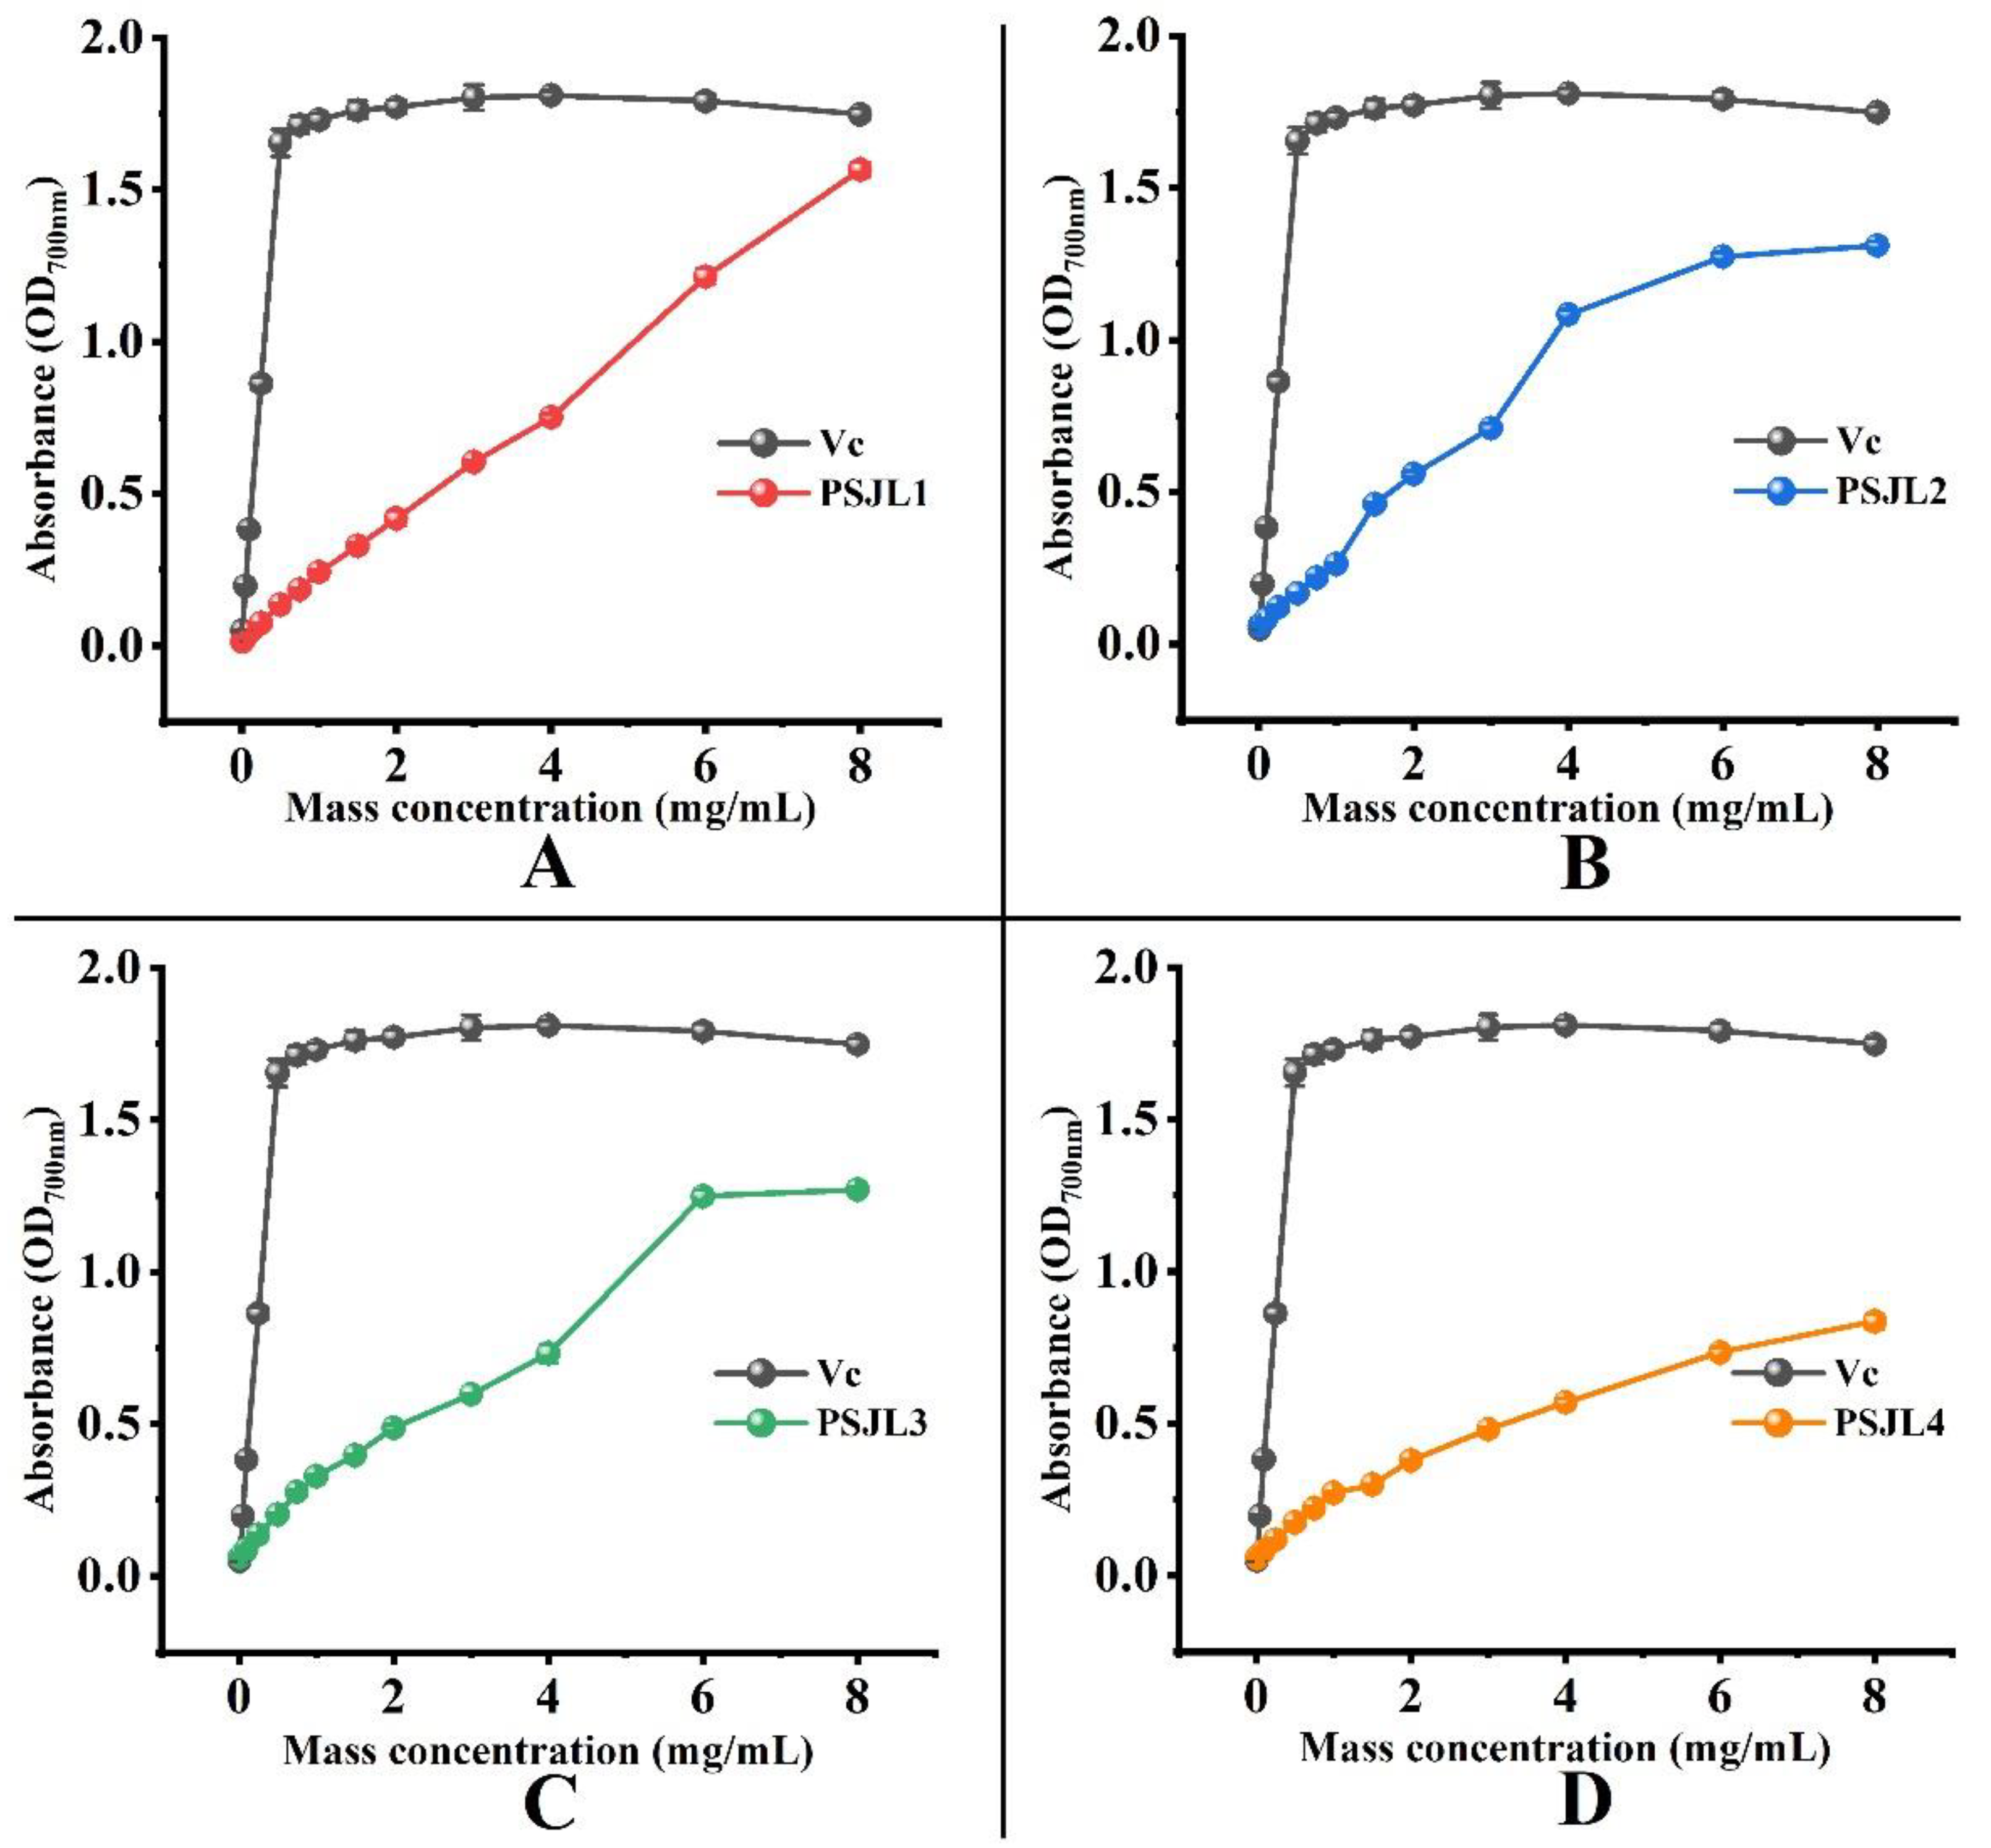
3.4.4. Analysis of Ferric-Reducing Antioxidant Power

As shown in Table 7 and Figure 12, the FRAP of PFSI-1, PFSI-2, PFSI-3, and PFSI-4 showed a dose-dependent relationship within the concentration of 0~8 mg/mL. When the concentration reached 6~8 mg/mL, PFSI-2 and PFSI-3 both had little difference in the maximum FRAP/When the concentration reached 8 mg/mL, PFSI-1 reached the maximum FRAP, which was similar to the VC comparison. In summary, the order of FRAP was PFSI-1 > PFSI-2 > PFSI-3 > PFSI-4.

4. Discussion

The polysaccharides from plant polysaccharides mostly belong to heterogeneous polysaccharides, and in order to obtain purer polysaccharides, there is a requirement to go through a series of separation and purification experiments such as deproteinization and decolorization. It was found that there is a certain gap between the activity of undeproteinated polysaccharides and the activity of deproteinated polysaccharides, and the deproteination process at a certain intensity has an enhancing function on the activation of polysaccharides [32,33,34]. The literature [35] reports that both undeproteinated and deproteinated polysaccharides have antioxidant potential, and both show a quantitative effect with increasing polysaccharide concentration. Some authors [36] have also found the antioxidant activity of undeproteinated polysaccharide to be higher than that of deproteinated polysaccharide, while others concluded that the antioxidant activity of deproteinated polysaccharide was higher than that of undeproteinated polysaccharide, pooling the results of the studies to show the inconsistency between the purity of the polysaccharide and the antioxidant action. The implications of different undeproteinization methods on antioxidation are discussed through the utilization of PFSI-1, PFSI-2, PFSI-3, and PFSI-4 obtained by different techniques.
Polysaccharides exist in two main forms, either as pure saccharide chains or as glycopeptides or glycoproteins formed by combining saccharides with proteins. PFSI which is a heteropolysaccharide, whose crude polysaccharide plays an active part in various diseases, may be the sugar component of the crude polysaccharide, the protein component of it, or the combination of saccharides with proteins, and therefore needs to be categorized and explored [37,38,39]. In this study, the in vitro antioxidant activity of PFSI obtained by three different deproteinization methods (Sevage method, papain method, and TCA method) was investigated using UMSE-extracted PFSI followed by graded alc ·OHolic purification. The in vitro antioxidant analysis of the results yielded that the different deproteinization methods severely reduced, to varying degrees, the in vitro antioxidant activity.
In the conventional Sevage method, the rate of protein removal is relatively inexpensive, and there is considerable polysaccharide loss due to repeated repetitions, and much of the organic solvent is wasted. Since most of the proteins removed by Sevage are free proteins, the glycoconjugate proteins are not destroyed. Despite maintaining favorable activity, it has reduced in vitro antioxidant activity compared to PFSI-1. Papaya proteolysis enzymatically dismantled the glycoconjugate proteins [40], thus partially reducing the bioactivity of Sophora polysaccharides and reducing the in vitro antioxidant activity compared to PFSI-1. TCA caused considerable destruction of the polysaccharide structure when subjected to severe loading conditions, leading to some differences in the in vitro antioxidant activity of the polysaccharide compared to PFSI-1, probably due to a modification of the chemical structure to a certain extent. In conclusion, the in vitro antioxidant activity of Sophora japonica polysaccharides without deproteinization was the best in terms of scavenging against oxidative effects [41]. In conclusion, the antioxidant activity of PFSI can be attributed to the combined effect of protein and polysaccharides. For better maintenance of the biological activity of the polysaccharides, it is preferable to develop PFSI antioxidant products without deproteinization, whereas if the product to be developed has to be low in protein, the Sevage method of deproteinization would be the preferable alternative.
The polysaccharide yields of PFSI extracted by UMSE under optimal conditions were observed in comparison with those obtained by Ying Zhou et al. [42] adopting the ultrasonic extraction method, Naxin Li et al. [43] adopting the ultrasonic extraction method, and Changshu Wu et al. [6]. We found that the extraction of PFSI by ultrasonic micro-coordinated extraction improved polysaccharide yields in this study. The extent to which polysaccharide yields were influenced by A (microwave power) > C (extraction time) > D (liquid-to material–ratio) > B (ultrasonic power) was also noted. The optimum process parameters for PFSI validation were acquired microwave power 500 W, ultrasonic power 270 W, extraction time 20 min, liquid-to-material ratio 95:1, and the PFSI extraction rate of the validation experiment reached 37.05% ± 0.12. The proposed technology can be applied to the extraction of PFSI by the ultrasonic microwave extraction method, thereby illustrating the operability of the optimized PFSI extraction process. In this respect, the extraction of PFSI by ultrasonic microwave extraction can provide a promising opportunity to upgrade the economic efficiency of FSI.

5. Conclusions

Notably, the extraction of PFSI by UMSE was first performed in this work, and the extraction process was optimized in terms of the response surface. The optimum extraction procedures were as follows: microwave power 500 W, ultrasonic power 265.887 W, extraction time 20.078 min, and liquid-to-material ratio 94.995:1. The PFSI samples were deproteinated by Sevage, papain, and TCA methods, and then were purified by dialysis and DEAE-52 cellulose column, respectively, and noted to have certain antioxidant effects with or without deproteination, along with the different effects of various deproteination techniques on the in vitro antioxidant potential of PFSI. A comprehensive comparison revealed that PFSI without deproteinization had the maximum in vitro free radical scavenging ability. It was found that the higher the concentration of polysaccharide, the greater the antioxidant capacity, and the stronger the free radical scavenging ability. Additional work should be carried out to provide theoretical and practical guidance for the further exploitation and beneficial application of PFSI antioxidant products.

Author Contributions

Data curation, W.Z.; Formal analysis, W.Z., C.Y. and Y.Z.; Funding acquisition, W.Z. and C.Y.; Investigation, W.Z., Y.Z. and D.Y.; Methodology, W.Z.; Project administration, W.Z., Y.Z. and D.Y.; Resources, C.Y. and D.Y.; Software, W.Z., C.Y. and D.Y.; Supervision, D.Y.; Visualization, W.Z.; Writing original draft, W.Z. and D.Y.; Reviewing and editing manuscript, W.Z. All authors have read and agreed to the published version of the manuscript.

Funding

This research received no external funding.

Institutional Review Board Statement

Not applicable.

Informed Consent Statement

Not applicable.

Data Availability Statement

Not applicable.

Conflicts of Interest

The authors declare no conflict of interest. The funders had no role in the design of the study; in the collection, analyses, or interpretation of data; in the writing of the manuscript; or in the decision to publish the results.

Sample Availability

Samples of the compounds are not available from the authors.

References

  1. Liu, Y.; Sun, Y.Y.; Huang, G.L. Preparation and antioxidant activities of important traditional plant polysaccharides. Int. J. Biol. Macromol. 2018, 111, 780–786. [Google Scholar] [CrossRef] [PubMed]
  2. Yin, M.; Zhang, Y.; Li, H. Advances in Research on Immunoregulation of Macrophages by Plant Polysaccharides. Front. Immunol. 2019, 10, 145. [Google Scholar] [CrossRef] [PubMed] [Green Version]
  3. Hu, D.J.; Cheong, K.L.; Zhao, J.; Li, S.P. Chromatography in characterization of polysaccharides from medicinal plants and fungi. J. Sep. Sci. 2013, 36, 1–19. [Google Scholar] [CrossRef] [PubMed]
  4. Tan, X.; Zhou, X.; Chen, H.G. Structure-activity relationship of plant polysaccharides. China J. Chin. Mater. Med. 2017, 42, 4104–4109. [Google Scholar] [CrossRef]
  5. Huang, H.L.; Huang, G.L. Extraction, separation, modification, structural characterization, and antioxidant activity of plant polysaccharides. Chem. Biol. Drug Des. 2022, 96, 1209–1222. [Google Scholar] [CrossRef]
  6. Ahmad, M.M.; Shahid Chatha, S.A.; Iqbal, Y.; Hussain, A.I.; Khan, I.; Xie, F. Recent trends in extraction, purification, and antioxidant activity evaluation of plant leaf-extract polysaccharides. Biofuels Bioprod. Biorefining 2022, 16, 1820–1848. [Google Scholar] [CrossRef]
  7. Huang, G.L.; Chen, F.; Yang, W.J.; Huang, H.L. Preparation, deproteinization and comparison of bioactive polysaccharides. Trends Food Sci. Technol. 2021, 109, 264–568. [Google Scholar] [CrossRef]
  8. Spagnuolo, D.; Martino, A.D.; Zammuto, V.; Minicante, S.A.; Spanò, A.; Manghisi, A.; Gugliandolo, C.; Morabito, M.; Genovese, G. Conventional vs. Innovative Protocols for the Extraction of Polysaccharides from Macroalgae. Sustainability 2022, 14, 5750. [Google Scholar] [CrossRef]
  9. Essa, H.; Fleita, D.; Rifaat, D.; Samy, S.; EI-Sayed, M. Towards optimizing the conventional and ultrasonic-assisted extraction of sulfated polysaccharides from marine algae. IOP Conf. Ser. Mater. Sci. Eng. 2017, 464, 012007. [Google Scholar] [CrossRef]
  10. Guo, Z.B.; Zhao, B.B.; Li, H.; Miao, S.; Zheng, B.D. Optimization of ultrasound-microwave synergistic extraction of prebiotic oligosaccharides from sweet potatoes (Ipomoea batatas L.). Innov. Food Sci. Emerg. Technol. 2019, 54, 51–63. [Google Scholar] [CrossRef]
  11. Li, F.; Li, Q.H.; Li, Y.L. Research progress on the determination of active ingredients of Sophora japonica. Inf. Tradit. Chin. Med. 2008, 25, 19–21. [Google Scholar] [CrossRef]
  12. Hu, A.H. Herbal evidence on the use of Sophora as a medicine. Chin. Tradit. Pat. Med. 2018, 40, 2587–2589. [Google Scholar] [CrossRef]
  13. Wang, S.L.; Yu, H.; Li, C.Q.; Ge, B.E.; Xi, G.Q.; Liu, S.Y. Preparation and Purification of Rutin and Quercetin from Sophora Japonica by Semi-Preparative HPLC. Food Sci. Technol. 2022, 47, 245–250. [Google Scholar] [CrossRef]
  14. Ouyang, L.L.; Hua, P. Research Progress in Active Components and Functions of the Flower Plants Homology of Medicine and Food. Jiangxi Chem. Ind. 2020, 36, 58–60. [Google Scholar] [CrossRef]
  15. Kang, W.Y.; Wu, X.H. Analysis of fatty acids from flower, bud and leaves of Sophora japonica L. By GC-MS. J. Henan Univ. (Med. Sci.) 2009, 28, 17–20. [Google Scholar] [CrossRef]
  16. Wu, C.S.; Zhu, G.S. Comparation on Extraction Methods of Polysaccharide from Sophora Japonica. Farm Prod. Process. 2018, 14, 36–38+41. [Google Scholar] [CrossRef]
  17. Chen, D.W.; Li, J.H.; Wang, F. Detemination of Volatile compoents in Flos Sophorae immaturus by GC-MS. West China J. Pharm. Sci. 2006, 5, 450–451. [Google Scholar] [CrossRef]
  18. Zhong, W.T.; Yang, C.M.; Zhang, Y.Z.; Liu, Y.M.; Yang, D.S. The Chemical Profiling and Anticancer Potential of Functional Polysaccharides from Flos Sophorae Immaturus. Molecules 2022, 27, 5978. [Google Scholar] [CrossRef]
  19. Koltover, V.K. Free Radical Timer of Aging: From Chemistry of Free Radicals to Systems Theory of Reliability. Curr. Aging Sci. 2017, 10, 12–17. [Google Scholar] [CrossRef]
  20. Ivanova, D.G.; Yankova, T.M. The free radical theory of aging in search of a strategy for increasing life span. Folia Med. 2013, 55, 33–41. [Google Scholar] [CrossRef]
  21. Viña, J. The free radical theory of frailty: Mechanisms and opportunities for interventions to promote successful aging. Free Radic. Biol. Med. 2019, 134, 690–694. [Google Scholar] [CrossRef] [PubMed]
  22. Chen, B.; You, W.L.; Huang, J.; Yu, Y. Isolation and antioxidant property of the extracellular polysaccharide from Rhodella reticulata. World J. Microbiol. Biotechnol. 2010, 26, 833–840. [Google Scholar] [CrossRef]
  23. Darsih, C.; Apriyana, W.; Hayati, S.N.; Rosyida, V.T. The elevation effect on water-soluble polysaccharides and DPPH free radical scavenging activity of Ganoderma lucidum K. IOP Conf. Ser. Mater. Sci. Eng. 2017, 172, 012010. [Google Scholar] [CrossRef]
  24. Zhang, L.; Gu, J.; Chen, Y.; Zhang, L. A study on four antioxidation effects of Lycium barbarum polysaccharides In vitro. Afr. J. Online 2013, 10, 6. [Google Scholar] [CrossRef] [PubMed] [Green Version]
  25. Liu, C.L.; Liu, H.Q.; Deng, Y.H.; Liu, M.L. Study on the purification and scavenging free radical activity of water-soluble polysaccharide of leave in Hippohae rhamnoides L. J. Chin. Med. Mater. 2006, 2, 151–154. [Google Scholar] [CrossRef]
  26. Fan, L.P.; Li, J.W.; Deng, K.Q.; Ai, L.Z. Effects of drying methods on the antioxidant activities of polysaccharides extracted from Ganoderma lucidum. Carbohydr. Polym. 2012, 87, 1849–1854. [Google Scholar] [CrossRef]
  27. Fuente, M.D. Effects of antioxidants on immune system ageing. Eur. J. Clin. Nutr. 2002, 56, S5–S8. [Google Scholar] [CrossRef]
  28. Ren, Y.; Bai, Y.; Zhang, Z.; Cai, W.; Del Rio Flores, A. The Preparation and Structure Analysis Methods of Natural Polysaccharides of Plants and Fungi: A Review of Recent Development. Molecules 2019, 24, 3122. [Google Scholar] [CrossRef] [Green Version]
  29. Shi, L. Bioactivities, isolation and purification methods of polysaccharides from natural products: A review. Int. J. Biol. Macromol. 2016, 92, 37–48. [Google Scholar] [CrossRef]
  30. Garcia-Vaquero, M.; Rajauria, G.; Doherty, J.V.; Sweeney, T. Polysaccharides from macroalgae: Recent advances, innovative technologies and challenges in extraction and purification. Food. Res. Int. 2017, 99, 1011–1020. [Google Scholar] [CrossRef]
  31. Ji, X.L.; Peng, Q.; Yuan, Y.P.; Shen, J.; Xie, X.Y.; Wang, M. Isolation, structures and bioactivities of the polysaccharides from jujube fruit (Ziziphus jujuba Mill.): A review. Food Chem. 2017, 227, 349–357. [Google Scholar] [CrossRef] [PubMed]
  32. Qin, K.; Liu, C.H.; Qi, Y.X.; Li, K. Evaluation of Antioxidant Activity of Polysaccharides from Tussilago farfara L. by Flow Injection Analysis. Asian J. Chem. 2014, 26, 3073–3076. [Google Scholar] [CrossRef]
  33. Xiang, J.F.; Xiang, Y.J.; Lin, S.M.; Xin, D.W.; Liu, X.Y.; Weng, L.L.; Chen, T.; Zhang, M.G. Anticancer effects of deproteinized asparagus polysaccharide on hepatocellular carcinoma In vitro and in vivo. Tumor Biol. 2013, 35, 3517–3524. [Google Scholar] [CrossRef]
  34. Li, S.F.; Wang, A.J.; Liu, L.N.; Tian, G.R.; Xu, F.F. Effect of deproteinization methods on the antioxidant activity of polysaccharides extracted from Lentinus edodes stipe. J. Food Meas. Charact. 2019, 13, 1382–1389. [Google Scholar] [CrossRef]
  35. Nie, L.R.; Hao, L.M.; Wang, T.T.; Liu, Y.; Zhang, L.M.; Lu, J.K.; Kang, C.C.; Cui, Y.; Han, P.P.; Jia, S.R. Antioxidant Activity of Crude Polysaccharides from Fomitopsis pinicola from Different Geographical Origins. J. Food Sci. 2019, 40, 60–68. [Google Scholar] [CrossRef]
  36. Liu, M.M.; Huang, Q.N.; Guo, L.Z. The Study on Extraction and Antioxidant Activity of Polysaccharides from Trametes robiniophila Murr. Edible Fungi China 2013, 32, 47–49. [Google Scholar] [CrossRef]
  37. Zong, A.Z.; Cao, H.Z.; Wang, F.S. Anticancer polysaccharides from natural resources: A review of recent research. Carbohydr. Polym. 2012, 90, 1395–1410. [Google Scholar] [CrossRef]
  38. Zhou, S.Y.; Huang, G.L.; Chen, G.Y. Extraction, structural analysis, derivatization and antioxidant activity of polysaccharide from Chinese yam. Food Chem. 2021, 361, 130089. [Google Scholar] [CrossRef]
  39. Cui, R.B.; Zhu, F. Ultrasound modified polysaccharides: A review of structure, physicochemical properties, biological activities and food applications. Trends Food Sci. Technol. 2021, 107, 491–508. [Google Scholar] [CrossRef]
  40. Liu, X.X.; Yan, Y.Y.; Liu, H.M.; Wang, X.D.; Qin, G.Y. Emulsifying and structural properties of polysaccharides extracted from Chinese yam by an enzyme-assisted method. LWT 2019, 111, 242–251. [Google Scholar] [CrossRef]
  41. Chen, L.; Huang, G.L.; Hu, J.C. Preparation, deproteinization, characterisation, and antioxidant activity of polysaccharide from cucumber (Cucumis saticus L.). Int. J. Biol. Macromol. 2017, 108, 408–411. [Google Scholar] [CrossRef]
  42. Zhou, Y.; Xia, X.K. Research on Extracting Technology of Polysaccharide from Flos Sophorae Immaturus. Hubei Agric. Sci. 2011, 50, 3161–3163. [Google Scholar] [CrossRef]
  43. Li, N.X.; Zhang, Y.P. Optimization of Ultrasound-assisted Polysaccharide Extraction from Flos Sophorae Immaturus by Central Composite Design-Response Surface Methodology. China Pharm. 2013, 16, 1809–1811. [Google Scholar] [CrossRef]
Figure 1. The procedure for extracting and purifying PFSI-1, PFSI-2, PFSI-3, and PFSI-4.
Agronomy 12 02740 g001
Figure 2. Effect of microwave power (A), ultrasonic power (B), particle diameter (C), liquid-to-material ratio (D), and extraction time (E) on the polysaccharide yield.
Agronomy 12 02740 g002
Figure 3. Effect of the interaction of ultrasonic and microwave power on polysaccharide yield. (A is the microwave power/(W), B is the ultrasonic power/(W)).
Agronomy 12 02740 g003
Figure 4. Effect of ultrasound power and extraction time interaction on polysaccharide yield. (A is the microwave power/(W), C is the extraction time/(min)).
Agronomy 12 02740 g004
Figure 5. Effect of the interaction of microwave power and liquid-to-material ratio on polysaccharide yield. (A is the microwave power/(W), D is the liquid-to-material ratio/(g/mL)).
Agronomy 12 02740 g005
Figure 6. Effect of the interaction of ultrasonic power and time on polysaccharide yield. (B is the ultrasonic power/(W), C is the extraction time/(min)).
Agronomy 12 02740 g006
Figure 7. Effect of the interaction of ultrasonic power and liquid-to-material ratio on polysaccharide yield. (B is the ultrasonic power/(W), D is the liquid-to-material ratio/(g/mL)).
Agronomy 12 02740 g007
Figure 8. Effect of the interaction of time and liquid-to-material ratio on polysaccharide yield. (C is the extraction time/(min), D is the liquid-to-material ratio/(g/mL)).
Agronomy 12 02740 g008
Figure 9. Comparison of the scavenging rate of DPPH· radicals by VC and PFSI. ((AD) represent samples of PFSI-1, PFSI-2, PFSI-3 and PFSI-4, respectively).
Agronomy 12 02740 g009
Figure 10. Comparison of the scavenging rate of ·OH radicals by VC and PFSI·. ((AD) represent samples of PFSI-1, PFSI-2, PFSI-3 and PFSI-4, respectively).
Agronomy 12 02740 g010
Figure 11. Comparison of the scavenging rate of ABTS· radicals by VC and PFSI. ((AD) represent samples of PFSI-1, PFSI-2, PFSI-3 and PFSI-4, respectively).
Agronomy 12 02740 g011
Figure 12. Comparison of FRAP by VC and PFSI. ((AD) represent samples of PFSI-1, PFSI-2, PFSI-3 and PFSI-4, respectively).
Agronomy 12 02740 g012
Table 1. Design of factors levels for RSM. (A is the microwave power/(W), B is the ultrasonic power/(W), C is the extraction time/(min), and D is the liquid-to-material ratio/(g/mL)).
LevelABCD
−12003001465:1
03004001880:1
14005002295:1
Table 2. RSM design and results. (A is the microwave power/(W), B is the ultrasonic power/(W), C is the extraction time/(min), and D is the liquid-to-material ratio/(g/mL). In addition, −1 is level 1; 0 is level 2; 1 is level 3.).
No.ABCDY/(%)
12003001880:128.26795
24003001880:132.46507
32005001880:127.97342
44005001880:132.78722
53004001465:129.04766
63004002265:130.80509
73004001495:131.21825
83004002295:133.28401
92004001865:130.32647
104004001865:131.02944
112004001895:129.13062
124004001895:137.66694
133003001480:127.30151
143005001480:129.60256
153003002280:133.58798
163005002280:133.42231
172004001480:128.01944
184004001480:133.07562
192004002280:133.07255
204004002280:134.60045
213003001865:127.97825
223005001865:130.95466
233003001895:132.05985
243005001895:128.08134
253004001880:133.93774
263004001880:134.68328
273004001880:135.24474
283004001880:133.95615
293004001880:133.45912
Table 3. The results of the ANOVA for the regression equation fitted the response content. (Note: R2 = 0.9692, Adj R2 = 0.9384, Pred R2 = 0.8474.).
SourceSum of SquaresdfMean SquareF-Valuep-ValueSignificance
Model186.321413.3112.97<0.0001**
A51.40151.4050.10<0.0001**
B0.112310.11230.10950.7456--
C35.05135.0534.16<0.0001**
D10.64110.6410.370.0062**
AB0.095110.09510.09270.7653--
AC3.1113.113.030.1035--
AD15.34115.3414.950.0017**
BC1.5211.521.480.2434--
BD12.09112.0911.790.0040**
CD0.023810.02380.02320.8812--
A25.2515.255.120.0401*
B245.25145.2544.11<0.0001**
C27.4517.457.260.0174*
D219.95119.9519.440.0006**
Residual14.36141.03
Lack of Fit12.37101.242.490.1964--
Pure Error1.9940.4966
Cor Total200.6828
R2 = 0.9284 Radj2 = 0.8569C.V.% = 3.20
Note: ** is highly significant, p < 0.01; * is significant difference, p < 0.05; -- represents not significant.
Table 4. DPPH free radical scavenging by PFSI-1, PFSI-2, PFSI-3, and PFSI-4. (Note: same lowercase letters indicate no significant difference between groups, different lowercase letters indicate a significant difference between groups, p < 0.05).
Mass
Concentration
(mg/mL)
DPPH· Free Radical Scavenging Rate
VCPFSI-1PFSI-2PFSI-3PFSI-4
0.0136.90% ± 0.49% d17.16% ± 2.66% f4.56% ± 0.22% h3.95% ± 0.25% i0.15% ± 0.15% i
0.0595.25% ± 0.18% c24.53% ± 1.65% e20.75% ± 2.84% g20.00% ± 2.41% h8.75% ± 1.09% h
0.195.34% ± 0.37% bc39.85% ± 1.51% d33.25% ± 0.90% f32.24% ± 0.65% g11.89% ± 1.28% g
0.2595.61% ± 0.18% b73.30% ± 0.64% c72.89% ± 1.22% e71.99% ± 1.18% f48.76% ± 2.15% f
0.595.13% ± 0.43% c85.39% ± 0.75% b82.23% ± 0.75% d81.90% ± 0.75% e70.90% ± 0.33% e
0.7595.55% ± 0.30% bc85.53% ± 0.61% b83.52% ± 0.32% cd83.23% ± 0.47% de83.52% ± 0.26% d
195.25% ± 0.09% bc86.28% ± 0.42% b84.78% ± 0.07% cd84.34% ± 0.18% cd90.96% ± 0.58% c
1.595.64% ± 0.11% b87.06% ± 0.54% b88.40% ± 3.38% b85.06% ± 0.90% cd90.99% ± 0.18% c
295.32% ± 0.16% bc88.19% ± 0.64% b86.79% ± 0.57% bc86.50% ± 0.61% bc93.80% ± 0.26% b
395.27% ± 0.39% bc87.89% ± 2.88% b88.73% ± 1.11% b88.37% ± 1.08% ab95.19% ± 0.22% ab
499.82% ± 0.09% a95.55% ± 0.82% a89.41% ± 0.50% b89.08% ± 0.61% a95.30% ± 0.11% ab
6100.02% ± 0.21% a95.97% ± 1.06% a89.95% ± 0.61% b89.12% ± 0.65% a95.59% ± 0.29% a
899.91% ± 0.09% a98.00% ± 2.05% a99.64% ± 0.83% a90.52% ± 0.75% a96.06% ± 0.44% a
Table 5. ·OH free radical scavenging by PFSI-1, PFSI-2, PFSI-3, and PFSI-4. (Note: same lowercase letters indicate no significant difference between groups, different lowercase letters indicate a significant difference between groups, p < 0.05).
Mass
Concentration
(mg/mL)
·OH Free Radical Scavenging Rate
VCPFSI-1PFSI-2PFSI-3PFSI-4
0.010.96% ± 0.30% f13.85% ± 1.84% h1.74% ± 0.09% d3.34% ± 0.32% j1.06% ± 0.09% g
0.057.32% ± 1.01% e14.26% ± 3.19% h3.36% ± 0.31% d4.00% ± 0.78% ij2.06% ± 0.49% g
0.118.56% ± 1.27% d17.49% ± 2.92% gh3.79% ± 1.92% d4.83% ± 1.55% ij4.75% ± 1.46% f
0.2544.50% ± 0.59% c18.66% ± 1.86% g4.18% ± 1.44% d5.26% ± 0.89% i4.63% ± 0.83% f
0.589.33% ± 0.71% b19.48% ± 1.14% g8.37% ± 0.03% c6.93% ± 0.72% h6.75% ± 1.06% ef
0.7599.86% ± 0.18% a20.95% ± 1.04% fg8.61% ± 0.37% c15.33% ± 1.06% g8.47% ± 0.37% de
199.66% ± 0.22% a23.19% ± 1.33% f9.25% ± 2.57% c17.20% ± 0.81% f10.61% ± 0.80% d
1.599.92% ± 0.08% a29.39% ± 0.97% e11.85% ± 1.71% c27.44% ± 0.23% e10.61% ± 1.57% d
299.80% ± 0.12% a34.92% ± 1.18% d12.19% ± 1.34% c29.80% ± 0.17% d15.76% ± 0.37% c
399.92% ± 0.08% a39.74% ± 1.62% c18.45% ± 1.07% b33.07% ± 1.24% c19.08% ± 1.54% b
499.80% ± 0.09% a41.60% ± 1.39% c33.26% ± 1.01% a48.03% ± 0.75% b21.00% ± 1.52% b
6100.00% ± 0.22% a46.49% ± 3.96% b33.57% ± 1.13% a56.43% ± 0.60% a24.37% ± 2.60% a
899.84% ± 0.35% a53.24% ± 1.35% a33.60% ± 1.80% a56.57% ± 1.09% a24.66% ± 0.26% a
Table 6. ABTS· free radical scavenging by PFSI-1, PFSI-2, PFSI-3, and PFSI-4. (Note: same lowercase letters indicate no significant difference between groups, different lowercase letters indicate a significant difference between groups, p < 0.05).
Mass
Concentration
(mg/mL)
ABTS· Free Radical Scavenging Rate
VCPFSI-1PFSI-2PFSI-3PFSI-4
0.0146.36% ± 1.71%b31.11% ± 1.43% d26.81% ± 0.47% d32.11% ± 0.08% b26.05% ± 0.32% e
0.0599.51% ± 0.49% a84.99% ± 1.43% c99.45% ± 0.16% bc99.92% ± 0.16% a100.08% ± 0.08% c
0.199.76% ± 0.49% a99.54% ± 0.68% b100.62% ± 0.16% a99.76% ± 0.24% a100.16% ± 0.40% c
0.2599.45% ± 0.43% a99.49% ± 0.86% b100.08% ± 0.78% ab99.92% ± 0.40% a100.40% ± 0.40% c
0.599.33% ± 0.31% a100.00% ± 0.23% ab100.23% ± 0.23% ab100.16% ± 0.16% a100.56% ± 0.32% c
0.7599.33% ± 0.55% a100.68% ± 1.60% a100.16% ± 0.16% ab100.08% ± 0.32% a101.45% ± 0.72% b
199.39% ± 0.37% a99.94% ± 0.40% ab98.75% ± 1.09% c99.36% ± 2.94% a101.29% ± 0.80% b
1.599.82% ± 0.31% a99.71% ± 0.17% b99.92% ± 0.16% ab100.08% ± 0.08% a101.37% ± 0.16% b
299.57% ± 0.06% a99.54% ± 0.91% b99.77% ± 0.23% b99.84% ± 0.08% a102.17% ± 0.24% a
399.08% ± 0.55% a100.06% ± 0.51% ab99.92% ± 0.16% ab100.00% ± 0.01% a102.65% ± 0.48% a
499.20% ± 0.43% a100.17% ± 0.40% ab100.23% ± 0.47% ab100.00% ± 0.48% a102.57% ± 0.40% a
699.63% ± 0.37% a99.60% ± 0.29% b100.70% ± 0.47% a100.08% ± 0.32% a102.89% ± 0.24% a
899.63% ± 0.37% a99.24% ± 1.52% b100.00% ± 0.23% ab99.84% ± 0.08% a99.36% ± 0.08% d
Table 7. Total reduction capacity of PFSI-1, PFSI-2, PFSI-3, and PFSI-4. (Note: same lowercase letters indicate no significant difference between groups, different lowercase letters indicate a significant difference between groups, p < 0.05).
Mass
Concentration
(mg/mL)
Absorbance (OD700nm)
VCPFSI-1PFSI-2PFSI-3PFSI-4
0.010.049 ± 0.001 k0.014 ± 0.001 l0.060 ± 0.001 l0.062 ± 0.002 l0.058 ± 0.001 l
0.050.196 ± 0.002 j0.027 ± 0.002 l0.068 ± 0.001 l0.072 ± 0.001 l0.071 ± 0.002 k
0.10.382 ± 0.005 i0.041 ± 0.001 k0.083 ± 0.001 k0.088 ± 0.001 k0.081 ± 0.001 k
0.250.862 ± 0.021 h0.075 ± 0.001 j0.121 ± 0.004 j0.136 ± 0.001 j0.118 ± 0.001 j
0.51.654 ± 0.045 e0.135 ± 0.002 i0.166 ± 0.001 i0.202 ± 0.002 i0.175 ± 0.001 i
0.751.713 ± 0.030 f0.185 ± 0.001 h0.218 ± 0.005 h0.277 ± 0.004 h0.222 ± 0.002 h
11.731 ± 0.020 ef0.243 ± 0.005 g0.263 ± 0.001 g0.328 ± 0.004 g0.272 ± 0.004 g
1.51.762 ± 0.030 cd0.329 ± 0.008 f0.460 ± 0.003 f0.398 ± 0.001 f0.298 ± 0.004 f
21.772 ± 0.022 bc0.419 ± 0.024 e0.558 ± 0.010 e0.487 ± 0.009 e0.379 ± 0.003 e
31.803 ± 0.043 ab0.605 ± 0.006 d0.710 ± 0.014 d0.597 ± 0.001 d0.480 ± 0.007 d
41.811 ± 0.015 a0.751 ± 0.012 c1.084 ± 0.015 c0.731 ± 0.030 c0.569 ± 0.013 c
61.792 ± 0.023 ab1.215 ± 0.026 b1.274 ± 0.013 b1.249 ± 0.020 b0.734 ± 0.017 b
81.748 ± 0.019 a1.566 ± 0.025 a1.311 ± 0.012 a1.270 ± 0.008 a0.836 ± 0.024 a
Publisher’s Note: MDPI stays neutral with regard to jurisdictional claims in published maps and institutional affiliations.

