Article

Research on the Classification of Complex Wheat Fields Based on Multi-Scale Feature Fusion

1
College of Mechanical and Electronic Engineering, Northwest A&F University, Yangling 712100, China
2
Apple Mechanized Research Base, Yangling 712100, China
3
Shannxi Key Laboratory of Apple, Yangling 712100, China
4
State Key Laboratory of Soil Erosion and Dryland Farming on Loess Plateau, Yangling 712100, China
*
Author to whom correspondence should be addressed.
Agronomy 2022, 12(11), 2658; https://doi.org/10.3390/agronomy12112658
Submission received: 24 September 2022 / Revised: 21 October 2022 / Accepted: 24 October 2022 / Published: 27 October 2022
(This article belongs to the Special Issue Agricultural Environment and Intelligent Plant Protection Equipment)

Abstract

:
This study uses UAV multi-spectral remote sensing images to carry out ground object classification research in complex wheat field scenes with diverse varieties. Compared with satellite remote sensing, the high spatial resolution remote sensing images obtained by UAVs at low altitudes are rich in detailed information. In addition, different varieties of wheat have different traits, which makes it easy to misclassify categories in the process of semantic segmentation, which reduces the classification accuracy and affects the classification effect of ground object. In order to effectively improve the classification accuracy of ground object in complex wheat field scenes, two Multi-Scale U-Nets based on multi-scale feature fusion are proposed. Multi-Scale U-Net1 is a network model that adds a multi-scale feature fusion block in the copy process between U-Net encoding and decoding. Multi-Scale U-Net2 is a network model that adds a multi-scale feature fusion block before U-Net inputs an image. Firstly, the wheat field planting area of Institute of Water-saving Agriculture in Arid Areas of China (IWSA), Northwest A&F University was selected as the research area. The research area was planted with a variety of wheat with various types of traits, and some traits were quite different from one another. Then, multi-spectral remote sensing images of different high spatial resolutions in the study area were obtained by UAV and transformed into a data set for training, validation, and testing of network models. The research results showed that the overall accuracy (OA) of the two Multi-Scale U-Nets reached 94.97% and 95.26%, respectively. Compared with U-Net, they can complete the classification of ground object in complex wheat field scenes with higher accuracy. In addition, it was also found that within the effective range, with the reduction of the spatial resolution of remote sensing images, the classification of ground object is better.

1. Introduction

The planting structure of wheat fields reflects the spatial distribution information of wheat fields in an area or production unit [1]. Obtaining the planting structure information of wheat fields efficiently and accurately is of great significance for wheat field yield estimation, agricultural condition monitoring and agricultural structure adjustment [2]. In the field of scientific research, due to the large differences in the research objectives of experts in different fields, the complex planting structure of wheat experimental fields, the large variety of wheat varieties, and the large differences in traits, it is difficult for the ground object classification method based on machine learning to meet the current needs. With the rapid development of UAV remote sensing technology and deep learning methods, the method of semantic segmentation of UAV remote sensing images based on fully convolutional neural network technology is increasingly applied to the research of farmland object classification [3,4,5,6,7]. The deep learning method can quickly and accurately realize the classification of ground object in complex wheat field planting areas and provide technical support for wheat field yield estimation, agricultural condition monitoring, and agricultural structure adjustment.
Remote sensing technologies include satellite remote sensing and UAV remote sensing. Satellite remote sensing can obtain large-scale remote sensing images of land parcels, and UAV remote sensing can obtain small-scale land remote sensing images with higher spatial resolution [8]. Based on farmland satellite remote sensing images, there have been many studies using traditional machine learning methods and deep learning-based semantic segmentation methods to realize the classification of farmland objects, which have achieved a good classification effect. For example, Al Awar B et al. [9] took a planting area in the Bekaa Valley of Lebanon, where the main crops are wheat and potato, as the research area, used Sentinel-1 and Sentinel-2 satellite remote sensing images as dataset, and adopted Support Vector Machine (SVM), Random Forest (RF), Classification and Regression Tree (CART) and Back Propagation Network (BPN) for crop classification research. The results found that the overall accuracy (OA) of these four classification models can reach more than 95%. Zheng Wenhui et al. [10] selected the Loess Plateau mulching dry agricultural planting area as the research area based on Google Earth Engine cloud platform data and Landsat-8 reflectivity data, using Random Forest (RF), Support Vector Machine (SVM), Decision Tree (DT), and Minimum Distance (MD) to classify farmland objects. The result showed that under the condition of artificial feature engineering, the overall accuracy (OA) of machine learning object classification can reach 95.5%. Song Tingqiang et al. [11] selected a crop planting area in Gaomi City, Shandong Province as the research area based on the GF-2 satellite high spatial resolution panchromatic images and multispectral images, and adopted an improved Multi-temporal Spatial Segmentation Network (MSSN) to realize the classification of farmland objects. The experimental result showed that the Pixel Accuracy (PA) of the model on the test set was 95%, the F1 score was 0.92, and the Intersection over Union (IoU) was 0.93. Xu Lu et al. [12] selected a farmland in Guangping County of Hebei Province and Luobei County of Heilongjiang Province as the research areas based on the high spatial resolution remote sensing image of Gaofen-2 (GF-2), firstly adopted the Depthwise Separable Convolution U-Net (DSCU-net) to realize the segmentation of the entire image, and then the extended Multi-channel Rich Convolutional Feature network (RCF) to further delineate the boundaries of cultivated land plots. The experimental result showed that the overall accuracy (OA) of classification in the two regions was around 90%. In summary, both the traditional machine learning algorithm and the semantic segmentation algorithm based on the fully convolutional neural network can show satisfactory results in the classification of agricultural satellite remote sensing images.
Compared with satellite remote sensing, UAV remote sensing has the characteristics of high flexibility, short period, less environmental impact, and easy access to small-scale agricultural remote sensing data [13]. In addition, satellite remote sensing can only obtain remote sensing image data with meter-level spatial resolution, while UAV remote sensing can obtain remote sensing image data with high spatial resolution at centimeter level. Therefore, UAV agricultural remote sensing image data has more detailed information, and it is easy to misclassify in the process of image classification, which brings great challenges to agricultural land classification to a certain extent. For such agricultural remote sensing images with more detailed information, due to the complexity and fragmentation of ground object and the surrounding environment at high spatial resolution, the accuracy of traditional classification methods has been unable to meet the standards of agricultural problems. The classification method based on convolutional neural network can effectively learn image features related to the target category [14]. Therefore, most of the current researches on the high spatial resolution UAV agricultural remote sensing images use the classification method based on the fully convolutional neural network to conduct ground object classification research. For example, Chen Yuqing et al. [15] used a remote sensing image of a farmland in Kaifeng City, Henan Province as a dataset. The dataset contained farmland and two other types of ground object. The improved Deeplab V3+ model was used for land classification. The experimental result showed that the Mean Pixel Accuracy (MPA) can reach 97.16%, which effectively improves the information extraction accuracy of farmland edges and small farmlands. Qinchen Yang et al. [16] used UAV remote sensing images of an agricultural planting area in the Hetao irrigation area of Inner Mongolia as a dataset. The dataset contained five types of land objects, including roads, green plants, cultivated land, wasteland and others. Two semantic segmentation algorithms, SegNet and FCN, and traditional Support Vector Machine (SVM) were used to conduct ground object classification research. The result showed that SegNet and FCN are significantly better than the traditional Support Vector Machine (SVM) in terms of accuracy and speed, and their Mean Pixel Accuracy (MPA) were 89.62% and 90.6%, respectively. Yang Shuqin et al. [17] used the UAV multispectral remote sensing images of Shahao Canal Irrigation Area in Hetao Irrigation District of Inner Mongolia Autonomous Region as a dataset. The dataset contained sunflower, zucchini, corn and other four types of ground object; the improved Deeplab V3+ and Support Vector Machine (SVM) to classify farmland objects were used. The result showed that the Mean Pixel Accuracy (MPA) of the improved Deeplab V3+ was 93.06%, which is 17.75% higher than the Support Vector Machine (SVM). To sum up, in terms of high spatial resolution UAV agricultural remote sensing images with more detailed information, the semantic segmentation model based on deep learning has satisfactory results in the classification of farmland objects.
The above-mentioned farmland object classification based on satellite remote sensing or UAV remote sensing was all carried out between different types of objects. So far, there have been few relevant reports on the classification of similar crops with different traits. At present, with the continuous advancement of breeding work, different varieties of crops of the same type may be planted in the same area, and some varieties possess large differences in traits. Especially in the classification of farmland objects on the high spatial resolution remote sensing images of UAVs, it is very easy to cause similar farmlands with large differences in traits to be incorrectly classified. Based on UAV remote sensing technology and the deep learning classification method of multi-scale feature fusion, this study carried out ground object classification for complex wheat fields planted with different varieties of wheat and with large differences in traits between some wheats.

2. Materials and Methods

As shown in Figure 1, the current research is the workflow of complex wheat field classification research based on multi-scale feature fusion. This study selects a suitable research area and conducts field surveys in the research area to understand the distribution information of ground object. The experimental plan is designed according to the results of the field investigation. First, the location information of Ground Control Points (GCPs) is collected in the study area for geometric correction of the later remote sensing image stitching process. Then, the UAV (DJ Inc., Shenzhen, China) flight parameters are set within the time range required by the experimental plan to collect multi-spectral remote sensing images in the study area. The collected remote sensing images and ground control points information are imported into Pix4Dmapper 4.5.6 (Pix4D Inc., Prilly, Switzerland) for image stitching and preprocessing, and finally the remote sensing images of the entire study area required by this study are generated. Since the remote sensing images collected by the UAV are multi-spectral data, in order to facilitate the later image labeling, it is necessary to fuse the five single-band images to generate a single image with five bands (that is, a five-channel remote sensing image). Next is labeling the image. Since it is difficult to directly import the entire remote sensing image into the deep learning network for model training, this study cropped the remote sensing images and their Labels to obtain regular small-sized images and Labels, and divided the cropped images and Labels into datasets, for training, validation, and testing of deep learning models. This research proposes two Multi-Scale U-Nets based on U-Net by adding a multi-scale feature fusion block, and selects Confusion Matrix (CM), Pixel Accuracy (PA), and Recall, F1-Score, and Intersection over Union (IoU) as the five indicators to evaluate the classification accuracy of the models in three categories (wheat, road and background). Three indicators (Overall Accuracy (OA), Mean Intersection over Union (MIoU), and Frequency Weighted Intersection over Union (FWIoU)) were used to comprehensively evaluate the models.

2.1. Study Area

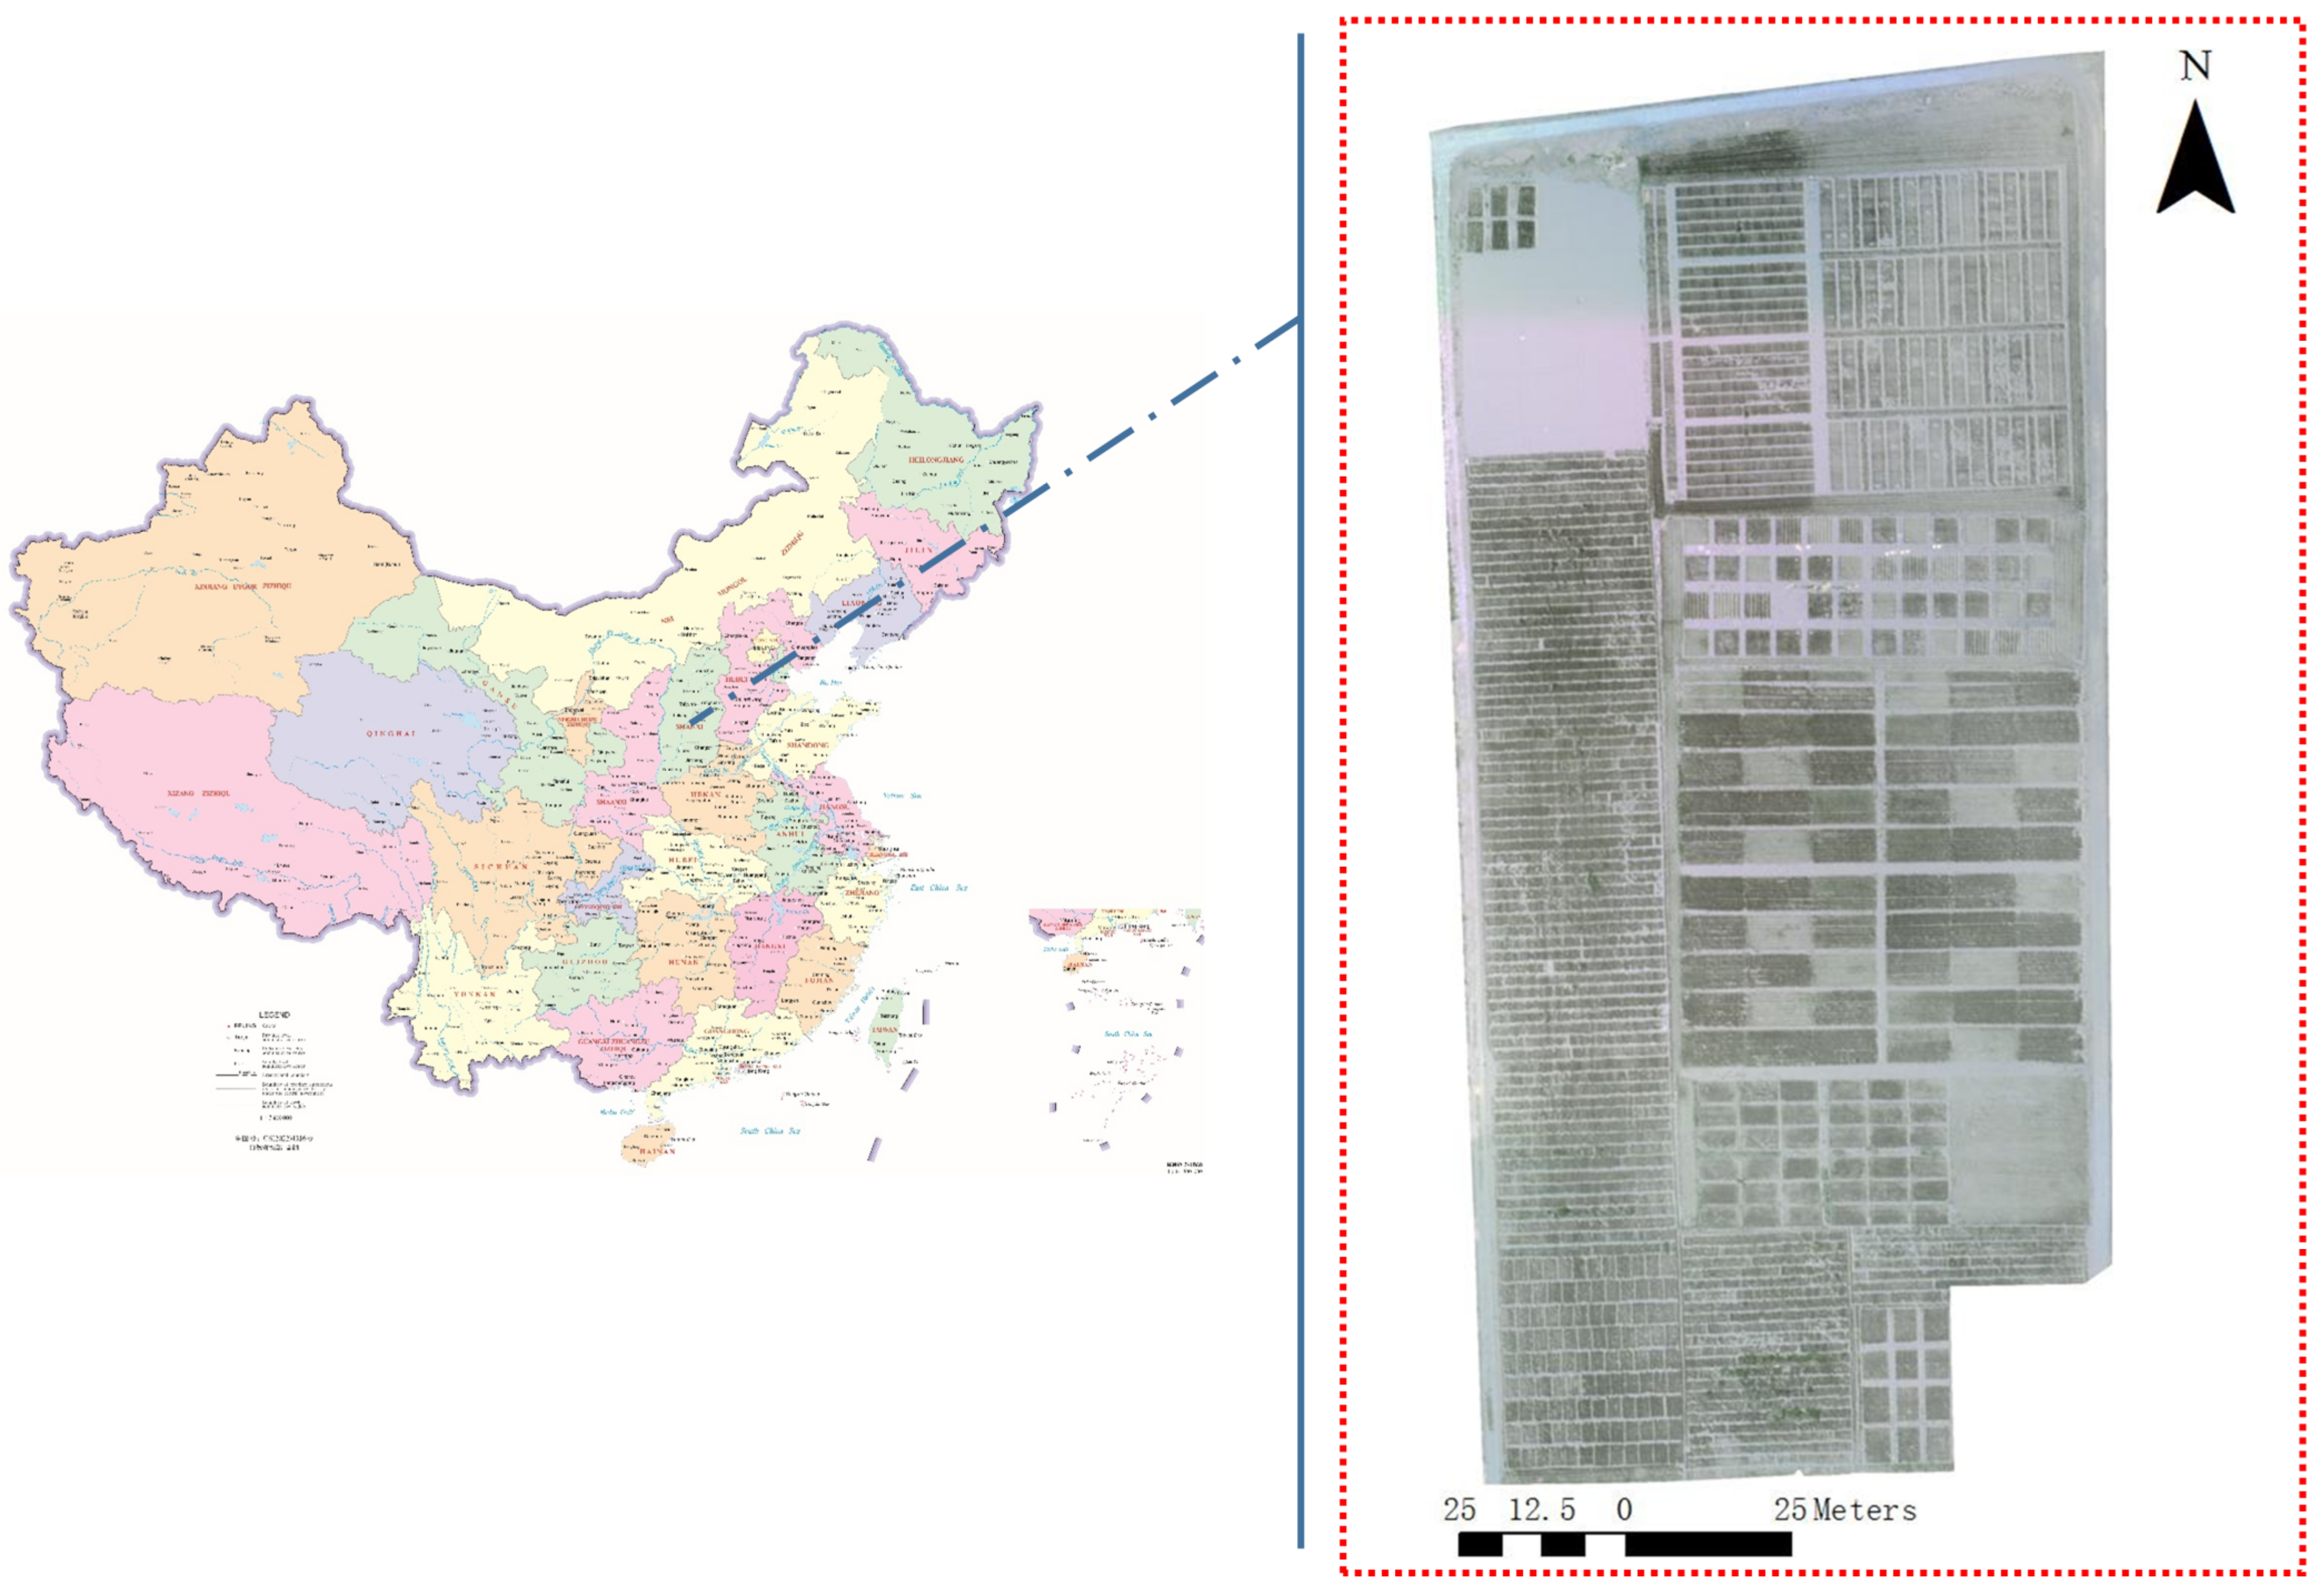
The study area is located in the Institute of Water-saving Agriculture in Arid Areas of China (IWSA), Northwest A&F University, as shown in Figure 2. The study area is located in Yangling Demonstration Zone, Xianyang City, Shaanxi Province (34°17′51.11″ N–34°17′58.72″ N, 108°4′4.10″ E–108°4′7.64″ E). This area has fertile soil, relatively flat terrain, and an altitude between 560 and 790 m. It belongs to the semi-humid and semi-arid climate in the warm temperate zone. It has obvious continental monsoon climate characteristics such as warm and windy spring, hot and rainy summer, and cold and dry winter. The annual average temperature is about 12 °C, the frost-free period is 211 days, the average annual sunshine hours amount to about 2163 h, and the average annual precipitation is 635 mm. The area of the study area is about 17,553 m2, including 14 varieties of wheat, some of which have great differences in wheat traits.

2.2. Data Acquisition and Preprocessing

2.2.1. UAV Acquires Multispectral Images with Different High Spatial Resolution

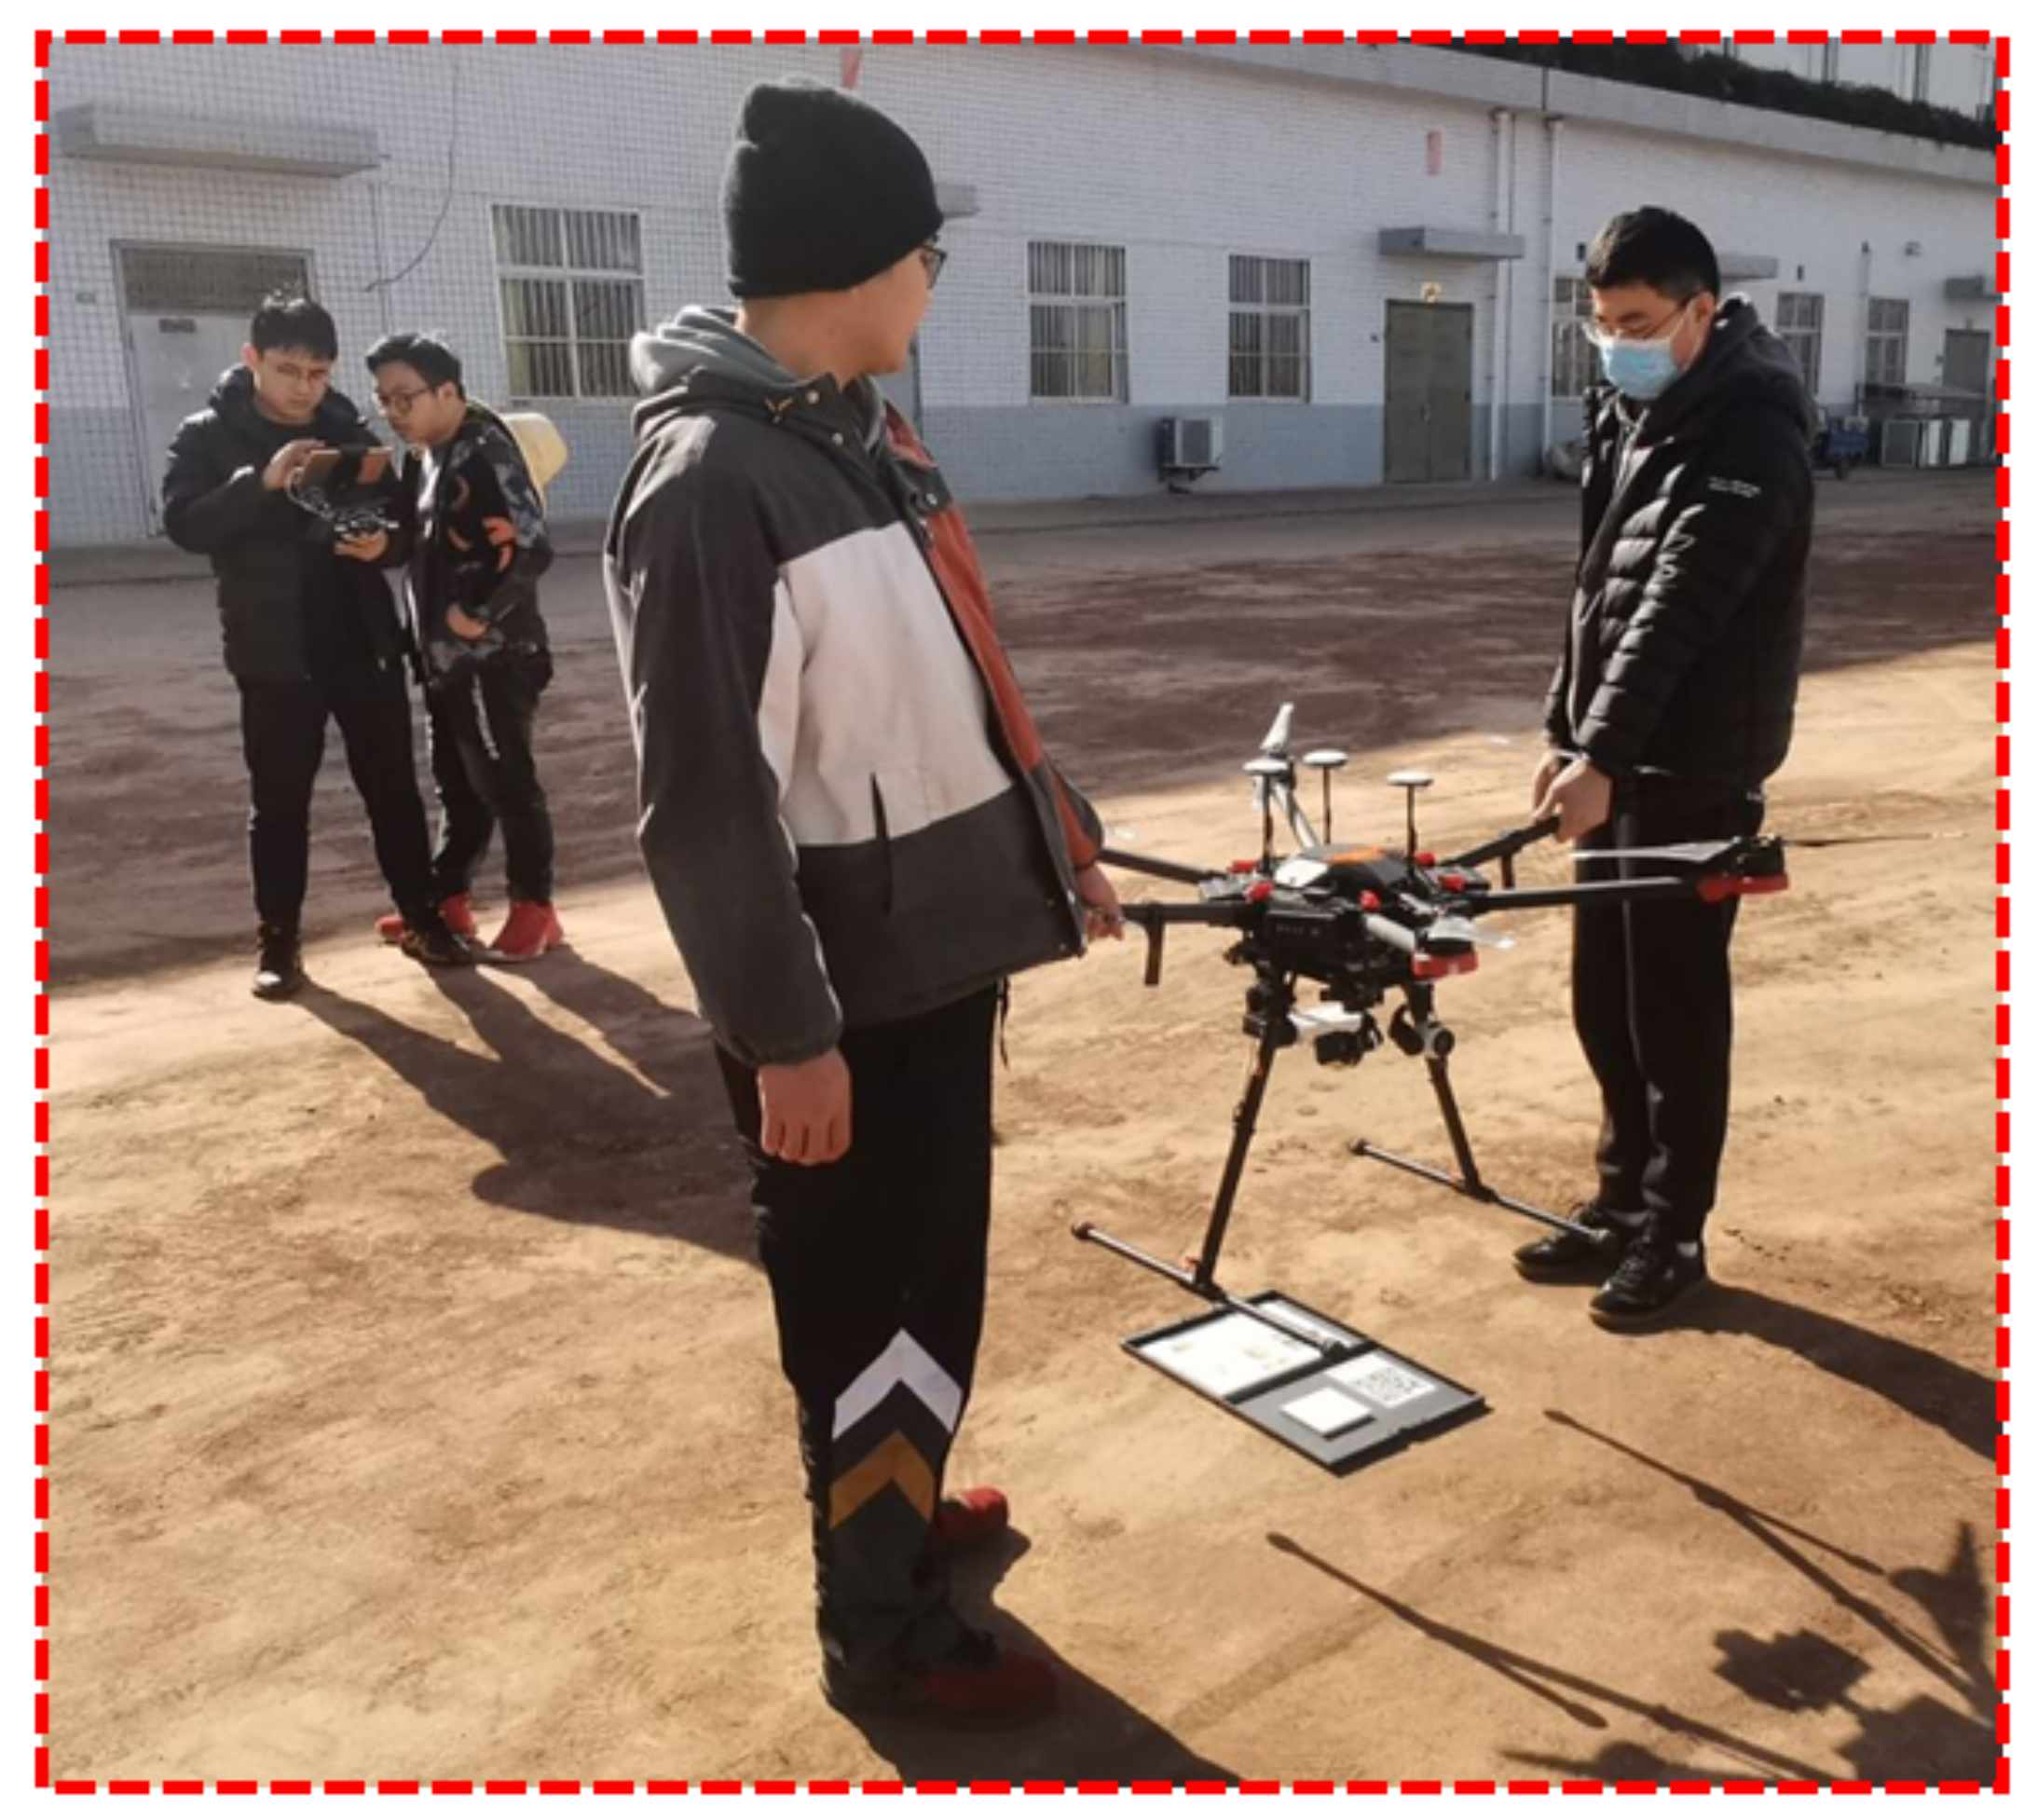
In this study, UAV remote sensing data collection was conducted on 2 May 2022 at the Institute of Water-saving Agriculture in Arid Areas of China (IWSA), Northwest A&F University. As shown in Figure 3, it is a UAV remote sensing image data acquisition system, which consists of a DJI M600 PRO UAV (DJ Inc., Shenzhen, China), battery packs (DJ Inc., Shenzhen, China), a RedEdge-MX Five-channel multispectral camera (MicaSense Inc., Seattle, WC, USA), a FLIR Duo Pro Thermal Infrared Imager (FLIR Systems Inc., Washington, DC, USA), and a Zenmuse X3 visible camera (DJ Inc., Shenzhen, China). The system customizes a gimbal that can carry the above three cameras at the same time to meet the requirements of the three cameras working independently. The system is equipped with four battery packs to meet the long-term work requirements. This study mainly uses the RedEdge-MX Five-channel multispectral camera to obtain remote sensing image data. Some parameters of the RedEdge-MX Five-channel multispectral camera are shown in Table 1.
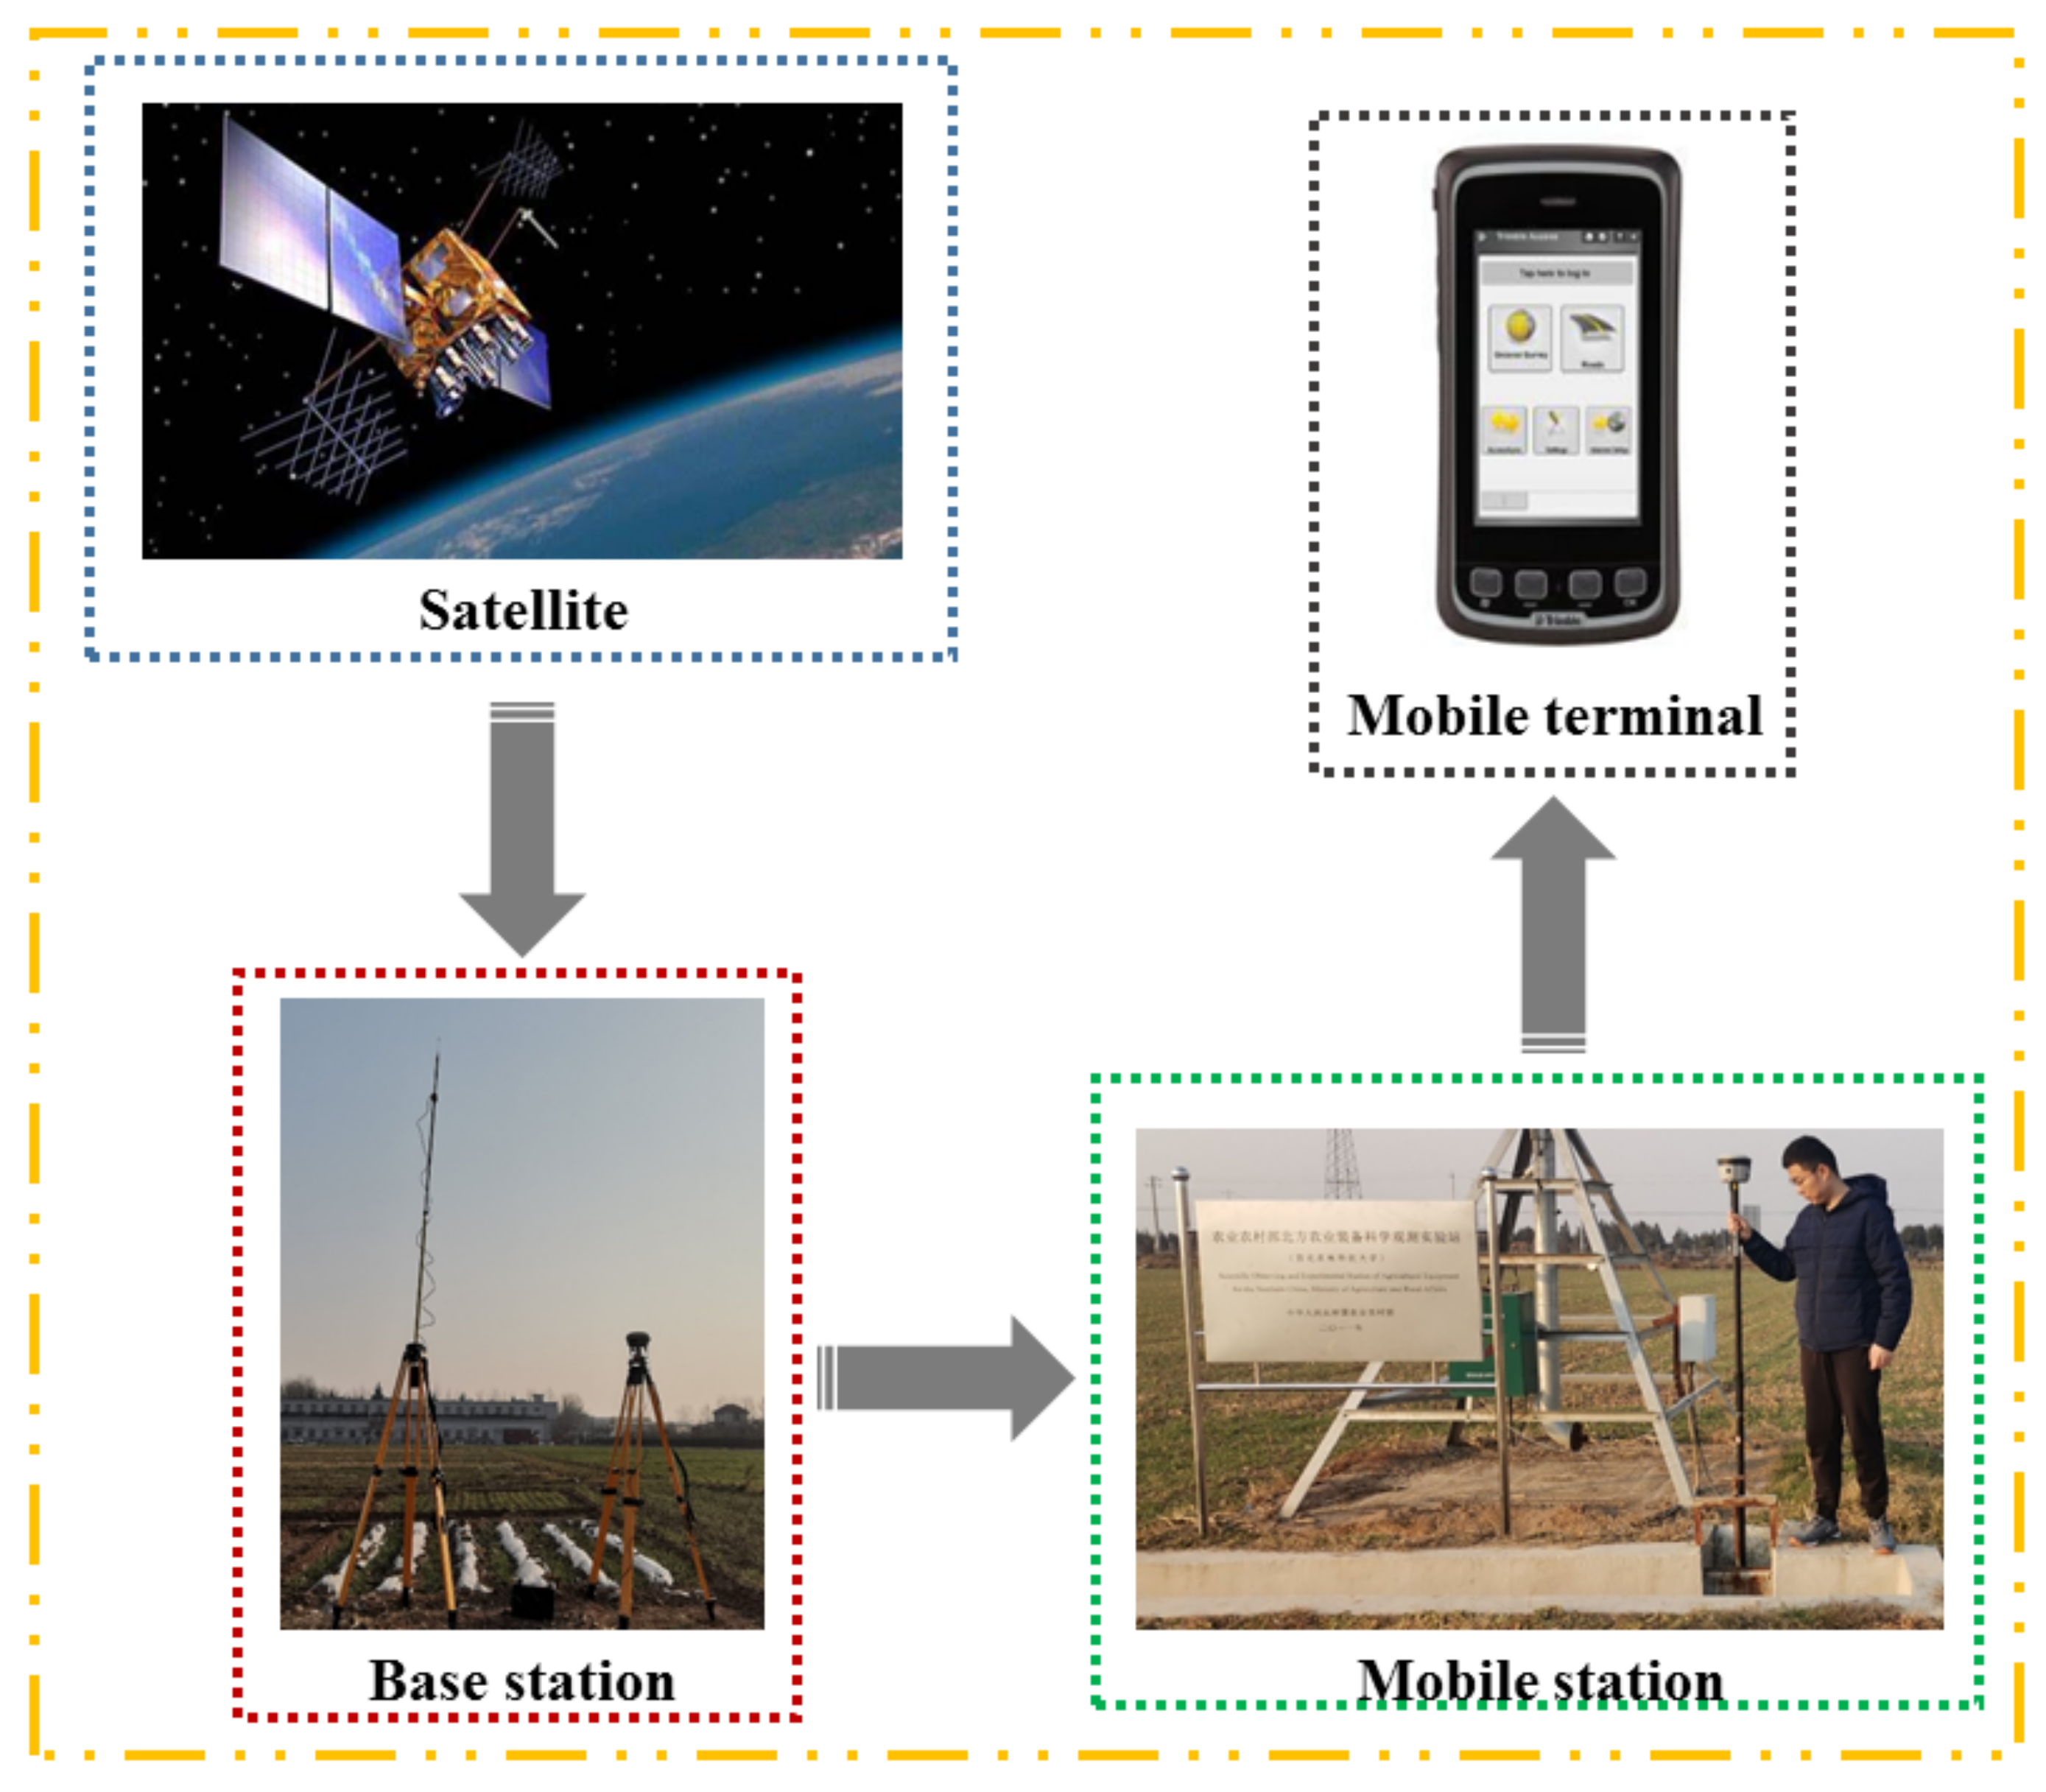
Ground Control Points (GCPs) are important data source for geometric correction and geolocation of UAV remote sensing images [18]. As shown in Figure 4, this study uses the Trimble GNSS system to obtain the coordinates of the GCPs. The Trimble GNSS system includes a Trimble R8 GNSS receiver (Trimble Inc., Westminster, CO, USA), a Trimble R2 GNSS receiver (Trimble Inc., Westminster, CO, USA), a radio, an antenna (Trimble Inc., Westminster, CO, USA), a lead-acid battery (Trimble Inc., Westminster, CO, USA), a mobile terminal (Trimble Inc., Westminster, CO, USA), and a connection line (Trimble Inc., Westminster, CO, USA). The Trimble R8 GNSS receiver, radio, antenna, lead-acid battery, and connecting line form a base station for receiving satellite signals and also for sending signals to the Trimble R2 GNSS receiver. The Trimble R2 GNSS receiver is also called a mobile station, which can receive the signal of the base station. The mobile station sends the coordinate information of the base station and the relative position information between itself and the base station to the mobile terminal, and the mobile terminal obtains the coordinate information of the mobile station after calculation and processing. The base station is set up in the research area in advance, and the coordinate information of each GCP is obtained by using the mobile station and mobile terminal. Therefore, the coordinate accuracy of the GCPs completely depends on the accuracy of the base station and mobile station. The accuracy of the GCPs obtained in this research is controlled at the millimeter level, which fully meets the accuracy requirements of this experiment.
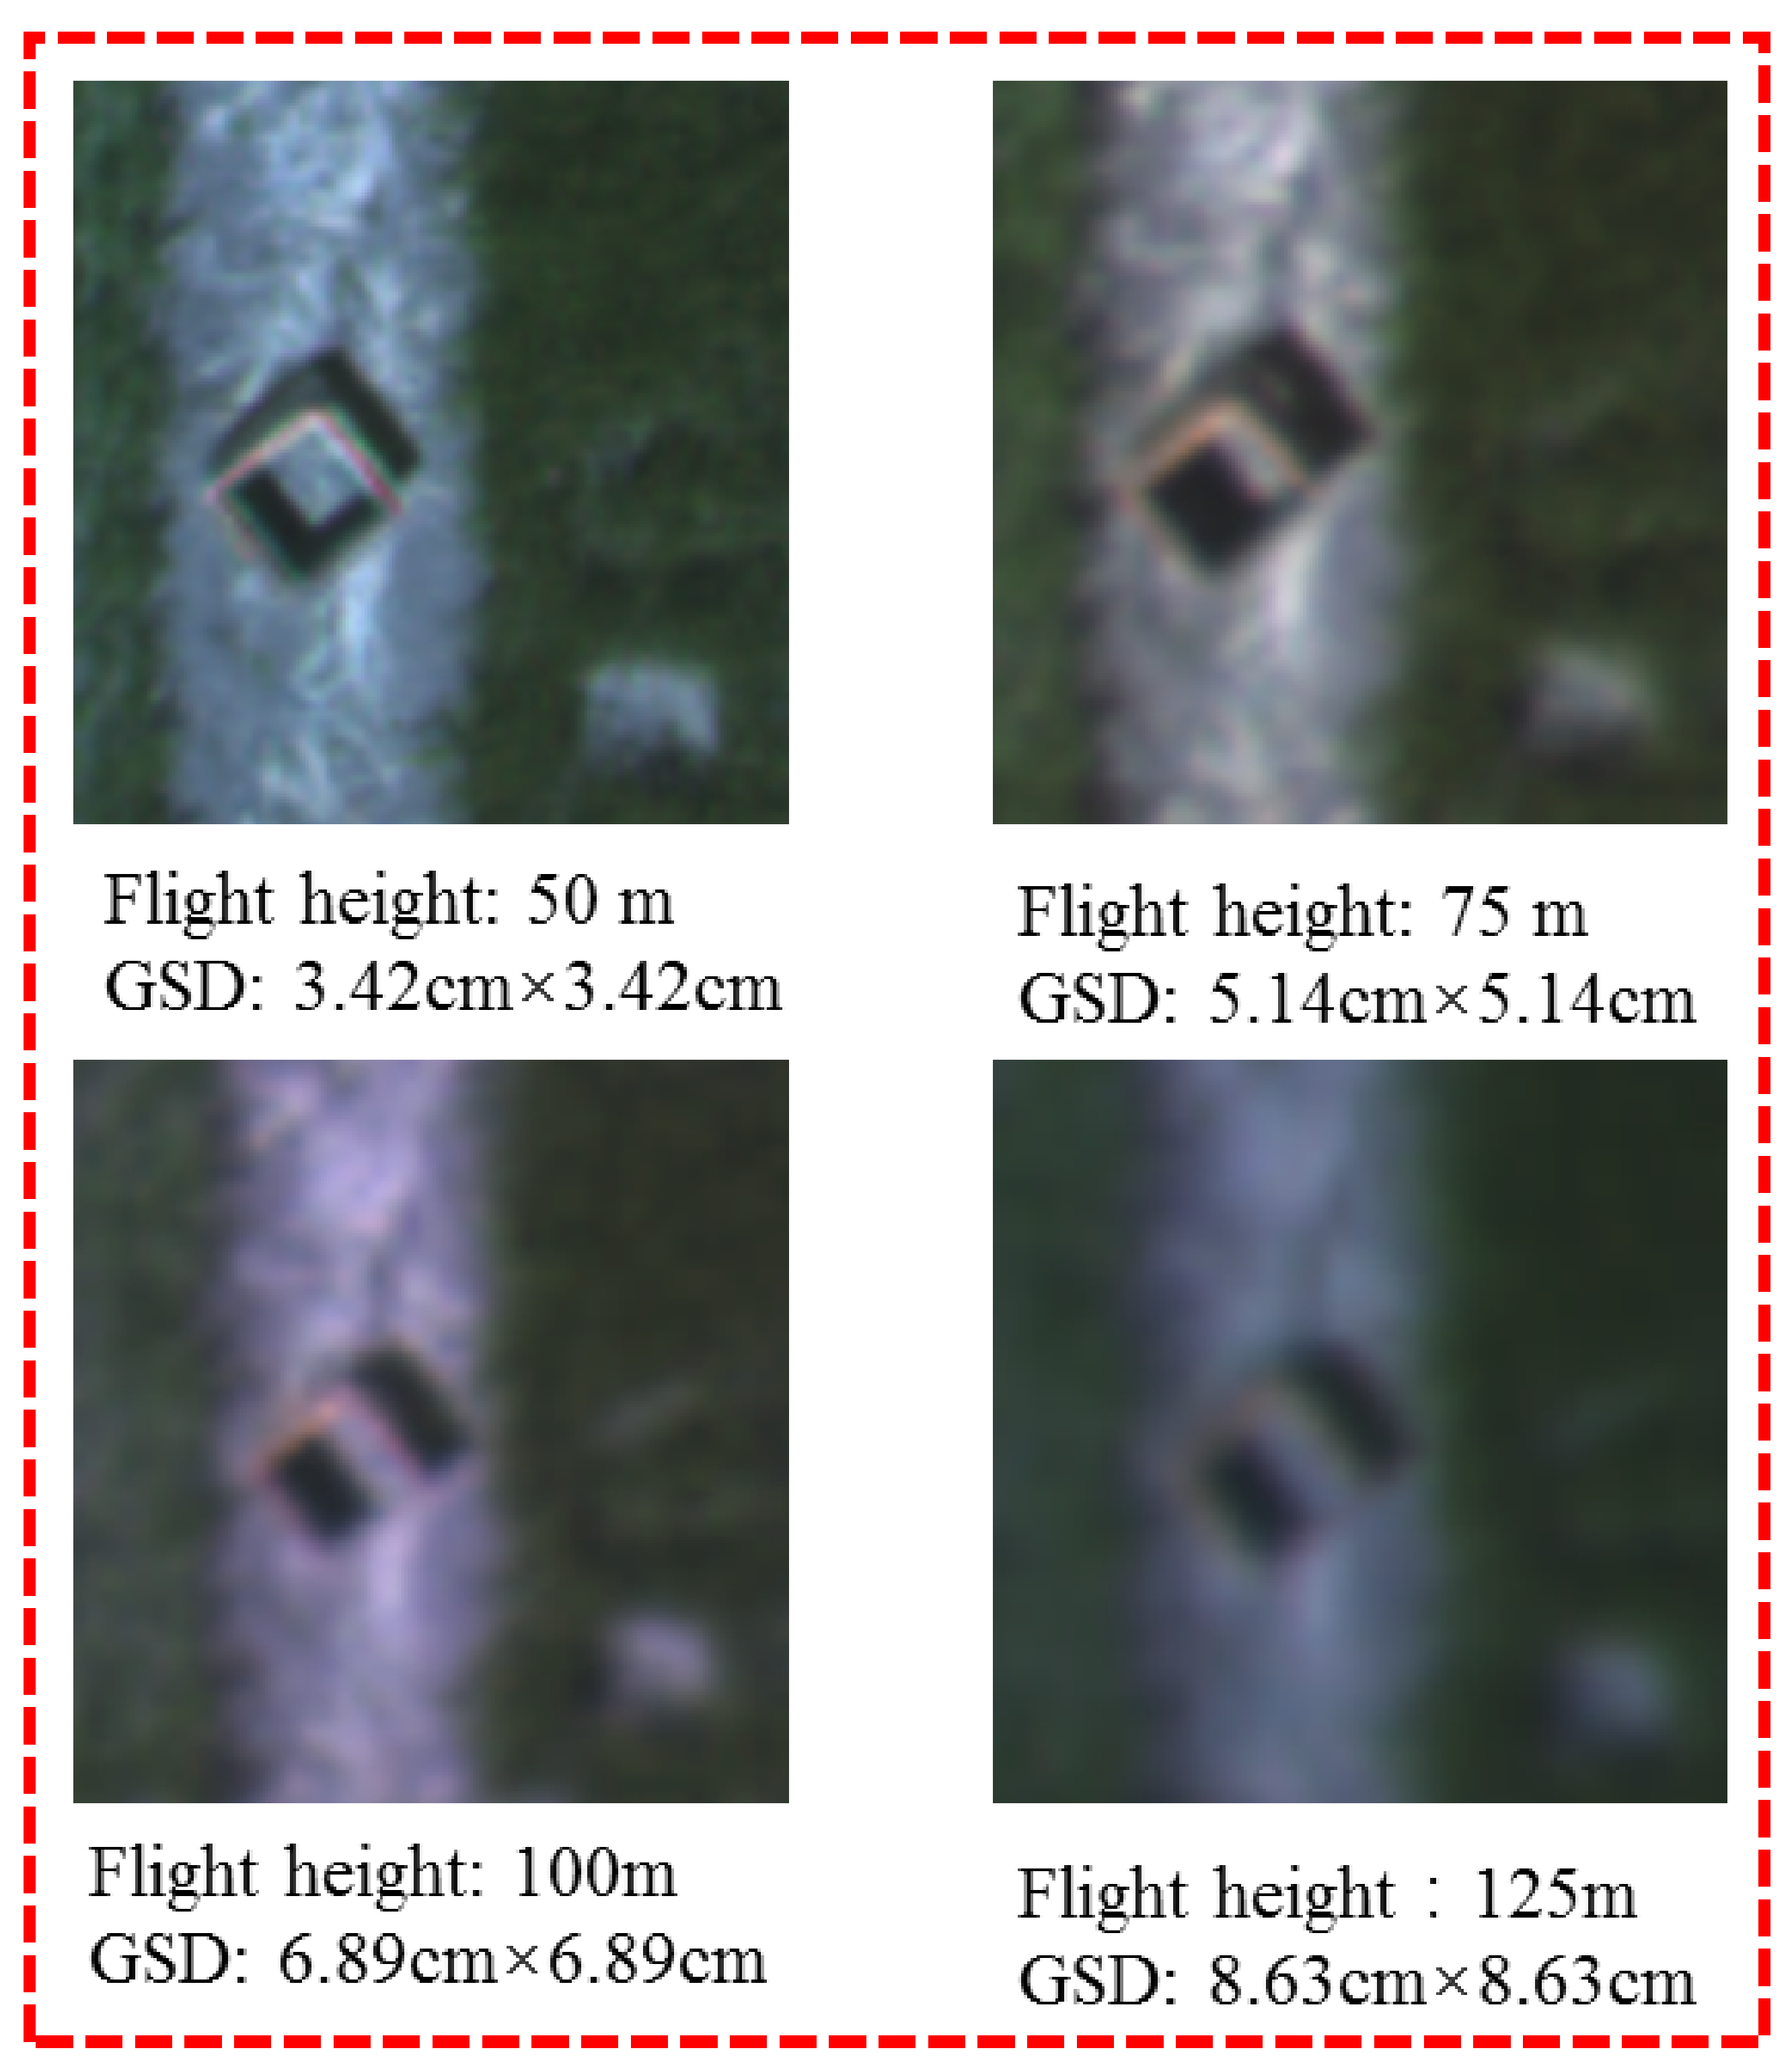
Before the UAV collecting of remote sensing image data, it is necessary to perform radiometric calibration of the multispectral camera. As shown in Figure 5, this experiment conducted radiometric calibration in an open field in the study area at around 11:40 noon on 2 May 2022. After the radiometric calibration, the remote sensing image data was collected according to the expected experimental plan. The spatial resolution of remote sensing images refers to the size of the ground range from the perspective of pixels, that is, a pixel in a remote sensing image represents the area of the ground [19]. As shown in Formula (1), it is the calculation formula of image spatial resolution, in which the flying height of the UAV is inversely proportional to the spatial resolution of the image, and the remote sensing images with different spatial resolutions can be obtained by changing the different flying heights of the UAV. As shown in Table 2, it is the flight parameters of the UAV. According to these parameters, the remote sensing images of four different spatial resolutions required in this study are obtained. Figure 6 is the local detail map of remote sensing images with different spatial resolutions.
S = D · f H ,
where D is the Ground Sampling Distance (GSD), S is the Image Spatial Resolution, H is the flying height, ƒ is the focal length.

2.2.2. Multispectral Image Data Processing and Dataset Making

The remote sensing images obtained by UAV are a large number of small-sized pictures taken according to the overlap rate. In order to facilitate the later labeling work, the remote sensing images obtained by the UAV are subjected to stitching, geometric correction, and other related preprocessing operations. The remote sensing image preprocessing software used includes Pix4Dmapper 4.5.6 (Pix4D Inc., Prilly, Switzerland) and ENVI 5.3 (EVIS Inc., Los Angeles, CA, USA). As shown in Figure 7, the usage of ENVI 5.3 performs band fusion on the remote sensing image and crops out the study area.
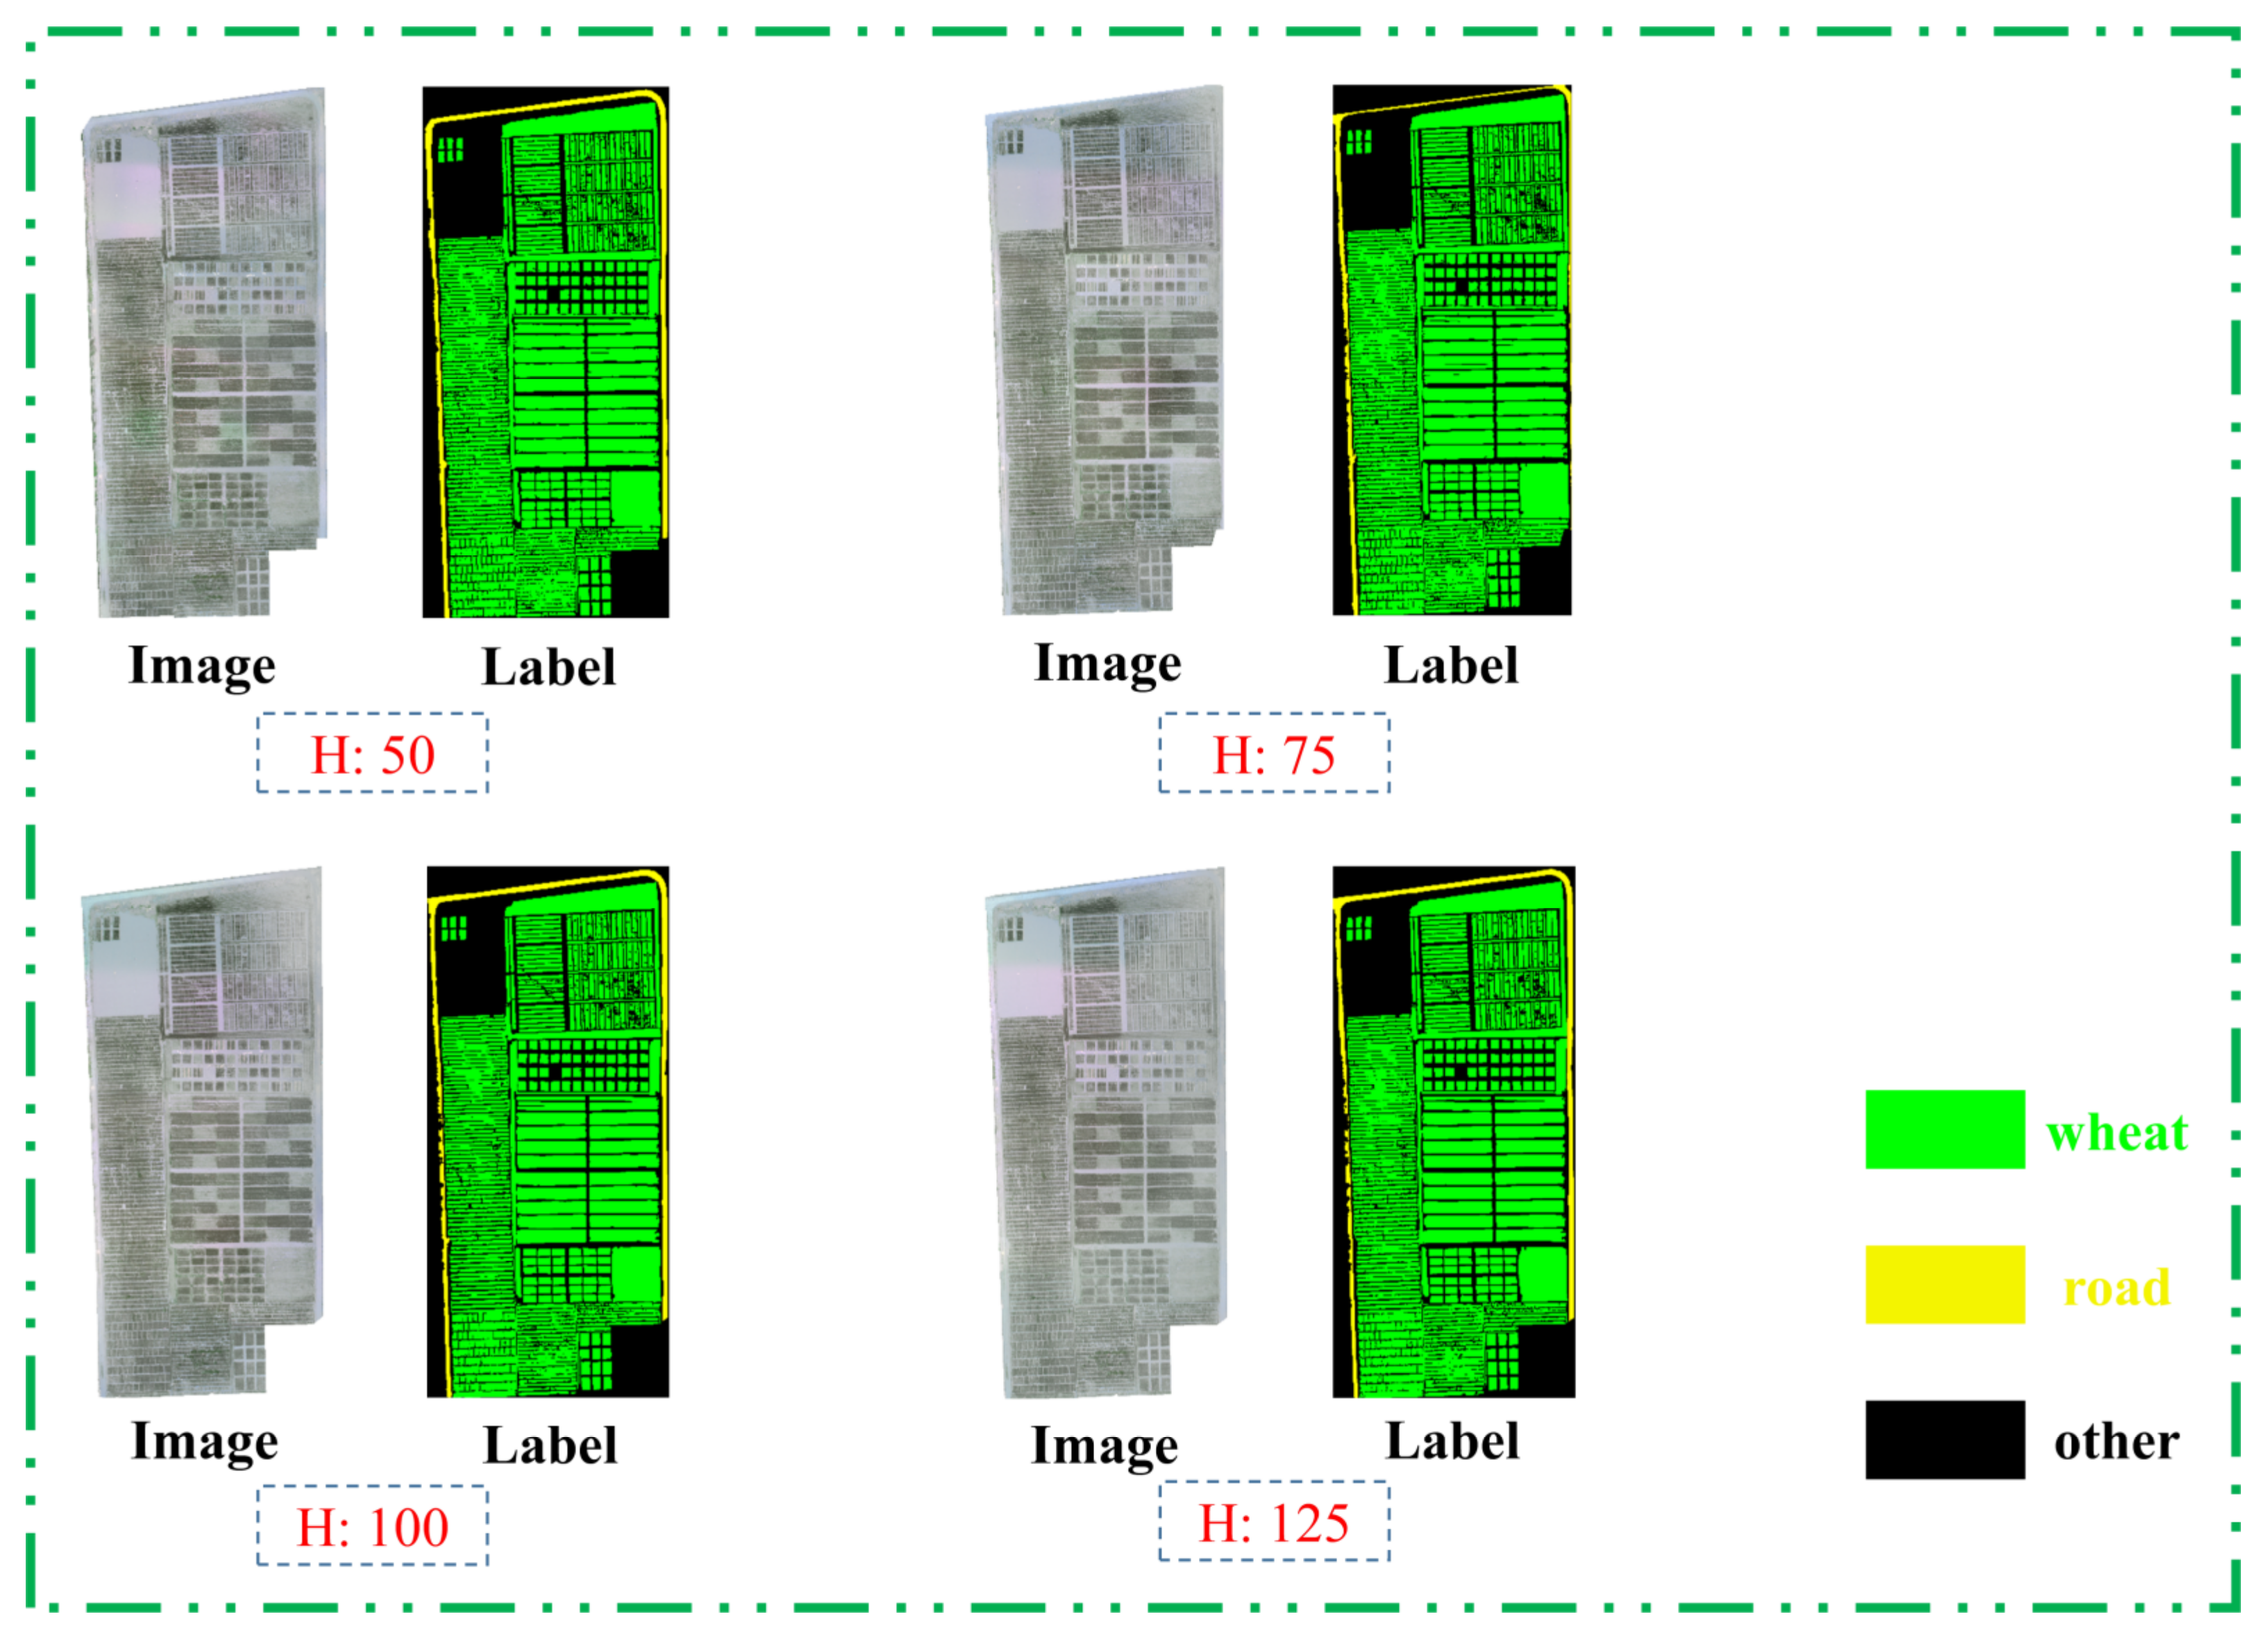
After band fusion and cropping, the remote sensing image of the study area is obtained. Compared with the RGB image, the image contains 5 channels, namely Blue band, Green band, Red band, Near infrared band, and Red-edge band. Traditional RGB image labeling methods often use Labelme 4.5.7 (MIT, Cambridge, MA, USA) and other software for labeling, but the remote sensing images with 5 channels in this study cannot be labelled by Labelme. Therefore, the remote sensing images in this study were labelled with ENVI Classic 5.3 (EVIS Inc., Los Angeles, CA, USA). Figure 8 are Labels obtained after labeling. If the above images and their Labels are directly input into the deep learning network, it will cause memory overflow, so these images and labels need to be cropped into small-size images and input into the network. As shown in Figure 9, this study adopts the sliding window cropping method for image cropping, and uses Python language to write a program for cropping multispectral remote sensing images and their labels. The multispectral images and their Labels are cropped by presetting the size of the slider window and the overlap ratio. In this study, a slider window of 256 × 256 and an overlap rate of 20% were used to crop images of the study area and their labels to obtain the dataset of this study.
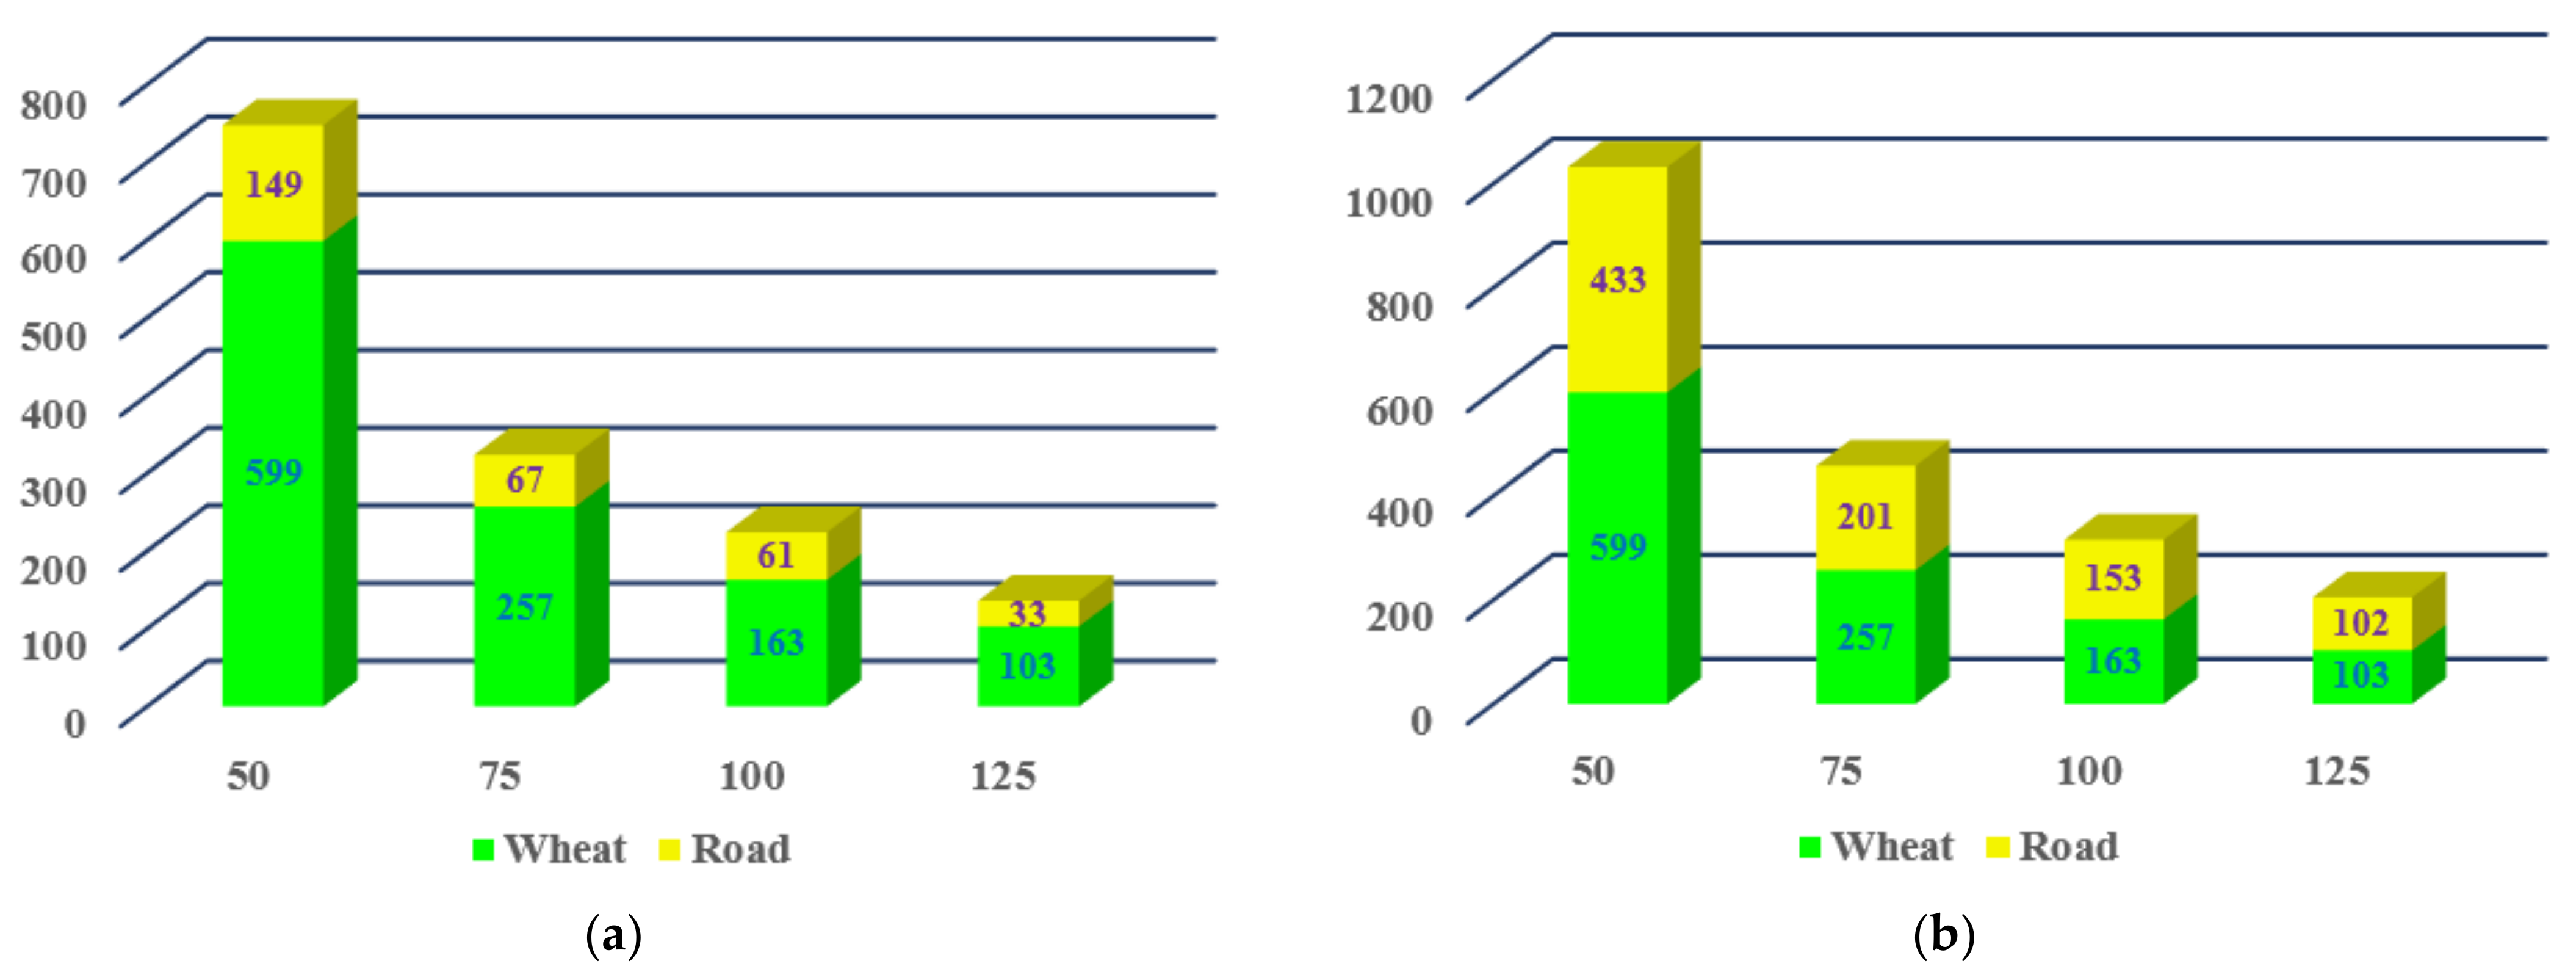
The basic configuration of the dataset used in this study is shown in Figure 10 and Table 3. From Figure 10a, it can be observed that the number of wheat and road categories is unbalanced after data cropping. Unbalanced categories will cause the model learning effect to be biased towards the party with the larger category, which seriously affects the generalization ability of the model [20]. Therefore, this study balances the dataset categories by extracting images with road categories under different slider overlap ratios. As shown in Figure 10b, the number of dataset categories after data balance is relatively balanced. After the dataset is balanced, the dataset is integrated into the training set, validation set and test set according to the ratio of 60%, 20% and 20%. On the one hand, data augmentation can make the model have sufficient dataset for training, and on the other hand, it can improve the generalization ability of the model [21]. This study performs data augmentation on the training and validation set by horizontally flipping, vertically flipping, and diagonally mirroring the multispectral images and their labels. The dataset division before and after data enhancement is shown in Table 3, with 4828 training images and labels, 1608 validation images and labels, and 402 test images and labels.

2.2.3. Construction and Training of Complex Wheat Field Classification Model

Fully convolutional neural networks have shown satisfactory performance in high-resolution image classification [22,23,24]. The dataset used in this study is high spatial resolution, with more detailed information on image features. Since the dataset consists of remote sensing images with four spatial resolutions, the image features are more abundant, and image features can be extracted from convolutional blocks of different scales, and image features at different scales can be fused to improve the accuracy of image semantic segmentation [25,26,27]. Therefore, this study uses the method of multi-scale feature fusion to build models based on U-Net to conduct ground object classification research on complex wheat fields.
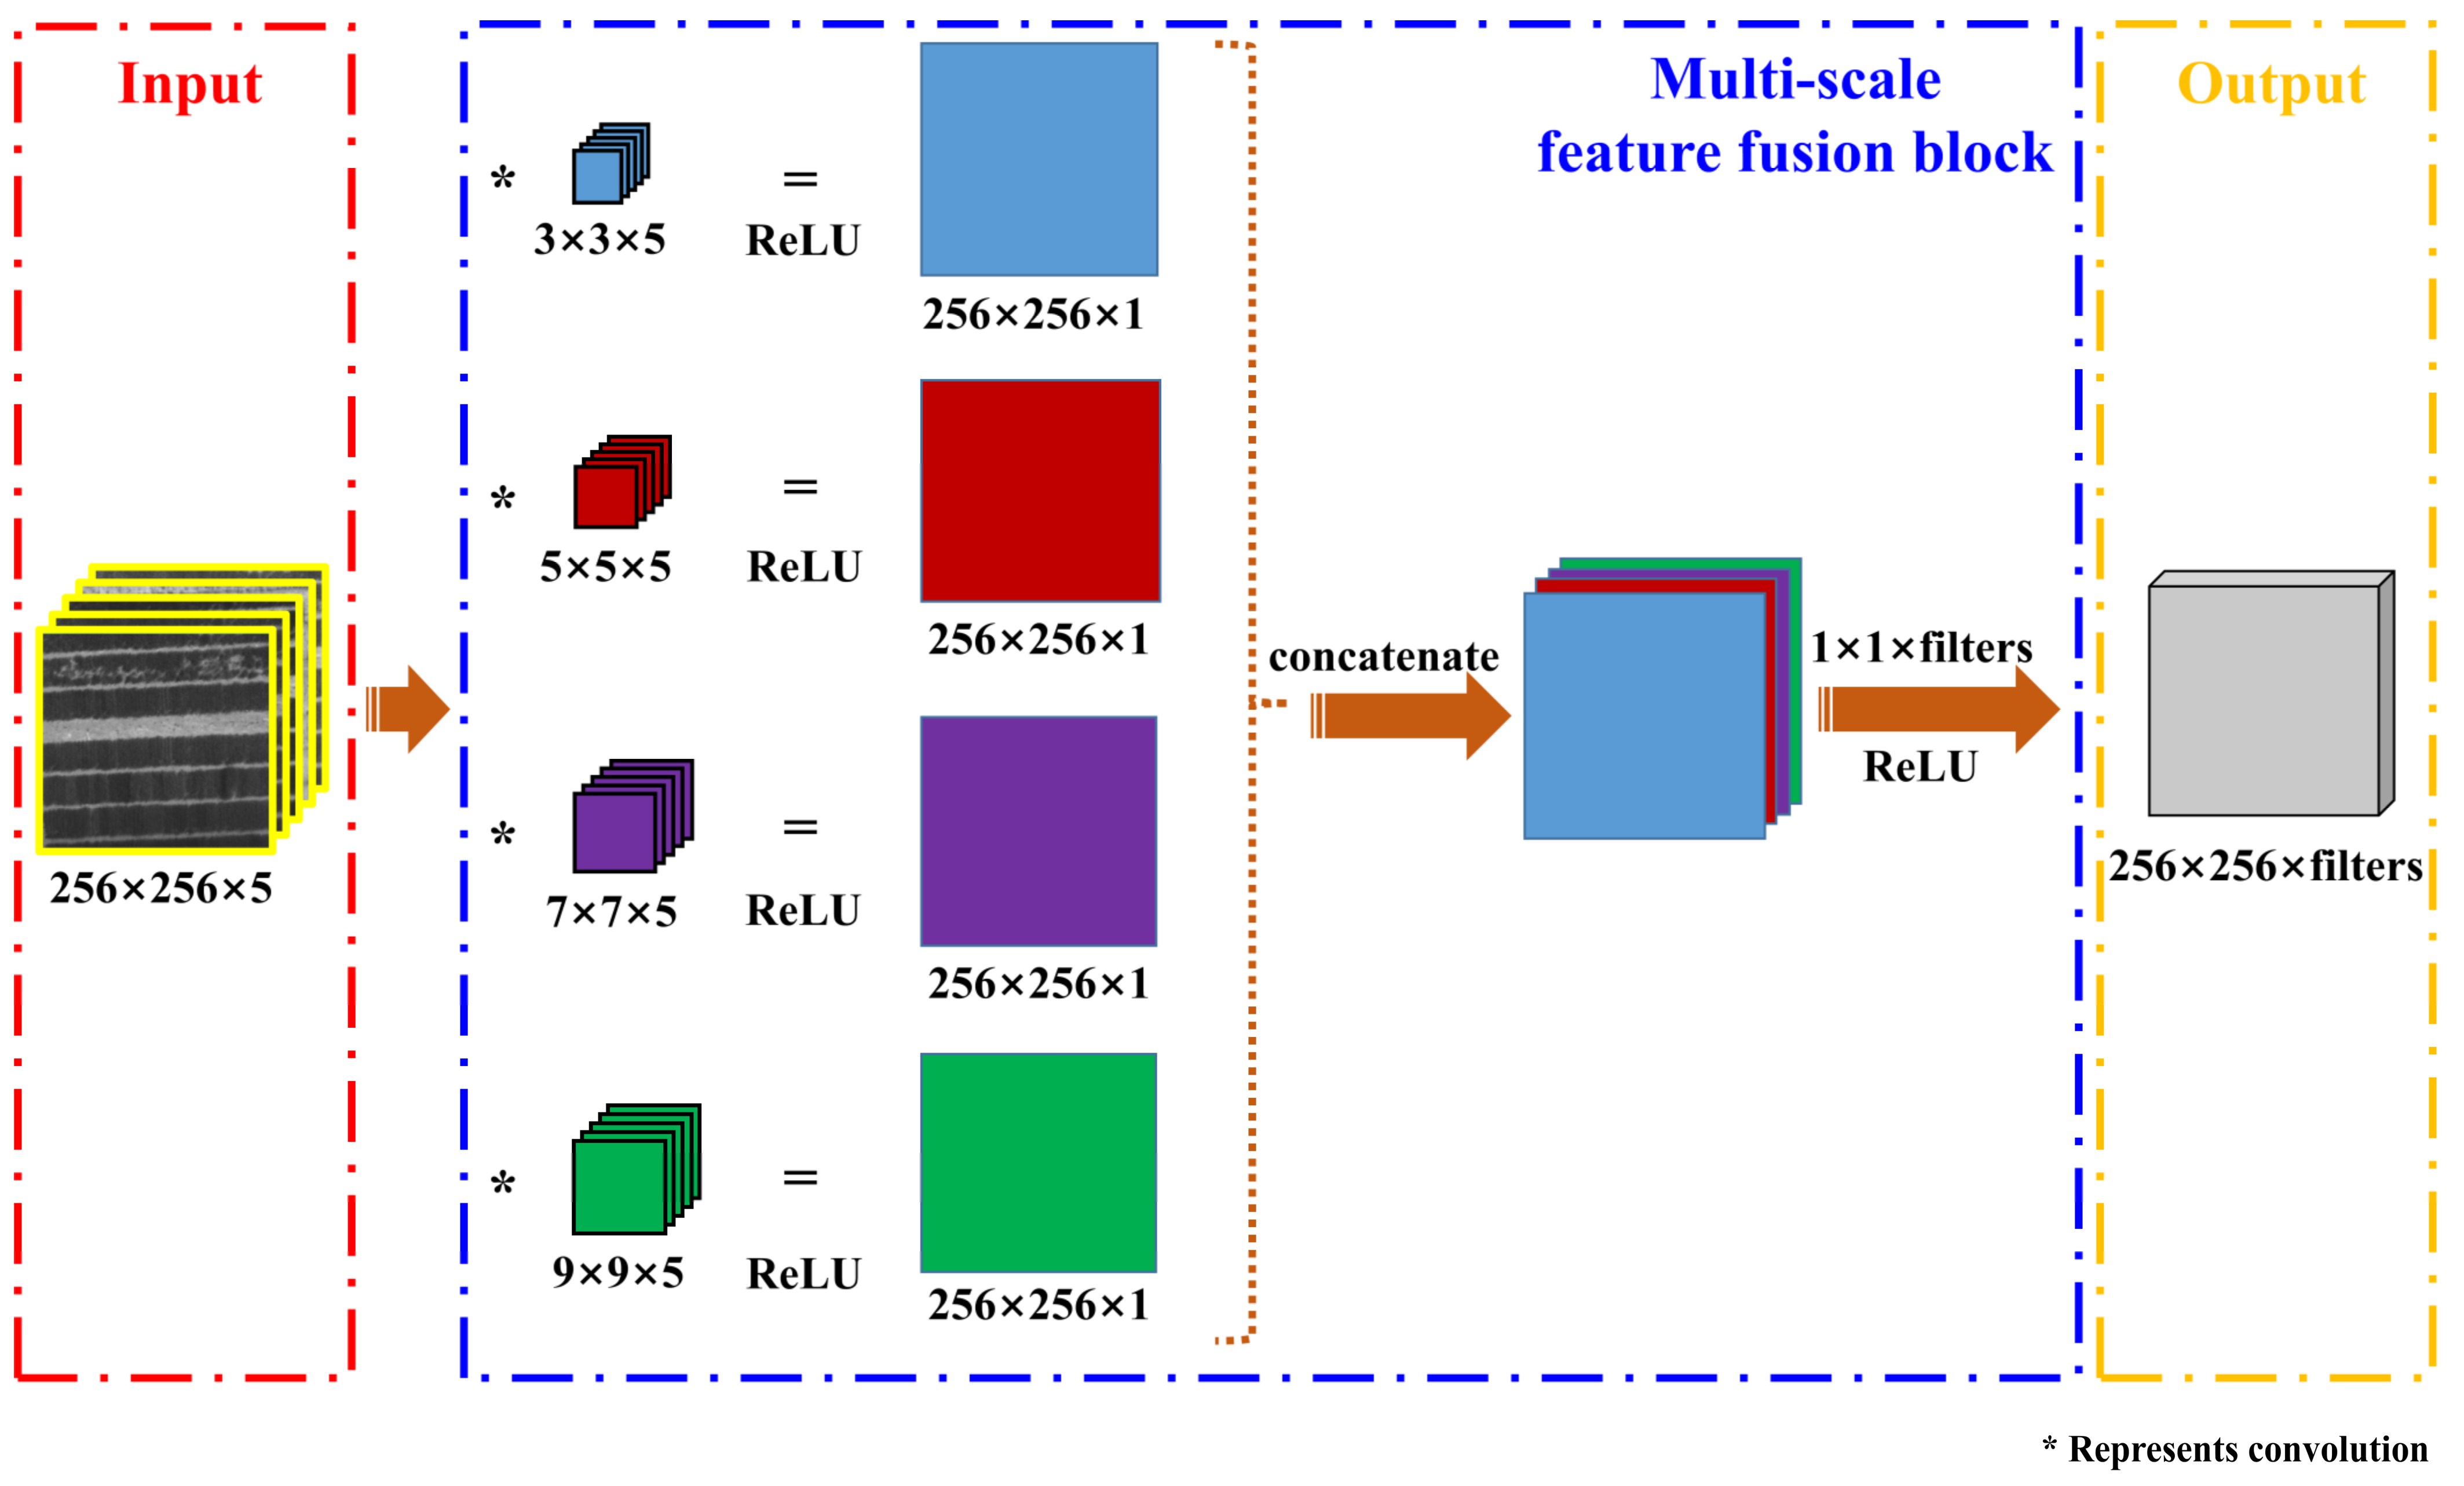
In order to effectively extract the multi-scale features of images, a multi-scale feature fusion block is designed using Python language, as shown in Figure 11. The multispectral image input to the model is first convolved with convolution kernels of different scale types (kernel size: 3 × 3, 5 × 5, 7 × 7, 9 × 9) to extract image features of different scales. After the convolution, the ReLU activation function is further used to obtain 4 feature maps (map size: 256 × 256 × 1) under different scale conditions. We use the concatenate function to fuse the four feature maps to obtain a feature map (map size: 256 × 256 × 4). Finally, a convolution kernel (kernel size: 1 × 1 × filters) is used to convolve the feature map, and a feature map (map size: 256 × 256 × filters) is output through the ReLU activation function. In the multi-scale feature fusion block, the stride of all convolution operations is 1 by default, and the padding is “same”.
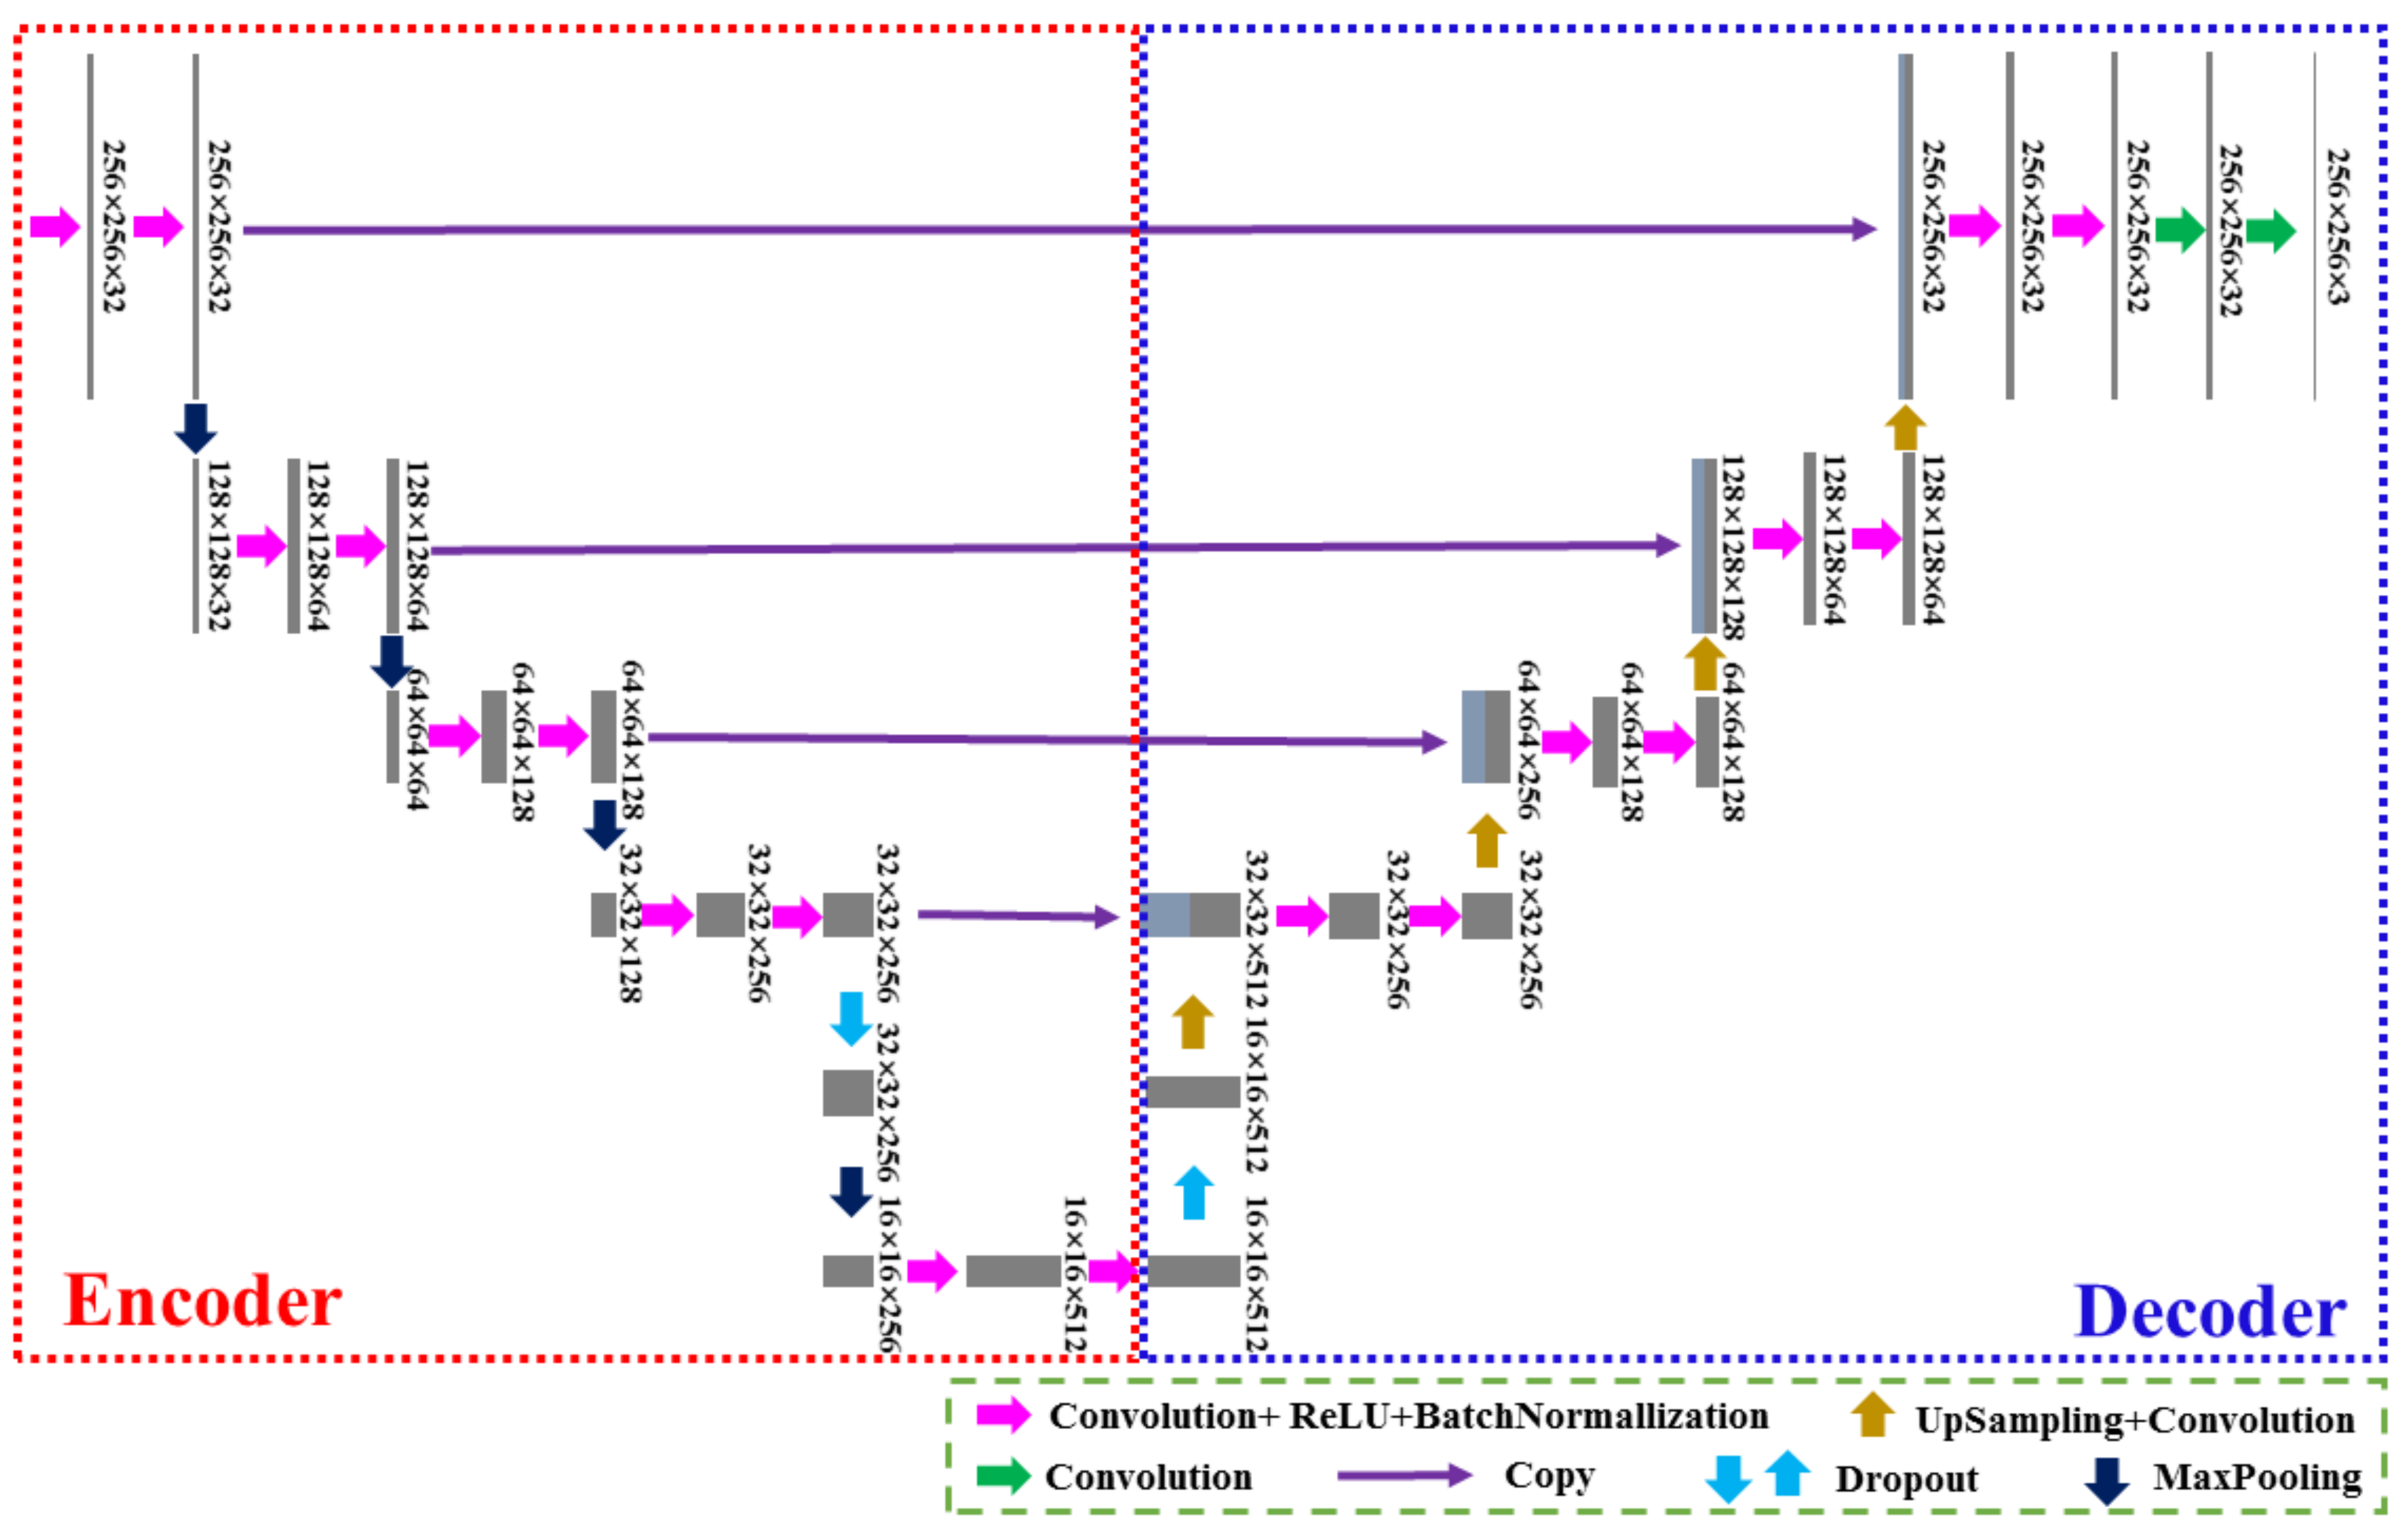
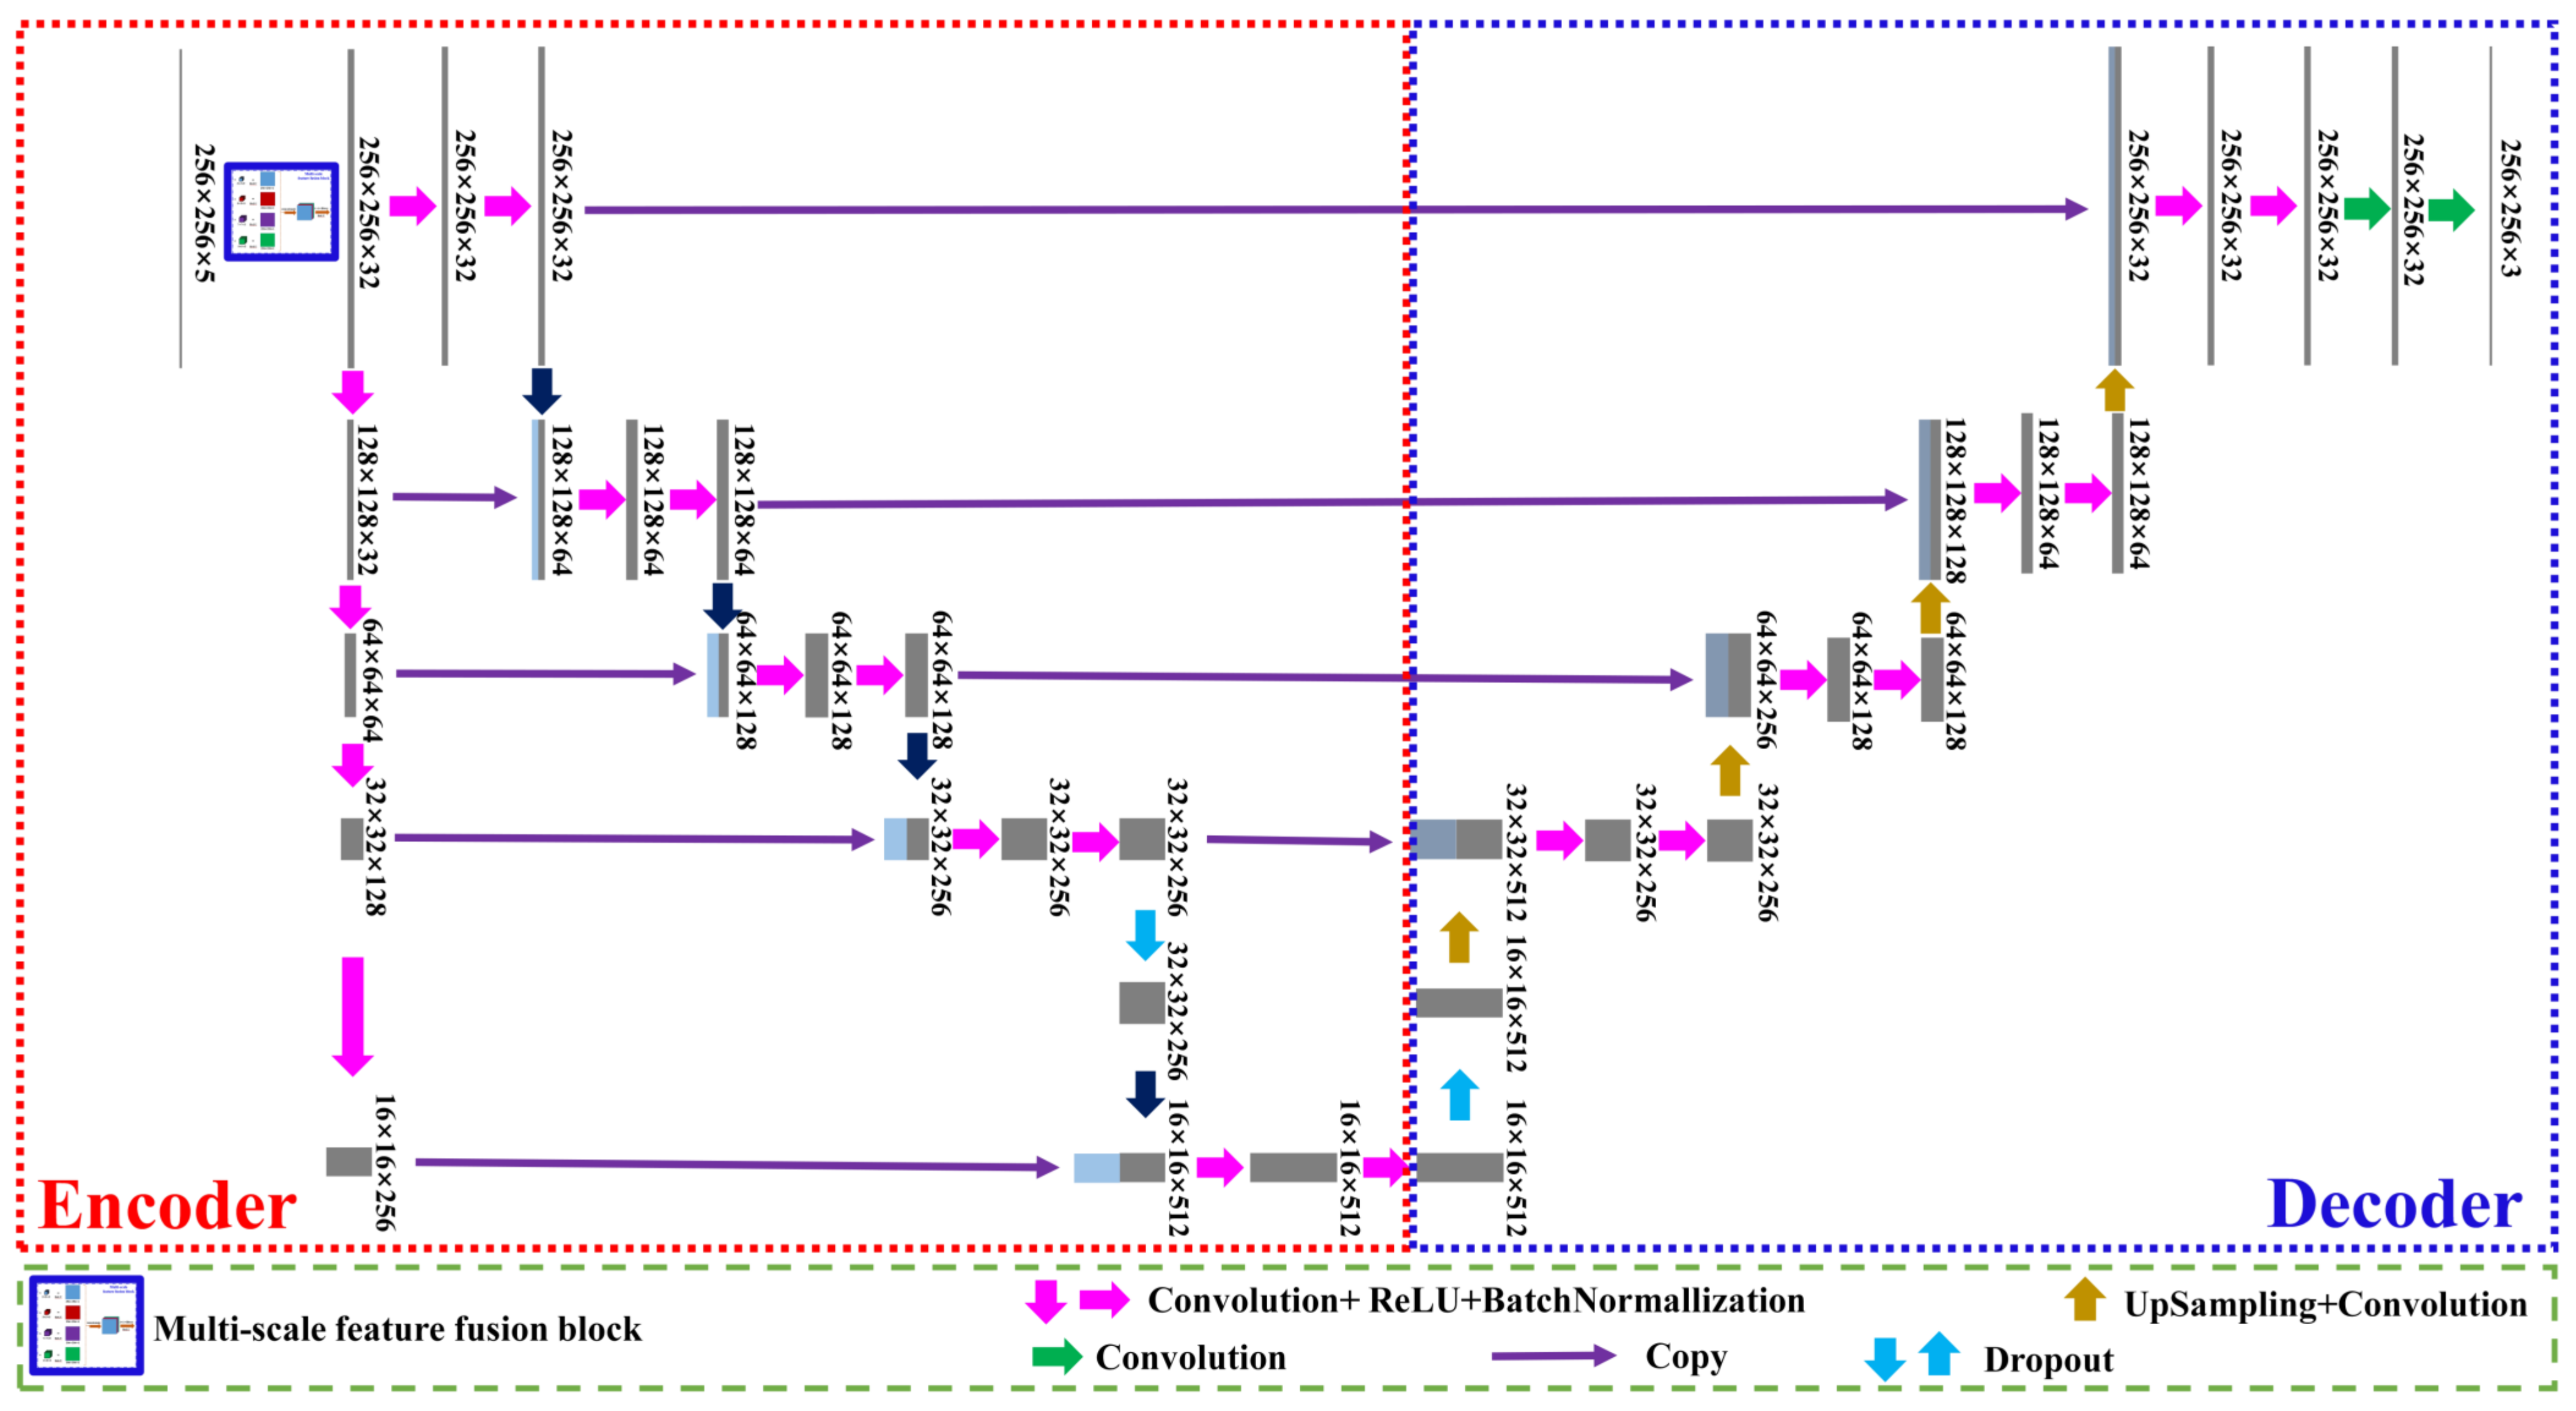
This study is based on U-Net for the classification of complex wheat fields. The U-Net model architecture was first proposed in 2015 and can be trained end-to-end on small-scale datasets with satisfactory results [28]. As shown in Figure 12, it is the U-Net model architecture established in this study. The model includes two parts, Encoder and Decoder, which are symmetrical to each other and U-shaped, so it is named U-Net. The Encoder and Decoder parts of the model comprise 5 layers, respectively. Each layer of the Encoder consists of a convolution kernel (kernel size: 3 × 3), a ReLU activation function, a BatchNormalization, and a maximum pooling layer (pool size: (2, 2)). Between the last two layers of the Encoder, a layer of Dropout is added before the maximum pooling layer, which can effectively prevent overfitting. Each layer of the Decoder consists of a convolution kernel (kernel size: 3 × 3), a ReLU activation function, a BatchNormalization, and an upsampling layer. A layer of Dropout is added between the first and second layers of the Decoder before the upsampling layer. The Decoder adds a convolutional layer (kernel size: 32 × 3 × 3 × 32) and a convolutional layer (kernel size: 3 × 1 × 1 × 32) before output. This study evaluates the modified network architecture based on the U-Net model architecture as a reference.
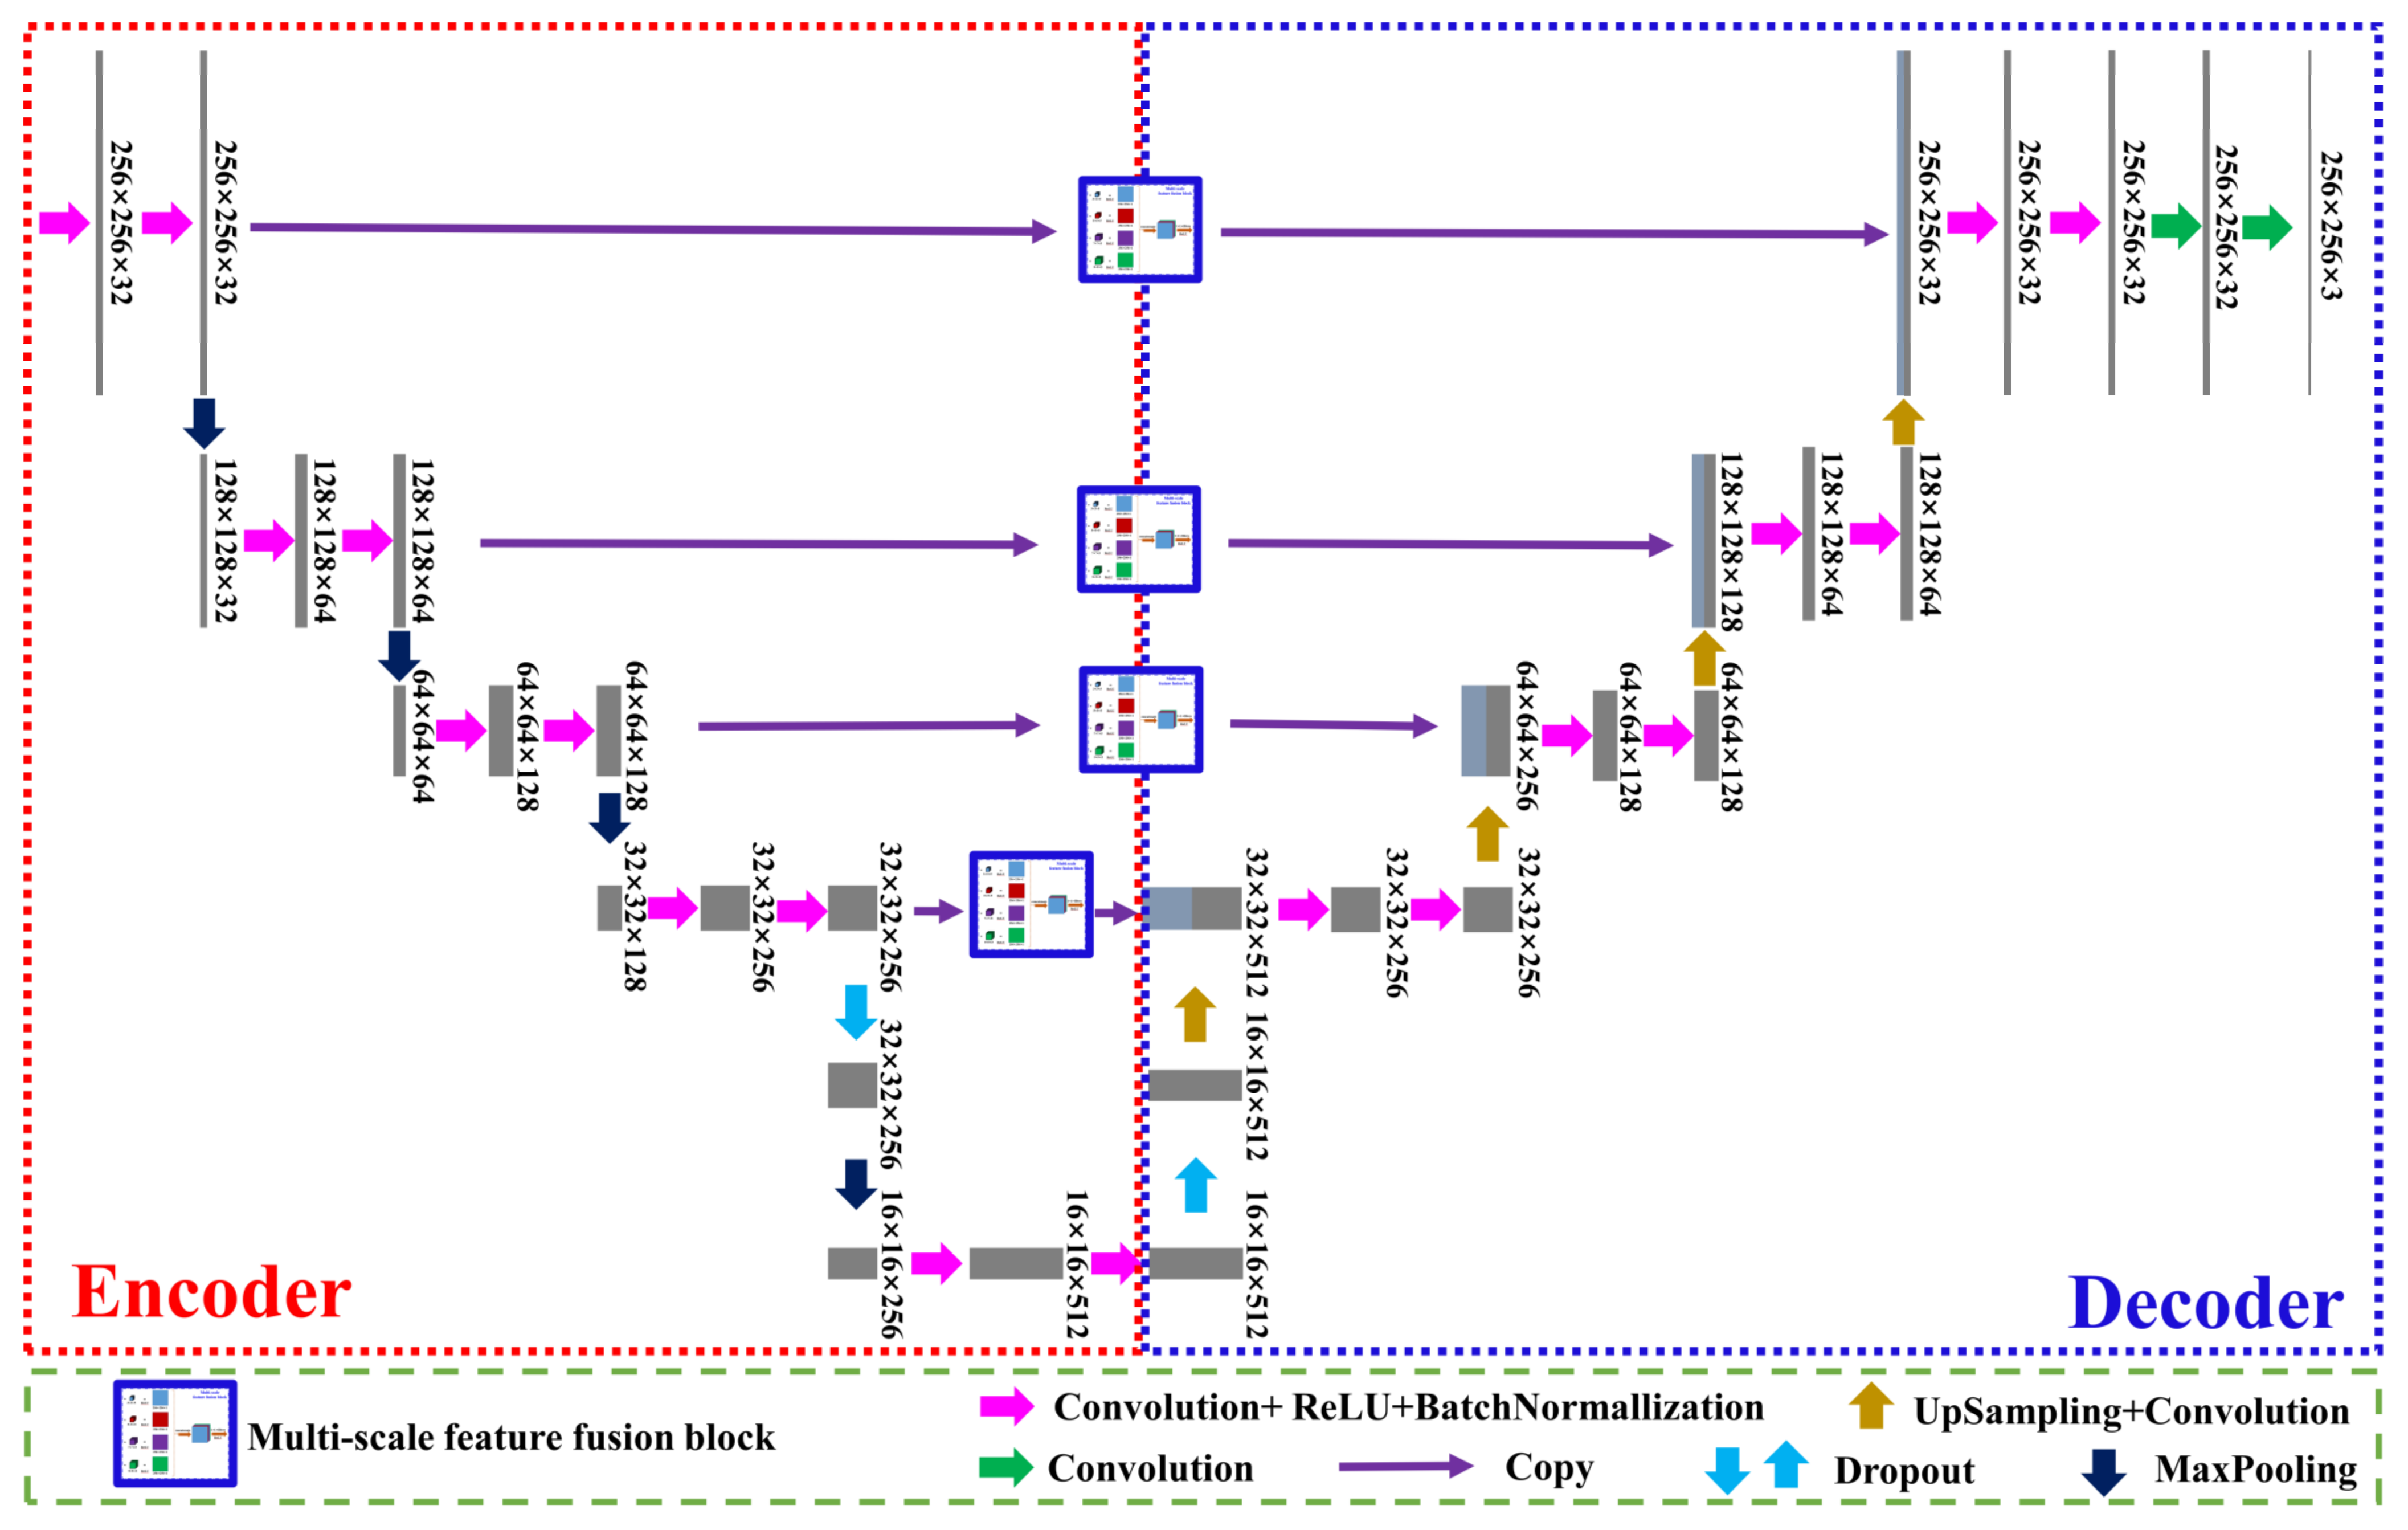
In order to explore where the multi-scale feature fusion block can effectively improve the segmentation accuracy of the network model in the U-Net architecture, this study based on the U-Net model proposes a Multi-Scale U-Net1 model architecture that adds a multi-scale feature fusion block between the Encoder and the Decoder and a Multi-Scale U-Net2 model architecture for extracting multi-scale features from raw images. As shown in Figure 13 and Figure 14, they are the Multi-Scale U-Net1 model architecture and the Multi-Scale U-Net2 model architecture, respectively. In the process of Multi-Scale U-Net2 transmitting multi-scale features, since the size of the feature map of each layer of the Encoder is different, before transmitting the multi-scale features to each layer of the Encoder, a convolution operation (kernel size of 2 × 2, stride: 2),a ReLU activation function and a BatchNormalization are performed on the multi-scale feature map. There is a big difference between the Multi-Scale U-Net1 model and the Multi-Scale U-Net2 model. The former mainly extracts deep multi-scale features, while the latter mainly extracts shallow multi-scale features of images. The model was trained on an image workstation with an Intel (R) Xeon (R) Gold 5118 CPU @ 2.30 GHz 2.29 GHz dual processor (Inter Inc., Santa Clara, CA, USA) and an NVIDIA GeForce RTX 2080 Ti GPU (NVIDIA Inc., Santa Clara, CA, USA). The Multi-Scale U-Net1 model and the Multi-Scale U-Net2 model were tested using the test set, and the classification accuracy of the two models in the complex wheat field scene of UAV multispectral images was analyzed and compared.

3. Results

3.1. Model Training

This study uses the training set and validation set to train the U-Net, Multi-Scale U-Net1, and Multi-Scale U-Net2, respectively. According to the aforementioned Wheat and Road accounting for 56% and 44%, respectively, the weights are balanced before training the model, and the training weights of 0.56 and 0.44 are set for the Wheat and Road categories, respectively. The training parameters set for the three models in this study are shown in Table 4.
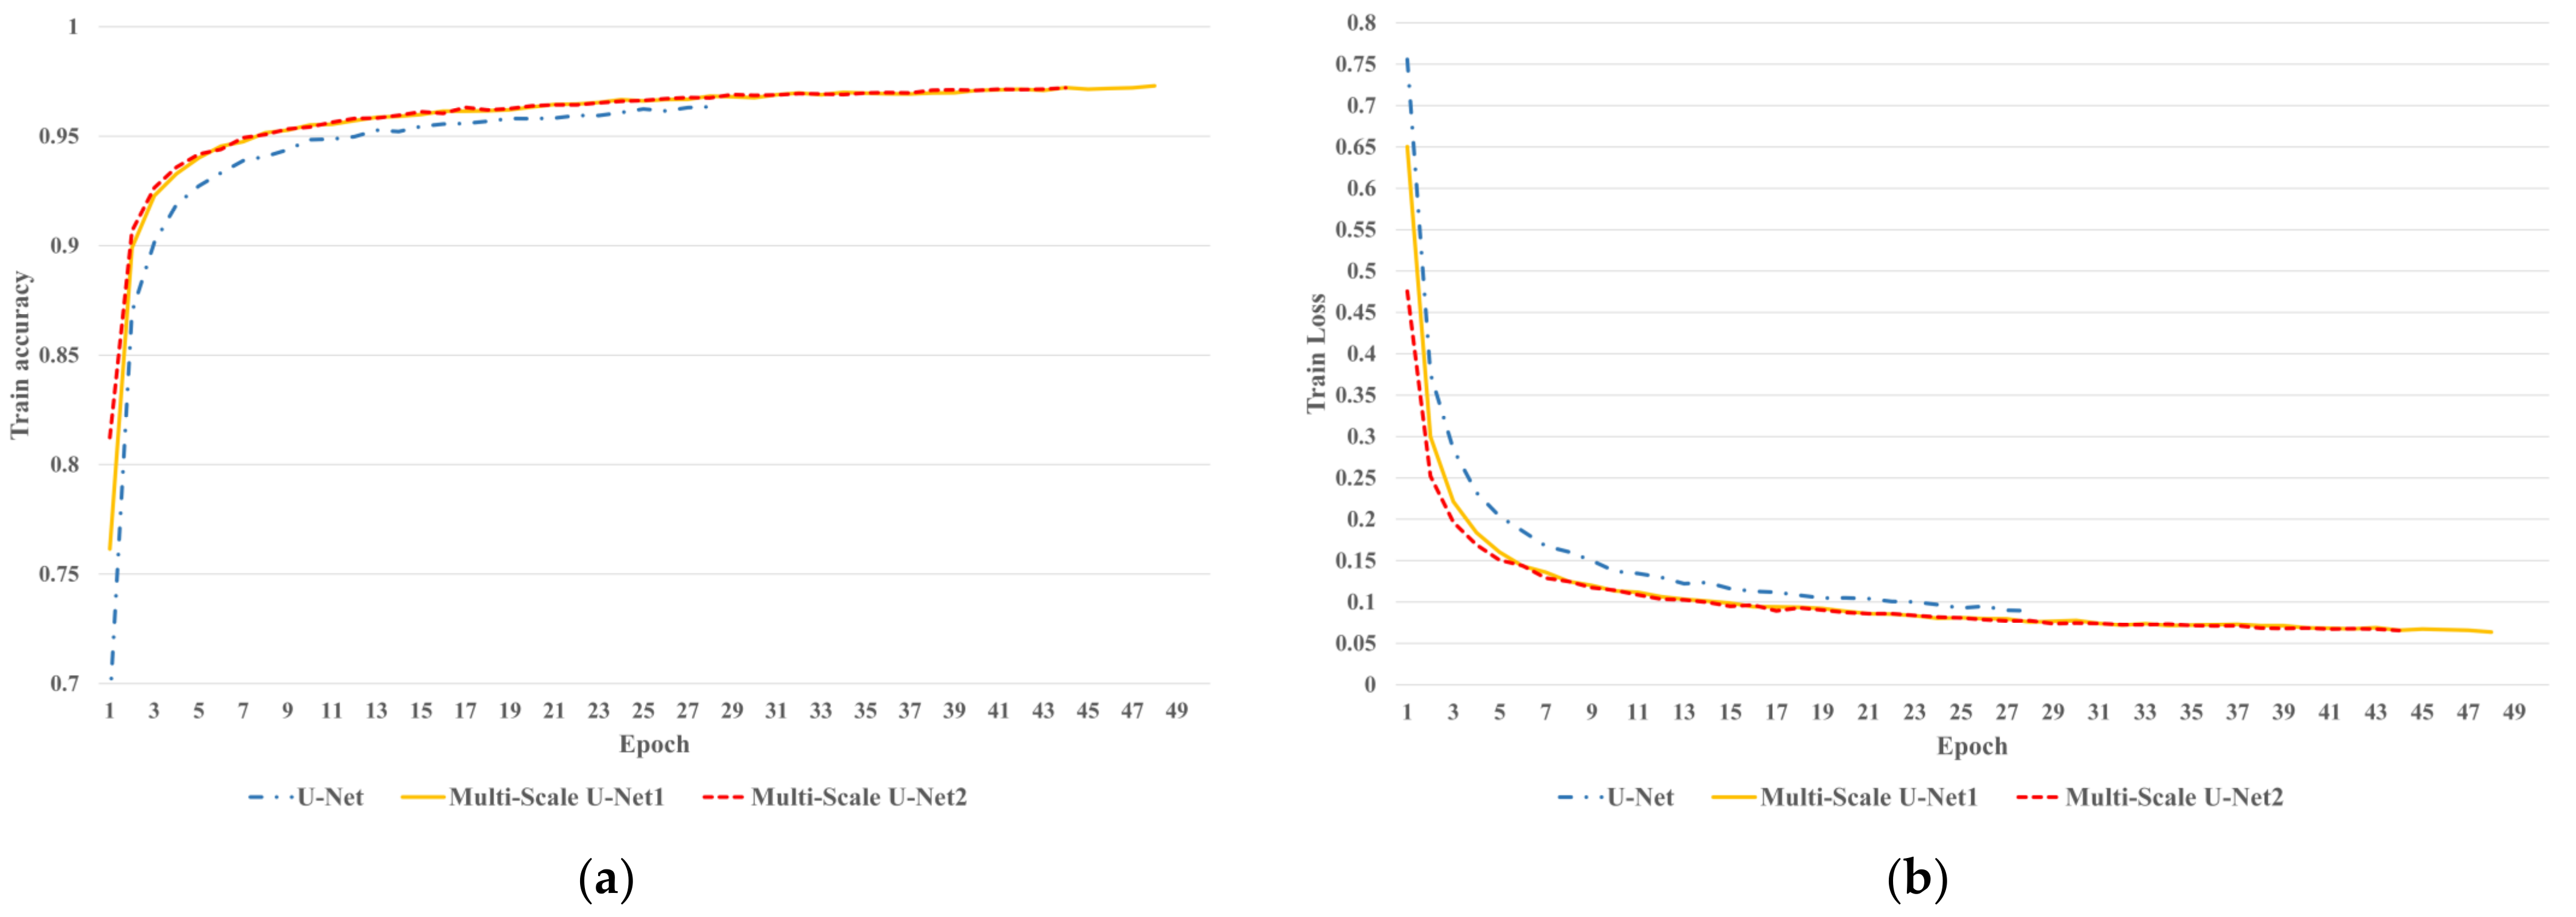
In this study, 4828 training set samples and 1608 validation set samples were input into three models for training. Figure 15 shows the accuracy curve and Loss function curve of U-Net, Multi-Scale U-Net1, and Multi-Scale U-Net2 model training, respectively. U-Net, Multi-Scale U-Net1, and Multi-Scale U-Net2 finish training at epoch 28, 29, and 44, respectively. As can be seen from Figure 15, Multi-Scale U-Net2 converges first and displays higher accuracy than the other two models, while the U-Net model is the slowest to converge, and the accuracy is not as good as the other two models.

3.2. Model Testing and Prediction Results

In this study, 402 test set samples were used for the accuracy evaluation of the three models. Five indicators, Confusion Matrix (CM), Pixel Accuracy (PA), Recall (Recall), F1-Score, and Intersection over Union (IoU), were selected to evaluate the model in three categories. Three indicators, Overall Accuracy (OA), Mean Intersection over Union (MIoU), and Frequency Weighted Intersection over Union (FWIoU), were used to comprehensively evaluate models. The Confusion Matrix (CM) is an analysis table that summarizes the prediction results of the classification model in machine learning. The records in the dataset are summarized in the form of a matrix according to the two criteria of the real category and the category predicted by the classification model. The Pixel Accuracy (PA) is “the number of correctly predicted data in those data that are predicted to be positive examples”. The Recall is “the number of correctly predicted data in the real positive examples”. F1-Score is the harmonic mean of precision and recall. Over Accuracy (OA) is the ratio between what the model predicted correctly on all test sets and the overall number. Mean Intersection over Union (MIoU) is the average of the ratio of the intersections and unions of all categories.
Table 5, Table 6 and Table 7 are the Confusion Matrix of U-Net, Multi-Scale U-Net1, and Multi-Scale U-Net2, respectively. It can be seen that the three models have relatively few misclassifications in the two categories of ‘Wheat’ and ‘Road’, but the three models all misclassify ‘Wheat’ and ‘Road’ into ‘Other’; considering that the purpose of this study is to separate ‘Wheat’ and ‘Road’, the overall classification of the three models is good. Compared with U-Net, Multi-Scale U-Net1, and Multi-Scale U-Net2 with multi-scale feature fusion modules show better performance on ‘Wheat’ and ‘Road’ classification, and especially the classification accuracy between ‘Wheat’ and ‘Road’ categories is significantly improved.
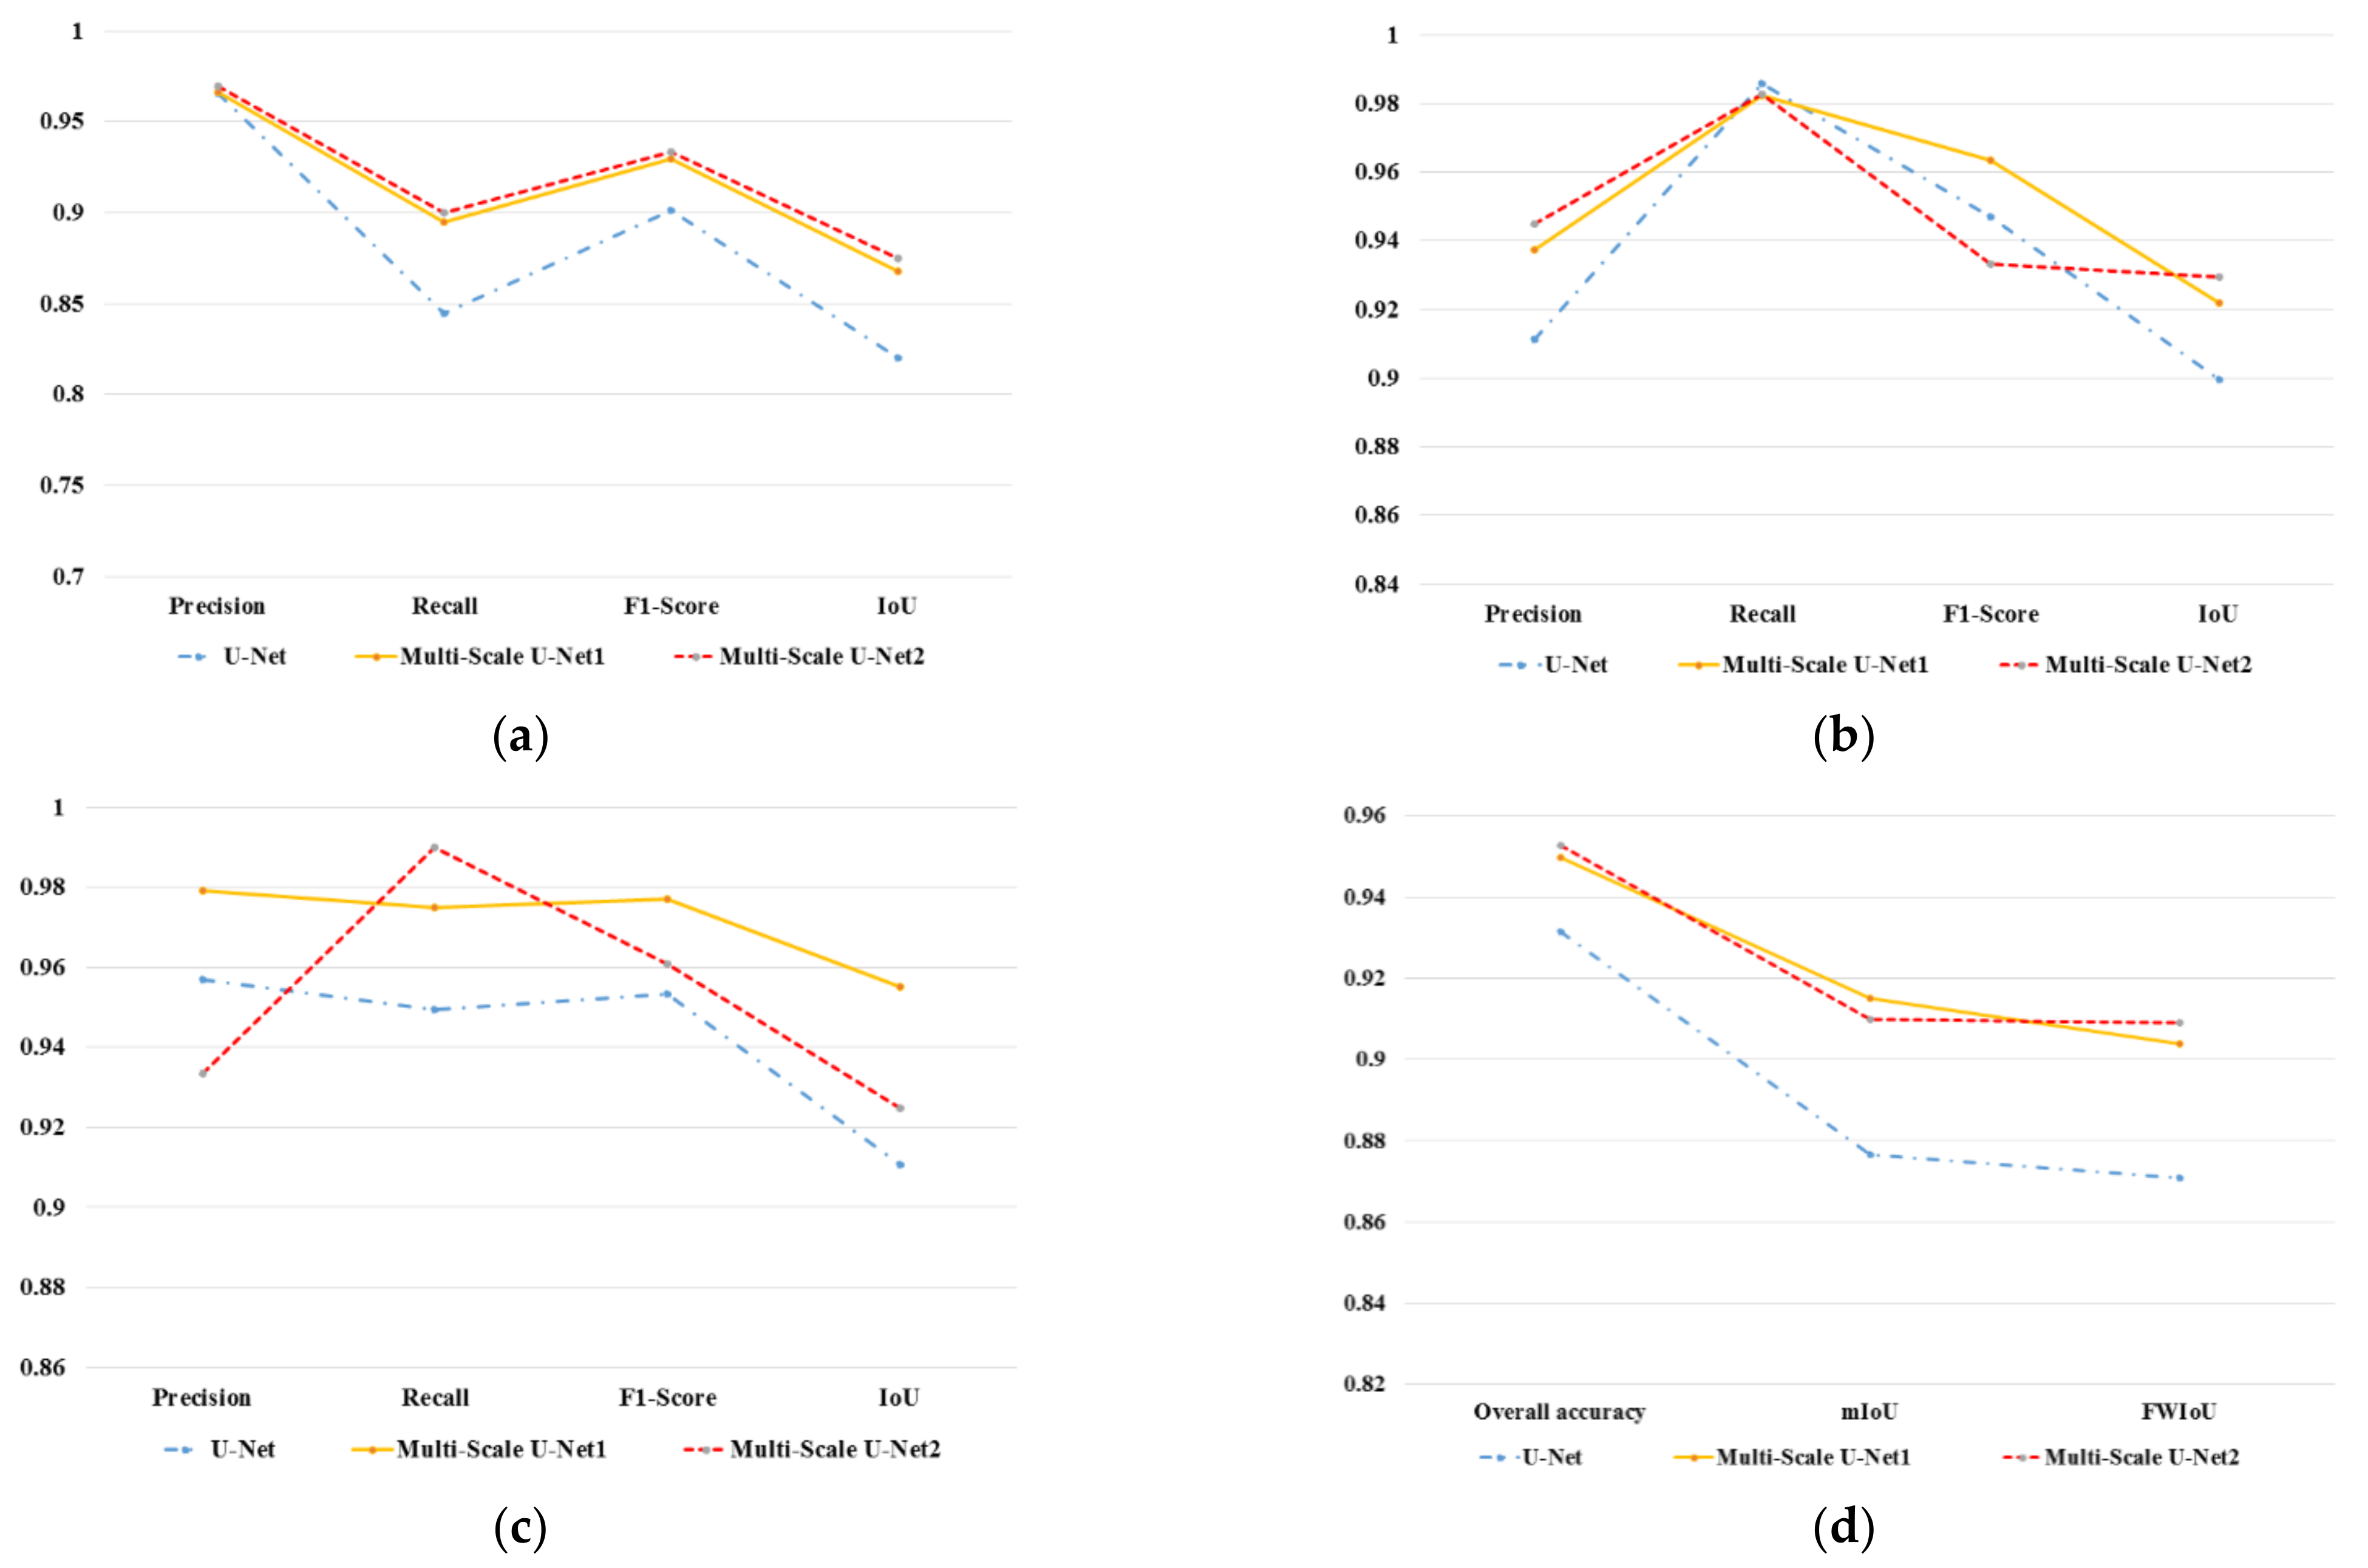
This study evaluates U-Net, Multi-Scale U-Net1, and Multi-Scale U-Net2 on ‘Other’, ‘Wheat’, ‘Road’, and overall classification accuracy, respectively. Table 8 is the Accuracy evaluation of different categories under three network models. Figure 16 is the accuracy evaluation curve. According to the precision evaluation index, Multi-Scale U-Net1 is superior to the other two network models, and Multi-Scale U-Net2 is inferior to the other two models in the classification accuracy of the ‘road’ category, but the accuracy of Multi-Scale U-Net2 in the ‘road’ category is 93.34%, and the result is still high, which can complete the correct classification of the ‘road’ category with higher accuracy. According to the Recall evaluation index, the Recall of Multi-Scale U-Net1 and Multi-Scale U-Net2 in the ‘road’ and ‘other’ categories were significantly higher than that of U-Net. The Recall for the three network models in the ‘wheat’ category are almost close. According to the Intersection over Union (IoU) and Figure 16d, Multi-Scale U-Net1 and Multi-Scale U-Net2 are better than U-Net. It can be seen that the classification accuracy of the Multi-Scale U-Net1 and Multi-Scale U-Net2 is better than that of the U-Net. The Multi-Scale U-Net1 outperforms the Multi-Scale U-Net2 in both ‘Wheat’ and ‘Road’ classification. To sum up, a module with a multi-scale feature fusion block can effectively improve the classification accuracy.
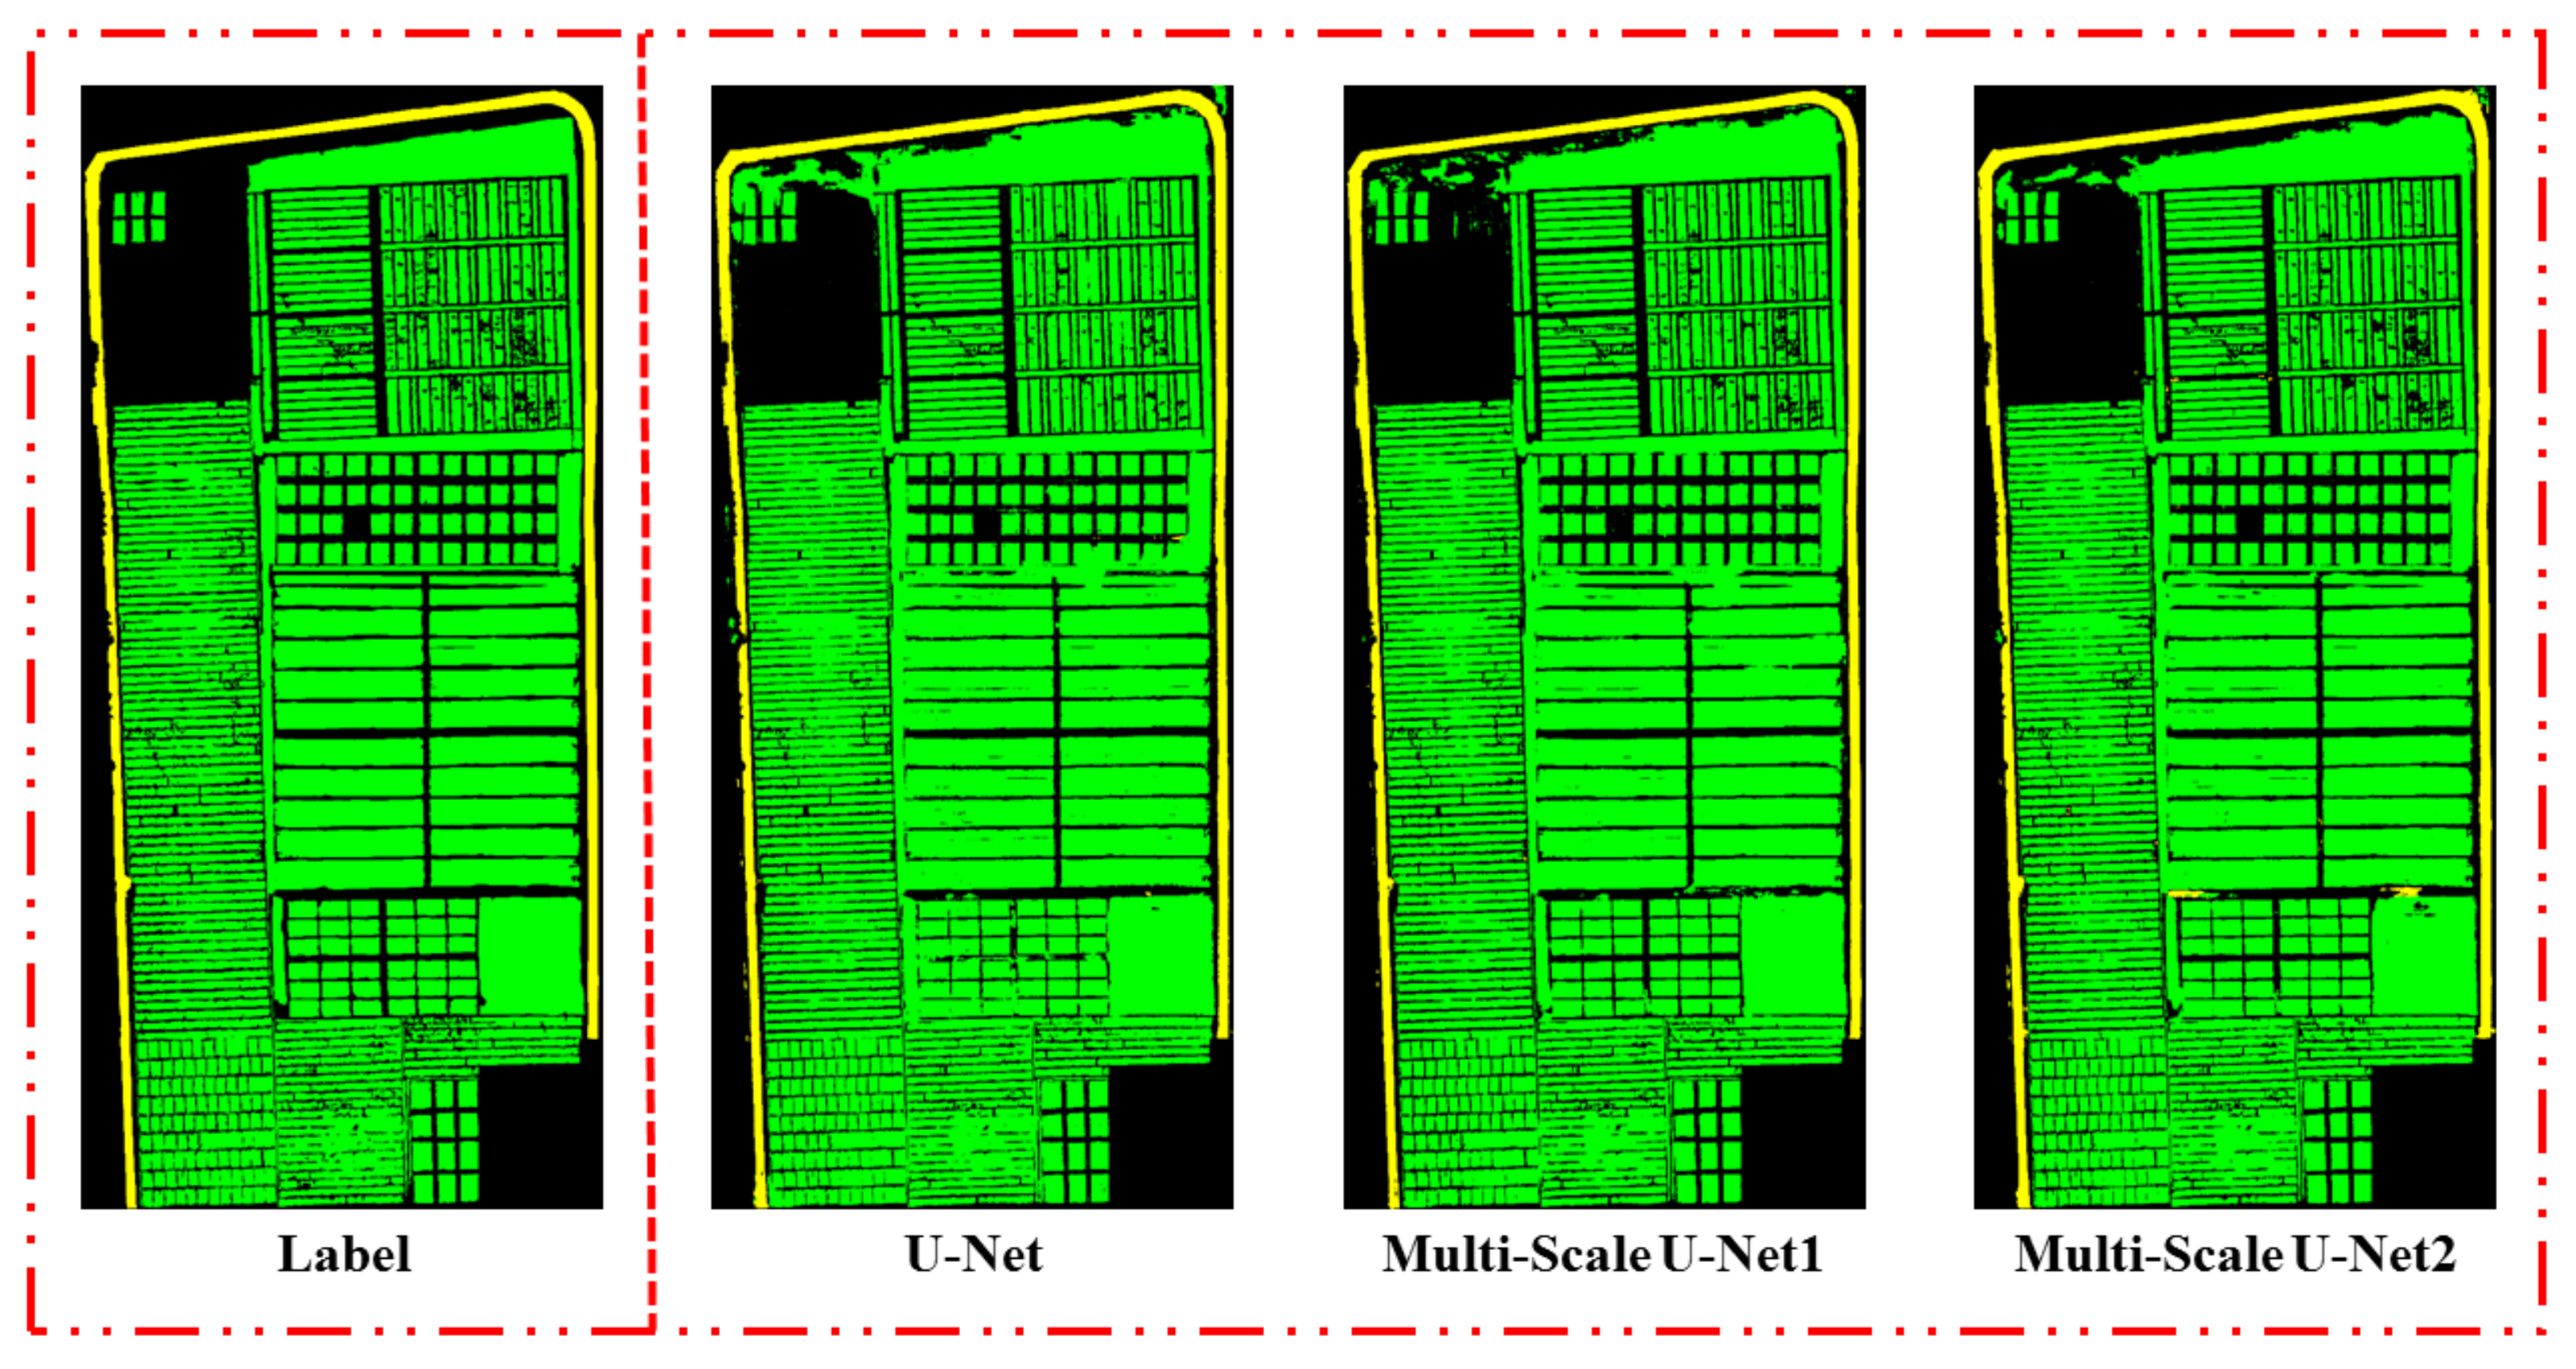
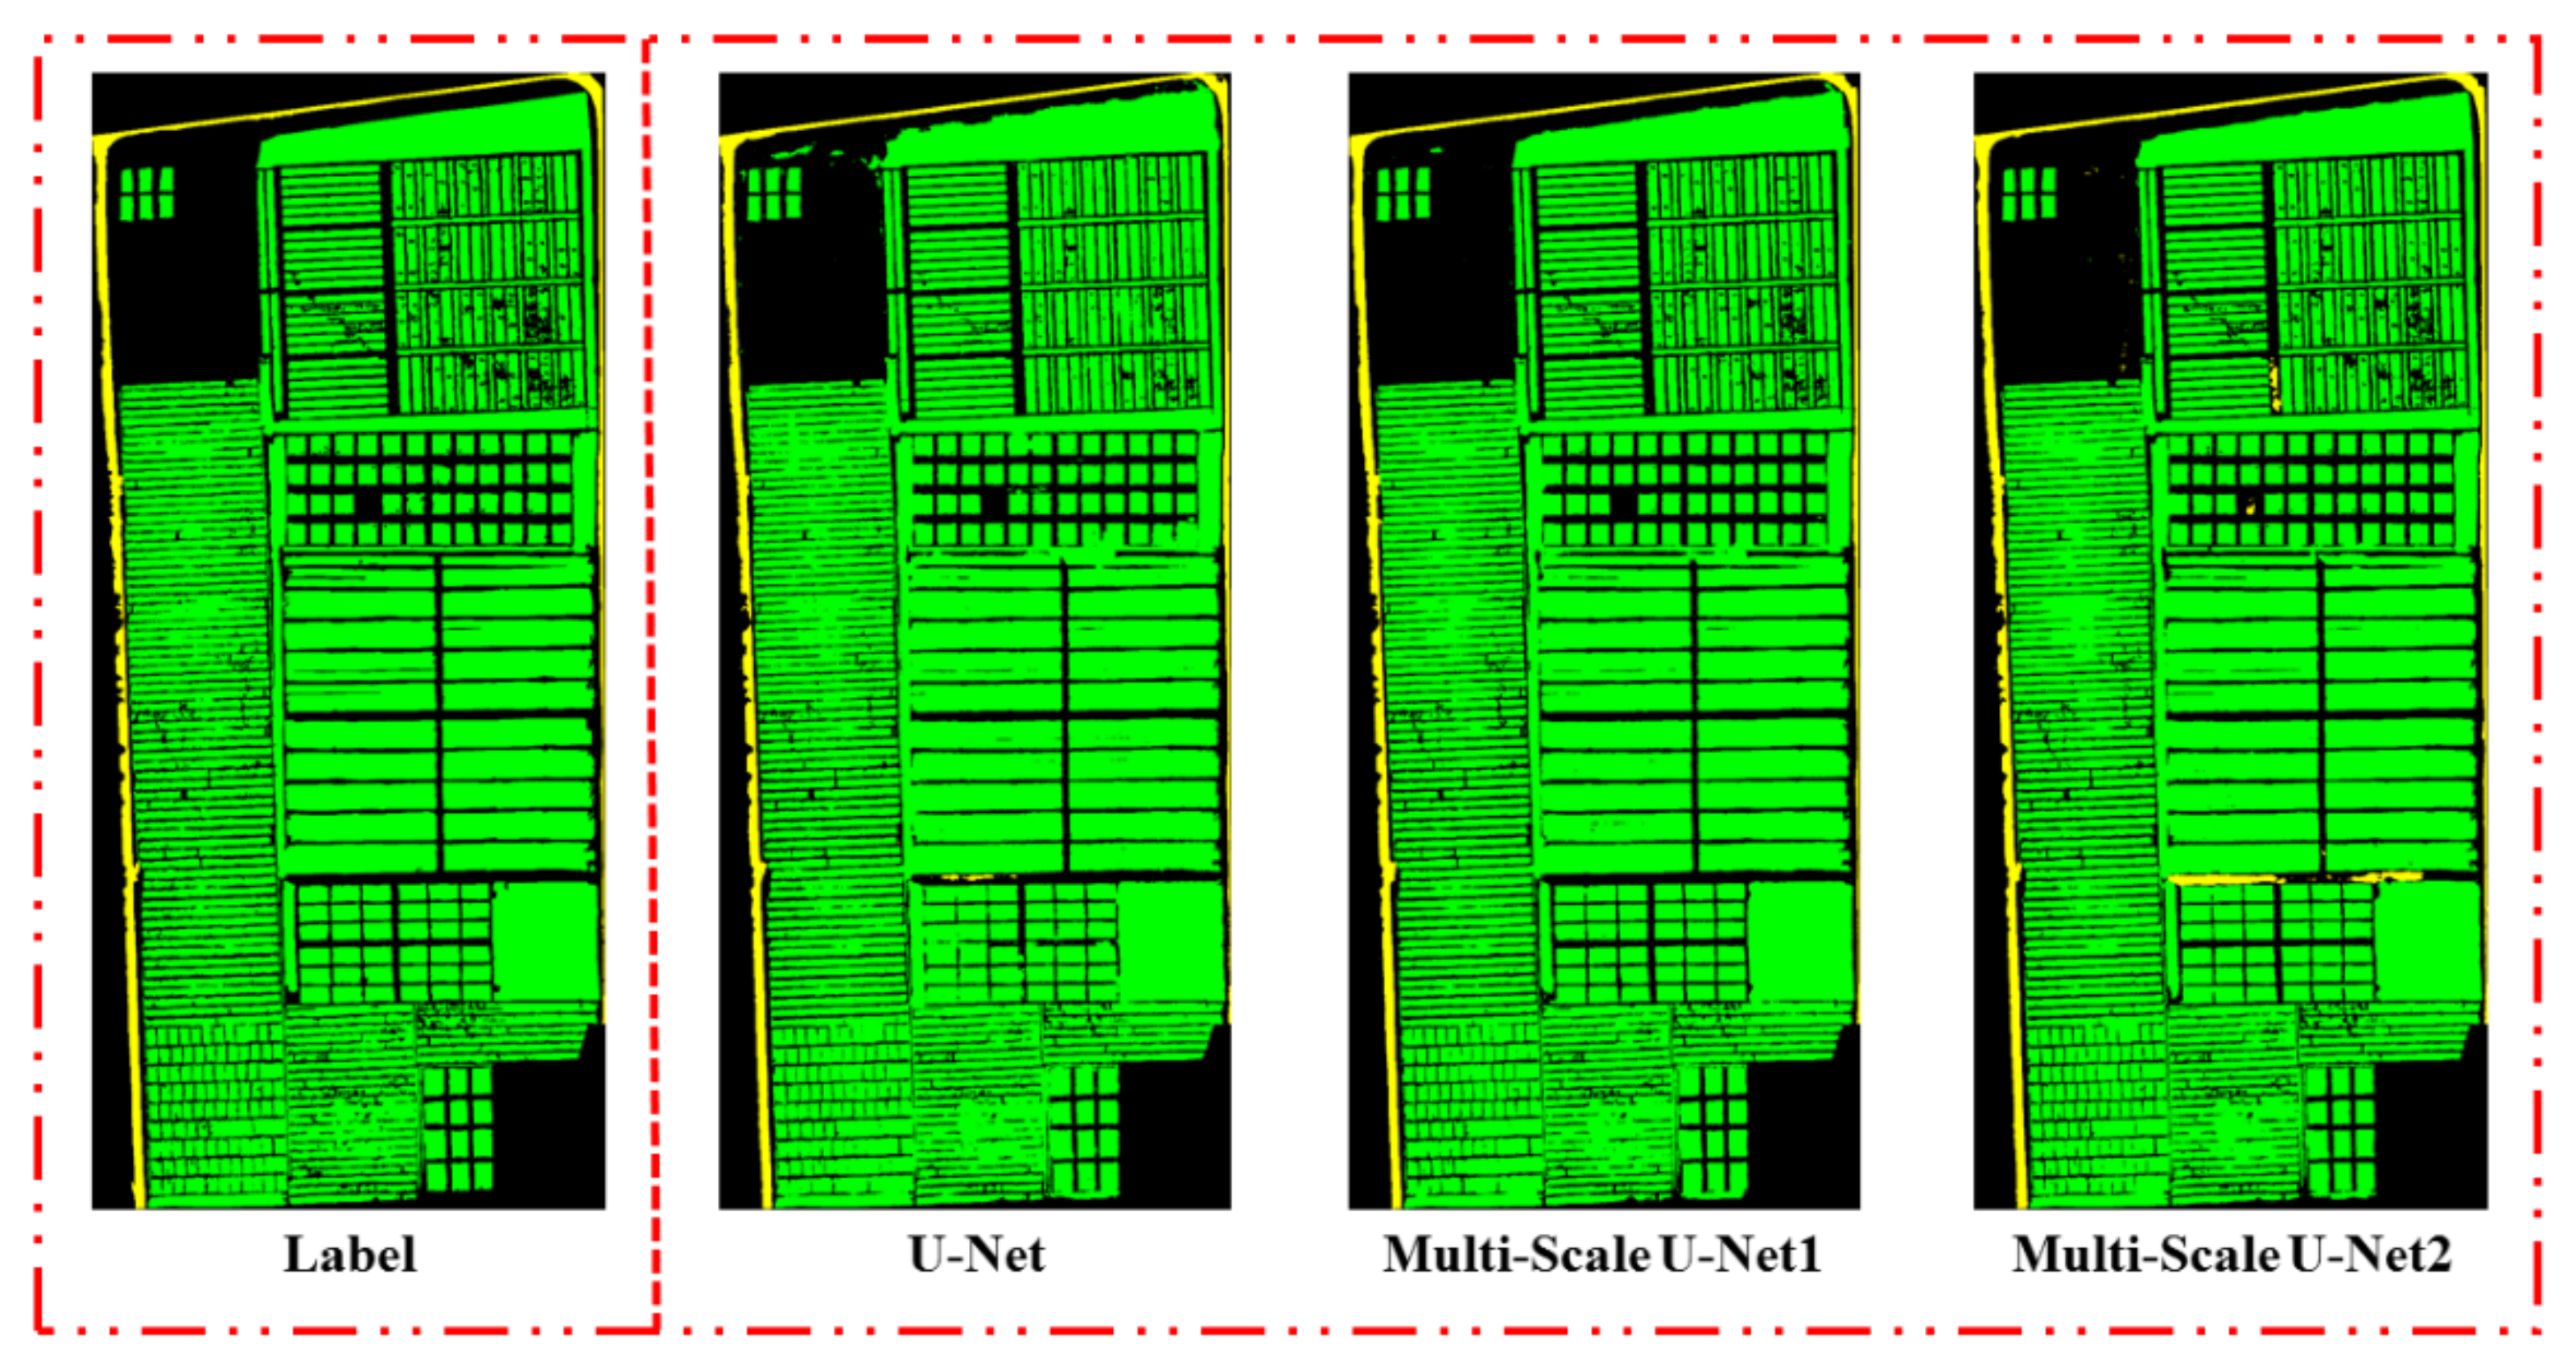
Figure 17, Figure 18, Figure 19 and Figure 20 are the prediction pictures of the three models in different spatial resolution remote sensing images. The difference between the prediction pictures and the Labels are not big. It can be seen that the three models have a good classification effect on high spatial resolution remote sensing images, and as the spatial resolution increases, the classification effect of the model improves.

4. Discussion

UAV remote sensing images have the characteristics of high spatial resolution and a lot of detailed information, which brings great challenges to image semantic segmentation. Based on the remote sensing images of UAV, this study carried out ground object classification for the complex wheat fields with diverse varieties, which once again increased the difficulty of semantic segmentation of images. Based on U-Net, multi-scale feature fusion block is added to different model structures, and Multi-Scale U-Net1 and Multi-Scale U-Net2 are proposed, and the planting structure of complex wheat fields is predicted with high accuracy. The following conclusions can be drawn from the performance of the U-Net, Multi-Scale U-Net1, and Multi-Scale U-Net2 on the test set in this study:
(1)
Adding a multi-scale feature fusion block between the Encoder and the Decoder can effectively extract multi-scale features of different depths, and to a certain extent, the model can learn multi-scale features of different depths, thereby effectively improving the semantic segmentation accuracy of the model.
(2)
Adding a multi-scale feature fusion block before the image input model can extract the shallowest features of the original image, and input them to the convolutional layers of different depths of the Encoder after a series of feature mining. Although the classification accuracy of the model can be improved, the features mined by the multi-scale feature fusion module are relatively single, so the performance of Multi-Scale U-Net2 is not as good as Multi-Scale U-Net1 in the classification of ‘Wheat’ and ‘Road’.
(3)
From the perspective of remote sensing images with different spatial resolutions, within a certain range, reducing the spatial resolution of images can effectively improve the classification performance of the network. The reason is that with the reduction of the spatial resolution of the remote sensing image, the detailed information of the image is greatly reduced, the phenomenon of model misclassification is reduced, and the land classification effect is significantly improved.

5. Conclusions

In this study, the multi-scale feature fusion method based on U-Net has effectively improved the classification accuracy of high spatial resolution UAV remote sensing images and achieved satisfactory classification results in complex wheat fields with diverse varieties. The overall classification accuracy of Multi-Scale U-Net1 and Multi-Scale U-Net2 in complex wheat fields can reach 94.97% and 95.26%, respectively.
This study uses UAV to obtain remote sensing images of complex wheat fields with different high spatial resolutions, and uses Multi-Scale U-Net1 and Multi-Scale U-Net2 with multi-scale feature fusion block to test on the obtained remote sensing images. The results show that the classification accuracy of the two models is higher than 94%, and the classification accuracy is improved compared with the U-Net model. In this study, it is found that adding a multi-scale feature fusion block based on U-Net can achieve high-precision classification of UAV remote sensing images in complex wheat field scenes. Based on the prediction results of different high spatial resolution remote sensing images, this study found that with the increase of spatial resolution, the classification accuracy of the model will be reduced. Therefore, it is difficult to conduct ground object classification research based on UAV remote sensing images in complex wheat field scenes with diverse varieties. The study itself has certain limitations, but the multi-scale feature fusion method proposed in this study can effectively improve the classification accuracy of the model and accurately complete the classification of UAV remote sensing images in complex wheat field scenes.
Although the multi-scale feature fusion method proposed in this study can effectively improve the ground object classification accuracy of UAV remote sensing images in complex wheat field scenes, the model itself has a large number of parameters, and the study only focuses on one growth cycle of wheat. Therefore, in later research, the study of the classification of ground object can be carried out for the complex wheat field scenes with lightweight models and multiple growth cycles.

Author Contributions

F.M. and F.Y. started the work, completed the detailed investigations, and prepared the paper with support of all the co-authors; H.C. and S.S. helped us with remote sensing data collection; M.Y. helped us with orchard ground data measurement; Q.L. helped us with ground image control point measurements. All authors have read and agreed to the published version of the manuscript.

Funding

This research was funded by the Major Science and Technology Project of Shaanxi Province of China (Program No. 2020zdzx03-04-01), the National Key R&D Program of China “the 13th Five-Year Plan” (Program No. 2016YFD0700503).

Informed Consent Statement

Informed consent was obtained from all subjects involved in the study.

Acknowledgments

We are grateful to Bin Yan and Pan Fan for their help with my writing.

Conflicts of Interest

The authors declare no conflict of interest.

References

  1. Hu, Q.; Wu, W.B.; Song, Q.; Yu, Q.Y.; Yang, P.; Tang, H.J. Recent progresses in research of crop patterns mapping by using remote sensing. Sci. Agric. Sin. 2015, 5, 14. [Google Scholar] [CrossRef]
  2. Zhang, P.; Hu, S.G. Fine crop classification by remote sensing in complex planting areas based on field parcel. Trans. Chin. Soc. Agric. Eng. 2019, 10, 23. [Google Scholar] [CrossRef]
  3. Hamer, A.M.; Simms, D.M.; Waine, T.W. Replacing human interpretation of agricultural land in Afghanistan with a deep convolutional neural network. Int. J. Remote Sens. 2021, 42, 3017–3038. [Google Scholar] [CrossRef]
  4. Meyarian, A.; Yuan, X.; Liang, L.; Wang, W.; Gu, L. Gradient convolutional neural network for classification of agricultural fields with contour levee. Int. J. Remote Sens. 2022, 43, 75–94. [Google Scholar] [CrossRef]
  5. Gao, L.; Luo, J.; Xia, L.; Wu, T.; Sun, Y.; Liu, H. Topographic constrained land cover classification in mountain areas using fully convolutional network. Int. J. Remote Sens. 2019, 40, 7127–7152. [Google Scholar] [CrossRef]
  6. Zhang, D.; Pan, Y.; Zhang, J.; Hu, T.; Zhao, J.; Li, N.; Chen, Q. A generalized approach based on convolutional neural networks for large area cropland mapping at very high resolution. Remote Sens. Environ. 2020, 247, 111912. [Google Scholar] [CrossRef]
  7. Lazin, R.; Shen, X.; Anagnostou, E. Estimation of flood-damaged cropland area using a convolutional neural network. Environ. Res. Lett. 2021, 16, 054011. [Google Scholar] [CrossRef]
  8. Aliabad, F.A.; Reza, H.; Malamiri, G.; Shojaei, S.; Sarsangi, A.; Sofia, C.; Ferreira, S. Sentinel. Investigating the ability to identify new constructions in urban areas using images from unmanned aerial vehicles, Google earth, and sentinel-2. Remote Sens. 2022, 14, 3227. [Google Scholar] [CrossRef]
  9. Al-Awar, B.; Awad, M.M.; Jarlan, L.; Courault, D. Evaluation of nonparametric machine-learning algorithms for an optimal crop classification using big data reduction strategy. Remote Sens. Earth Syst. Sci. 2022, 5, 141–153. [Google Scholar] [CrossRef]
  10. Zheng, W.H.; Wang, R.H.; Cao, Y.X.; Jin, N.; Feng, H.; He, J.Q. Remote sensing recognition of plastic-film-mulched farmlands on Loess Plateau based on Google Earth engine. Trans. Chin. Soc. Agric. Mach. 2021, 9, 3. [Google Scholar] [CrossRef]
  11. Song, T.Q.; Zhang, X.Y.; Li, J.X.; Fan, H.S.; Sun, Y.Y.; Zong, D.; Liu, T.X. Research on application of deep learning in multi-temporal greenhouse extraction. Comput. Eng. Appl. 2020, 5, 12. [Google Scholar] [CrossRef]
  12. Xu, L.; Ming, D.; Du, T.; Chen, Y.; Dong, D.; Zhou, C. Delineation of cultivated land parcels based on deep convolutional networks and geographical thematic scene division of remotely sensed images. Comput. Electron. Agric. 2022, 192, 106611. [Google Scholar] [CrossRef]
  13. Li, Z.M.; Zhao, J.; Lan, Y.B.; Cui, X.; Yang, H.B. Crop classification based on UAV visible image. J. Northwest A F Univ. (Nat. Sci. Ed.). 2019, 11, 27. [Google Scholar] [CrossRef]
  14. Yao, C.; Zhang, Y.; Liu, H. Application of convolutional neural network in classification of high resolution agricultural remote sensing images. In Proceedings of the ISPRS—International Archives of the Photogrammetry, Remote Sensing and Spatial Information Sciences, Wuhan, China, 18–22 September 2017; pp. 989–992. [Google Scholar]
  15. Chen, Y.Q.; Wang, X.X. Improved DeepLabv3+ model UAV image farmland information extraction. Comput. Eng. Appl. 2022, 7, 7. [Google Scholar] [CrossRef]
  16. Yang, Q.; Liu, M.; Zhang, Z.; Yang, S.; Ning, J.; Han, W. Mapping plastic mulched farmland for high resolution images of unmanned aerial vehicle using deep semantic segmentation. Remote Sens. 2019, 11, 2008. [Google Scholar] [CrossRef] [Green Version]
  17. Yang, S.Q.; Song, Z.S.; Yin, H.P.; Zhang, Z.T.; Ning, J.F. Crop classification method of UVA multispectral remote sensing based on deep semantic segmentation. Trans. Chin. Soc. Agric. Mach. 2020, 12, 21. [Google Scholar] [CrossRef]
  18. Zhang, K.; Okazawa, H.; Hayashi, K.; Hayashi, T.; Fiwa, L.; Maskey, S. Optimization of ground control point distribution for unmanned aerial vehicle photogrammetry for inaccessible fields. Sustainability 2022, 14, 9505. [Google Scholar] [CrossRef]
  19. Zhang, T.B.; Tang, J.X.; Liu, D.Z. Feasibility of satellite remote sensing image about spatial resolution. J. Earth Sci. Environ. 2006, 28, 79–82. [Google Scholar]
  20. Temraz, M.; Keane, M.T. Solving the class imbalance problem using a counterfactual method for data augmentation. Mach. Learn. Appl. 2022, 9, 100375. [Google Scholar] [CrossRef]
  21. Wagle, S.; Ramachandran, H.; Sampe, J.; Faseehuddin, M.; Ali, S. Effect of data augmentation in the classification and validation of tomato plant disease with deep learning methods. Traitement Du Signal 2021, 38, 1657–1670. [Google Scholar] [CrossRef]
  22. Chen, Y.; Gao, W.; Widyaningrum, E.; Zheng, M.; Zhou, K. Building classification of VHR airborne stereo images using fully convolutional networks and free training samples. In Proceedings of the ISPRS Technical Comission II, Delft, The Netherlands, 18–22 September 2017; pp. 87–92. [Google Scholar]
  23. Song, R.Z.; Zheng, H.Y.; Wang, D.C.; Shang, Z.; Wang, X.J.; Zhang, C.Y.; Li, J. Classification of features in open-pit mining areas based on deep learning and high-resolution remote sensing images. China Min. Mag. 2022, 6, 15. [Google Scholar]
  24. Chu, B.C.; Gao, F.; Shuai, T.; Wang, S.C.; Chen, J.; Chen, J.Y.; Yu, W.D. Remote sensing image object classification by deep learning based on feature map set. Radio Eng. 2022, 1, 13. [Google Scholar]
  25. Cerón, J.C.Á.; Ruiz, G.O.; Chang, L.; Ali, S. Real-time instance segmentation of surgical instruments using attention and multi-scale feature fusion. Med. Image Anal. 2022, 81, 102569. [Google Scholar] [CrossRef] [PubMed]
  26. Zheng, S.; Zhang, X.L.; Deng, H.; Ren, H.W. 3D liver image segmentation method based on multi-scale feature fusion and grid attention mechanism. J. Comput. Appl. 2022, 8, 4. [Google Scholar] [CrossRef]
  27. Wen, P.; Cheng, Y.L.; Wang, P.; Zhao, M.J.; Zhang, B.X. Ground object classification based on height-aware multi-scale graph convolution network. J. Beijing Univ. Aeronaut. Astronaut. 2021, 11, 22. [Google Scholar] [CrossRef]
  28. Ronneberger, O.; Fischer, P.; Brox, T. U-Net: Convolutional Networks for Biomedical Image Segmentation. arXiv 2015, arXiv:1505.04597. [Google Scholar] [CrossRef]
Figure 1. Workflow of complex wheat field classification research based on multi-scale feature fusion.
Agronomy 12 02658 g001
Figure 2. Multi-variety wheat planting area, Institute of Water-saving Agriculture in Arid Areas of China (IWSA), Northwest A&F University.
Agronomy 12 02658 g002
Figure 3. UAV remote sensing image data acquisition system.
Agronomy 12 02658 g003
Figure 4. Use Trimble GNSS System to Obtain the Coordinates of Ground Control Points (GCPs).
Agronomy 12 02658 g004
Figure 5. Multispectral camera radiometric calibration.
Agronomy 12 02658 g005
Figure 6. Local remote sensing images with different spatial resolutions (GSD: Ground Sampling Distance).
Agronomy 12 02658 g006
Figure 7. Remote Sensing Image Band stacking and Cropping.
Agronomy 12 02658 g007
Figure 8. Multispectral remote sensing images and their labels.
Agronomy 12 02658 g008
Figure 9. Cropping multispectral images and their labels.
Agronomy 12 02658 g009
Figure 10. Statistics chart of dataset categories, (a) Statistics chart of categories at different spatial resolutions before data balance, (b) Statistics chart of categories at different spatial resolutions after data balance.
Agronomy 12 02658 g010
Figure 11. Multi-scale feature fusion block.
Agronomy 12 02658 g011
Figure 12. U-Net Architecture.
Agronomy 12 02658 g012
Figure 13. Multi-Scale U-Net1.
Agronomy 12 02658 g013
Figure 14. Multi-Scale U-Net2.
Agronomy 12 02658 g014
Figure 15. Train accuracy and train loss. (a) Train accuracy, (b) Train Loss.
Agronomy 12 02658 g015
Figure 16. Accuracy evaluation curve. (a) Other, (b) Wheat, (c) Road, (d) Overall evaluation.
Agronomy 12 02658 g016
Figure 17. Three network models predict the results (GSD: 3.42 cm × 3.42 cm).
Agronomy 12 02658 g017
Figure 18. Three network models predict the results (GSD: 5.14 cm × 5.14 cm).
Agronomy 12 02658 g018
Figure 19. Three network models predict the results (GSD: 6.89 cm × 6.89 cm).
Agronomy 12 02658 g019
Figure 20. Three network models predict the results (GSD: 8.63 cm × 8.63 cm).
Agronomy 12 02658 g020
Table 1. Part of the parameters of the multispectral camera.
Parameter NameParameter Value
Band NameCentral Wavelength (nm)Bandwidth (nm)
Spectral bandBlue47532
Green56027
Red66816
Red edge71712
Near infrared84257
Spatial Resolution8 cm @ 120 m flight height
Table 2. UAV flight parameters.
ParameterValue
Flight Speed5 m/s
Capture ModeHover to capture
Heading Overlap80%
Lateral Overlap80%
Flying HeightThe First Experiment50 m
The Second Experiment75 m
The Third Experiment100 m
The Fourth Experiment125 m
Table 3. Overview after dividing the dataset.
DatasetNumberThe Number of Data Augmentation
Training set12074828
Validation set4021608
Test set402402
Table 4. Model Training Parameters.
Model Training ParametersValueModel Training ParametersValue
Batch size8OptimizerAdam
Epochs50LossCategorical cross-entropy
Learning rate1 × 10−5Programming Language FrameworkTensorflow keras
Table 5. U-Net Confusion Matrix.
U-NetPredict
OtherWheatRoad
RealOther5,759,2501,012,15847,563
Wheat149,71510,400,19548
Road55,9811941,056,048
Table 6. Multi-Scale U-Net1 Confusion Matrix.
Multi-Scale U-Net1Predict
OtherWheatRoad
RealOther6,102,568693,46222,941
Wheat184,81010,365,1480
Road27,949961,084,178
Table 7. Multi-Scale U-Net2 Confusion Matrix.
Multi-Scale U-Net2Predict
OtherWheatRoad
RealOther6137,736602,73778,498
Wheat183,61210,366,3424
Road11,132781,101,013
Table 8. Accuracy evaluation of Different categories under three Network Models.
PrecisionRecallF1-ScoreIoU
U-NetOther96.55%84.46%90.10%81.99%
Wheat91.13%98.58%94.71%89.95%
Road95.69%94.95%95.32%91.05%
Multi-Scale U-Net1Other96.63%89.49%92.93%86.79%
Wheat93.73%98.25%95.94%92.19%
Road97.93%97.48%97.70%95.51%
Multi-Scale U-Net2Other96.92%90.00%93.34%87.51%
Wheat94.50%98.26%96.35%92.95%
Road93.34%98.99%96.09%92.47%
Publisher’s Note: MDPI stays neutral with regard to jurisdictional claims in published maps and institutional affiliations.