Article

Effects of Long-Term Straw Return and Environmental Factors on the Spatiotemporal Variability of Soil Organic Matter in the Black Soil Region: A Case Study

1
College of land Science and Technology, China Agricultural University, Beijing 100193, China
2
Key Laboratory of Agricultural Land Quality, Ministry of Natural Resources, Beijing 100193, China
3
State Key Laboratory of Resources and Environmental Information System, Beijing 100101, China
4
Jilin Lishu Experimental Station of China Agricultural University, Lishu Agricultural Technology Extension Station, Siping 136500, China
5
Department of Land Resource Management, School of Tourism and Urban Management, Jiangxi University of Finance and Economics, Nanchang 330013, China
6
Unité de Recherche en Science du Sol, INRAE, 45075 Orléans, France
7
Department of Environment, Ghent University, Coupure Links 653, 9000 Gent, Belgium
*
Author to whom correspondence should be addressed.
Agronomy 2022, 12(10), 2532; https://doi.org/10.3390/agronomy12102532
Submission received: 21 September 2022 / Revised: 11 October 2022 / Accepted: 14 October 2022 / Published: 17 October 2022
(This article belongs to the Special Issue Soil Sustainability in the Anthropocene)

Abstract

:
Exploring the effects of straw return and environmental factors on the spatiotemporal variation of soil organic matter (SOM) in black soil regions is essential for soil carbon sequestration research. However, studies seldom quantified the effects of long-term straw return on a long-term SOM variation at a regional scale in typical black soil areas. The case was conducted in one of the three major black soil regions in the Northern Hemisphere, where the straw return policy has been implemented for a long time. The study obtained the SOM spatial distribution in 2007, 2009, 2012, 2015, and 2018 with approximately 9000 samples and analyzed the effects of soil types, texture, elevation, and human management on the spatiotemporal variation. The results indicated that from the 1980s to 2007, before the straw return policy implementation, the mean SOM content decreased from 24.38 g kg−1 to 18.94 g kg−1. In contrast, the mean SOM content gradually increased from 2007 to 2018 after implementing straw return practices. In addition, the area of SOM within 20–30 g kg−1 increased gradually, with 32.2%, 40.5%, 50.2%, 49.4%, and 60.5% in 2007, 2009, 2012, 2015, and 2018, respectively. Surprisingly, the SOM within 30–40 g kg−1 emerged in 2018. The results indicated that returning straw to the field might promote SOM accumulation. However, the SOM contents in Phaezems (19.25–21.82 g kg−1) were lower than that in natural Phaezems (40–60 g kg−1), indicating severe degradation. The clay content positively correlated to SOM and was a major explanatory variable for the response of SOM to straw return. Straw return practices are promising measures in the black soil region and are worth exploring more effective approaches to allow straw return to play a better role.

1. Introduction

Black soil resources with abundant carbon reserves are the most productive agricultural soils. The black soil resource region of Northeast China covering with a dark layer of soil, i.e., Phaezems, Chernozem, Cambisol, Planosols, and Lixisols [according to the World Reference Base for Soil Resources (IUSS Working Group, 2015)] [1,2] is one of three prominent black soil resource regions in the Northern Hemisphere. Black soils have a mollic epipedon rich in organic matter [2]. Whereas black soils around the world are now threatened by land degradation, and the protection and sustainable utilization of black earth resources is a major challenge worldwide [2,3,4]. The carbon content of soil organic matter (SOM) is markedly higher than that of vegetation and the atmosphere. SOM is a significant factor affecting global warming [5]. In addition, the quality and quantity of SOM play a vital role in determining soil quality because SOM contents have a profound impact on cationic exchange capacity, water holding capacity, soil fertility, microorganisms, and soil structure [6]. SOM accumulation is influenced by a large number of soil-forming factors, such as soil type, soil texture [7], topography [8,9], and agricultural management practices [10,11].
The application of an organic substance to the soil could impact SOM qualitatively and quantitatively. Straw return is a common agricultural management practice. Many studies have reported that straw return can improve the soil′s physical, chemical and biological properties and thus increase SOM contents [12,13,14,15,16]. Nevertheless, some scholars did not agree with this opinion [17,18,19]. It may be due to the application of organic matter to the soil does not affect the properties of chemical and SOM quality [20]. And even it supported the mineralization process of SOM [21] and thus led to the SOM decrease. These opposite findings were because the studies were conducted in different study regions with distinct soil properties and other environmental factors. Therefore, the effects of the soil type, soil texture, and straw return amount on SOM accumulation in the black soil region were required to explore. In addition, these studies that focus on the effects of straw return to SOM were mainly conducted at the field scale, and the results are generally site-specific, which is of limited value in determining the impact of agricultural management on SOM. Zhou et al. (2019) [22] reported that the predominant driving factor of SOM accumulation varied with changes in spatial scale. The factors affecting the accumulation of regional SOM varied according to variations in the SOM accumulation of individual fields within a region [9]. Therefore, the practical significance of the impact of agricultural management on SOM at the field scale is not as good as that at the regional scale. However, studies seldom quantified the effects of long-term straw return on a long-term SOM variation at a regional scale in typical black soil areas.
Therefore, as a typical black soil area and long-term straw return demonstration area, the study region can reflect the relationship between SOM accumulation and straw return on a regional scale. The purpose of this paper was two-fold, which included: (1) evaluating the spatiotemporal variation of SOM over a 34-year period due to significant change in straw return policy; (2) exploring the influencing factors of SOM variation, which is helpful in analyzing the response of SOM accumulation to straw return under various soil types and textures. This study will enable further understanding of the effect of conservation tillage on SOM variation and provide a theoretical basis for soil carbon sequestration in black soil areas.

2. Materials and Methods

2.1. Study Area

Lishu County, Jilin Province (123°45′–120°53′ E, 42°49′–43°46′ N) is located in the southwestern part of Northeast China and surrounded on both sides by the East Dongliao River. The study area is 105 km long and 92 km wide, with an area of 420,900 ha and an elevation of 160 m (Figure 1). The terrain inclines from southeast to northwest with hills in the southeast, undulating plains in the central, and impulse plains in the north. The region’s climate is classified as a monsoon climate of medium latitudes. The annual average temperature is 6.5 °C, the annual growth cumulative temperature ≥ 0 °C is 3244.2 °C, and the cumulative temperature ≥ 10 °C is 3029.8 °C. The annual average sunshine duration is 2541.4 h. Generally, the frost-free period is 155 days, and the average annual precipitation is 553.5 m. The precipitation is mostly concentrated in June, July and August, accounting for 65% of the annual rainfall.
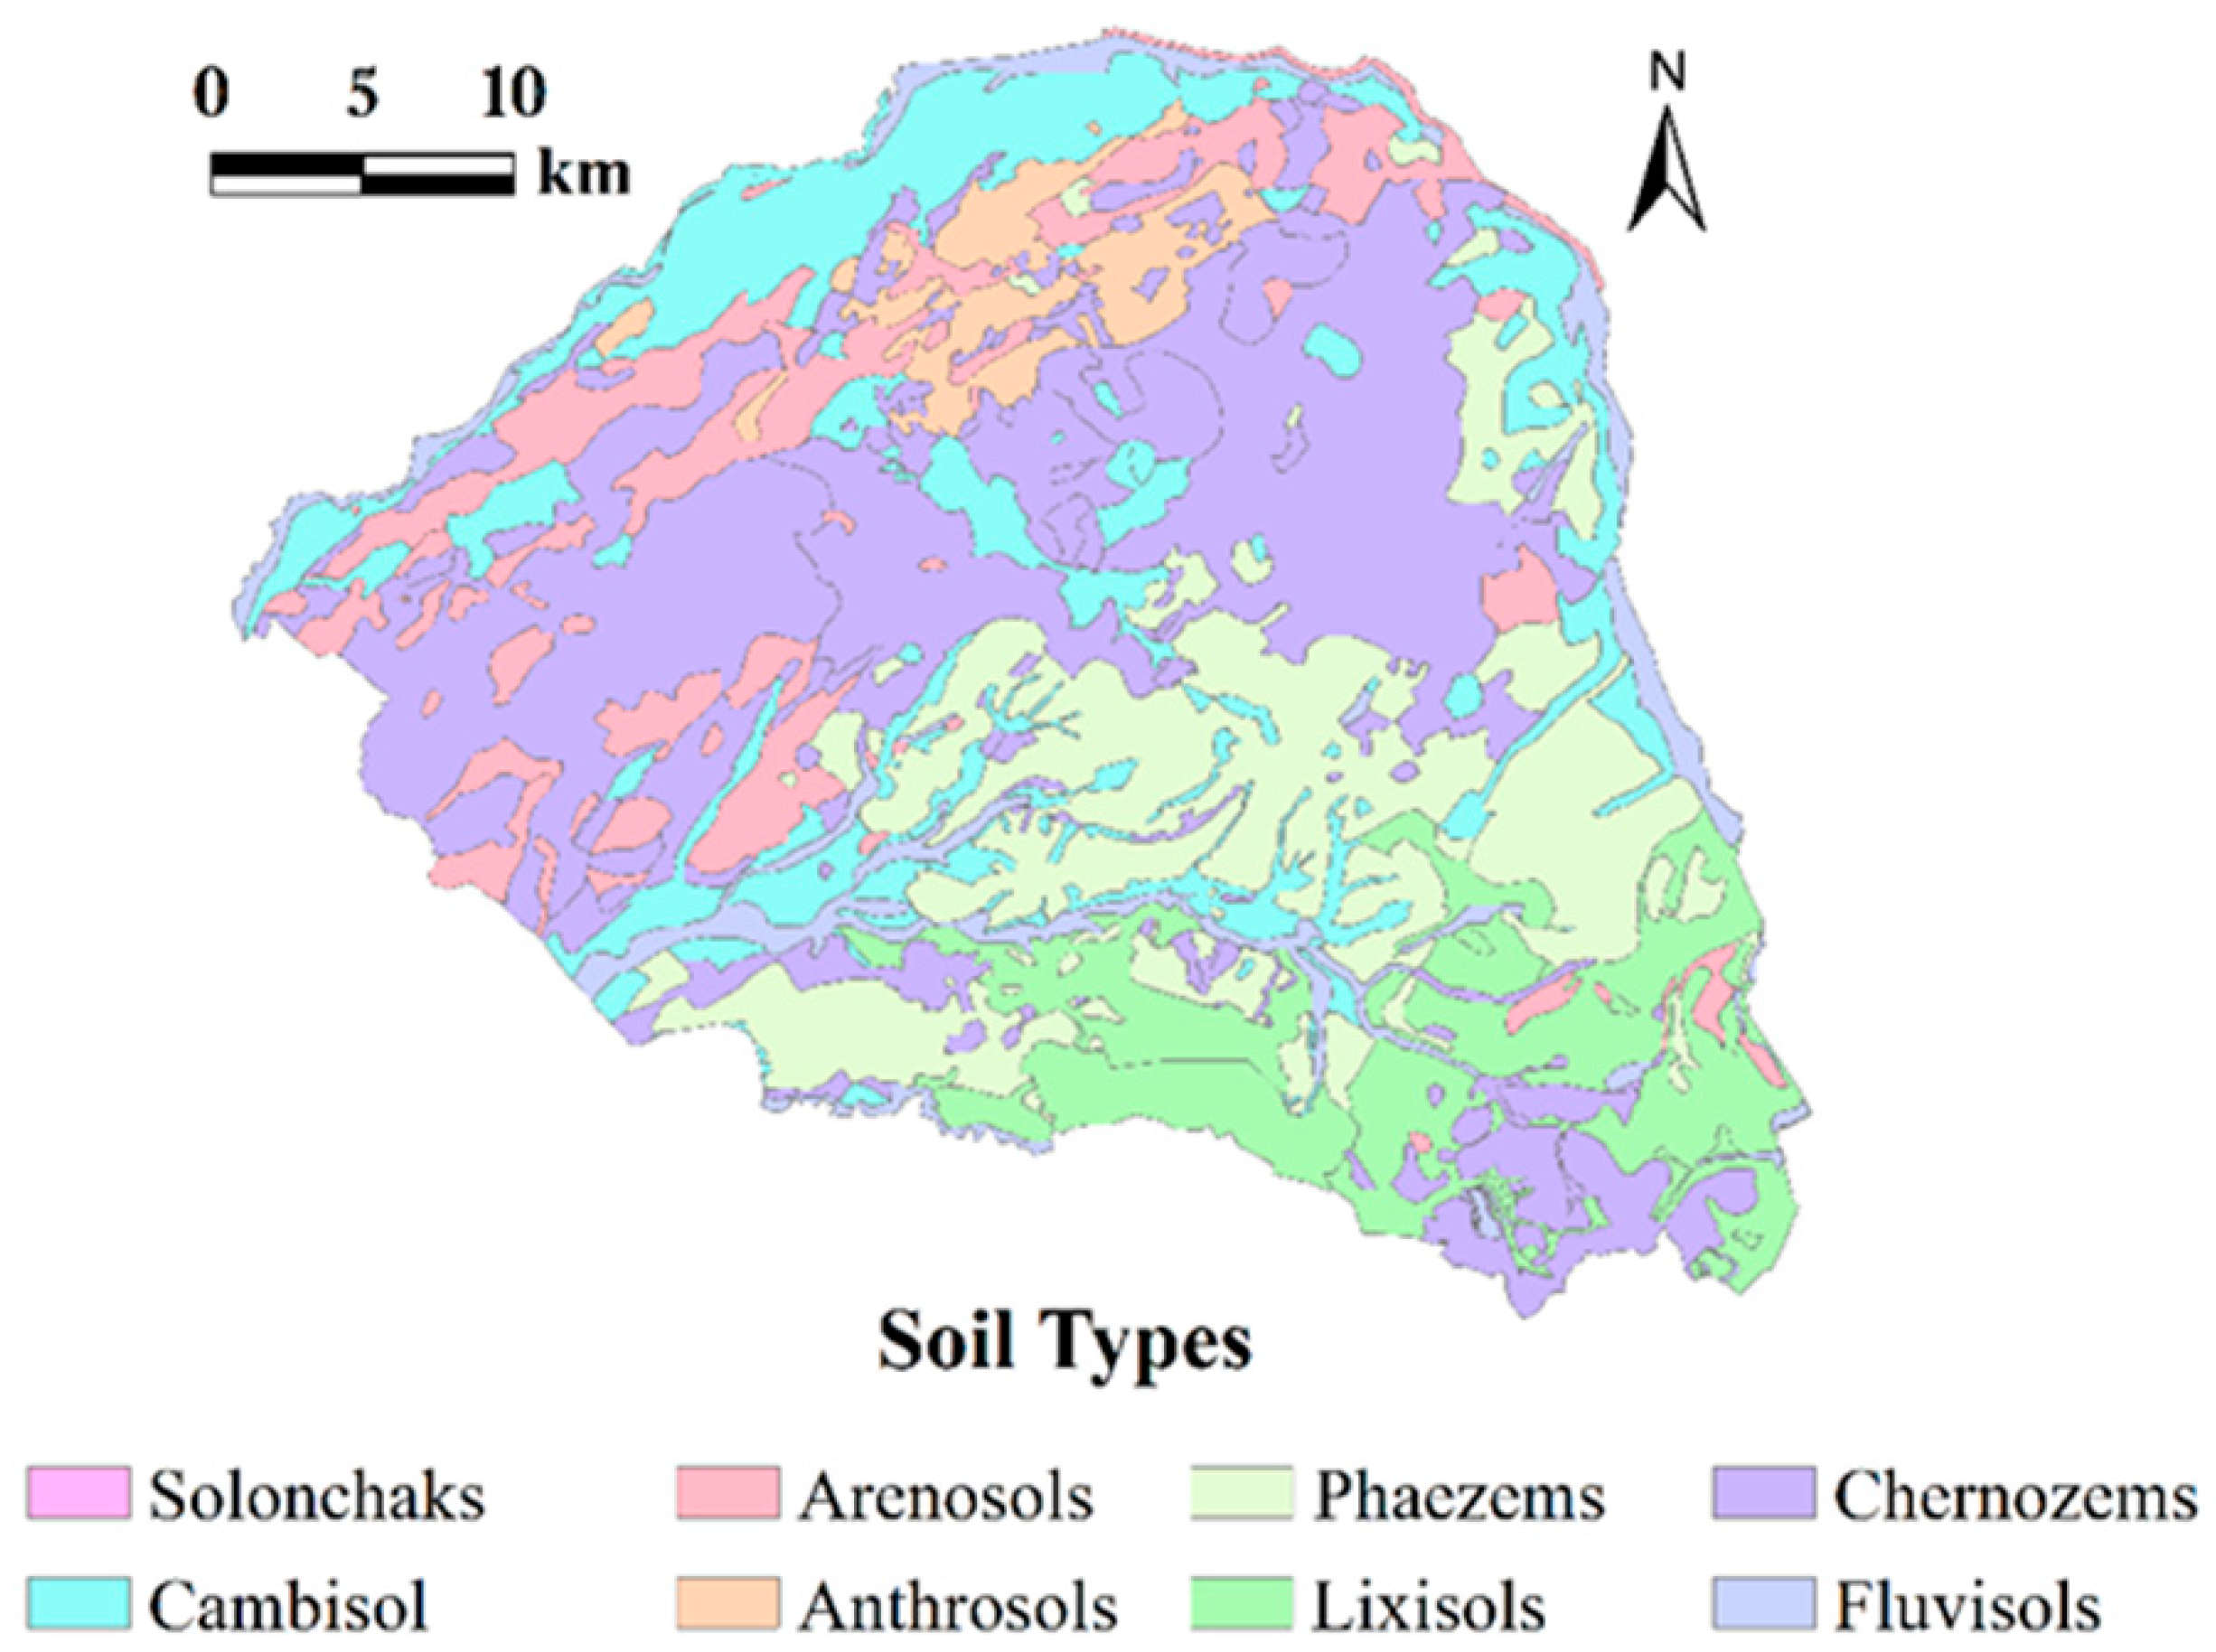
The soil parent material in Lishu County gradually varies from mostly weathered rocks and red sediments in the eastern mountains to loess-like sediment and loessial sub-sandy soil in the west. Soil types were characterized, with 8 soil series according to the World Reference Base for Soil Resources (Figure 2; IUSS Working Group, 2015) [1]. The soil textures in the study area include clay, clay loam, loam, and sandy, according to the International Classification System of Soil Texture. The eastern part of the county is mainly clay soil, the central part is mainly clay loam and loam soil, and the western part is mostly sandy soil. The soil texture varied from clay to sandy from southeast to northwest.
The main crop in Lishu County is corn, planted in the middle of May and harvested at the end of September. In 1980, corn planted 102,067 ha, accounting for about 50% of the planted area. Lishu County is China’s commodity grain base county [23]. The annual grain output is more than 2.5 billion kg, ranking first in China. There is no artificial irrigation, and only natural precipitation is used as a source of crop water in the area. Derived from the Statistic Bureau of Jilin (http://tjj.jl.gov.cn/, accessed on 7 April 2022), the total chemical fertilizer is 137,790, 142,352, 148,848, 176,676, 186,665, and 205,179 tons in 1992, 2007, 2009, 2012, 2015, and 2018, respectively (Table 1). In the 1980s, most of the straw was harvested to meet the shortages in fuel for cooking and heating without returning them to the soil. In 1999, China implemented various economic incentives and demonstration plans to promote straw return to fields [24], resulting in an increasing number of farmers willing to return stalks. From 2006 to 2015, the Ministry of Agriculture and the Finance Department of Jilin Province invested a total of about $2 million for the demonstration and promotion of conservation tillage technology [obtained from a Jilin Provincial People’s Government report (http://www.jl.gov.cn/, accessed on 7 April 2022)]. With policy incentives, straw return technology was popularized in Lishu County. The county produces many corn stalks every year. In 2007, a research base was established in Gaojia Village, Lishu County, and the area of straw return is 15, 218, 2880, 10507, and over 33000 ha in 2007, 2009, 2012, 2015, and 2018, respectively (Table 2). The practice is to return all the straw to the field planted with maize, followed by no-tillage, strip tillage, and rotary tillage once a year [25].

2.2. Laboratory Analysis

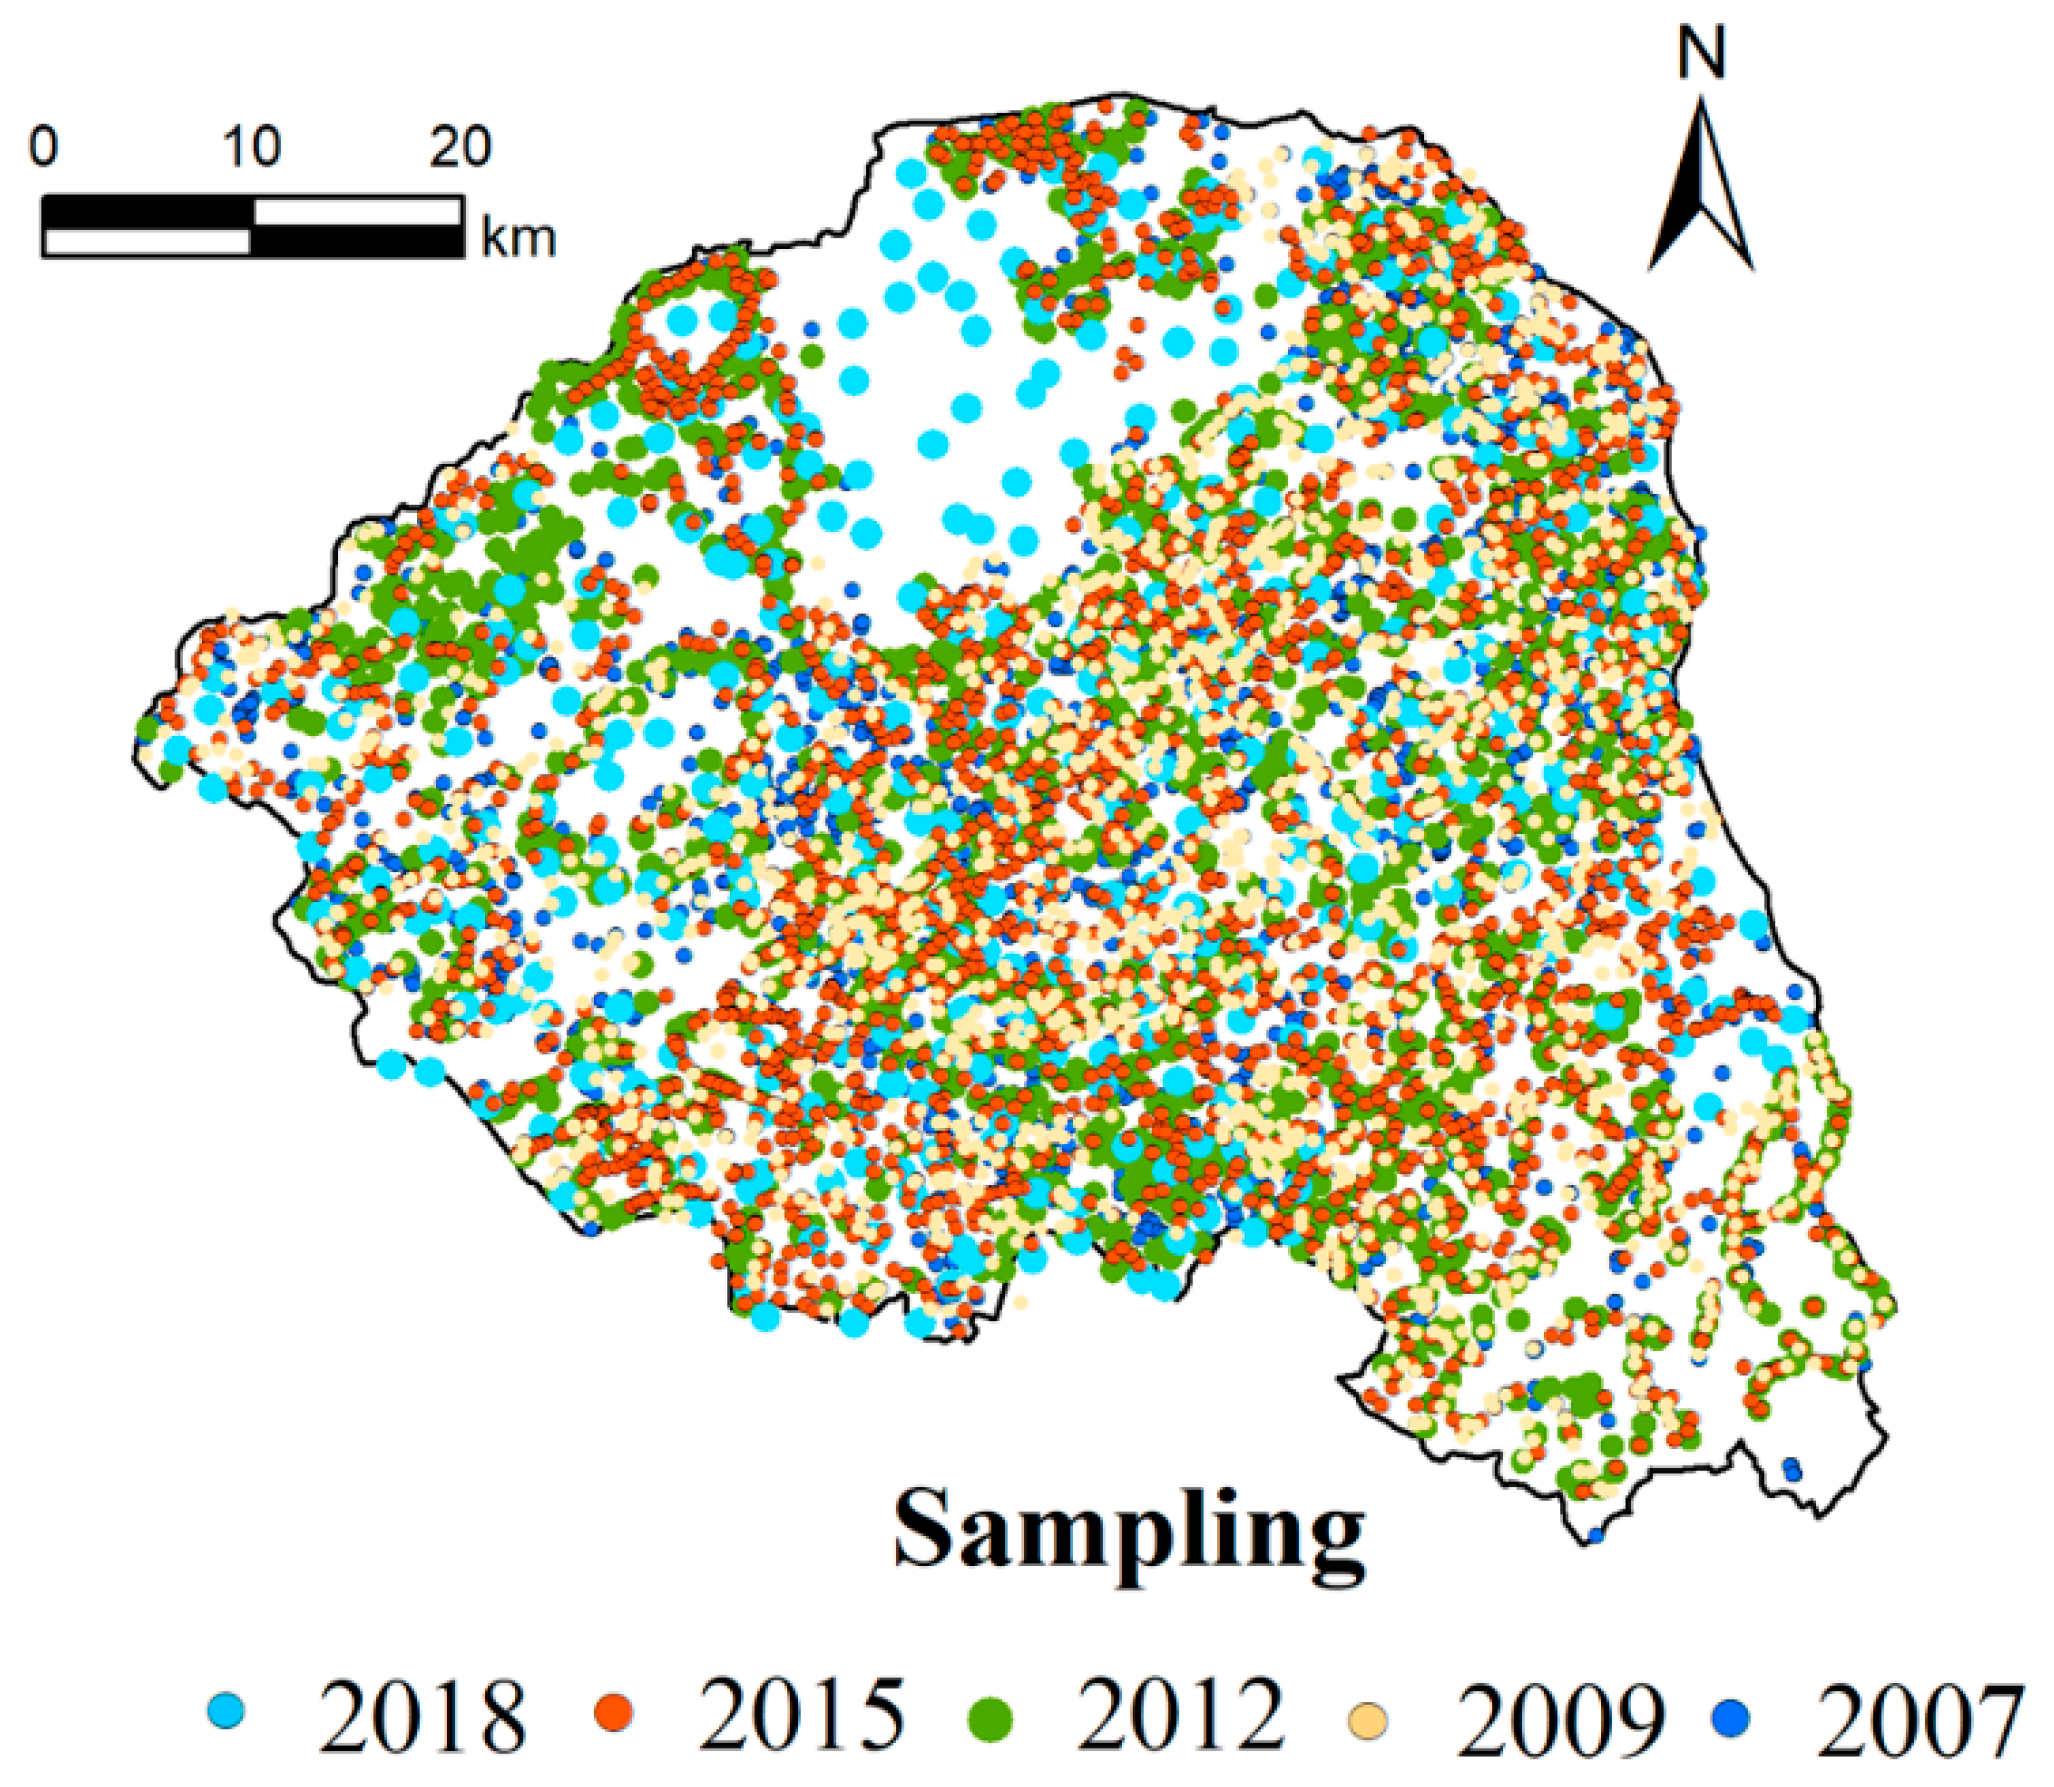
The local agricultural technology extension station offered the SOM values measured all over Lishu County in 2007, 2009, 2012, 2015, and 2018. Sampling sites (Figure 3) were selected according to the previous sampling sites, the local landforms, and soil types. Approximately 9000 samples were taken from the top 0.2 m of the soil. Each sample location recorded the longitude, latitude, parent material, soil type, altitude, and planted crops. The SOM spatial distribution of the 1980s was derived from the Harmonized World Soil Database [26].
For each soil sample point, three or four soil samples within 10 m were collected and mixed together. After 3 kg of soil was taken from the composite samples at each sampling point, all samples were air-dried and screened by a 2 mm sieve to conduct chemical analysis. Identical methods were used for measuring the SOM content and soil texture for all sampling. The SOM content was determined by the potassium dichromate method [27], and soil texture analysis was measured by the hydrometer method [28].

2.3. Statistical and Geostatistical Analyses

A basic mathematical statistical method was used to calculate the skewness, kurtosis, minimum, maximum, mean, standard deviation (SD) and coefficient of variation (CV) of the data sets. Analysis of variance (ANOVA) procedure followed by least-significant difference (LSD) tests at probability = 0.05 probability level was used to determine how soil type and soil texture influence organic matter. The Pearson Correlation analysis was used to quantify the correlation between SOM and topography. These statistical parameters were calculated with SPSS 21.0.
Geostatistics can effectively demonstrate spatial variations in soil properties [29,30,31]. The semi-variance function by the geostatistical method [32] is as follows:
γ ( h ) = 1 / 2 N ( h ) × i = 1 i = N ( h ) [ v ( x i ) v ( x i + h ) ] 2  
where:   v ( x i ) and v ( x i + h )   are the measured values of regionalized variables v ( x ) at positions x i and   x i + h , respectively; γ ( h ) is the semi-variance when the lag distance is h ; and N ( h ) is the number of observation pairs within the lag distance, h . The exponential and gaussian models were fitted to the semi-variance function.
Exponential model:
γ ( h ) = { 0                                                                           h = 0 c 0 + c [ 1 e x p ( h / a ) ]         h > 0  
Gaussian model:
γ ( h ) = { 0                                                                           h = 0 c 0 + c [ 1 e x p ( h 2 / a 2 ) ]         h > 0  
where c 0 is the nugget; c is the structural variance; c 0 + c is still the value; with increasing lag distance h, the constant value of γ ( h ) varies from the nonzero value to a relatively stable constant, which is the still value ( c 0 + c ), and   c 0 is γ ( h = 0 ) . a is the spatial correlation range.
R software [33] was used to analyze the semi-variogram model of SOM contents to obtain the best type of theoretical models and the best parameters by the cross-validation method. In the study, the exponential and Gaussian models performed best, so they were adopted. Ordinary kriging interpolation (OK) was conducted in ArcGIS software (Version 10.2). Due to a lack of sampling points in some towns, the corresponding interpolation results were not considered in the results and discussion to ensure accuracy. Based on the standards set by the Second National Soil Survey, the SOM was classified into “six classes”: <6 g kg−1 (class VI), 6–10 g kg−1 (class V), 10–20 g kg−1 (class IV), 20–30 g kg−1 (class III), 30–40 g kg−1 (class II), >40 g kg−1 (class I). The percentage of SOM content in the study area of various grades was calculated using ImageJ [34].

2.4. Statistical Assessment

The performance was evaluated using the root mean square error (RMSE) and the coefficient of determination (R2). These indices were used to access the accuracy of the geostatistical method in the study. The best-fitted parameters of semi-variogram models were obtained by R2 (approaching 1) and RMSE (as small as possible), explained by the following equations:
R M S E = ( 1 / n × i = 1 n ( p i o i ) 2 ) 1 / 2  
R 2 = 1 i = 1 n ( p i o i ) 2 / i = 1 n ( p i o ^ i ) 2  
where o i is the measured value, p i is the predicted value, ^ i is the standard deviation of the predicted value, o ^ i is the average value of the observation, and n is the sampling number.

3. Results and Discussion

3.1. Descriptive Analysis of SOM

Table 3 gives the statistical description of SOM content each year. Due to the gradual promotion of straw return technology in Lishu County since 2007, the mean SOM content gradually grew from 18.94 g kg−1 in 2007 to 20.84 g kg−1 in 2018. Similarly, Zheng et al. (2015) [35] reported that the SOM content increased at a rate of 0.24 g kg−1 yr−1 from 1996 to 2011 in Huantai County, China, due to straw return. In contrast to our findings due to the lowest straw return amount in Northeast China, Zhao et al. (2018) [36] found that the soil organic carbon content of Northeast China lost 0.41 Mg C ha−1 during 1980–2011.
All years’ CVs fluctuated between 0.18 and 0.38 (Table 3), indicating moderate variation [37]. The moderate variation could be linked to heterogeneity in the topography, parent material, soil type, soil texture, and agricultural management practices. This result was in line with the results of relevant studies [38,39].

3.2. Spatial Structure Analysis of SOM

The spatial ranges tended to decrease from 159.66 km in 2007 to 30.09 km in 2018 (Table 4), indicating that the influence of human activities on SOM spatial variation is increasing. Cambardella et al. (1994) [29] revealed that C0/Sill values of 0.75–1.00, 0.25–0.75, and 0.00–0.25 reflect weak, moderate, and strong spatial dependence. In the study, the C0/Sill ratio of 2009 (smaller than 0.25) and other years (0.25–0.70) showed strong and moderate spatial dependence of SOM, respectively, due to heterogeneity of agricultural management practices and natural factors.

3.3. Spatial and Temporal Variation of SOM

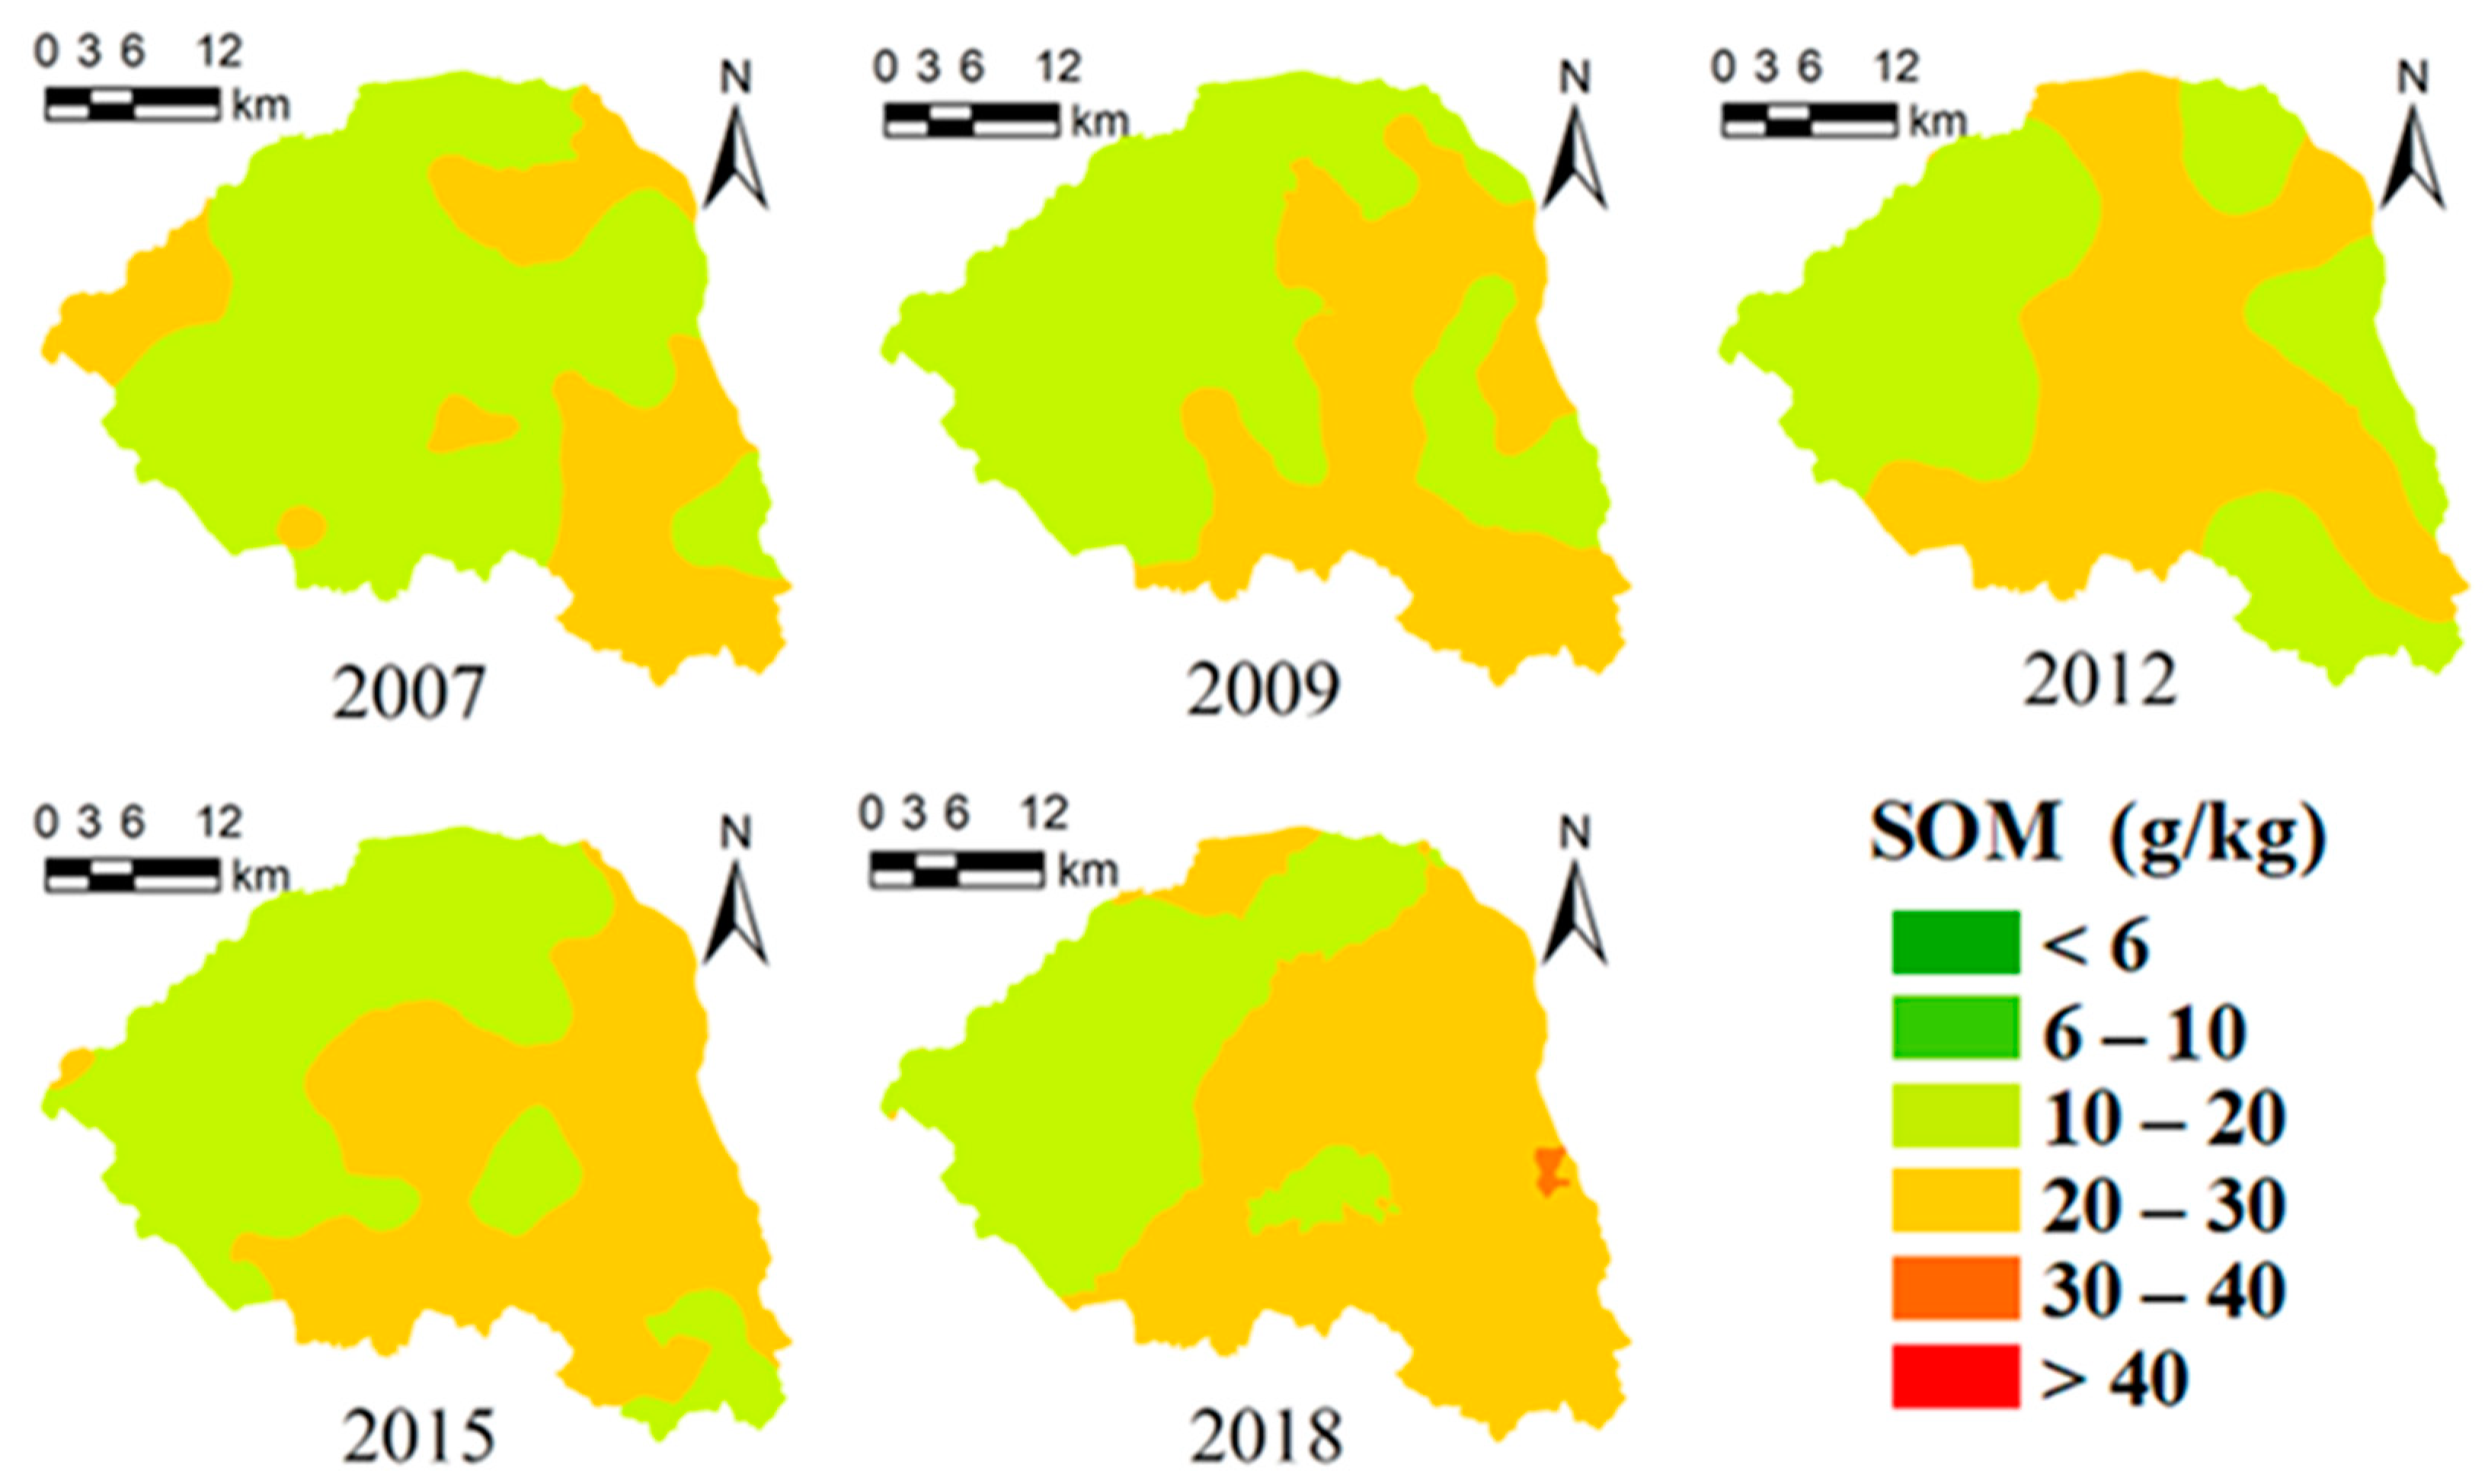
Figure 4 presents the maps of SOM in 2007, 2009, 2012, 2015, and 2018 obtained by OK [40]. The surface SOM content in Lishu County decreased from southeast (20–30 g kg−1) to northwest (10–20 g kg−1) each year. In the northwest of Lishu County, especially in LH, LJG, and SY towns, the soil type is mainly Arenosols with low SOM content. The areas with high SOM values were mainly distributed on Phaezems. The SOM content was almost constant in western Lishu County but increased in the central and southern areas.
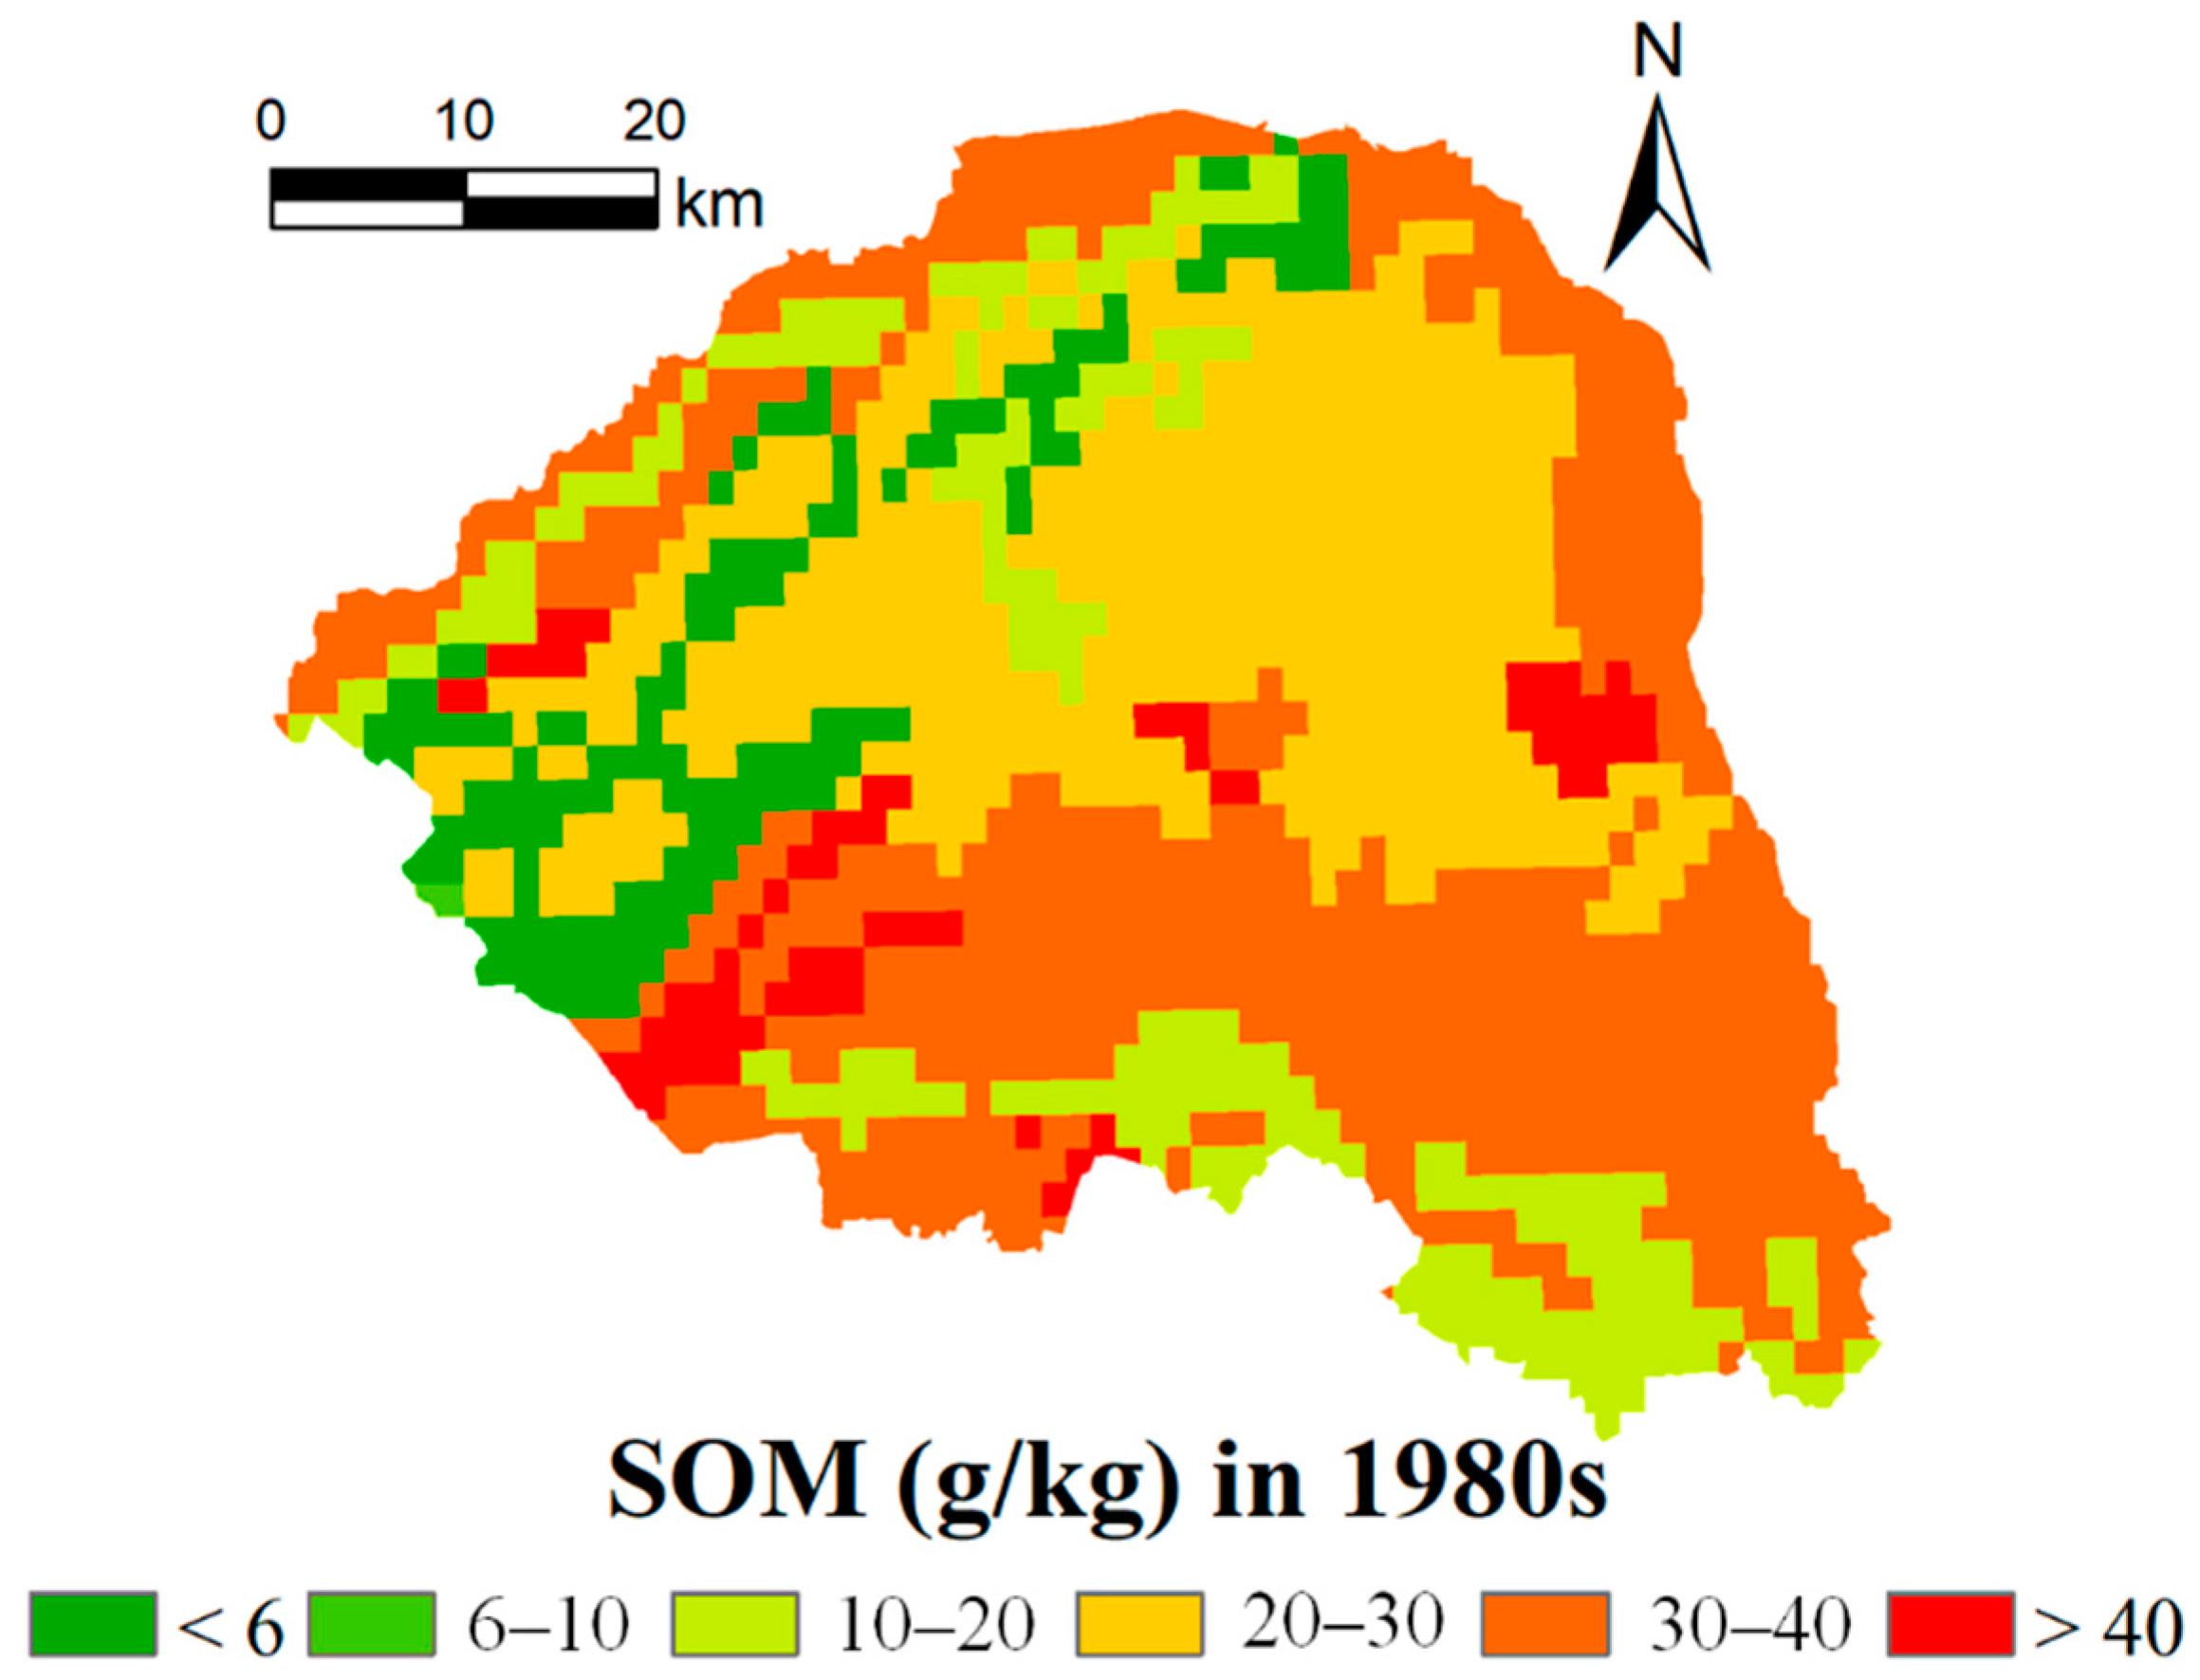
The SOM content in the 1980s ranges from 2.1 to 64.26 g kg−1 with a mean value of 24.38 g kg−1 (Figure 5). The mean SOM content in the 1980s was significantly higher than that in 2007. Table 5 shows that the SOM of 72.0% of the study area ranged from 20 to 40 g kg−1 in the 1980s, mainly belonging to classes II and III. During 2007–2018, SOM in almost all areas ranged from 10 to 30 g kg−1, and the range belongs mainly to classes III and IV. The area of high SOM values gradually increased from 32.2% to 60.5%, which mainly extended to the southeast and center of Lishu County. In 2007, a research base was established in Gaojia Village, Lishu County, and straw return technology was popularized. The increasing proportion of high SOM values indicated that straw return contributes significantly to the SOM accumulation.

3.4. Effects of Straw Return and Environmental Factors on SOM

Many studies have revealed that soil texture, land use, altitude, soil type, and farmland management measures play an essential role in the spatial distribution of SOM [41,42]. The corn planting area accounted for over 70% of the total sown area in Lishu County. Only 0.3% of the samples were not taken from cornfields. So, the study discussed the influence of soil type, soil texture, altitude, and straw return on SOM content, while ignoring land-use types.

3.4.1. Effects of Soil Types on SOM Accumulation

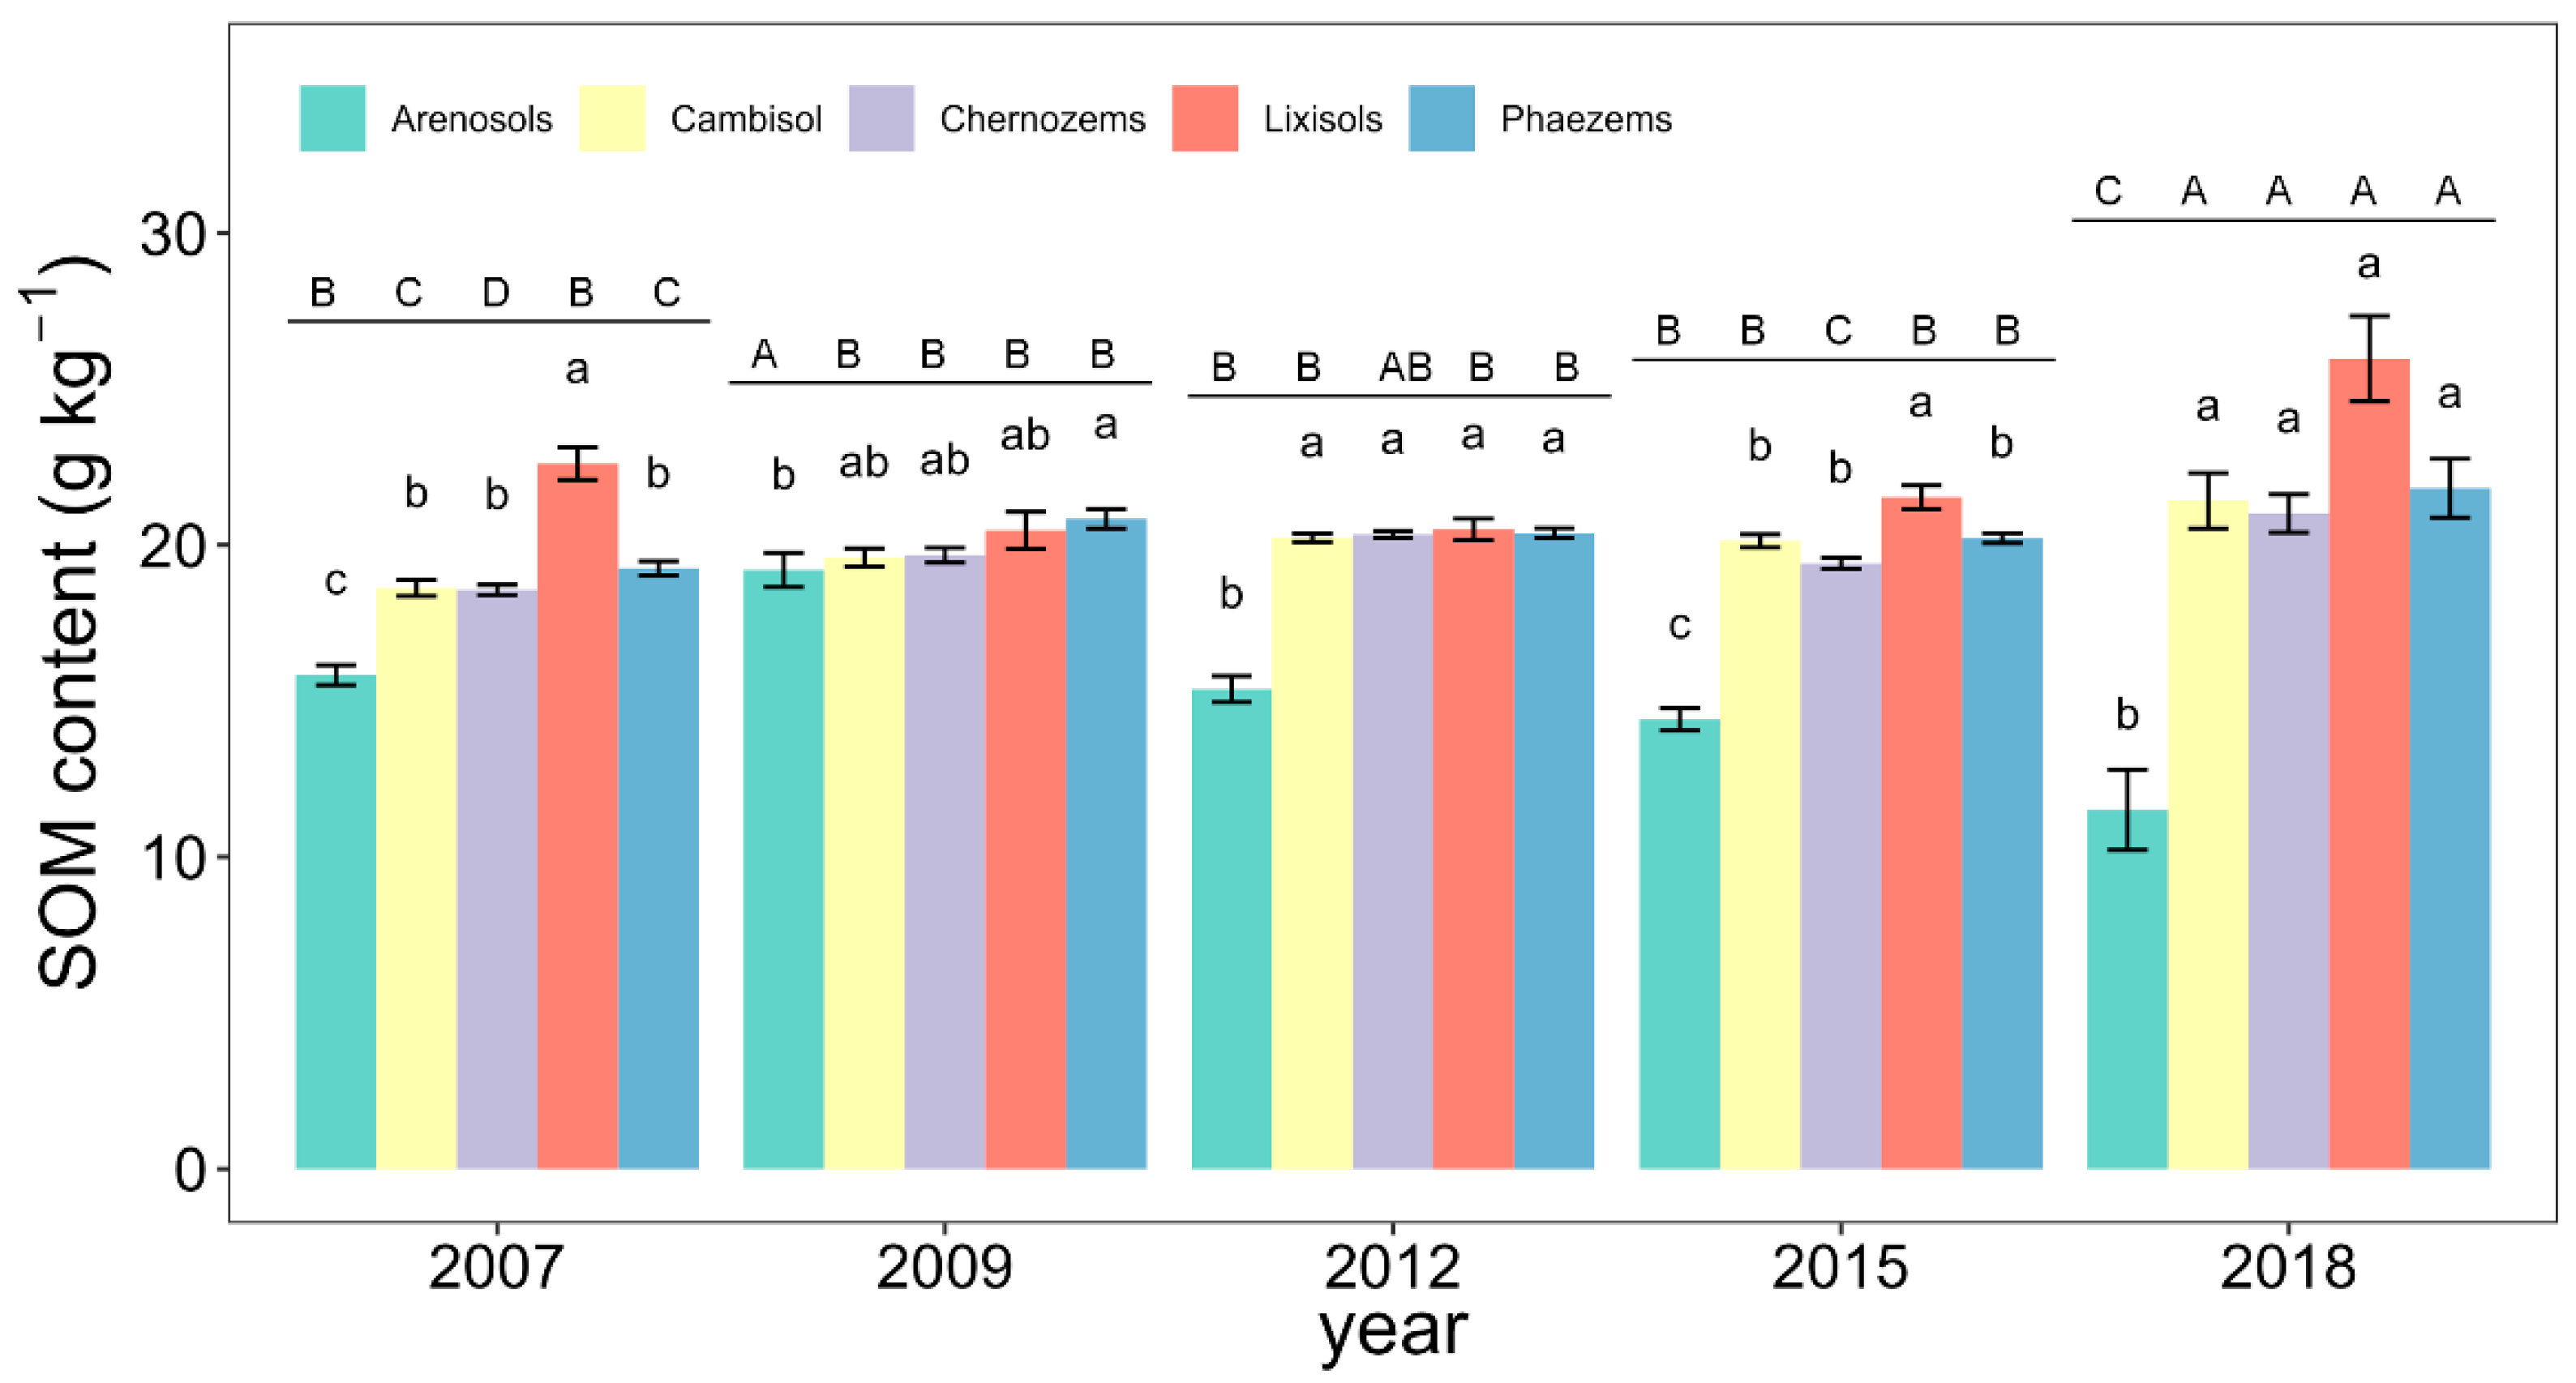
Diverse soil types lead to heterogeneous distributions of SOM. The mean SOM content in Phaezems and Lixisols was higher than that in other soil types (Figure 6). Consistent with the distribution of Phaezems and Lixisols (Figure 2), southern and eastern Lishu County mainly showed high SOM content. The SOM contents followed the order of Lixisols > Phaezems ≈ Cambisols ≈ Chernozems > Arenosols.
The SOM of natural black soil can reach 40–60 g kg−1 [2]. In the study, SOM contents in Phaezems ranged from 19.25 to 21.82 g kg−1 (Figure 6), which is far lower than that in natural Phaezems and even lower than that in cultivated farmland. Liu and Yan (2009) [43] proposed that due to excessive human management, land degradation, and environmental pollution, SOM can decline to 20–30 g kg−1 after reclamation. This result indicated that the degradation of Phaezems is severe. However, from 2007 to 2018, almost all soil types except Arenosols experienced SOM increases to varying degrees due to implementing a straw return policy. So, straw return is one way to prevent soil degradation in the black soil region. This opinion was supported by Amelung et al. (2020) [44].

3.4.2. Effects of Soil Texture on SOM Accumulation

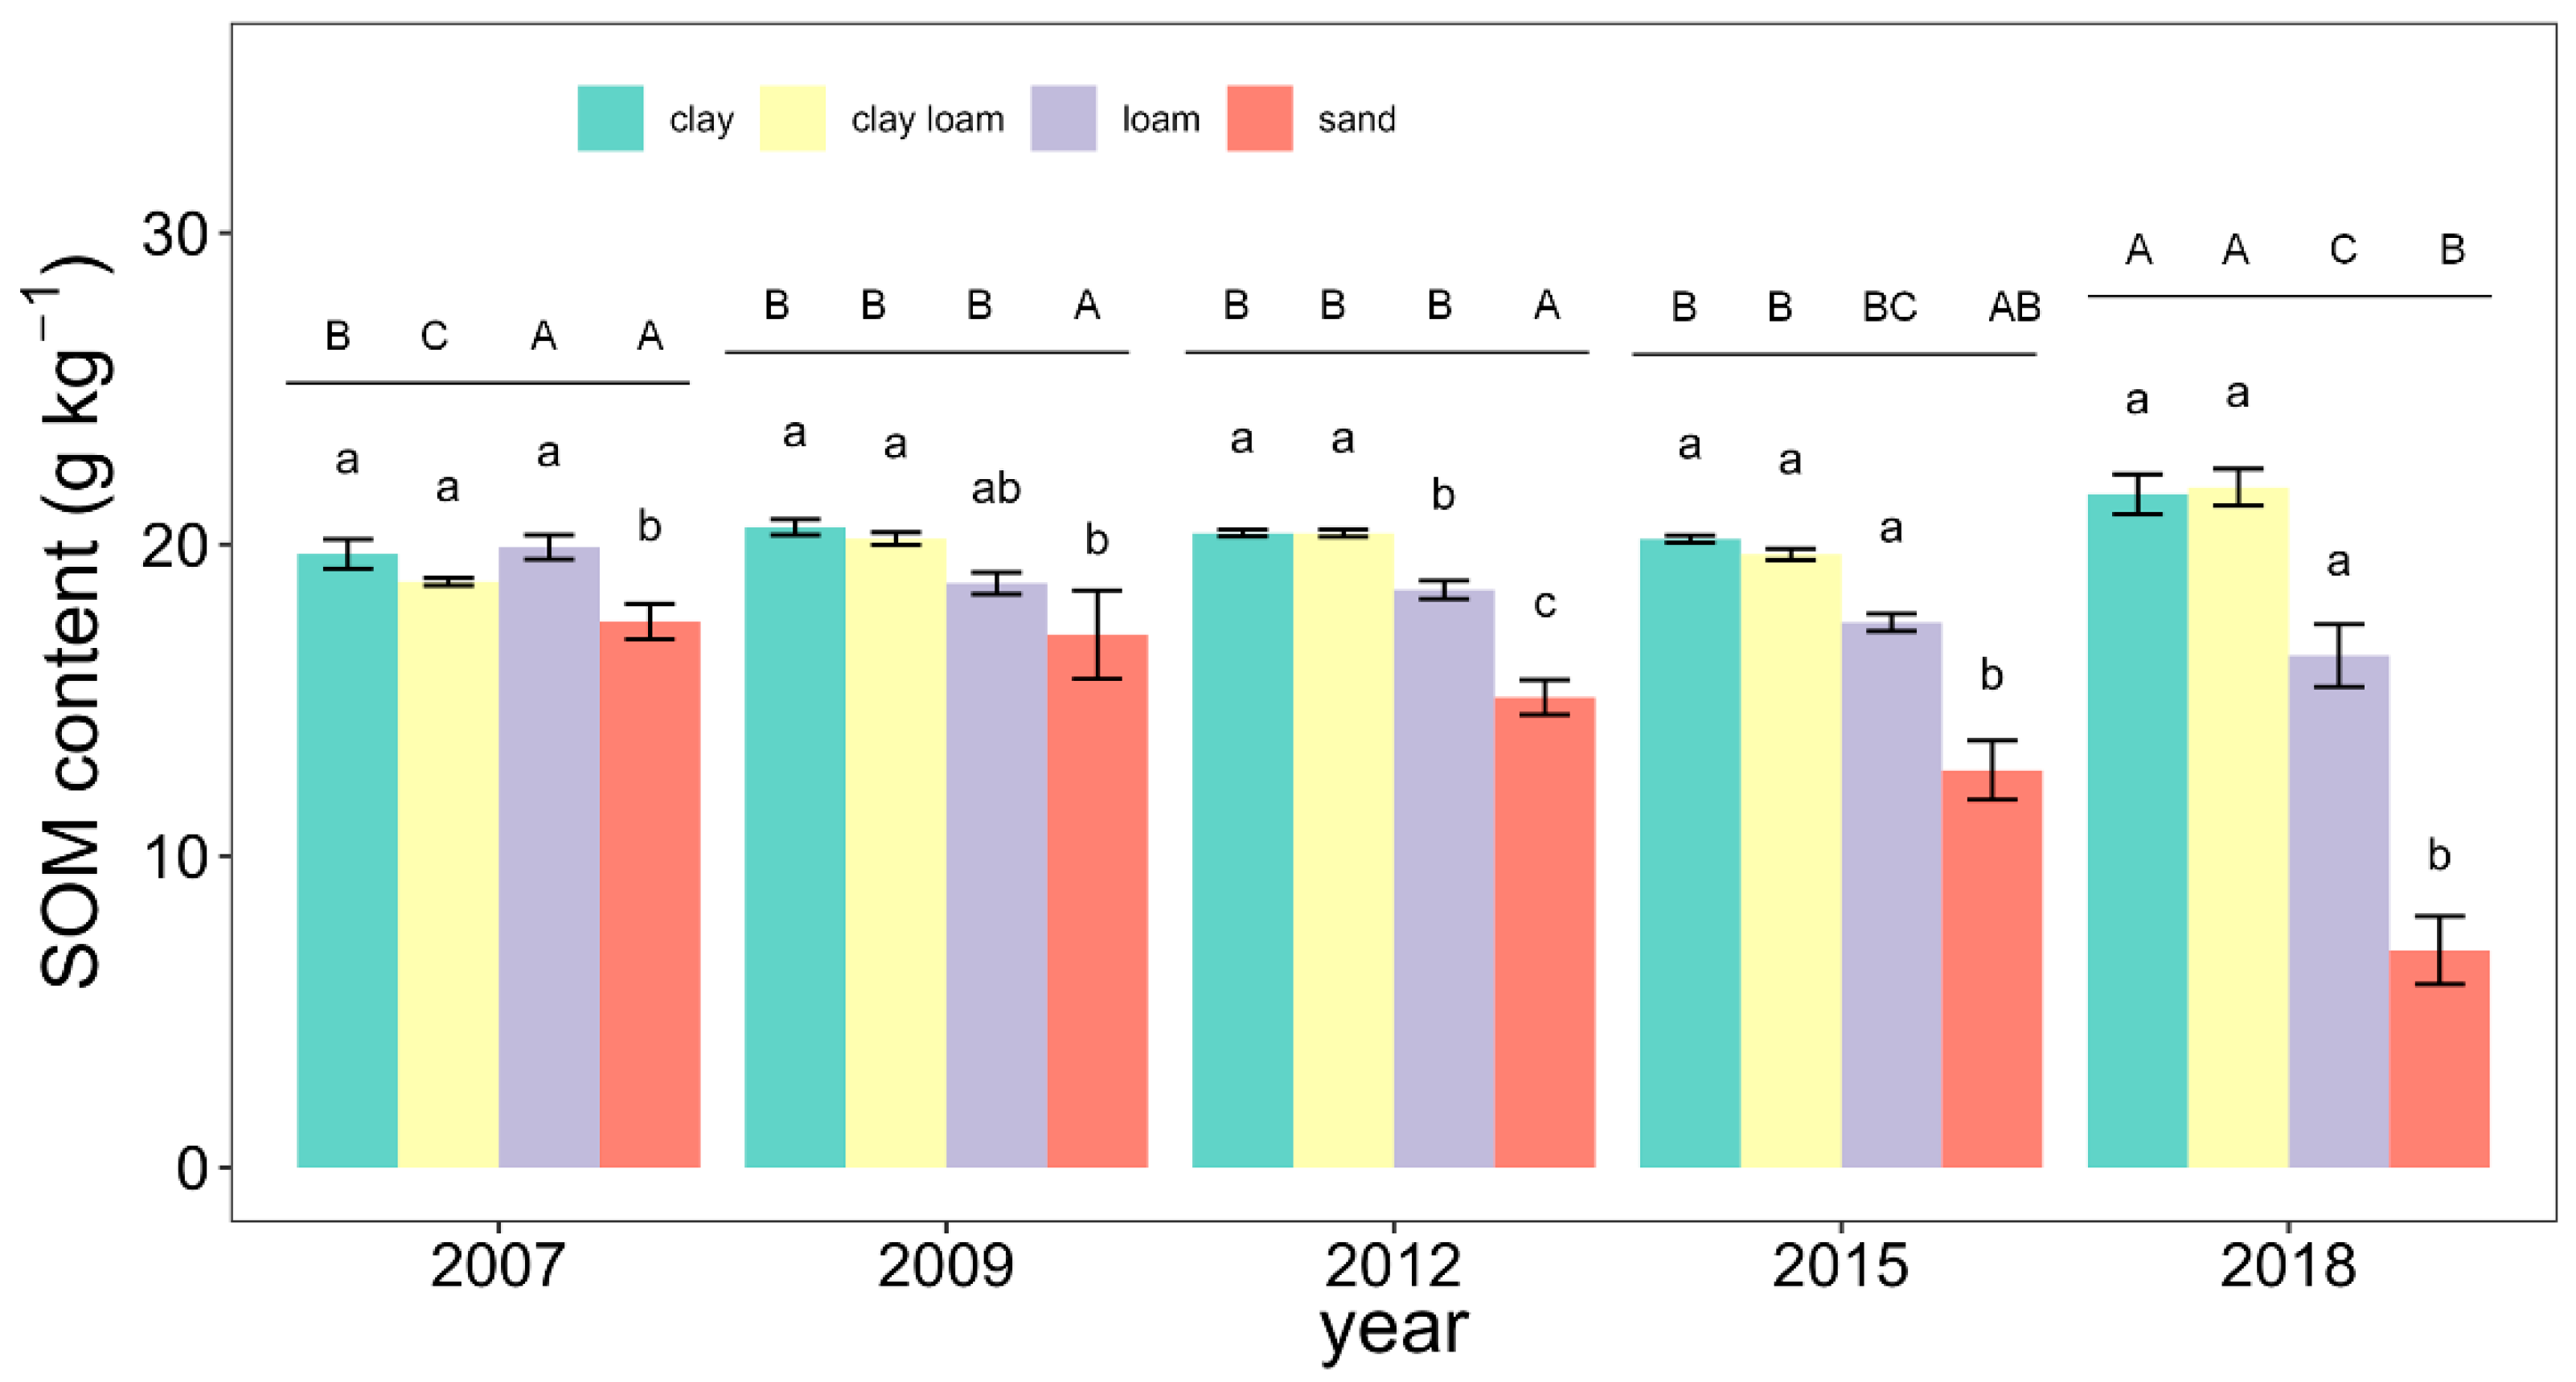
Clay particles have a high specific surface area and charge, so their role in SOM stabilization is remarkable. Several previous studies have demonstrated that soil clay content is directly proportional to SOM content [45,46]. These results are consistent with our study in that SOM contents followed the order of clay ≈ clay loam > loam > sand (Figure 7) for almost all years.
Consistent with the previously shown spatiotemporal variation trend, SOM contents in clay and clay loam increased. However, the trend of SOM variation was in contrast to that in loam and sand, implying that clay minerals play an essential role in SOC stabilization against the background of straw return. Liu et al. (2014) [12] reported that clay content is the primary explanatory variable of the organic carbon response to straw return. One possible explanation for this observation was that soils with high clay content ensure chemical stability and physical protection by improving aggregation [47]. Consequently, straw return performs better in clay soils with a higher sequestration potential than that in light-textured soils in the black soil region.

3.4.3. Effects of Elevation on SOM

In the study, SOM contents positively correlated with elevation (range: 64–491 m) each year (Table 6), and correlation were significant in most years (0.054 in 2007; 0.067 in 2015; 0.370 in 2018) (p < 0.01). The finding is in line with results obtained from low-altitude areas. For example, Wang et al. (2012) [9] claimed that SOM contents positively correlated with North China elevation. Dai and Huang (2006) [48] revealed that surface SOM concentration positively correlated with altitude in Northeastern China (0.278**). However, some findings differ from ours, which may be due to the varied relationship between SOM and environmental factors in various regions. Djukic et al. (2010) [49] claimed that SOM content continuously increased with a higher elevation below approximately 1500 m but decreased thereafter. In low-altitude areas, with increasing altitude, microbial activity decreased with the decreasing temperature, and thus SOM decomposition decreased [50]. While in high-altitude areas, less vegetation growth and a tendency to erosion and slumping lead to less SOM. The black soil is distributed on the plain with low elevation (lower than 1500 m) [25]. Therefore, the SOM value in the black soil region is positively correlated with elevation.

3.4.4. Effects of Straw Return on SOM Accumulation

Farmland management measures, including chemical fertilization, mechanization, and straw return, play a vital role in SOM variation. Average SOM contents decreased from 24.38 g kg−1 in the 1980s to 18.94 g kg−1 in 2007. Since the 1980s, farmers began the introduction of heavy agricultural machinery and excessive application of chemical fertilizers (Table 1) in Lishu County. The repeated use of agricultural machinery made the soil bulk density high and beyond the suitable tilth range for crop production, resulting in heavy wind and water erosion and subsequently leading to a significant decrease in SOM. In addition, the increasing fertilizer inputs, especially excessive N fertilizer (http://www.lishu.gov.cn/, accessed on 7 April 2022), had a negative effect on the accumulation of SOM [36,51].
Due to the use of heavy agricultural machinery and excessive application of chemical fertilizers, SOM should have declined from 2007 to 2018. However, not as expected, the mean SOM increased during 2007–2018 due to the straw return. The straw return technology was popularized in 2007 in Lishu country (Table 2). It reduces the entry of machinery and restores the porous soil because straw return enhances the natural buildup of soil structure by means of soils having more shrink-swell characteristics due to the higher SOM. The fertilizer input increased the crop dry matter production and, therefore, the straw inputs in the soil, resulting in SOM accumulation [36].
With the increase of land area benefiting from the straw return policy imposed by the Chinese government, SOM contents increased from 18.94 g kg−1 in 2007 to 20.84 g kg−1 in 2018, leading to a corresponding increase in yield. As Lishu County’s main crop, corn has an annual planting area of approximately 130,000 ha. From 2007 to 2018, the yearly yield of grain continually increased and remained at over 2,000,000 tons (People’s government of Lishu County, 2007–2018). The variation was consistent with the change in SOM contents and the area of straw return.
Forty years ago, instead of being returned to the soil, straw was used as fuel for heating or feeding livestock [15]. This phenomenon led to carbon dioxide emissions, continuous soil nutrient reduction, and environmental pollution. However, the economic incentives policy led to a fundamental change in the straw return area. Previous studies have indicated that straw return could benefit the SOM accumulation in the black soil region [2,36]. After decaying, the straw will be transformed into organic matter, enter the soil, and supplement nutrients to improve soil fertility. In this way, crop yield can be further improved, the cost can be reduced, and income can be increased. The increase in crop yield can increase the amount of straw that returns to the field, thus forming a beneficial cycle.

4. Conclusions

The study evaluated the spatial and temporal variation of SOM and analyzed the effects of soil types, texture, elevation, and human management on the variation based on approximately 9000 measured data in 2007, 2009, 2012, 2015, and 2018 in Lishu County, a typical black soil region. The results show that: the average SOM contents decreased from 24.38 g kg−1 in the 1980s to 18.94 g kg−1 in 2007. In contrast, the mean SOM content gradually increased from 2007 to 2018 after implementing straw return practices by conservation tillage practices. During 2007–2018, the area of SOM within 20–30 g kg−1 increased from 32.2% to 60.5%. The SOM of the study area in 2007–2018 ranged from 10 to 30 g kg−1, mainly belonging to classes III and IV. In 2018, the SOM within 30–40 g kg−1 emerged. These results indicated that straw return practices were beneficial to SOM accumulation in the black soil region. However, the SOM contents in Phaezems ranged from 19.25 to 21.82 g kg−1, far lower than that in natural Phaezems, indicating that the degradation of black soil regions is severe. The research found that clay content is a major explanatory variable for the response of SOM to straw return. Straw return practices are promising measures, and it is worthwhile exploring more effective approaches to allow straw return to play a better role, especially in light-textured soils.
The results of this study can provide some guidance for conservation tillage measures. In this study, some organic matter values were smoothed out due to the smoothing effect of kriging. Therefore, it is necessary to perform digital soil mapping and quantify the reason for the SOM variation in the future.

Author Contributions

Conceptualization, W.J. and Y.Y.; data curation, G.W.; methodology, W.J. and Y.Y.; writing—original draft preparation, Y.Y.; validation, B.H. and C.Z.; writing—review and editing, W.J., G.W., B.H., C.Z. and A.M.M.; supervision, W.J., B.L. and A.M.M.; project administration, W.J. and B.L.; funding acquisition, W.J. All authors have read and agreed to the published version of the manuscript.

Funding

The study was supported by the National Natural Science Foundation of China (42001048), State Key Laboratory of Resources and Environmental Information System (2020), the Fundamental Research Funds for the Central Universities (2020TC205), the Key Laboratory of Spectroscopy Sensing, Ministry of Agriculture and Rural Affairs, P.R. China (2020ZJUGP001) and the Project of Department of Education Science and Technology of Jiangxi Province (GJJ210541).

Institutional Review Board Statement

Not applicable.

Informed Consent Statement

Not applicable.

Data Availability Statement

The data that support the findings of this study are available on request from the corresponding author.

Conflicts of Interest

The authors declare no conflict of interest.

References

  1. IUSS Working Group WRB. World Reference Base for Soil Resources 2014; FAO: Rome, Italy, 2015. [Google Scholar]
  2. Xu, X.Z.; Xu, Y.; Chen, S.C.; Xu, S.G.; Zhang, H.W. Soil loss and conservation in the black soil region of Northeast China: A retrospective study. Environ. Sci. Policy 2010, 13, 793–800. [Google Scholar] [CrossRef]
  3. Fabrizzi, K.P.; Moron, A.; García, F.O. Soil carbon and nitrogen organic fractions in degraded vs. non-degraded Mollisols in Argentina. Soil Sci. Soc. Am. J. 2003, 67, 1831–1841. [Google Scholar] [CrossRef]
  4. Russell, A.E.; Laird, D.; Parkin, T.B.; Mallarino, A.P. Impact of nitrogen fertilization and cropping system on carbon sequestration in Midwestern Mollisols. Soil Sci. Soc. Am. J. 2005, 69, 413. [Google Scholar] [CrossRef] [Green Version]
  5. Ondrasek, G.; Bakić Begić, H.; Zovko, M.; Filipović, L.; Meriño-Gergichevich, C.; Savić, R.; Rengel, Z. Biogeochemistry of soil organic matter in agroecosystems & environmental implications. Sci. Total Environ. 2019, 658, 1559–1573. [Google Scholar]
  6. Ciais, P.; Gervols, S.; Vuichard, N.; Piao, S.L.; Viovy, N. Effects of land use change and management on the European cropland carbon balance. Glob. Chang. Biol. 2011, 17, 320–338. [Google Scholar] [CrossRef]
  7. Li, H.; Pei, J.B.; Wang, J.K.; Li, S.Y.; Gao, G.W. Organic carbon density and storage of the major black soil regions in Northeast China. J. Soil Sci. Plant Nut. 2013, 13, 883–893. [Google Scholar] [CrossRef]
  8. Gutiérrez-Girón, A.; Díaz-Pinés, E.; Rubio, A.; Gavilán, R.G. Both altitude and vegetation affect temperature sensitivity of soil organic matter decomposition in Mediterranean high mountain soils. Geoderma 2015, 237–238, 1–8. [Google Scholar] [CrossRef]
  9. Wang, S.; Wang, X.; Ouyang, Z. Effects of land use, climate, topography and soil properties on regional soil organic carbon and total nitrogen in the Upstream Watershed of Miyun Reservoir, North China. J. Env. Sci.-China 2012, 24, 387–395. [Google Scholar] [CrossRef]
  10. Lou, Y.; Xu, M.; Wang, W.; Sun, X.; Zhao, K. Return rate of straw residue affects soil organic C sequestration by chemical fertilization. Soil Till. Res. 2011, 113, 70–73. [Google Scholar] [CrossRef]
  11. Dou, X.; He, P.; Zhu, P.; Zhou, W. Soil organic carbon dynamics under long-term fertilization in a black soil of China: Evidence from stable C isotopes. Sci. Rep. 2016, 6, 21488. [Google Scholar] [CrossRef] [Green Version]
  12. Chang, L.; Meng, L.; Jun, C.; Bo, L.; Changming, F. Effects of straw carbon input on carbon dynamics in agricultural soils: A meta-analysis. Glob. Chang. Biol. 2014, 20, 1336–1361. [Google Scholar]
  13. Lu, F. How can straw incorporation management impact on soil carbon storage? A meta-analysis. Mitig. Adapt. Strateg. Glob. Chang. 2015, 20, 1545–1568. [Google Scholar] [CrossRef]
  14. Emanuele, L.; Francesca, B.; Panos, P.; Luca, M.; Arwyn, J. Potential carbon sequestration of European arable soils estimated by modelling a comprehensive set of management practices. Glob. Chang. Biol. 2014, 20, 3557–3567. [Google Scholar]
  15. Lu, F.; Wang, X.; Han, B.; Ouyang, Z.; Duan, X.; Zheng, H.; Miao, H. Soil carbon sequestrations by nitrogen fertilizer application, straw return and no-tillage in China’s cropland. Glob. Chang. Biol. 2009, 15, 281–305. [Google Scholar] [CrossRef]
  16. Wang, J.; Wang, X.; Xu, M.; Feng, G.; Zhang, W.; Lu, C.A. Crop yield and soil organic matter after long-term straw return to soil in China. Nutr. Cycl. Agroecosys. 2015, 102, 371–381. [Google Scholar] [CrossRef]
  17. Pittelkow, C.M.; Liang, X.; Linquist, B.; Groenigen, K.J.V.; Lee, J.; Lundy, M.; Gestel, N.V.; Six, J.; Venterea, R.; Kessel, C.V. Productivity limits and potentials of the principles of conservation agriculture. Nature 2015, 517, 365–368. [Google Scholar] [CrossRef] [PubMed]
  18. Poeplau, C.; Kätterer, T.; Bolinder, M.A.; Börjesson, G.; Berti, A.; Lugato, E. Low stabilization of aboveground crop residue carbon in sandy soils of Swedish long-term experiments. Geoderma 2015, 237–238, 246–255. [Google Scholar] [CrossRef]
  19. Powlson, D.S.; Glendining, M.J.; Coleman, K.; Whitmore, A.P. Implications for Soil Properties of Removing Cereal Straw: Results from Long-Term Studies. Agron. J. 2011, 103, 279–287. [Google Scholar] [CrossRef]
  20. Sosulski, T.; Korc, M. Effects of different mineral and organic fertilization on the content of nitrogen and carbon in soil organic matter fractions. Ecol. Chem. Eng. A 2011, 18, 601–609. [Google Scholar]
  21. Šimanský, V.; Juriga, M.; Jonczak, J.; Uzarowicz, Ł.; Stępień, W. How relationships between soil organic matter parameters and soil structure characteristics are affected by the long-term fertilization of a sandy soil. Geoderma 2019, 342, 75–84. [Google Scholar] [CrossRef]
  22. Zhou, Y.; Hartemink, A.E.; Shi, Z.; Liang, Z.; Lu, Y. Land use and climate change effects on soil organic carbon in North and Northeast China. Sci. Total Environ. 2019, 647, 1230–1238. [Google Scholar] [CrossRef] [PubMed]
  23. Zhang, Q.; Zhang, J.; Guo, E.; Yan, D.; Sun, Z. The impacts of long-term and year-to-year temperature change on corn yield in China. Theor. Appl. Climatol. 2015, 119, 77–82. [Google Scholar] [CrossRef]
  24. Gale, H.F. Growth and Evolution in China’s Agricultural Support Policies; United States Department of Agriculture Economic Research Service: Washington, DC, USA, 2013; Volume 153. Available online: http://www.ers.usda.gov/media/1156829/err153.pdf (accessed on 7 April 2022).
  25. Li, B.; Wang, G. Conservation Tillage Technique in Northeast China-The Mode in Lishu County; Scientific and Technological Literature Press: Beijing, China, 2019. [Google Scholar]
  26. Nachtergaele, F.; van Velthuizen, H.; Verelst, L.; Batjes, N.H.; Dijkshoorn, K.; van Engelen, V.; Fischer, G.; Jones, A.; Montanarela, L. The Harmonized World Soil Database; International Union of Soil Sciences: Brisbane, Australia, 2010; pp. 34–37. [Google Scholar]
  27. Liu, G.; Jiang, N.; Zhang, L. Soil Physical and Chemical Analysis & Description of Soil Profiles; Standards Press of China: Beijing, China, 1996. [Google Scholar]
  28. Gee, G.W.; Or, D. 2.4 Particle-size analysis. In Methods of Soil Analysis: Part 4 Physical Methods; Soil Science Society of America Book Series: Madison, WI, USA, 2002; Volume 5, pp. 255–293. [Google Scholar]
  29. Cambardella, C.A.; Moorman, T.B.; Novak, J.M.; Parkin, T.B.; Karlen, D.L.; Turco, R.F.; Konopka, A.E. Field-scale variability of soil properties in central Iowa soils. Soil Sci. Soc. Am. J. 1994, 58, 1501–1511. [Google Scholar] [CrossRef]
  30. Hu, B.; Shao, S.; Fu, Z.; Li, Y.; Ni, H.; Chen, S.; Zhou, Y.; Jin, B.; Shi, Z. Identifying heavy metal pollution hot spots in soil-rice systems: A case study in South of Yangtze River Delta, China. Sci. Total Environ. 2019, 658, 614–625. [Google Scholar] [CrossRef] [PubMed]
  31. Xia, F.; Hu, B.; Shao, S.; Xu, D.; Zhou, Y.; Zhou, Y.; Huang, M.; Li, Y.; Chen, S.; Shi, Z. Improvement of Spatial Modeling of Cr, Pb, Cd, As and Ni in Soil Based on Portable X-ray Fluorescence (PXRF) and Geostatistics: A Case Study in East China. Int. J. Env. Res. Pub. He. 2019, 16, 2694. [Google Scholar] [CrossRef] [PubMed] [Green Version]
  32. Isaaks, E.H.; Srivastava, M.R. Applied Geostatistics; Oxford University Press: New York, NY, USA, 1989. [Google Scholar]
  33. R Core Team. R: A Language and Environment for Statistical Computing. R Foundation for Statistical Computing: Vienna, Austria. 2020. Available online: https://www.R-project.org/ (accessed on 6 June 2020).
  34. Rasband, W.S. ImageJ. 1997. Available online: http://imagej.nih.gov/ij/ (accessed on 6 June 2020).
  35. Zheng, L.; Wu, W.; Wei, Y.; Hu, K. Effects of straw return and regional factors on spatio-temporal variability of soil organic matter in a high-yielding area of northern China. Soil Till. Res. 2015, 145, 78–86. [Google Scholar] [CrossRef]
  36. Zhao, Y.; Wang, M.; Hu, S.; Zhang, X.; Ouyang, Z.; Zhang, G.; Huang, B.; Zhao, S.; Wu, J.; Xie, D. Economics-and policy-driven organic carbon input enhancement dominates soil organic carbon accumulation in Chinese croplands. Proc. Natl. Acad. Sci. USA 2018, 115, 4045–4050. [Google Scholar] [CrossRef] [PubMed] [Green Version]
  37. Hillel, D. Applications of Soil Physics; Elsevier: Amsterdam, The Netherlands, 2012. [Google Scholar]
  38. Fan, M.; Lal, R.; Zhang, H.; Margenot, A.J.; Wu, J.; Wu, P.; Zhang, L.; Yao, J.; Chen, F.; Gao, C. Variability and determinants of soil organic matter under different land uses and soil types in eastern China. Soil Till. Res. 2020, 198, 104544. [Google Scholar] [CrossRef]
  39. Hu, K.; Wang, S.; Li, H.; Huang, F.; Li, B. Spatial scaling effects on variability of soil organic matter and total nitrogen in suburban Beijing. Geoderma. 2014, 226, 54–63. [Google Scholar] [CrossRef]
  40. Tesfahunegn, G.B.; Tamene, L.; Vlek, P.L.G. Catchment-scale spatial variability of soil properties and implications on site-specific soil management in northern Ethiopia. Soil Till. Res. 2011, 117, 124–139. [Google Scholar] [CrossRef]
  41. Hobley, E.; Wilson, B.; Wilkie, A.; Gray, J.; Koen, T. Drivers of soil organic carbon storage and vertical distribution in Eastern Australia. Plant Soil 2015, 390, 111–127. [Google Scholar] [CrossRef]
  42. Schillaci, C.; Acutis, M.; Lombardo, L.; Lipani, A.; Fantappie, M.; Märker, M.; Saia, S. Spatio-temporal topsoil organic carbon mapping of a semi-arid Mediterranean region: The role of land use, soil texture, topographic indices and the influence of remote sensing data to modelling. Sci. Total Environ. 2017, 601, 821–832. [Google Scholar] [CrossRef] [PubMed]
  43. Liu, X.T.; Yan, B.X. Soil loss and food safety in Northeast China. J. Chin. Soil Water Conserv. 2009, 1, 17–19. [Google Scholar]
  44. Amelung, W.; Bossio, D.; Vries, W.; Kögel-Knabner, I.; Lehmann, J.; Amundson, R.; Bol, R.; Collins, C.; Lal, R. Towards a global-scale soil climate mitigation strategy. Nat. Commun. 2020, 11, 5427. [Google Scholar] [CrossRef]
  45. Gami, S.K.; Lauren, J.G.; Duxbury, J.M. Influence of soil texture and cultivation on carbon and nitrogen levels in soils of the eastern Indo-Gangetic Plains. Geoderma 2009, 153, 304–311. [Google Scholar] [CrossRef]
  46. Saidy, A.R.; Smernik, R.J.; Baldock, J.A.; Kaiser, K.; Sanderman, J. The sorption of organic carbon onto differing clay minerals in the presence and absence of hydrous iron oxide. Geoderma 2013, 209–210, 15–21. [Google Scholar]
  47. Six, J.; Conant, R.T.; Paul, E.A.; Paustian, K. Stabilization mechanisms of soil organic matter: Implications for C-saturation of soils. Plant Soil 2002, 241, 155–176. [Google Scholar] [CrossRef]
  48. Dai, W.; Huang, Y. Relation of soil organic matter concentration to climate and altitude in zonal soils of China. Catena 2006, 65, 87–94. [Google Scholar] [CrossRef]
  49. Djukic, I.; Zehetner, F.; Tatzber, M.; Gerzabek, M.H. Soil organic-matter stocks and characteristics along an Alpine elevation gradient. J. Plant Nutr. Soil Sc. 2010, 173, 30–38. [Google Scholar] [CrossRef]
  50. Tsai, C.C.; Chen, Z.S.; Kao, C.I.; Ottner, F.; Kao, S.J.; Zehetner, F. Pedogenic development of volcanic ash soils along a climosequence in Northern Taiwan. Geoderma 2010, 156, 48–59. [Google Scholar] [CrossRef]
  51. Blanco-Canqui, H.; Ferguson, R.B.; Shapiro, C.A.; Drijber, R.A.; Walters, D.T. Does inorganic nitrogen fertilization improve soil aggregation? Insights from two long-term tillage experiments. J. Environ. Qual. 2014, 43, 995–1003. [Google Scholar] [CrossRef]
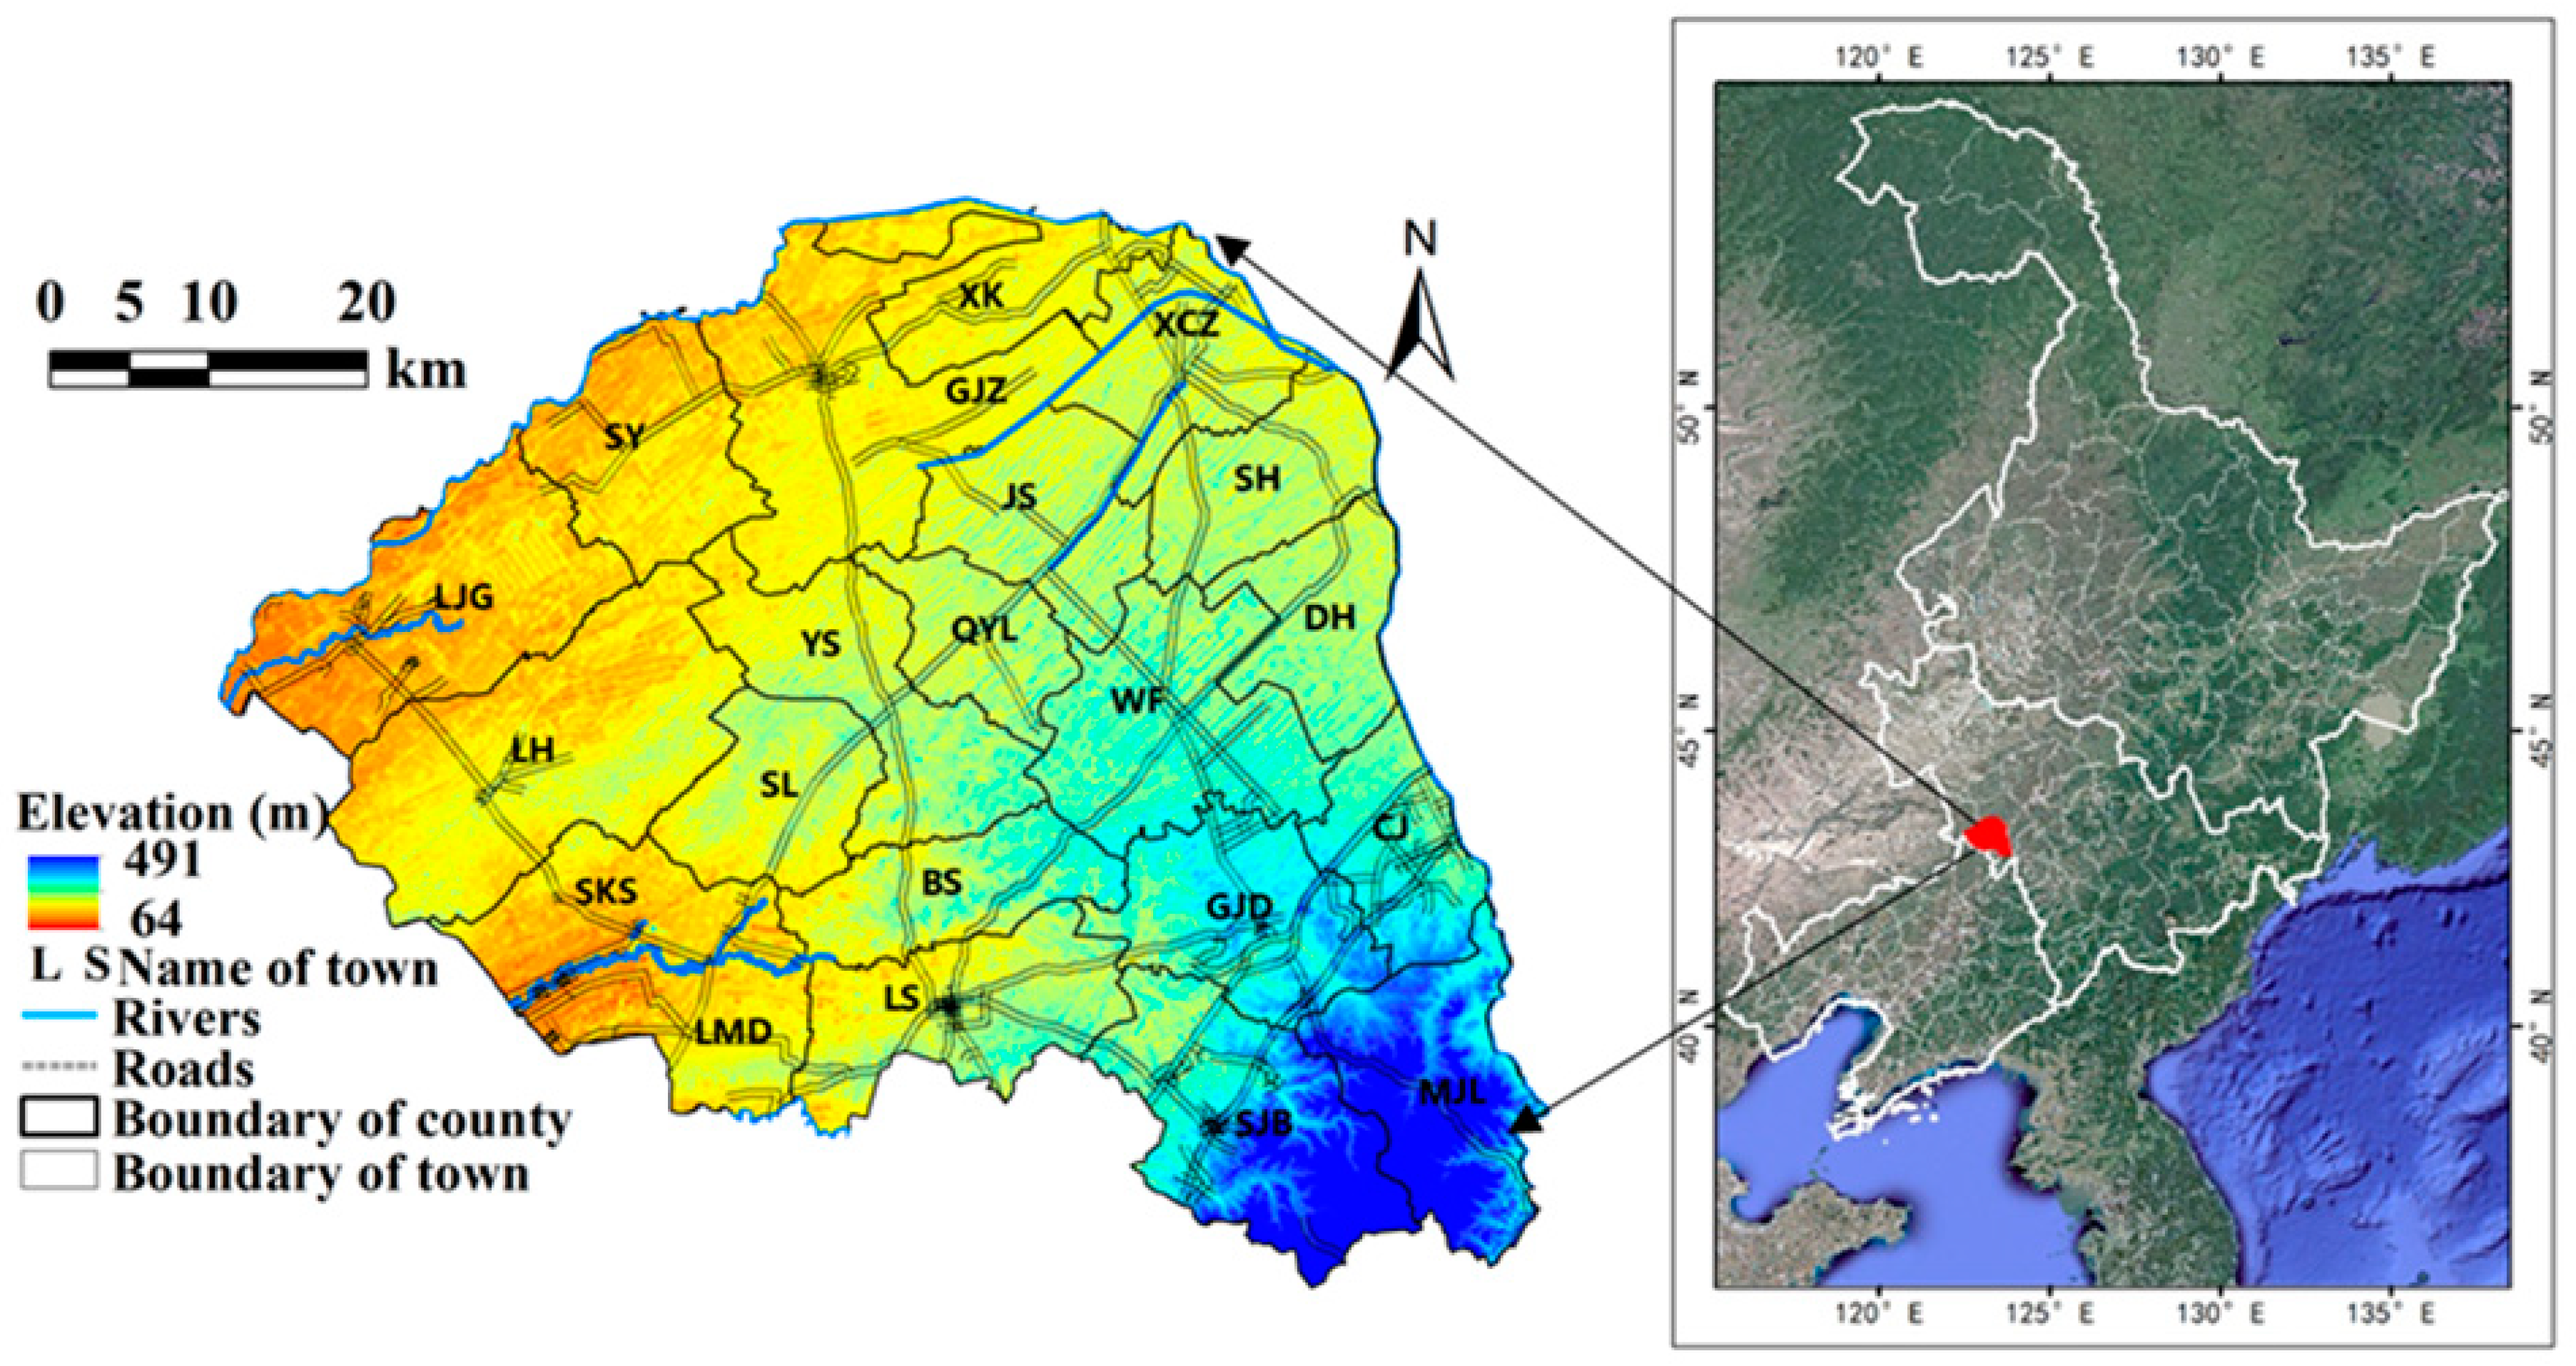
Figure 1. Schematic diagram of the geographical position of Lishu County. Notes: LJG: Liujiaguan town; SY: Shenyang town; GJZ: Gujiazi town; XK: Xiaokuan town; XCZ: Xiaochengzi town; JS: Jinshan town; YS: Yushu town; LH: Linhai town; SH: Shuanghe town; QYL: Quanyanling town; SL: Shengli town; SKS: Sikeshu town; DH: Donghe town; WF: Wanfa town; BS: Baishan town; LMD: Lamadian town; CJ: Caijia town; GJD: Guojiadian town; LS: Lishu town; MJL: Mengjialing town; SJB: Shijiabao town.
Agronomy 12 02532 g001
Figure 2. Distribution of soil types in Lishu County, Jilin Province.
Agronomy 12 02532 g002
Figure 3. Soil sampling locations of the study area in 2007, 2009, 2012, 2015, and 2018.
Agronomy 12 02532 g003
Figure 4. Spatial distribution maps of soil organic matter (SOM) content in 2007, 2009, 2012, 2015, and 2018 in Lishu County.
Agronomy 12 02532 g004
Figure 5. Spatial distribution map of soil organic matter (SOM) content in the 1980s in Lishu County.
Agronomy 12 02532 g005
Figure 6. Soil organic matter (SOM) content for main soil types at different times. Notes: Different uppercase letters represent significant differences among years in the same soil type, and different lowercase letters represent significant differences among soil types in the same year, according to the least-significant difference (LSD) test at α = 0.05 level of probability.
Agronomy 12 02532 g006
Figure 7. Soil organic matter (SOM) content for main soil texture at different times. Notes: Different uppercase letters represent significant differences among years in the same soil texture, and different lowercase letters represent significant differences among soil texture in the same year, according to the least-significant difference (LSD) test at α = 0.05 level of probability.
Agronomy 12 02532 g007
Table 1. Chemical fertilizer inputs in Lishu County in different years.
Year199220072009201220152018
Chemical fertilizer (ton)137,790142,352148,848176,676186,665205,179
Table 2. The area of straw return in Lishu County in different years.
Year199220072009201220152018
The area of straw return (ha)015218288010,50733,333
Table 3. The statistical description of soil organic matter (g kg−1) in 2007, 2009, 2012, 2015, and 2018 in Lishu County.
YearSamplesSkewnessKurtosisMinMaxMean ± SDCV
200725840.51−0.251.8038.7018.94 ± 5.63 d0.30
200919170.511.505.1047.7020.03 ± 6.30 b0.31
20121861−0.874.604.6043.5019.85 ± 3.66 bc0.18
20152496−0.171.601.6045.4019.42 ± 4.89 c0.25
20183550.292.102.1064.2620.84 ± 7.82 a0.38
Notes: SD: standard deviation; CV: coefficient of variation. The letters following the mean SOM values show significant differences between years (LSD p < 0.05).
Table 4. Semi-variogram models of soil organic matter (SOM) in Lishu County.
YearModelNugget (C0)SillC0/SillRange (km)R2RMSE (g kg−1)
2007Exponential23.1746.360.50159.660.944.91
2009Exponential2.8514.800.2048.730.815.65
2012Exponential10.521.890.4650.000.783.40
2015Exponential9.0820.580.4414.350.654.46
2018Gaussian39.5262.520.6330.690.956.41
Table 5. The statistical results of soil organic matter (SOM) content for different categories at different times.
YearArea (%)
IIIIIIIVVVI
SOM (g kg−1)
>4030–4020–3010–206–10<6
1980s 30.414.10.19.0
20074.841.632.267.8
2009 40.559.5
2012 50.249.8
2015 49.450.6
2018 0.260.539.3
Table 6. The correlation coefficient of elevation and soil organic matter (SOM) content at different times.
Year20072009201220152018
Pearson correlation0.054 **0.0380.0310.067 **0.370 **
Notes: ** p < 0.01.
Publisher’s Note: MDPI stays neutral with regard to jurisdictional claims in published maps and institutional affiliations.