

Essential Oil and Polyphenolic Compounds of Flourensia cernua Leaves: Chemical Profiling and Functional Properties


 ,
,  ,
, 
Abstract
:1. Introduction
2. Materials and Methods
2.1. Reagents
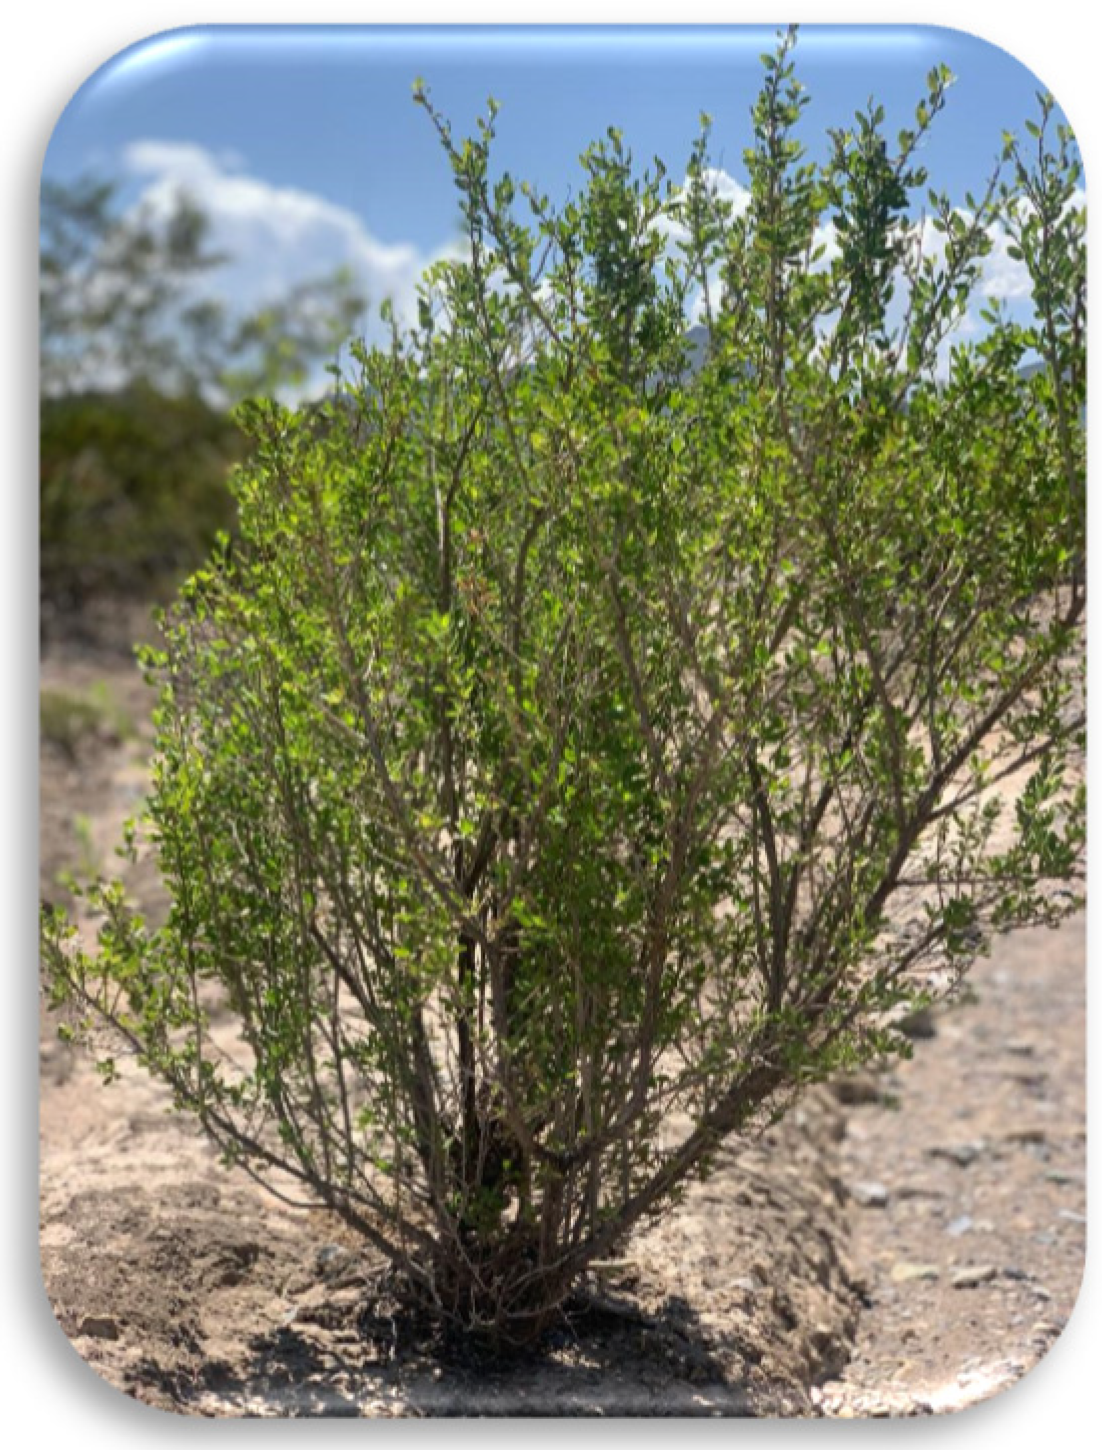
2.2. Plant Material
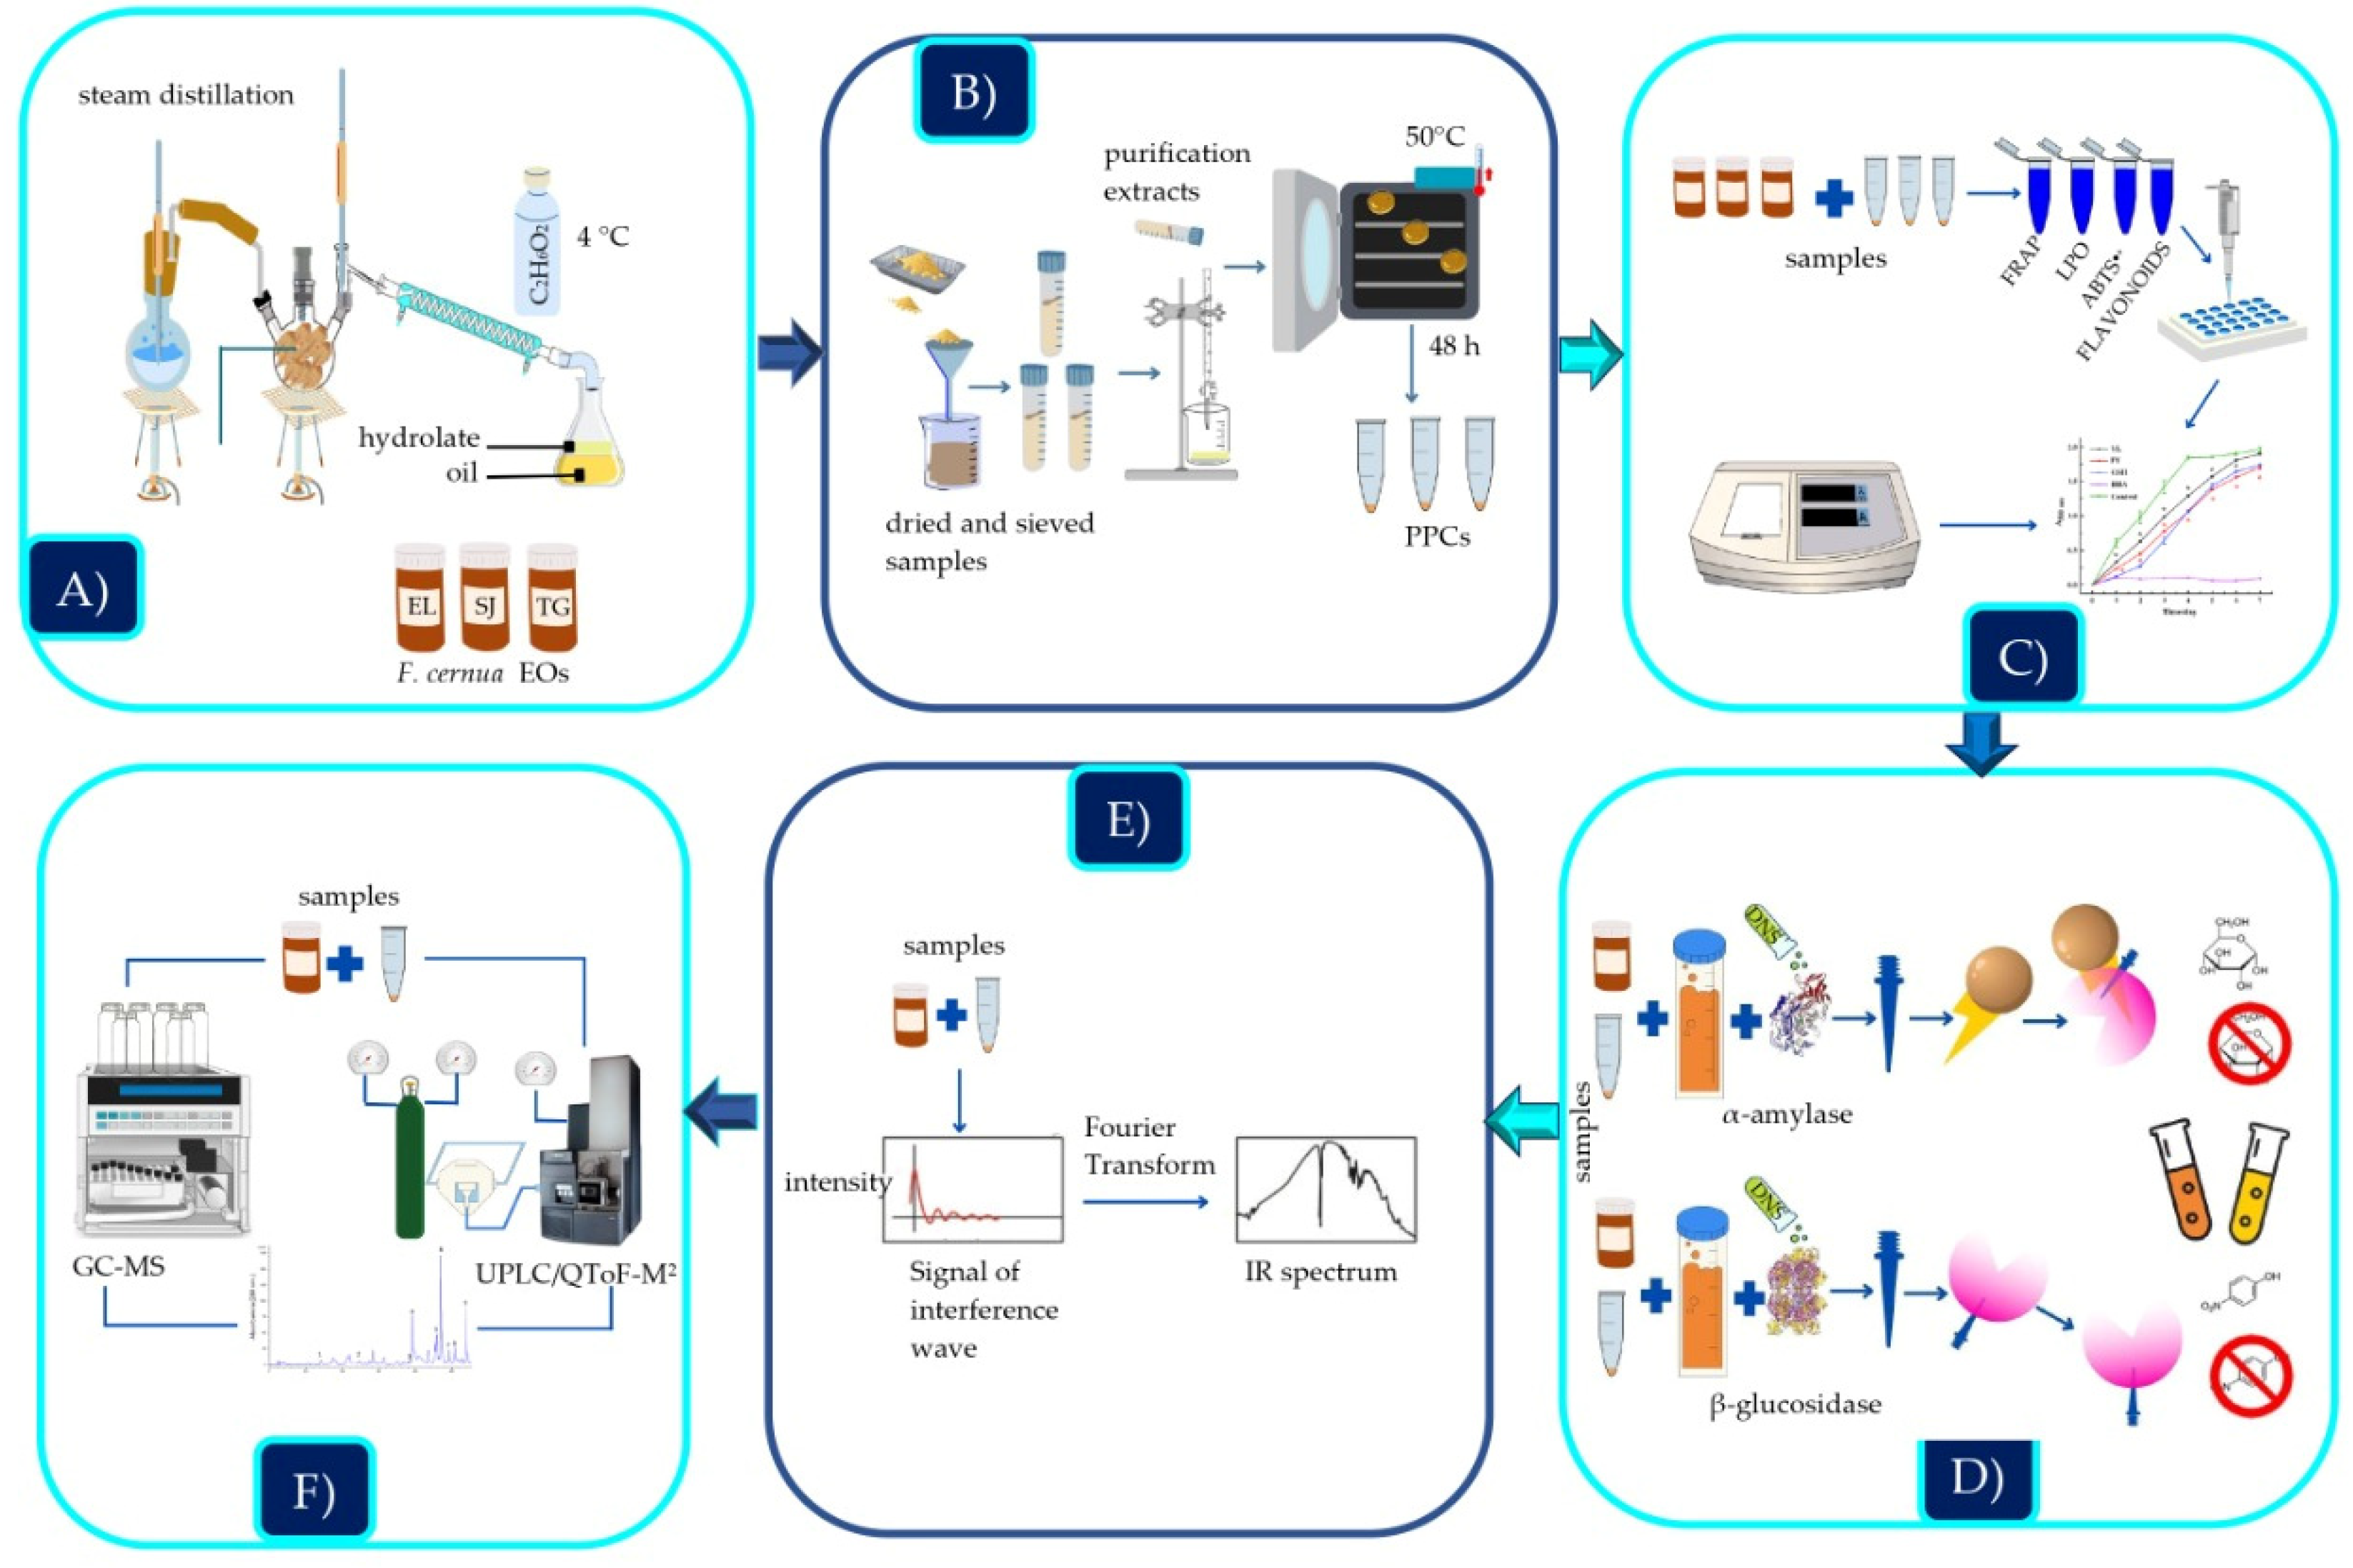
2.3. Essential Oil Extraction by Steam Distillation
2.4. Extraction of Polyphenolic Compounds
Purification of Extracts and Sample Preparation
2.5. Flavonoid Content
2.6. Antioxidant Activity Assays
2.6.1. ABTS•+ Radical Scavenging Assay
2.6.2. Ferric Reducing Antioxidant Power (FRAP)
2.6.3. Lipid Peroxidation Inhibition (LPO) Assay
2.7. Enzyme Inhibition Assays
2.7.1. α-Amylase Inhibition Assay
2.7.2. α-Glucosidase Inhibition Assay
2.8. Fourier Transform Infrared Spectroscopy (FTIR) Analysis
2.9. Gas Chromatography Coupled to Mass Spectrometry (GC–MS) Analysis
2.10. UPLC/QToF-MS2 Analysis
2.11. Statistical Analysis
3. Results
3.1. Content of Essential Oil and Polyphenolic Compounds
3.2. Flavonoid Content
3.3. Antioxidant Activity
3.4. Enzyme Inhibition
3.4.1. α-Amylase Inhibition Assay
3.4.2. α-Glucosidase Inhibition Assay
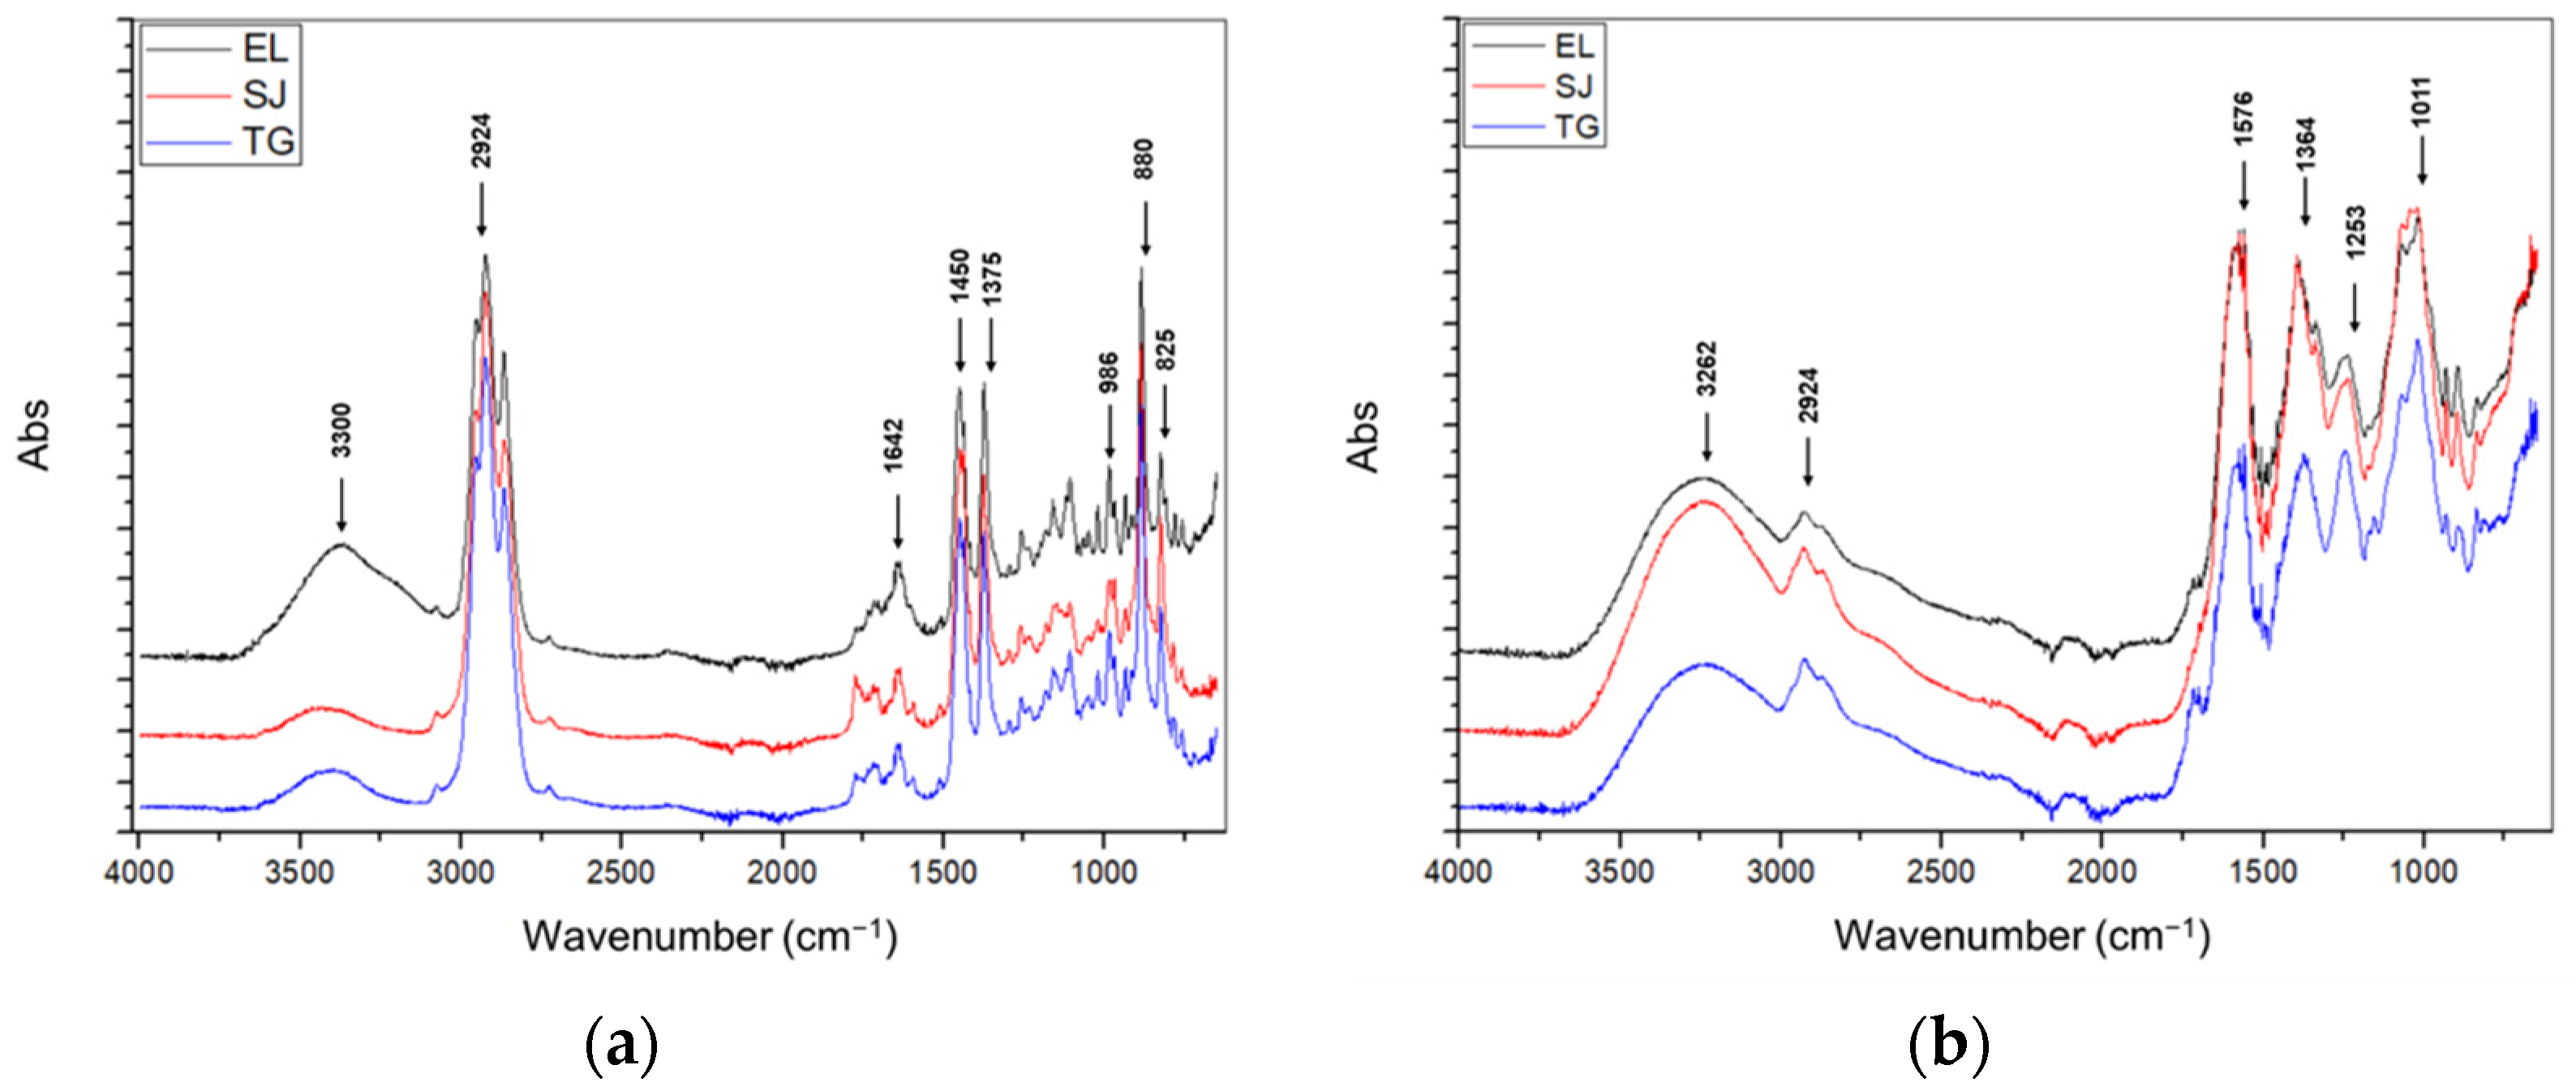
3.5. FTIR Assay
3.5.1. IR Spectra of the EOs
3.5.2. IR Spectra of the PPCs
3.6. Compound Identification of the Essential Oil by GC/MS
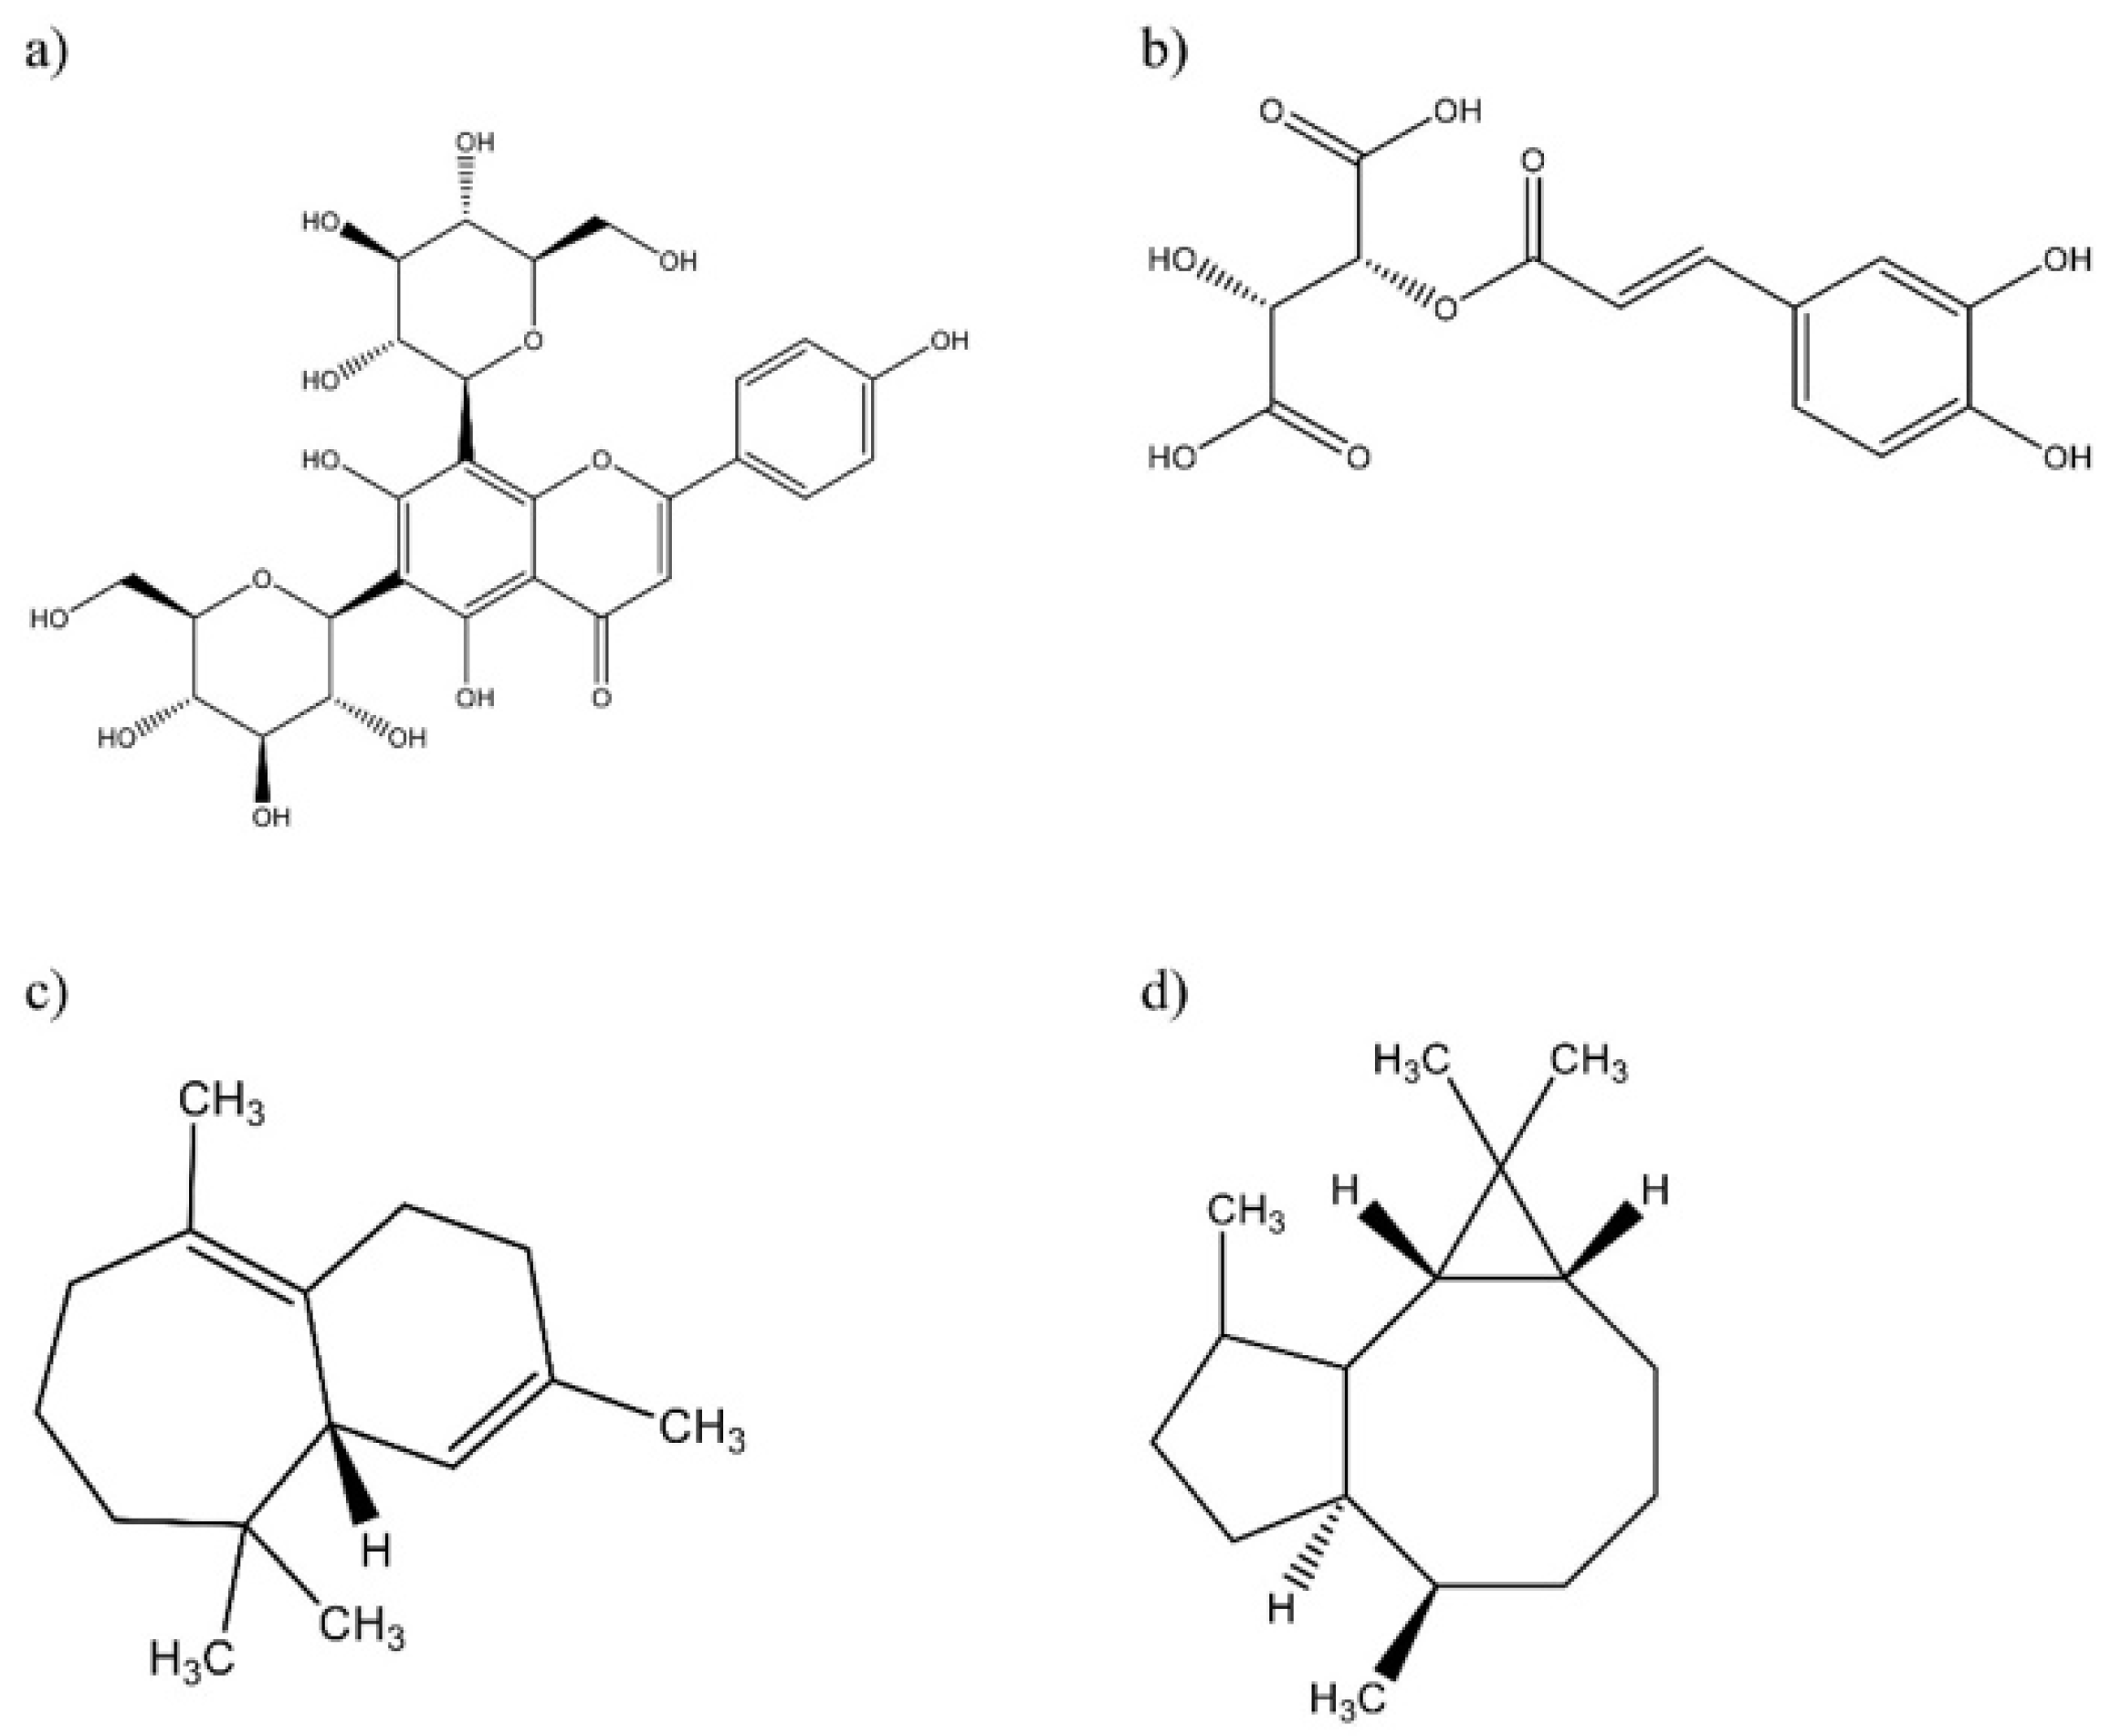
3.7. Compound Identification of the Polyphenolic Compounds by UPLC/QToF-MS2
4. Discussion
4.1. Content of Essential Oil and Polyphenolic Compounds
4.2. Flavonoids Content
4.3. Antioxidant Activity
4.4. Enzyme Inhibition
4.4.1. α-Amylase Inhibition Assay
4.4.2. α-Glucosidase Inhibition Assay
4.5. FTIR Assay
4.5.1. IR Spectra of the PPCs
4.5.2. IR Spectra of the EOs
4.6. Compound Identification of the Essential Oil by GC/MS
4.7. Compound Identification of the Polyphenolic Compounds by UPLC/QToF-MS2
5. Conclusions
Supplementary Materials
Author Contributions
Funding
Institutional Review Board Statement
Informed Consent Statement
Acknowledgments
Conflicts of Interest
References
- Molina-Salinas, G.M.; Ramos-Guerra, M.C.; Vargas-Villarreal, J.; Mata-Cárdenas, B.D.; Becerril-Montes, P.; Said-Fernández, S. Bactericidal activity of organic extracts from Flourensia cernua DC against strains of Mycobacterium tuberculosis. Arch. Med. Res. 2006, 37, 45–49. [Google Scholar] [CrossRef]
- Jasso de Rodríguez, D.; Puente-Romero, G.N.; Díaz-Jiménez, L.; Rodríguez-García, R.; Ramírez-Rodríguez, H.; Villarreal-Quintanilla, J.A.; Genisheva, Z.A. In vitro gastrointestinal digestion of microencapsulated extracts of Flourensia cernua, F. microphylla, and F. retinophylla. Ind. Crops Prod. 2019, 138, 111444. [Google Scholar] [CrossRef]
- Ventura, J.; Gutiérrez-Sánchez, G.; Rodríguez-Herrera, R.; Aguilar, C.N. Fungal cultures of tar bush and creosote bush for production of two phenolic antioxidants (pyrocatechol and gallic acid). Folia Microbiol. 2009, 54, 199–203. [Google Scholar]
- Jasso de Rodríguez, D.; Hernández-Castillo, D.; Angulo-Sánchez, J.L.; Rodríguez-García, R.; Villarreal Quintanilla, J.A.; Lira-Saldivar, R.H. Antifungal activity in vitro of Flourensia sp. extracts on Alternaria s, Rhizoctonia solani, and Fusarium oxysporum. Ind. Crops Prod. 2007, 25, 111–116. [Google Scholar] [CrossRef]
- Galván, J.V.; Díaz, C.A.G.; Fernández, R.G. Efecto de los extractos acuosos de hojas de plantas de gobernadora (Larrea tridentata), hojasen (Flourensia cernua) y encino (Quercus pungens), sobre el crecimiento micelial in vitro de hongos fitopatógenos. Acta Univ. 2014, 24, 13–19. [Google Scholar]
- Guerrero-Rodríguez, E.; Solís-Gaona, S.; Hernández-Castillo, F.D.; Flores-Olivas, A.; Sandoval-López, V.; Jasso-Cantú, D. Actividad Biológica in vitro de Extractos de Flourensia cernua DC en Patógenos de Postcosecha: Alternaria alternata (Fr.: Fr.) Keissl., Colletotrichum gloeosporioides (Penz.) Penz. y Sacc. y Penicillium digitatum (Pers.: Fr.) Sacc. Rev. Mex. Fitopatol. 2007, 25, 48–53. [Google Scholar]
- Tellez, M.; Estell, R.; Fredrickson, E.D.; Powell, J.; Wedge, D.; Schrader, K.; Kobaisy, M. Extracts of Flourensia cernua (L): Volatile constituents and antifungal, antialgal, and antitermite bioactivities. J. Chem. Ecol. 2001, 27, 2263–2273. [Google Scholar] [CrossRef]
- Ruiz-Martínez, J.; Aguirre-Joya, J.A.; Rojas, R.; Vicente, A.; Aguilar-González, M.A.; Rodríguez-Herrera, R.; Aguilar, C.N. Candelilla wax edible coating with Flourensia cernua bioactives to prolong the quality of tomato fruits. Foods 2020, 9, 1303. [Google Scholar] [CrossRef]
- De León-Zapata, M.A.; Pastrana-Castro, L.; Barbosa-Pereira, L.; Rua-Rodríguez, M.L.; Saucedo, S.; Ventura-Sobrevilla, J.M.; Aguilar, C.N. Nanocoating with extract of tarbush to retard Fuji apples senescence. Postharvest Biol. Technol. 2017, 134, 67–75. [Google Scholar] [CrossRef]
- Rios, M.Y. Chemistry and biology of the genus Flourensia (Asteraceae). Chem. Biodivers. 2015, 12, 1595–1634. [Google Scholar] [CrossRef]
- Mechchate, H.; Es-Safi, I.; Louba, A.; Alqahtani, A.S.; Nasr, F.A.; Noman, O.M.; Bousta, D. In vitro alpha-amylase and alpha-glucosidase inhibitory activity and in vivo antidiabetic activity of Withania frutescens L. Foliar extract. Molecules 2021, 26, 293. [Google Scholar] [CrossRef]
- Chaudhury, A.; Duvoor, C.; Reddy Dendi, V.S.; Kraleti, S.; Chada, A.; Ravilla, R.; Mirza, W. Clinical review of antidiabetic drugs: Implications for type 2 diabetes mellitus management. Front. Endocrinol. 2017, 8, 6. [Google Scholar] [CrossRef]
- Ascacio-Valdés, J.A.; Aguilera-Carbó, A.; Martínez-Hernández, J.L.; Rodríguez-Herrera, R.; Aguilar, C.N. Euphorbia antisyphilitica residues as a new source of ellagic acid. Chem. Pap. 2010, 64, 528–532. [Google Scholar] [CrossRef]
- De la Rosa, L.A.; Vazquez-Flores, A.A.; Alvarez-Parrilla, E.; Rodrigo-García, J.; Medina-Campos, O.N.; Ávila-Nava, A.; Pedraza-Chaverri, J. Content of major classes of polyphenolic compounds, antioxidant, antiproliferative, and cell protective activity of pecan crude extracts and their fractions. J. Funct. Foods 2014, 7, 219–228. [Google Scholar] [CrossRef]
- Berg, R.; Haenen, G.R.; van den Berg, H.; Bast, A.A.L.T. Applicability of an improved Trolox equivalent antioxidant capacity (TEAC) assay for evaluation of antioxidant capacity measurements of mixtures. Food Chem. 1999, 66, 511–517. [Google Scholar] [CrossRef]
- Çelik, S.E.; Özyürek, M.; Güçlü, K.; Apak, R. Solvent effects on the antioxidant capacity of lipophilic and hydrophilic antioxidants measured by CUPRAC, ABTS/persulphate and FRAP methods. Talanta 2010, 81, 1300–1309. [Google Scholar] [CrossRef]
- Zou, Y.; Lu, Y.; Wei, D. Antioxidant activity of a flavonoid-rich extract of Hypericum perforatum L. in vitro. J. Agric. Food Chem. 2004, 52, 5032–5039. [Google Scholar] [CrossRef]
- McCue, P.P.; Shetty, K. Inhibitory effects of rosmarinic acid extracts on porcine pancreatic amylase in vitro. Asia Pac. J. Clin. Nutr. 2004, 13, 101–106. [Google Scholar]
- Kim, Y.M.; Wang, M.H.; Rhee, H.I. A novel α-glucosidase inhibitor from pine bark. Carbohydr. Res. 2004, 339, 715–717. [Google Scholar] [CrossRef]
- Sethi, A.; Prakash, R.; Shukla, D.A.; Bhatia, A.; Singh, R.P. Identification of phytochemical constituents from biologically active pet ether and chloroform extracts of the flowers of Allamanda violacea A. DC (Apocynaceae). Asian J. Plant Sci. Res. 2011, 3, 95–108. [Google Scholar]
- Mastrangelo, A.; Ferrarini, A.; Rey-Stolle, F.; Garcia, A.; Barbas, C. From sample treatment to biomarker discovery: A tutorial for untargeted metabolomics based on GC-(EI)-Q-MS. Anal. Chim. Acta 2015, 900, 21–35. [Google Scholar] [CrossRef]
- McShane, A.J.; Farrokhi, V.; Nemati, R.; Li, S.; Yao, X. An Overview of Quantitative Proteomic Approaches. In Comprehensive Analytical Chemistry: Fundamentals of Advanced Omics Technologies: From Genes to Metabolites, 1st ed.; Simó, C., Cifuentes, A., García-Cañas, V., Eds.; Esevier: Amsterdam, The Netherlands, 2014; Volume 63, pp. 111–135. [Google Scholar]
- Jasso de Rodríguez, D.; Carrillo-Lomelí, D.A.; Rocha-Guzmán, N.E.; Moreno-Jiménez, M.R.; Rodríguez-García, R.; Díaz-Jiménez, M.L.V.; Villarreal-Quintanilla, J.A. Antioxidant, anti-inflammatory and apoptotic effects of Flourensia microphylla on HT-29 colon cancer cells. Ind. Crops Prod. 2017, 107, 472–481. [Google Scholar] [CrossRef]
- Wang, Q.; Jiang, P.; Ye, F.Y.; Shi, R.; Ma, Y.M.; Zhong, J.; Jia, Y.Q. Identification and pharmacokinetics of multiple constituents in rat plasma after oral administration of Yinchenzhufu decoction. J. Ethnopharmacol. 2014, 153, 714–724. [Google Scholar] [CrossRef]
- Cech, N.B.; Eleazer, M.S.; Shoffner, L.T.; Crosswhite, M.R.; Davis, A.C.; Mortenson, A.M. High performance liquid chromatography/electrospray ionization mass spectrometry for simultaneous analysis of alkamides and caffeic acid derivatives from Echinacea purpurea extracts. J. Chromatogr. A 2006, 1103, 219–228. [Google Scholar] [CrossRef]
- Alvarez-Perez, O.B.; Ventura-Sobrevilla, J.M.; Ascacio-Valdés, J.A.; Rojas, R.; Verma, D.K.; Aguilar, C.N. Valorization of Flourensia cernua DC as source of antioxidants and antifungal bioactives. Ind. Crops Prod. 2020, 152, 112422. [Google Scholar] [CrossRef]
- Zabidi, N.A.; Ishak, N.A.; Hamid, M.; Efliza Ashari, S. Subcritical water extraction of antioxidants from Curculigo latifolia root. J. Chem. 2019, 2019, 8047191. [Google Scholar] [CrossRef]
- Silva, D.B.; Turatti IC, C.; Gouveia, D.R.; Ernst, M.; Teixeira, S.P.; Lopes, N.P. Mass spectrometry of flavonoid vicenin-2, based sunlight barriers in Lychnophora species. Sci. Rep. 2014, 4, 1–8. [Google Scholar] [CrossRef]
- Zavala, D.; Carrillo, M.L.; Alvarado, B.; Ch, A.O.S. Evaluación de la toxicidad aguda de un extracto alcohólico de hojas de hojasén (Flourensia cernua). Rev. Mex. Cienc. Farm. 2010, 41, 50–54. [Google Scholar]
- Tellez, M.R.; Estell, R.E.; Fredrickson, E.L.; Havstad, K.M. Essential Oil of Flourensia cernua DC. J. Essent. Oil Res. 1997, 9, 619–624. [Google Scholar] [CrossRef]
- Priotti, Z.E.; Zygadlo, J.A.; Ariza-Espinar, L. Essential oils of Flourensia oolepis SL Blake. J. Essent. Oil Res. 1997, 9, 345–347. [Google Scholar] [CrossRef]
- Piazza, L.A.; López, D.; Silva, M.P.; Lopez Rivilli, M.J.; Tourn, M.G.; Cantero, J.J.; Scopel, A.L. Volatiles and nonvolatiles in Flourensia campestris Griseb (Asteraceae), how much do capitate glandular trichomes matter? Chem. Biodivers. 2018, 15, e1700511. [Google Scholar] [CrossRef]
- Shanjani, P.S.; Mirza, M.; Calagari, M.; Adams, R.P. Effects drying and harvest season on the essential oil composition from foliage and berries of Juniperus excelsa. Ind. Crops Prod. 2010, 32, 83–87. [Google Scholar] [CrossRef]
- Hanaa, A.M.; Sallam, Y.I.; El-Leithy, A.S.; Aly, S.E. Lemongrass (Cymbopogon citratus) essential oil as affected by drying methods. Ann. Agric. Sci. 2012, 57, 113–116. [Google Scholar] [CrossRef]
- Perez-Vizcaino, F.; Fraga, C.G. Research trends in flavonoids and health. Arch. Biochem. Biophys. 2018, 646, 107–112. [Google Scholar] [CrossRef] [PubMed]
- Rios, M.Y.; Estrada-Soto, S.; Flores-Morales, V.; Aguilar, M.I. Chemical constituents from Flourensia resinosa SF Blake (Asteraceae). Biochem. Syst. Ecol. 2013, 51, 240–242. [Google Scholar] [CrossRef]
- Wei, L.; Yang, H.; Li, H.; Zhu, M.; Mi, S.; Lu, Q.; Zu, Y. Comparison of chemical composition and activities of essential oils from fresh leaves of Pelargonium graveolens L. Herit. extracted by hydrodistillation and enzymatic pretreatment combined with a solvent-free microwave extraction method. Ind. Crops Prod. 2022, 186, 115204. [Google Scholar] [CrossRef]
- Mohamed, A.A.; Ali, S.I.; El-Baz, F.K. Antioxidant and antibacterial activities of crude extracts and essential oils of Syzygium cumini leaves. PLoS ONE 2013, 8, e60269. [Google Scholar] [CrossRef]
- Yang, Y.; Wang, X.; Zhao, C.; Tian, G.; Zhang, H.; Xiao, H.; Zheng, J. Chemical mapping of essential oils, flavonoids and carotenoids in citrus peels by Raman microscopy. J. Food Sci. 2017, 82, 2840–2846. [Google Scholar] [CrossRef]
- Maleki, S.J.; Crespo, J.F.; Cabanillas, B. Anti-inflammatory effects of flavonoids. Food Chem. 2019, 299, 125124. [Google Scholar] [CrossRef]
- Yang, S.A.; Jeon, S.K.; Lee, E.J.; Shim, C.H.; Lee, I.S. Comparative study of the chemical composition and antioxidant activity of six essential oils and their components. Nat. Prod. Res. 2010, 24, 140–151. [Google Scholar] [CrossRef]
- Jasso de Rodríguez, D.; Salas-Méndez ED, J.; Rodríguez-García, R.; Hernández-Castillo, F.D.; Díaz-Jiménez ML, V.; Sáenz-Galindo, A.; Carrillo-Lomelí, D.A. Antifungal activity in vitro of ethanol and aqueous extracts of leaves and branches of Flourensia sp against postharvest fungi. Ind. Crops Prod. 2017, 107, 499–508. [Google Scholar] [CrossRef]
- Bouyahya, A.; Et-Touys, A.; Bakri, Y.; Talbaui, A.; Fellah, H.; Abrini, J.; Dakka, N. (Chemical composition of Mentha pulegium and Rosmarinus officinalis essential oils and their antileishmanial, antibacterial and antioxidant activities. Microb. Pathog. 2017, 111, 41–49. [Google Scholar] [CrossRef]
- Lipiński, K.; Mazur, M.; Antoszkiewicz, Z.; Purwin, C. Polyphenols in monogastric nutrition—A review. Ann. Anim. Sci. 2017, 17, 41–58. [Google Scholar] [CrossRef]
- Upadhyay, N.; Singh, V.K.; Dwivedy, A.K.; Das, S.; Chaudhari, A.K.; Dubey, N.K. Assessment of Melissa officinalis L. essential oil as an eco-friendly approach against biodeterioration of wheat flour caused by Tribolium castaneum Herbst. Environ. Sci. Pollut. Res. 2019, 26, 14036–14049. [Google Scholar] [CrossRef]
- Ribeiro-Santos, R.; Andrade, M.; Sanches-Silva, A.; de Melo, N.R. Essential oils for food application: Natural substances with established biological activities. Food Bioprocess Technol. 2018, 11, 43–71. [Google Scholar] [CrossRef]
- Xiao, J.; Mao, F.; Yang, F.; Zhao, Y.; Zhang, C.; Yamamoto, K. Interaction of dietary polyphenols with bovine milk proteins: Molecular structure–affinity relationship and influencing bioactivity aspects. Mol. Nutr. Food Res. 2011, 55, 1637–1645. [Google Scholar] [CrossRef]
- Lo Piparo, E.; Scheib, H.; Frei, N.; Williamson, G.; Grigorov, M.; Chou, C.J. Flavonoids for controlling starch digestion: Structural requirements for inhibiting human α-amylase. J. Med. Chem. 2008, 51, 3555–3561. [Google Scholar] [CrossRef]
- Rahali, N.; Mehdi, S.; Younsi, F.; Boussaid, M.; Messaoud, C. Antioxidant, α-amylase, and acetylcholinesterase inhibitory activities of Hertia cheirifolia essential oils: Influence of plant organs and seasonal variation. Int. J. Food Prop. 2017, 20, 1637–1651. [Google Scholar] [CrossRef]
- Dai, T.; Li, T.; He, X.; Li, X.; Liu, C.; Chen, J.; McClements, D.J. Analysis of inhibitory interaction between epigallocatechin gallate and alpha-glucosidase: A spectroscopy and molecular simulation study. Spectrochim. Acta Part A Mol. Biomol. Spectrosc. 2020, 230, 118023. [Google Scholar] [CrossRef]
- Özgünseven, A.; Barut, B.; Šoral, M.; Sari, S.; Akaydın, G.; Özel, A.; Şöhretoğlu, D. Alpha-glucosidase and tyrosinase inhibiton of polyphenols isolated from Potentilla speciosa var. speciosa: In vitro and in silico perspectives. Ind. Crops Prod. 2021, 170, 113806. [Google Scholar] [CrossRef]
- Ma, L.; Lin, Q.; Lei, D.; Liu, S.; Wang, X.; Zhao, Y. Alpha-glucosidase inhibitory activities of essential oils extracted from three chinese herbal medicines. Chem. Eng. Trans. 2018, 64, 61–66. [Google Scholar] [CrossRef]
- Dineen, R.D. Gas Chromatographic Identification of Trace Amounts of Organic Compounds. Ph.D. Thesis, University of Tasmania, Hobart, Australia, 1985. [Google Scholar]
- Estell, R.E.; James, D.K.; Fredrickson, E.L.; Anderson, D.M. Within-plant distribution of volatile compounds on the leaf surface of Flourensia cernua. Biochem. Syst. Ecol. 2013, 48, 144–150. [Google Scholar] [CrossRef]
- Ozer, M.S.; Sarikurkcu, C.; Ceylan, O.; Akdeniz, I.; Tepe, B. A comprehensive study on chemical composition, antioxidant and enzyme inhibition activities of the essential oils of Chenopodium botrys collected from three different parts of Turkey. Ind. Crops Prod. 2017, 107, 326–331. [Google Scholar] [CrossRef]
- Jaradat, N.; Al-Maharik, N.; Abdallah, S.; Shawahna, R.; Mousa, A.; Qtishat, A. Nepeta curviflora essential oil: Phytochemical composition, antioxidant, anti-proliferative and anti-migratory efficacy against cervical cancer cells, and α-glucosidase, α-amylase and porcine pancreatic lipase inhibitory activities. Ind. Crops Prod. 2020, 158, 112946. [Google Scholar] [CrossRef]
- Sanad, H.; Belattmania, Z.; Nafis, A.; Hassouani, M.; Mazoir, N.; Reani, A.; Sabour, B. Chemical Composition, and In Vitro Antioxidant and Antimicrobial Activities of the Marine Cyanolichen Lichina pygmaea Volatile Compounds. Mar. Drugs 2022, 20, 169. [Google Scholar] [CrossRef]
- Han, Y.; Zhou, M.; Wang, L.; Ying, X.; Peng, J.; Jiang, M.; Luo, G. Comparative evaluation of different cultivars of Flos Chrysanthemi by an anti-inflammatory-based NF-κB reporter gene assay coupled to UPLC-Q/TOF MS with PCA and ANN. J. Ethnopharmacol. 2015, 174, 387–395. [Google Scholar] [CrossRef]
- Cui, J.; Zeng, S.; Zhang, C. Anti-hyperglycaemic effects of Burdock (Arctium lappa L.) leaf flavonoids through inhibiting α-amylase and α-glucosidase. Int. J. Food Sci. Technol. 2022, 57, 541–551. [Google Scholar] [CrossRef]
- Zhu, M.; Liu, T.; Zhang, C.; Guo, M. Flavonoids of Lotus (Nelumbo nucifera) seed embryos and their antioxidant potential. J. Food Sci. 2017, 82, 1834–1841. [Google Scholar] [CrossRef]


| Samples | Content (%) | Flavonoids | ABTS •+ | FRAP | Lipid Oxidation | |||||
|---|---|---|---|---|---|---|---|---|---|---|
| (EQ μg mL−1) | (ET μg mL−1) | (EGA μg mL−1) | (% inhibition) | |||||||
| PPCs | EOs | PPCs | EOs | PPCs | EOs | PPCs | EOs | PPCs | EOs | |
| EL | 2.1 ± 0.15 a | 0.13 ± 0.03 b | 258.22 ± 0.78 b | 134.88 ± 5.66 e | 124.39 ± 4.31 a | 103.3 ± 6.75 b | 90.5 ± 3.11 ab | 94.33 ± 2.94 a | 34.89 ± 2.39 b | 47.16 ± 6.93 a |
| SJ | 1.5 ± 0.15 b | 0.10± 0.007 b | 191 ± 3.60 c | 300.44 ± 9.84 a | 105.41 ± 9.76 b | 85.46 ± 8.77 c | 84.77 ± 3.37 bc | 82.07 ± 3.27 c | 10.91 ± 7.16 cd | 31.32 ± 6.23 bc |
| TG | 1.3 ± 0.26 b | 0.31 ± 0.07 a | 133.77 ± 4.37 e | 175.44 ± 2.83 d | 105.34 ± 11.75 b | 55.67 ± 15.25 c | 84.02 ± 3.79 bc | 87.1 ± 5.42 bc | 13.87 ± 5.82 cd | 25.09 ± 10.88 bc |
| Sample | % Inhibition | |||
|---|---|---|---|---|
| α-Amylase | α-Glucosydase | |||
| PPCs | EOs | PPCs | EOs | |
| EL | 44.93 ± 8.58 a | 15.43 ± 3.92 b | 4.41 ± 4.6 b | 96.64 ± 4.30 a |
| SJ | 15.87 ± 9.70 b | 8.66 ± 3.60 b | 9.12 ± 3.04 b | 92.57 ± 3.24 a |
| TG | 10.14 ± 3.38 b | 9.45 ± 1.25 b | 4.47 ± 4.25 b | 97.05 ± 1.60 a |
| N° Peak | Retention Time (min) | m/z Experimental [M-H]– | m/z Calculated [M-H]– | MS2 Fragment Ion | Tentative Assignment | Molecular Formula | Relative Content (%) | ||
|---|---|---|---|---|---|---|---|---|---|
| EL | SJ | TG | |||||||
| 1 | 1.147 | 136.1252 | 136.23 | 93 | β-Myrcene | C10H16 | 0.66 | ||
| 2 | 1.195 | 150.1044 | - | 91 | Thymol | C10H14O | 0.72 | ||
| 3 | 1.203 | 136.1252 | 136.234 | 93 | β-Pinene | C10H16 | 0.37 | ||
| 4 | 1.205 | 136.125 | 136.234 | 93 | α-Pinene | C10H16 | 0.54 | ||
| 5 | 1.239 | 196.1463 | 196.286 | 68 | β-Terpinyl acetate | C12H20O2 | 0.29 | ||
| 6 | 1.306 | 154.1357 | 154.25 | 93 | Eucalyptol | C10H18O | 3.46 | ||
| 7 | 1.319 | 370.0939 | 370.77 | 73 | Cyclopentasiloxane, decamethyl- | C10H30O5Si5 | 0.24 | ||
| 8 | 1.559 | 152 | 152.23 | 81 | cis-Verbenol | C10H16O | 0.33 | ||
| 9 | 1.605 | 154.1357 | 154.25 | 95 | endo-Borneol | C10H18O | 1.71 | ||
| 10 | 1.634 | 154.1357 | 154.25 | 95 | Borneol | C10H18O | 2.53 | 2.4 | |
| 11 | 1.88 | 444.1127 | 444.92 | 73 | Cyclohexasiloxane, dodecamethyl- | C12H36O6Si6 | 0.36 | ||
| 12 | 2.229 | 150.1044 | 150.22 | 135 | Carvacrol | C10H14O | 0.83 | ||
| 13 | 2.252 | 204.1878 | - | 135 | Cyclohexanone, 2-(2-butynyl)- | C10H14O | 1.31 | ||
| 14 | 2.315 | 204.1878 | 204.35 | 121 | δ-Elemene | C15H24 | 0.47 | ||
| 15 | 2.364 | 204.1878 | 204.35 | 84 | γ-Elemene | C15H24 | 1.2 | ||
| 16 | 2.624 | 204.1878 | 204.35 | 119 | α-Copaene | C15H24 | 0.22 | ||
| 17 | 2.715 | 204.1878 | 204.35 | 93 | β-Elemene | C15H24 | 1.01 | 0.94 | |
| 18 | 3.047 | 204.1878 | 204.35 | 93 | Caryophyllene | C15H24 | 11.07 | 12.97 | 10.76 |
| 19 | 3.391 | 204.1878 | - | 119 | α-Himachalene | C15H24 | 21.52 | 21.39 | |
| 20 | 3.48 | 204.1878 | 204.351 | 119 | β-Himachalene | C15H24 | 19.36 | ||
| 21 | 3.625 | 204.1878 | 204.35 | 161 | Germacrene.-D | C15H24 | 8.03 | 7.68 | 7.75 |
| 22 | 3.774 | 204.1878 | 204.351 | 161 | α-gurjunene | C15H24 | 2.37 | ||
| 23 | 3.825 | 204.1878 | 204.35 | 105 | γ-Gurjunene | C15H24 | 3.63 | 1.73 | |
| 24 | 3.986 | 204.1878 | 204.35 | 161 | δ-cadinene | C15H24 | 0.8 | ||
| 25 | 4.1 | 222.19836 | 222.36 | 93 | Cubebol | C15H26O | 0.52 | ||
| 26 | 4.392 | 238.3657 | 69 | Neryl (S)-2-methylbutanoate | C15H26O2 | 0.23 | |||
| 27 | 4.432 | 222.19837 | 222.36 | 59 | Elemol | C15H26O | 11.14 | 7.81 | |
| 28 | 4.609 | 222.19837 | 222.36 | 59 | Cyclohexanemethanol, 4-ethenyl-α,α,4-trimethyl-3-(1-methylethenyl)-, [1R-(1α,3α,4β)]- | C15H26O | 11.78 | ||
| 29 | 4.912 | 222.1983 | 222,37 | 81 | Germacrene-D-ol | C15H26O | 0.46 | ||
| 30 | 4.941 | 220.18272 | 220.35 | 79 | Caryophyllene oxide | C15H24O | 1.62 | 2.1 | |
| 31 | 5.153 | 222.1983 | - | 109 | Ledol | C15H26O | 19.45 | 8.25 | 27.7 |
| 32 | 5.685 | 222.19836 | - | 161 | 8-epi-.gama-eudesmol | C15H26O | 3.0 | ||
| 33 | 5.817 | 222.1983 | 222.366 | 161 | γ-Eudesmol | C15H26O | 3.53 | ||
| 34 | 6.103 | 222.19837 | 222.36 | 59 | β-eudesmol | C15H26O | 13.16 | 14.3 | |
| 35 | 6.307 | 222.19837 | 222.36 | 59 | β-Selinenol | C15H26O | 16.48 | ||
| 36 | 6.441 | 222.1983 | 222.3663 | 69 | 7-epi-cis-sesquisabinene hydrate | C15H26O | 1.79 | ||
| 37 | 6.755 | 222.1983 | 222.366 | 69 | cis-sesquisabinene hydrate | C15H26O | 1.93 | ||
| 38 | 8.3 | 400.3705 | - | 82 | 5β-Cholestan-3α-ol | C28H48O | 2.66 | ||
| 39 | 8.746 | 222.1983 | 222.37 | 82 | 3-(1,5-Dimethyl-hex-4-enyl)-2,2-dimethyl-cyclopent-3-enol | C15H26O | 2.9 | ||
| Total: | 100.0 | 99.96 | 99.96 | ||||||
| Peak | Retention Time (min) | m/z Experimental [M-H]– | m/z Calculated [M-H]– | MS2 Fragment Ion | Tentative Assignment | Molecular Formula | Relative Content (%) | Reference | ||
|---|---|---|---|---|---|---|---|---|---|---|
| EL | SJ | TG | ||||||||
| 1 | 0.75 | 296.92 | - | - | Unknown | - | 32.55 | 11.98 | 22.78 | - |
| 2 | 0.85 | 191.0874 | 191.0556 | 116.9535 | (-) Quinic acid | C7H12O6 | 0.71 | 0.43 | 1.53 | [23] |
| 3 | 1.05 | 203.0524 | 203.0344 | 174.9865 | Crenulatin | C11H8O4 | 0.98 | Database | ||
| 4 | 1.71 | 191.0874 | 191.0556 | 165.0699 | (+) Quinic acid | C7H12O6 | 1.33 | [23] | ||
| 5 | 1.76 | 247.0289 | - | - | Unknown | - | 0.92 | - | ||
| 6 | 3.48 | 414.2328 | - | - | Unknown | - | 0.72 | 1.21 | - | |
| 7 | 4.34 | 417.1488 | 417.1186 | 353.1289 | Liquiritin | C21H22O9 | 1.88 | 0.46 | 1.66 | [24] |
| 8 | 4.64 | 179.0661 | 179.0344 | 135.0723 | Caffeic acid | C9H8O4 | 2.97 | [23] | ||
| 9 | 6.1 | 311.1165 | 309.1006 | 311.0403 | Caftaric acid | C13H12O9 | 1..34 | 1.46 | [25] | |
| 10 | 6.51 | 273.0927 | 273.0753 | 116.9535 | Phloretin | C15H14O5 | 1.89 | 3.66 | [26] | |
| 11 | 7.16 | 433.2517 | 433.1651 | 433.3344 | Mundulone | C26H26O6 | 1.91 | [27] | ||
| 12 | 7.42 | 593.2043 | 593.1506 | 473.1681 | luteolin 7-O-rutinoside | C27H30O15 | 18.34 | 21.88 | 21.42 | [26] |
| 13 | 7.72 | 593.205 | 593.1506 | 473.1686 | Vicenin-2 | C27H30O15 | 3.30 | [28] | ||
| 14 | 8.38 | 563.1918 | 563.1401 | 537.2484 | Apigenin-6-C-glucosyl-8-C-arabinoside (schaftoside) | C26H28O14 | 6.01 | 7.86 | 4.56 | [26] |
| 15 | 8.88 | 563.1918 | 563.1401 | 443.1449 | Apigenin-6-C-glucosyl-8-C-arabinoside (schaftoside) isomer | C26H28O14 | 8,98 | 14.05 | 10.10 | [23] |
| 16 | 9.34 | 563.1918 | 563.1401 | 443.1446 | Apigenin-6-C-glucosyl-8-C-arabinoside (schaftoside) isomer | C26H28O14 | 13.92 | 22.62 | 16.44 | Database |
| 17 | 10.04 | 563.1918 | 563.1401 | 443.146 | Apigenin-6-C-glucosyl-8-C-arabinoside (schaftoside) isomer | C26H28O14 | 5.27 | 8.14 | 6.57 | Database |
| 18 | 10.7 | 577.2085 | 577.1557 | 563.1939 | Apigenin 7-rutinoside | C27H30O14 | 1.99 | 3.83 | [26] | |
| Total= | 95.97 | 95.03 | 94.99 | |||||||
Publisher’s Note: MDPI stays neutral with regard to jurisdictional claims in published maps and institutional affiliations. |
© 2022 by the authors. Licensee MDPI, Basel, Switzerland. This article is an open access article distributed under the terms and conditions of the Creative Commons Attribution (CC BY) license (https://creativecommons.org/licenses/by/4.0/).
Share and Cite
Aranda-Ledesma, N.E.; González-Hernández, M.D.; Rojas, R.; Paz-González, A.D.; Rivera, G.; Luna-Sosa, B.; Martínez-Ávila, G.C.G. Essential Oil and Polyphenolic Compounds of Flourensia cernua Leaves: Chemical Profiling and Functional Properties. Agronomy 2022, 12, 2274. https://doi.org/10.3390/agronomy12102274
Aranda-Ledesma NE, González-Hernández MD, Rojas R, Paz-González AD, Rivera G, Luna-Sosa B, Martínez-Ávila GCG. Essential Oil and Polyphenolic Compounds of Flourensia cernua Leaves: Chemical Profiling and Functional Properties. Agronomy. 2022; 12(10):2274. https://doi.org/10.3390/agronomy12102274
Chicago/Turabian StyleAranda-Ledesma, Nestor E., María D. González-Hernández, Romeo Rojas, Alma D. Paz-González, Gildardo Rivera, Brenda Luna-Sosa, and Guillermo C. G. Martínez-Ávila. 2022. "Essential Oil and Polyphenolic Compounds of Flourensia cernua Leaves: Chemical Profiling and Functional Properties" Agronomy 12, no. 10: 2274. https://doi.org/10.3390/agronomy12102274
APA StyleAranda-Ledesma, N. E., González-Hernández, M. D., Rojas, R., Paz-González, A. D., Rivera, G., Luna-Sosa, B., & Martínez-Ávila, G. C. G. (2022). Essential Oil and Polyphenolic Compounds of Flourensia cernua Leaves: Chemical Profiling and Functional Properties. Agronomy, 12(10), 2274. https://doi.org/10.3390/agronomy12102274