
Rhizospheric Microbiome Responses to Cover Crop Suppression Methods

 , , ,
, , ,  and
and
Abstract
1. Introduction
2. Materials and Methods
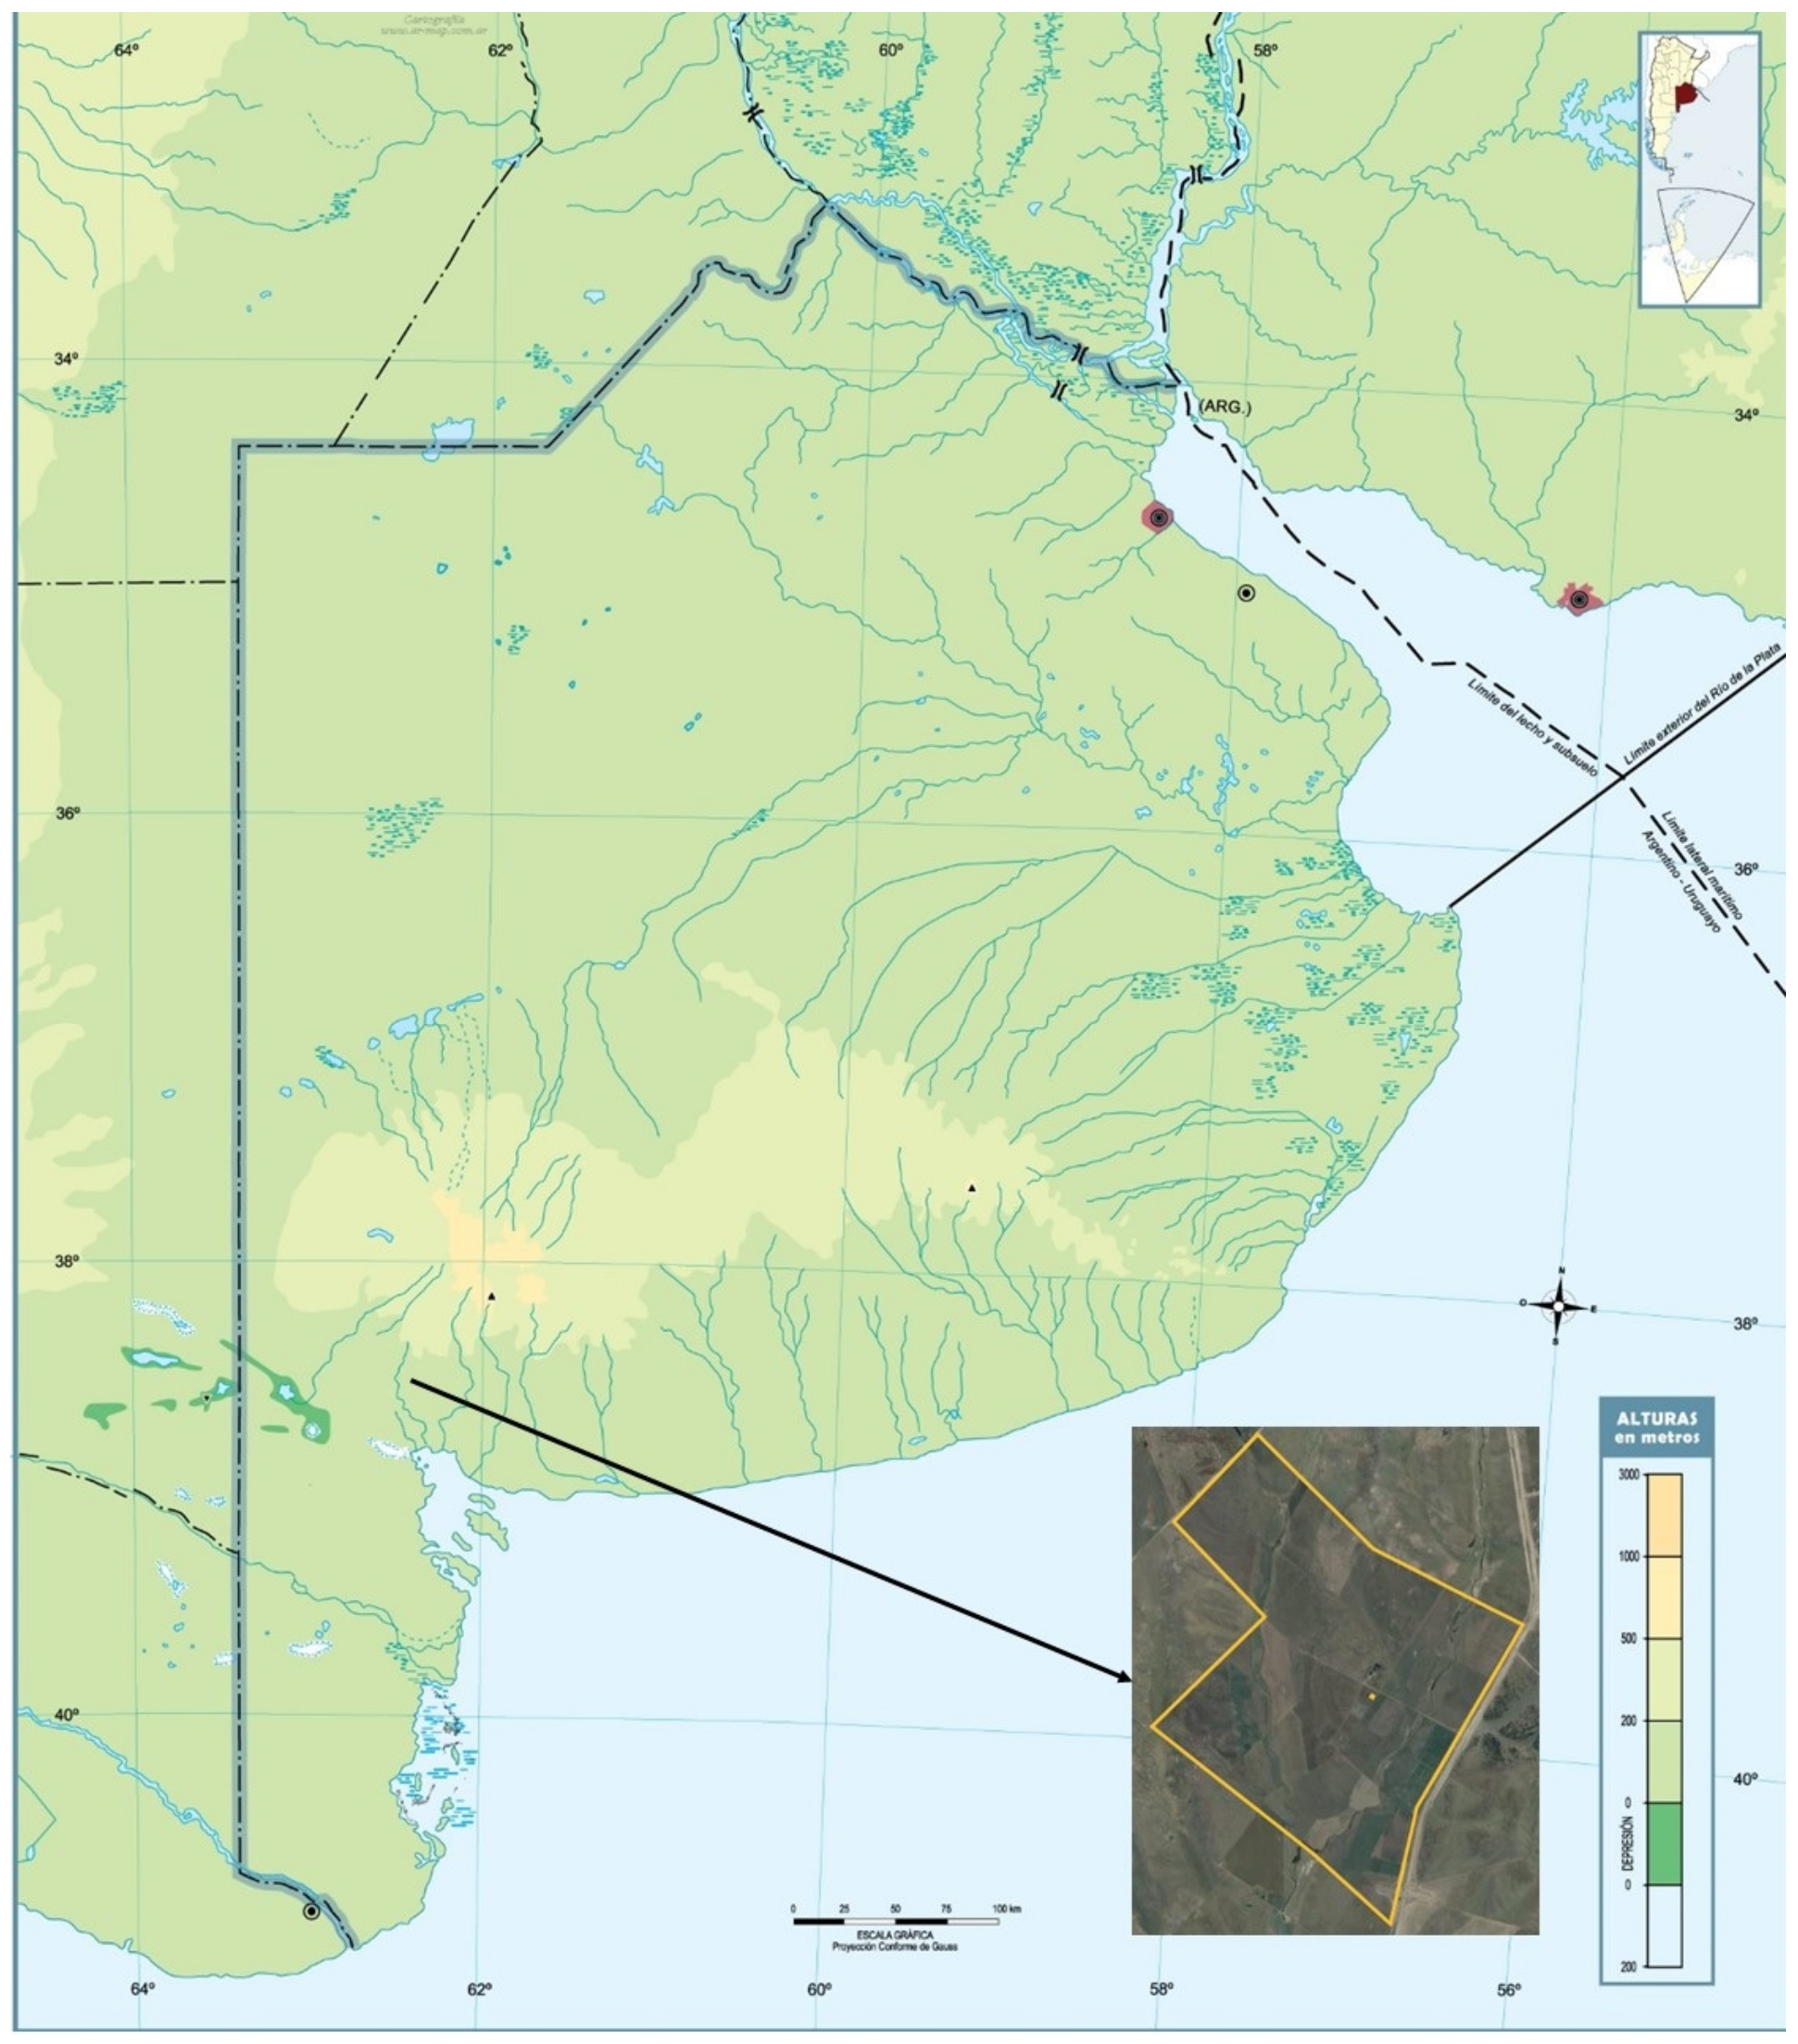
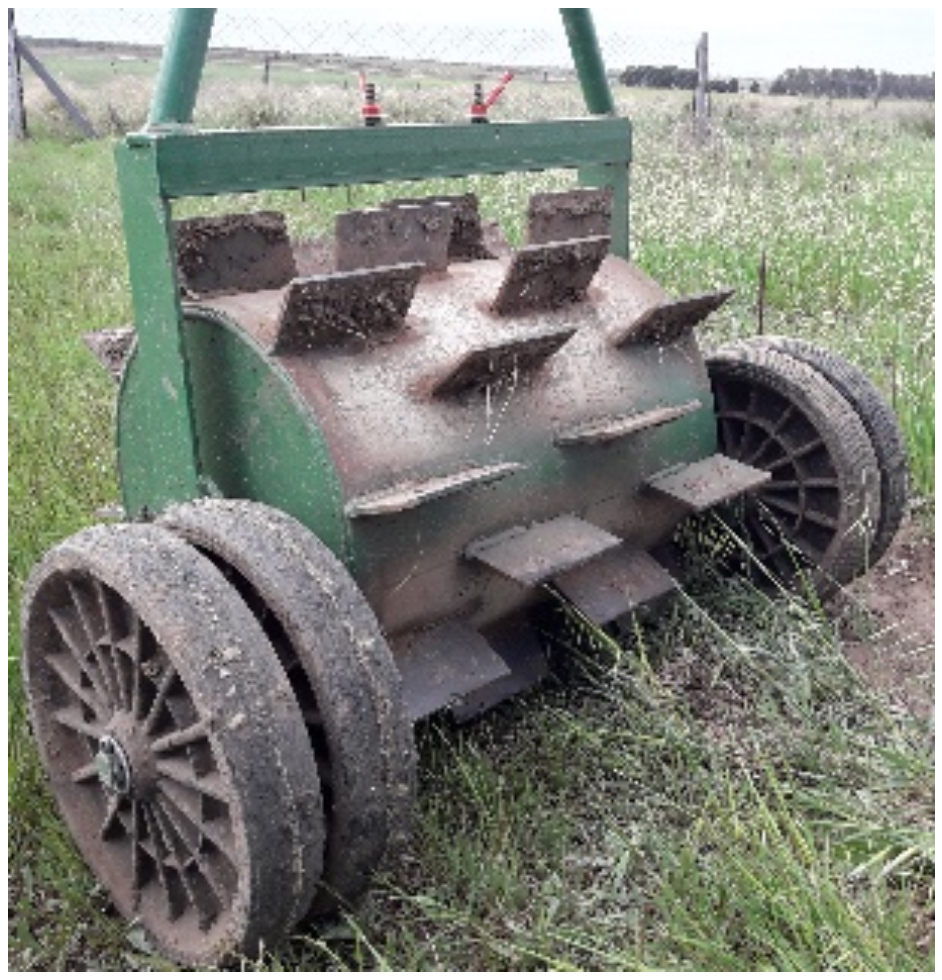
2.1. Study Site and Experimental Design
2.2. Soil Physicochemical Analysis
2.3. Rhizospheric Soil Sampling
2.4. Determination of Potential Nitrification Activity (PNA) and Aerobic Heterotrophic Bacteria
2.5. Rhizospheric Soil DNA Extraction and Quantification
2.5.1. Quantification by Real-Time PCR of Nitrifying and Denitrifying Prokaryotes and Total Bacteria and Archaea
2.5.2. Metabarcoding of ITS and Bacterial 16S rRNA Gene
2.5.3. Bioinformatics Analysis
2.6. Statistical Analysis
3. Results
3.1. Bulk Soil Chemical Properties
3.2. Potential Nitrification Activity
3.3. Aerobic Heterotrophic Bacteria Counts and Quantitative PCR of Indicator Genes
3.4. Metagenomics Sequencing of DNA from the Rhizosphere of Oats
3.4.1. Alpha and Beta Diversity
3.4.2. The Composition of Communities of Bacteria and Fungi in the Oats Rhizosphere
Bacteria
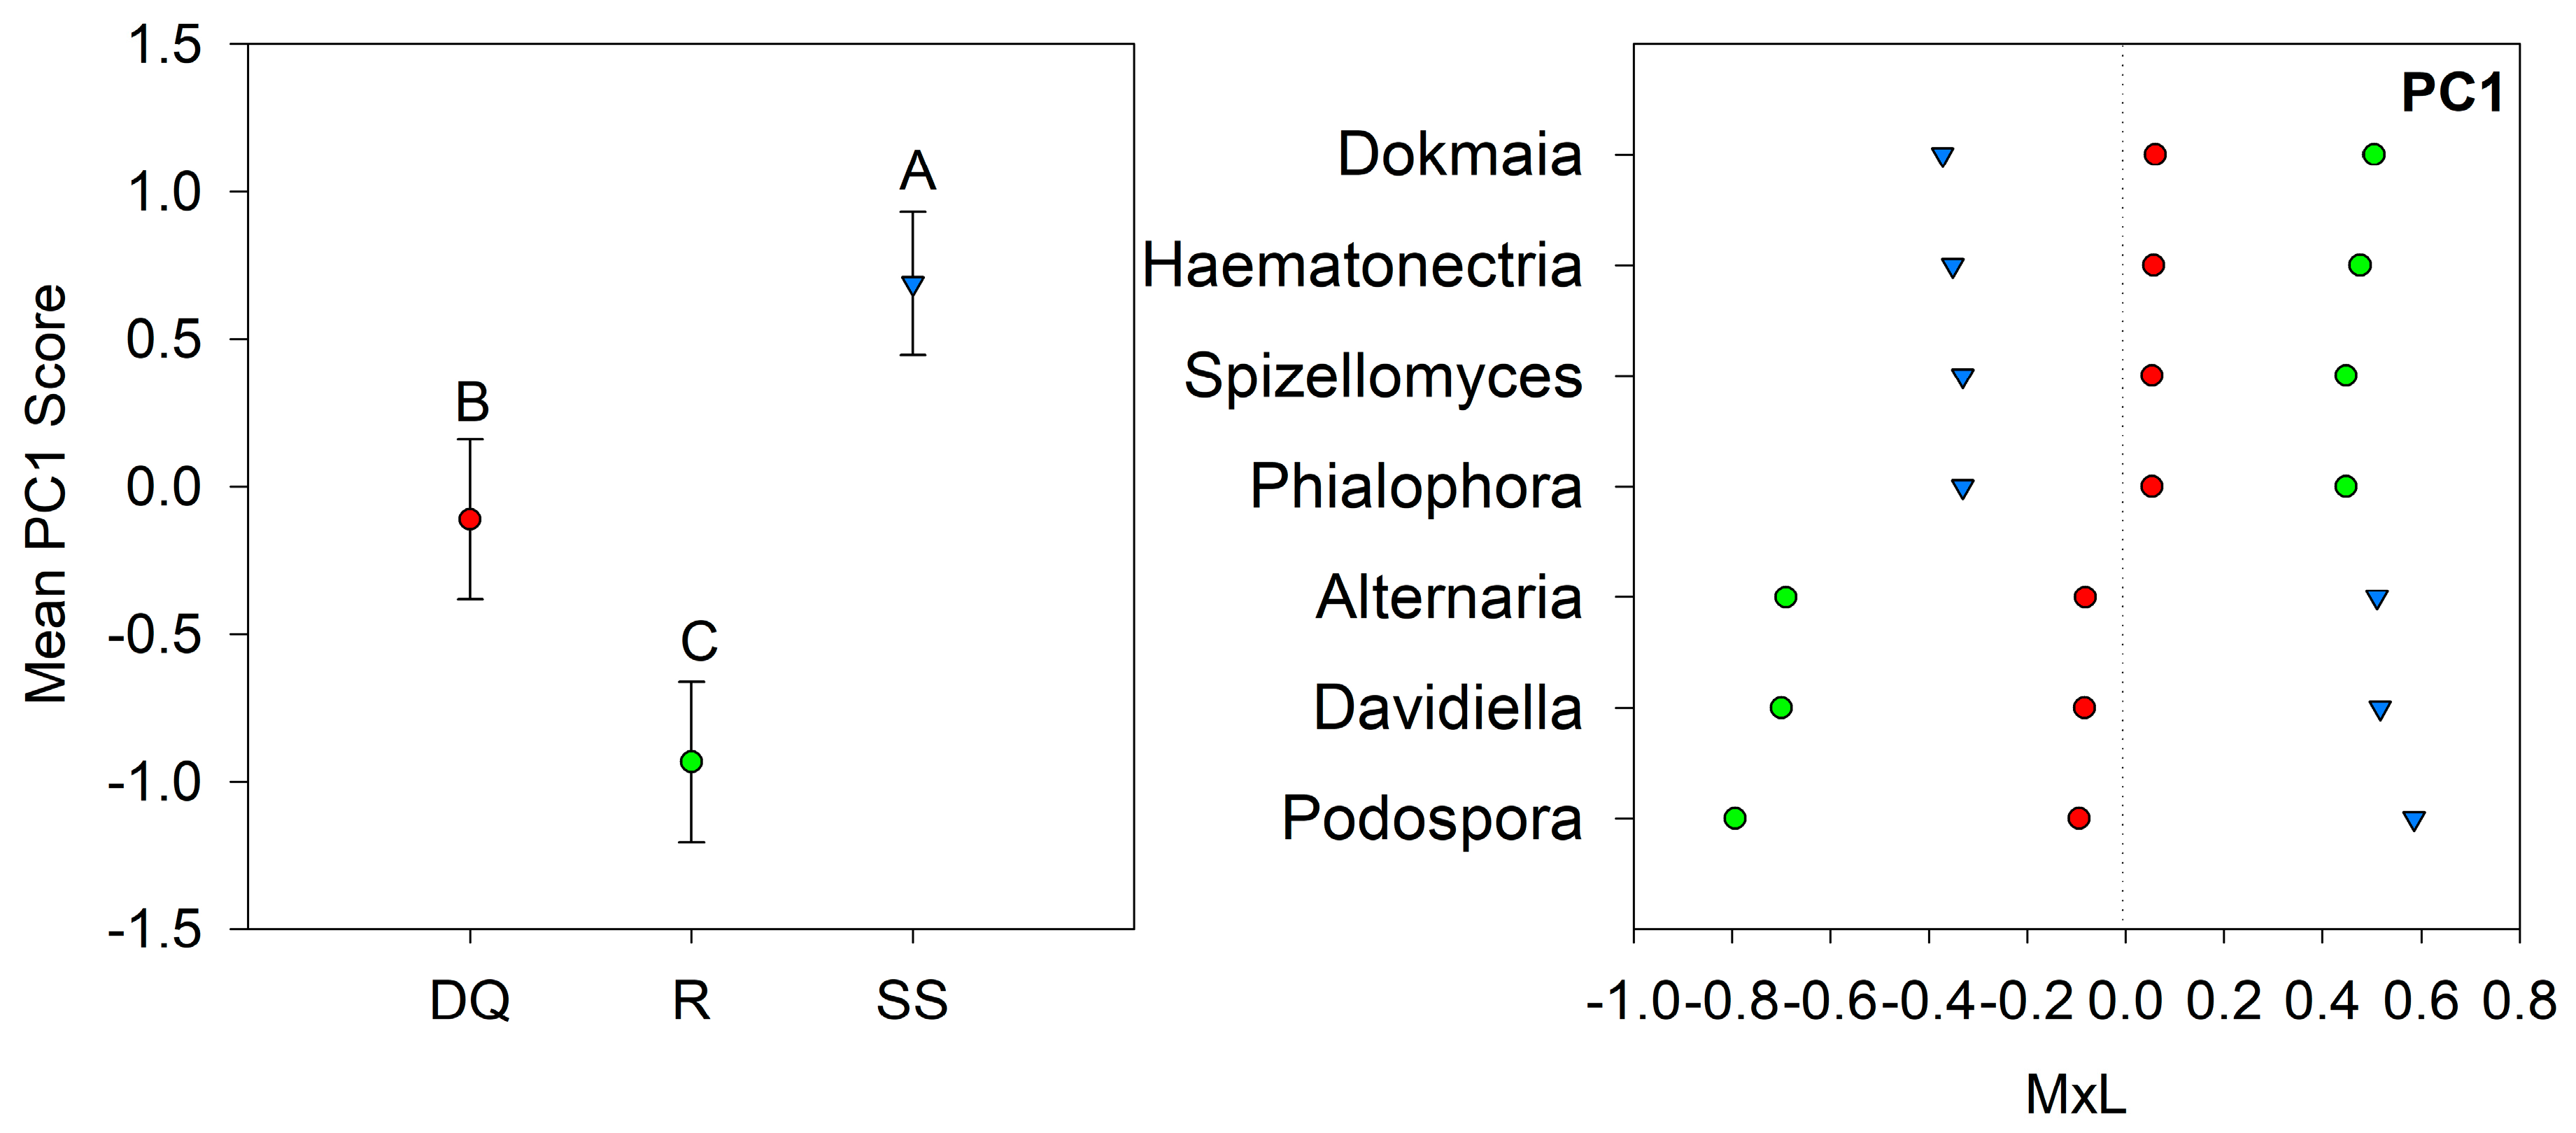
Fungi
3.5. Pearson’s Correlation among Variables
4. Discussion
4.1. The Abundance of Different Microbial Groups
4.2. Bacterial Community Composition
4.3. Fungal Community Composition
5. Conclusions
Supplementary Materials
Author Contributions
Funding
Data Availability Statement
Acknowledgments
Conflicts of Interest
References
- Scholberg, J.M.S.; Dogliotti, S.; Leoni, C.; Cherr, C.M.; Zotarelli, L.; Rossing, W.A.H. Cover Crops for Sustainable Agrosystems in the Americas. In Sustainable Agriculture Reviews 4: Genetic Engineering, Biofertilisation, Soil Quality and Organic Farming, 1st ed.; Lichtfouse, E., Ed.; Springer: Berlin/Heidelberg, Germany, 2010; Volume 4, pp. 23–58. [Google Scholar] [CrossRef]
- Blanco-Canqui, H.; Shaver, T.M.; Lindquist, J.L.; Shapiro, C.A.; Elmore, R.W.; Francis, C.A.; Hergert, G.W. Cover Crops and Ecosystem Services: Insights from Studies in Temperate Soils. Agron. J. 2015, 107, 2449–2474. [Google Scholar] [CrossRef]
- Daryanto, S.; Fu, B.; Wang, L.; Jacinthe, P.A.; Zhao, W. Quantitative Synthesis on the Ecosystem Services of Cover Crops. Earth Sci. Rev. 2018, 185, 357–373. [Google Scholar] [CrossRef]
- Kim, N.; Zabaloy, M.C.; Guan, K.; Villamil, M.B. Do Cover Crops Benefit Soil Microbiome? A Meta-Analysis of Current Research. Soil Biol. Biochem. 2020, 142, 107701. [Google Scholar] [CrossRef]
- Morales, M.E.; Iocoli, G.A.; Villamil, M.B.; Zabaloy, M.C. Efecto de Los Cultivos de Cobertura Invernales Sobre El Microbioma Del Suelo: Revisión Sistemática de La Literatura. Rev. Argent. Microbiol. 2021, 54, 57–70. [Google Scholar] [CrossRef] [PubMed]
- Mirsky, S.B.; Curran, W.S.; Mortensen, D.A.; Ryan, M.R.; Shumway, D.L. Control of Cereal Rye with a Roller/Crimper as Influenced by Cover Crop Phenology. Agron. J. 2009, 101, 1589–1596. [Google Scholar] [CrossRef]
- Baigorria, T.; Alvarez, C.; Cazorla, C.; Belluccini, P.; Aimetta, B.; Pegoraro, V.; Boccolini, M.; Conde, B.; Faggioli, V.; Ortiz, J. Impacto Ambiental Y Rolado De Cultivos De Cobertura En Producción De Soja Bajo Siembra Directa. Cienc. Suelo 2019, 37, 355–366. [Google Scholar]
- Benbrook, C.M. Trends in Glyphosate Herbicide Use in the United States and Globally. Environ. Sci. Eur. 2016, 28, 3. [Google Scholar] [CrossRef]
- Van Bruggen, A.H.C.; Finckh, M.R.; He, M.; Ritsema, C.J.; Harkes, P.; Knuth, D.; Geissen, V. Indirect Effects of the Herbicide Glyphosate on Plant, Animal and Human Health Through Its Effects on Microbial Communities. Front. Environ. Sci. 2021, 9, 763917. [Google Scholar] [CrossRef]
- Duke, S.O.; Lydon, J.; Koskinen, W.C.; Moorman, T.B.; Chaney, R.L.; Hammerschmidt, R. Glyphosate Effects on Plant Mineral Nutrition, Crop Rhizosphere Microbiota, and Plant Disease in Glyphosate-Resistant Crops. J. Agric. Food Chem. 2012, 60, 10375–10397. [Google Scholar] [CrossRef]
- Kremer, R.J.; Means, N.E.; Kim, S. Glyphosate Affects Soybean Root Exudation and Rhizosphere Micro-Organisms. Int. J. Environ. Anal. Chem. 2005, 85, 1165–1174. [Google Scholar] [CrossRef]
- Laitinen, P.; Rämö, S.; Siimes, K. Glyphosate Translocation from Plants to Soil—Does This Constitute a Significant Proportion of Residues in Soil? Plant Soil 2007, 300, 51–60. [Google Scholar] [CrossRef]
- Allegrini, M.; Gomez, E.d.V.; Smalla, K.; Zabaloy, M.C. Suppression Treatment Differentially Influences the Microbial Community and the Occurrence of Broad Host Range Plasmids in the Rhizosphere of the Model Cover Crop Avena sativa L. PLoS ONE 2019, 14, e0223600. [Google Scholar] [CrossRef]
- Schlatter, D.C.; Yin, C.; Burke, I.; Hulbert, S.; Paulitz, T. Location, Root Proximity, and Glyphosate-Use History Modulate the Effects of Glyphosate on Fungal Community Networks of Wheat. Microb. Ecol. 2018, 76, 240–257. [Google Scholar] [CrossRef]
- Lupwayi, N.Z.; Fernandez, M.R.; Kanashiro, D.A.; Petri, R.M. Profiles of Wheat Rhizobacterial Communities in Response to Repeated Glyphosate Applications, Crop Rotation, and Tillage. Can. J. Soil Sci. 2021, 101, 157–167. [Google Scholar] [CrossRef]
- Paterson, E.; Sim, A. Effect of Nitrogen Supply and Defoliation on Loss of Organic Compounds from Roots of Festuca Rubra. J. Exp. Bot. 2000, 51, 1449–1457. [Google Scholar] [CrossRef]
- Guo, X.; Zhou, X.; Hale, L.; Yuan, M.; Feng, J.; Ning, D.; Shi, Z.; Qin, Y.; Liu, F.; Wu, L.; et al. Taxonomic and Functional Responses of Soil Microbial Communities to Annual Removal of Aboveground Plant Biomass. Front. Microbiol. 2018, 9, 954. [Google Scholar] [CrossRef]
- Basche, A.D.; Miguez, F.E.; Kaspar, T.C.; Castellano, M.J. Do Cover Crops Increase or Decrease Nitrous Oxide Emissions? A Meta-Analysis. J. Soil Water Conserv. 2014, 69, 471–482. [Google Scholar] [CrossRef]
- Singh, H.; Kandel, T.P.; Gowda, P.H.; Northup, B.K.; Kakani, V.G.; Baath, G.S. Soil N2O Emissions Following Termination of Grass Pea and Oat Cover Crop Residues with Different Maturity Levels. J. Plant Nutr. Soil Sci. 2020, 183, 734–744. [Google Scholar] [CrossRef]
- Allegrini, M.; Morales, M.E.; Villamil, M.B.; Zabaloy, M.C. Ammonia Oxidizing Prokaryotes Respond Differently to Fertilization and Termination Methods in Common Oat’s Rhizosphere. Front. Microbiol. 2021, 12, 746524. [Google Scholar] [CrossRef]
- Romdhane, S.; Spor, A.; Busset, H.; Falchetto, L.; Martin, J.; Bizouard, F.; Bru, D.; Breuil, M.C.; Philippot, L.; Cordeau, S. Cover Crop Management Practices Rather than Composition of Cover Crop Mixtures Affect Bacterial Communities in No-till Agroecosystems. Front. Microbiol. 2019, 10, 1618. [Google Scholar] [CrossRef]
- Soil Survey Staff. Official Soil Series Descriptions. 2019. Available online: https://www.nrcs.usda.gov/wps/portal/nrcs/detail/soils/home/?cid=nrcs142p2_053587 (accessed on 18 September 2019).
- Bray, R.H.; Kurtz, L.T. Determination of Total, Organic, and Available Forms of Phosphorus in Soils. Soil Sci. 1945, 59, 39–46. [Google Scholar] [CrossRef]
- Zadoks, J.C.; Chang, T.T.; Konzak, C.F. A Decimal Code for the Growth Stages of Cereals. Weed Res. 1974, 14, 415–421. [Google Scholar] [CrossRef]
- Ashford, D.L.; Reeves, D.W. Use of a Mechanical Roller-Crimper as an Alternative Kill Method for Cover Crops. Am. J. Altern. Agric. 2003, 18, 37–45. [Google Scholar] [CrossRef]
- Yanai, R.D.; Majdi, H.; Park, B.B. Measured and Modelled Differences in Nutrient Concentrations between Rhizosphere and Bulk Soil in a Norway Spruce Stand. Plant Soil 2003, 257, 133–142. [Google Scholar] [CrossRef]
- Hart, S.C.; Stark, J.M.; Davidson, E.A.; Firestone, M.K. Nitrogen Mineralization, Immobilization, and Nitrification. In Methods of Soil Analysis, Part 2—Microbiological and Biochemical Properties; Weaver, R.W., Angle, S., Bottomed, P., Bezdicek, D., Smith, S., Tabatabai, A., Wollum, A., Eds.; Soil Science Society of America: Madison, WI, USA, 1994; pp. 985–1018. [Google Scholar] [CrossRef]
- Drury, C.F.; Hart, S.C.; Yang, X.M. Nitrification Techniques for Soils. In Soil Sampling Methods of Analysis, 2nd ed.; Carter, M.R., Gregorich, E.G., Eds.; Canadian Society Soil Science: Pinawa, MB, Canada; CRC Press Taylor and Francis Group: Boca Raton, FL, USA, 2006; pp. 495–515. [Google Scholar] [CrossRef]
- Bevivino, A.; Paganin, P.; Bacci, G.; Florio, A.; Pellicer, M.S.; Papaleo, M.C.; Mengoni, A.; Ledda, L.; Fani, R.; Benedetti, A.; et al. Soil Bacterial Community Response to Differences in Agricultural Management along with Seasonal Changes in a Mediterranean Region. PLoS ONE 2014, 9, e105515. [Google Scholar] [CrossRef]
- Fierer, N.; Jackson, J.A.; Vilgalys, R.; Jackson, R.B. Assessment of Soil Microbial Community Structure by Use of Taxon-Specific Quantitative PCR Assays. Appl. Environ. Microbiol. 2005, 71, 4117–4120. [Google Scholar] [CrossRef]
- Hoshino, Y.T.; Morimoto, S.; Hayatsu, M.; Nagaoka, K.; Suzuki, C.; Karasawa, T.; Takenaka, M.; Akiyama, H. Effect of Soil Type and Fertilizer Management on Archaeal Community in Upland Field Soils. Microbes Environ. 2011, 26, 307–316. [Google Scholar] [CrossRef]
- Rotthauwe, J.H.; Witzel, K.P.; Liesack, W. The Ammonia Monooxygenase Structural Gene Amoa as a Functional Marker: Molecular Fine-Scale Analysis of Natural Ammonia-Oxidizing Populations. Appl. Environ. Microbiol. 1997, 63, 4704–4712. [Google Scholar] [CrossRef]
- Leininger, S.; Urich, T.; Schloter, M.; Schwark, L.; Qi, J.; Nicol, G.W.; Prosser, J.I.; Schuster, S.C.; Schleper, C. Archaea Predominate among Ammonia-Oxidizing Prokaryotes in Soils. Nature 2006, 442, 806–809. [Google Scholar] [CrossRef]
- Schauss, K.; Focks, A.; Leininger, S.; Kotzerke, A.; Heuer, H.; Thiele-Bruhn, S.; Sharma, S.; Wilke, B.M.; Matthies, M.; Smalla, K.; et al. Dynamics and Functional Relevance of Ammonia-Oxidizing Archaea in Two Agricultural Soils. Environ. Microbiol. 2009, 11, 446–456. [Google Scholar] [CrossRef]
- Henry, S.; Baudoin, E.; López-Gutiérrez, J.C.; Martin-Laurent, F.; Brauman, A.; Philippot, L. Quantification of Denitrifying Bacteria in Soils by NirK Gene Targeted Real-Time PCR. J. Microbiol. Methods 2004, 59, 327–335. [Google Scholar] [CrossRef]
- Kandeler, E.; Deiglmayr, K.; Tscherko, D.; Bru, D.; Philippot, L. Abundance of NarG, NirS, NirK, and NosZ Genes of Denitrifying Bacteria during Primary Successions of a Glacier Foreland. Appl. Environ. Microbiol. 2006, 72, 5957–5962. [Google Scholar] [CrossRef]
- Bolyen, E.; Rideout, J.R.; Dillon, M.R.; Bokulich, N.A.; Abnet, C.C.; Al-Ghalith, G.A.; Alexander, H.; Alm, E.J.; Arumugam, M.; Asnicar, F.; et al. Reproducible, Interactive, Scalable and Extensible Microbiome Data Science Using QIIME 2. Nat. Biotechnol. 2019, 37, 852–857. [Google Scholar] [CrossRef]
- Wang, Q.; Garrity, G.M.; Tiedje, J.M.; Cole, J.R. Naïve Bayesian Classifier for Rapid Assignment of rRNA Sequences into the New Bacterial Taxonomy. Appl. Environ. Microbiol. 2007, 73, 5261–5267. [Google Scholar] [CrossRef]
- Oksanen, J.; Simpson, G.L.; Blanchet, F.G.; Kindt, R.; Legendre, P.; Minchin, P.R.; O’Hara, R.B.; Solymos, P.; Henry, H.; Stevens, M.; et al. Vegan: Community Ecology Package; R Package Version 2.5–7. Available online: https://cran.r-project.org/web/packages/vegan/vegan.pdf (accessed on 15 April 2022).
- Katoh, K.; Rozewicki, J.; Yamada, K.D. MAFFT Online Service: Multiple Sequence Alignment, Interactive Sequence Choice and Visualization. Brief. Bioinform. 2019, 20, 1160–1166. [Google Scholar] [CrossRef]
- Schliep, K.P. Phangorn: Phylogenetic Analysis in R. Bioinformatics 2011, 27, 592–593. [Google Scholar] [CrossRef]
- Chen, J.; Zhang, X.; Yang, L. GUniFrac: Generalized UniFrac Distances and Distance-Based Multivariate Analysis of Variance. R Package Version 1.2. Available online: https://cran.r-project.org/web/packages/GUniFrac/GUniFrac.pdf (accessed on 12 May 2022).
- R Core Team. R: A Language and Environment for Statistical Computing; R Foundation for Statistical Computing: Vienna, Austria, 2015; Available online: https://www.r-project.org/ (accessed on 17 April 2022).
- SAS Institute Inc. JMP 14 Predictive and Specialized Modeling; SAS Institute: Cary, NC, USA, 2018. [Google Scholar]
- Gloor, G.B.; Reid, G. Compositional Analysis: A Valid Approach to Analyze Microbiome High-Throughput Sequencing Data. Can. J. Microbiol. 2016, 62, 692–703. [Google Scholar] [CrossRef]
- Gloor, G.B.; Macklaim, J.M.; Pawlowsky-Glahn, V.; Egozcue, J.J. Microbiome Datasets Are Compositional: And This Is Not Optional. Front. Microbiol. 2017, 8, 2224. [Google Scholar] [CrossRef]
- Kim, N.; Riggins, C.W.; Zabaloy, C.; Allegrini, M.; Rodriguez-zas, S.L.; Villamil, B. High-Resolution Indicators of Soil Microbial Responses to N Fertilization and Cover Cropping in Corn Monocultures. Agronomy 2022, 12, 954. [Google Scholar] [CrossRef]
- Villamil, M.B.; Kim, N.; Riggins, C.W.; Zabaloy, M.C.; Allegrini, M.; Rodríguez-Zas, S.L. Microbial Signatures in Fertile Soils Under Long-Term N Management. Front. Soil Sci. 2021, 1, 1–22. [Google Scholar] [CrossRef]
- Palarea-Albaladejo, J.; Martín-Fernández, J.A. ZCompositions - R Package for Multivariate Imputation of Left-Censored Data under a Compositional Approach. Chemom. Intell. Lab. Syst. 2015, 143, 85–96. [Google Scholar] [CrossRef]
- Aitchison, J. The Statistical Analysis of Compositional Data. J. R. Stat. Soc. Ser. B Stat. Methodol. 1982, 44, 139–177. [Google Scholar] [CrossRef]
- Anderson, M.J. A New Method for Non-Parametric Multivariate Analysis of Variance. Austral Ecol. 2001, 26, 32–46. [Google Scholar] [CrossRef]
- Hervé, M. RVAideMemoire: Testing and Plotting Procedures for Biostatistics. R Package Version 0.9–80. Available online: https://cran.r-project.org/web/packages/RVAideMemoire/RVAideMemoire.pdf (accessed on 21 February 2022).
- Kozdrój, J.; Van Elsas, J.D. Response of the Bacterial Community to Root Exudates in Soil Polluted with Heavy Metals Assessed by Molecular and Cultural Approaches. Soil Biol. Biochem. 2000, 32, 1405–1417. [Google Scholar] [CrossRef]
- Sheng, M.; Hamel, C.; Fernandez, M.R. Cropping Practices Modulate the Impact of Glyphosate on Arbuscular Mycorrhizal Fungi and Rhizosphere Bacteria in Agroecosystems of the Semiarid Prairie. Can. J. Microbiol. 2012, 58, 990–1001. [Google Scholar] [CrossRef]
- Zabaloy, M.C.; Carné, I.; Viassolo, R.; Gómez, M.A.; Gomez, E. Soil Ecotoxicity Assessment of Glyphosate Use under Field Conditions: Microbial Activity and Community Structure of Eubacteria and Ammonia-Oxidising Bacteria. Pest Manag. Sci. 2015, 72, 684–691. [Google Scholar] [CrossRef]
- Schlatter, D.C.; Yin, C.; Hulbert, S.; Burke, I. Impacts of Repeated Glyphosate Use on Wheat-Associated Bacteria Are Small and Depend on Glyphosate Use History. Appl. Environ. Microbiol. 2017, 83, e01354-17. [Google Scholar] [CrossRef]
- Imparato, V.; Santos, S.S.; Johansen, A.; Geisen, S.; Winding, A. Stimulation of Bacteria and Protists in Rhizosphere of Glyphosate-Treated Barley. Appl. Soil Ecol. 2016, 98, 47–55. [Google Scholar] [CrossRef]
- Bulgarelli, D.; Garrido-Oter, R.; Münch, P.C.; Weiman, A.; Dröge, J.; Pan, Y.; McHardy, A.C.; Schulze-Lefert, P. Structure and Function of the Bacterial Root Microbiota in Wild and Domesticated Barley. Cell Host Microbe 2015, 17, 392–403. [Google Scholar] [CrossRef]
- Ndour, P.M.S.; Barry, C.M.; Tine, D.; De la Fuente Cantó, C.; Gueye, M.; Barakat, M.; Ortet, P.; Achouak, W.; Ndoye, I.; Sine, B.; et al. Pearl Millet Genotype Impacts Microbial Diversity and Enzymatic Activities in Relation to Root-Adhering Soil Aggregation. Plant Soil 2021, 464, 109–129. [Google Scholar] [CrossRef]
- Lei, S.; Xu, X.; Cheng, Z.; Xiong, J.; Ma, R.; Zhang, L.; Yang, X.; Zhu, Y.; Zhang, B.; Tian, B. Analysis of the Community Composition and Bacterial Diversity of the Rhizosphere Microbiome across Different Plant Taxa. Microbiologyopen 2019, 8, e00762. [Google Scholar] [CrossRef] [PubMed]
- Jenkins, M.; Locke, M.; Reddy, K.; McChesney, D.S.; Steinriede, R. Glyphosate Applications, Glyphosate Resistant Corn, and Tillage on Nitrification Rates and Distribution of Nitrifying Microbial Communities. Soil Sci. Soc. Am. J. 2017, 81, 1371–1380. [Google Scholar] [CrossRef]
- Zhang, C.J.; Yang, Z.L.; Shen, J.P.; Sun, Y.F.; Wang, J.T.; Han, H.Y.; Wan, S.Q.; Zhang, L.M.; He, J.Z. Impacts of Long-Term Nitrogen Addition, Watering and Mowing on Ammonia Oxidizers, Denitrifiers and Plant Communities in a Temperate Steppe. Appl. Soil Ecol. 2018, 130, 241–250. [Google Scholar] [CrossRef]
- Liang, S.; Grossman, J.; Shi, W. Soil Microbial Responses to Winter Legume Cover Crop Management during Organic Transition. Eur. J. Soil Biol. 2014, 65, 15–22. [Google Scholar] [CrossRef]
- Zielińska, M.; Rusanowska, P.; Jarząbek, J.; Nielsen, J.L. Community Dynamics of Denitrifying Bacteria in Full-Scale Wastewater Treatment Plants. Environ. Technol. 2016, 37, 2358–2367. [Google Scholar] [CrossRef]
- Baldani, J.I.; Rouws, L.; Cruz, L.M.; Olivares, F.L.; Schmid, M.; Hartmann, A. The Family Oxalobacteraceae. In The Prokaryotes; Rosenberg, E., DeLong, E.F., Lory, S., Stackebrandt, E., Thompson, F., Eds.; Springer: Berlin/Heidelberg, Germany, 2014; pp. 919–974. [Google Scholar] [CrossRef]
- Madhaiyan, M.; Poonguzhali, S.; Saravanan, V.S.; Hari, K.; Lee, K.C.; Lee, J.S. Duganella Sacchari Sp. Nov. and Duganella Radicis Sp. Nov., Two Novel Species Isolated from Rhizosphere of Field-Grown Sugar Cane. Int. J. Syst. Evol. Microbiol. 2013, 63, 1126–1131. [Google Scholar] [CrossRef]
- Yin, C.; Hulbert, S.H.; Schroeder, K.L.; Mavrodi, O.; Mavrodi, D.; Dhingra, A.; Schillinger, W.F.; Paulitz, T.C. Role of Bacterial Communities in the Natural Suppression of Rhizoctonia Solani Bare Patch Disease of Wheat (Triticum aestivum L.). Appl. Environ. Microbiol. 2013, 79, 7428–7438. [Google Scholar] [CrossRef]
- Jiang, P.X.; Wang, H.S.; Zhang, C.; Lou, K.; Xing, X.H. Reconstruction of the Violacein Biosynthetic Pathway from Duganella Sp. B2 in Different Heterologous Hosts. Appl. Microbiol. Biotechnol. 2010, 86, 1077–1088. [Google Scholar] [CrossRef]
- Pisa, G.; Magnani, G.S.; Weber, H.; Souza, E.M.; Faoro, H.; Monteiro, R.A.; Daros, E.; Baura, V.; Bespalhok, J.P.; Pedrosa, F.O.; et al. Diversity of 16S RRNA Genes from Bacteria of Sugarcane Rhizosphere Soil. Braz. J. Med. Biol. Res. 2011, 44, 1215–1221. [Google Scholar] [CrossRef]
- Schlatter, D.C.; Yin, C.; Hulbert, S.; Paulitz, T.C. Core Rhizosphere Microbiomes of Dryland Wheat Are Influenced by Location and Land Use History. Appl. Environ. Microbiol. 2020, 86. [Google Scholar] [CrossRef]
- Li, X.; Rui, J.; Mao, Y.; Yannarell, A.; Mackie, R. Dynamics of the Bacterial Community Structure in the Rhizosphere of a Maize Cultivar. Soil Biol. Biochem. 2014, 68, 392–401. [Google Scholar] [CrossRef]
- Ofek, M.; Hadar, Y.; Minz, D. Ecology of Root Colonizing Massilia (Oxalobacteraceae). PLoS ONE 2012, 7, e40117. [Google Scholar] [CrossRef]
- Tonon, L.A.C.; Moreira, A.P.B.; Thompson, F. The Family Erythrobacteraceae. In The Prokaryotes; Rosenberg, E., DeLong, E.F., Lory, S., Stackebrandt, E., Thompson, F., Eds.; Springer: Berlin/Heidelberg, Germany, 2014; pp. 214–235. [Google Scholar] [CrossRef]
- Lee, S.D.; Kim, Y.-J.; Kim, I.S. Erythrobacter Suaedae sp. nov., Isolated from a Rhizosphere Mudflat of a Halophyte (Suaeda japonica). Int. J. Syst. Evol. Microbiol. 2019, 69, 3287–3292. [Google Scholar] [CrossRef]
- Ye, Y.H.; Anwar, N.; Xamxidin, M.; Zhang, R.; Yan, C.; Nie, Y.F.; Zhao, Z.; Sun, C.; Wu, M. Description of Erythrobacter mangrovi sp. nov., an Aerobic Bacterium from Rhizosphere Soil of Mangrove Plant (Kandelia candel). Antonie van Leeuwenhoek Int. J. Gen. Mol. Microbiol. 2020, 113, 1425–1435. [Google Scholar] [CrossRef]
- Tang, T.; Sun, X.; Dong, Y.; Liu, Q. Erythrobacter aureus sp. nov., a Plant Growth-Promoting Bacterium Isolated from Sediment in the Yellow Sea, China. 3 Biotech 2019, 9, 430. [Google Scholar] [CrossRef]
- Kämpfer, P.; Martin, K.; McInroy, J.A.; Glaeser, S.P. Proposal of Novosphingobium rhizosphaerae sp. nov., Isolated from the Rhizosphere. Int. J. Syst. Evol. Microbiol. 2015, 65, 195–200. [Google Scholar] [CrossRef]
- Zhang, L.; Gao, J.S.; Kim, S.G.; Zhang, C.W.; Jiang, J.Q.; Ma, X.T.; Zhang, J.; Zhang, X.X. Novosphingobium oryzae sp. nov., a Potential Plant-Promoting Endophytic Bacterium Isolated from Rice Roots. Int. J. Syst. Evol. Microbiol. 2016, 66, 302–307. [Google Scholar] [CrossRef]
- Rodgers-Vieira, E.A.; Zhang, Z.; Adrion, A.C.; Gold, A.; Aitken, M.D. Identification of Anthraquinone-Degrading Bacteria in Soil Contaminated with Polycyclic Aromatic Hydrocarbons. Appl. Environ. Microbiol. 2015, 81, 3775–3781. [Google Scholar] [CrossRef]
- Hargreaves, S.K.; Williams, R.J.; Hofmockel, K.S. Environmental Filtering of Microbial Communities in Agricultural Soil Shifts with Crop Growth. PLoS ONE 2015, 10, e0134345. [Google Scholar] [CrossRef]
- DeBruyn, J.M.; Nixon, L.T.; Fawaz, M.N.; Johnson, A.M.; Radosevich, M. Global Biogeography and Quantitative Seasonal Dynamics of Gemmatimonadetes in Soil. Appl. Environ. Microbiol. 2011, 77, 6295–6300. [Google Scholar] [CrossRef]
- Pascual, J.; García-López, M.; Bills, G.F.; Genilloud, O. Longimicrobium Terrae gen. nov., sp. nov., an Oligotrophic Bacterium of the under-Represented Phylum Gemmatimonadetes Isolated through a System of Miniaturized Diffusion Chambers. Int. J. Syst. Evol. Microbiol. 2016, 66, 1976–1985. [Google Scholar] [CrossRef]
- Foesel, B.U.; Geppert, A.; Rohde, M.; Overmann, J. Parviterribacter kavangonensis gen. nov., sp. nov. and Parviterribacter multiflagellatus sp. nov., novel members of Parviterribacteraceae fam. nov. within the order Solirubrobacterales, and emended descriptions of the classes Thermoleophilia and Rubrobact and their orders and families. Int. J. Syst. Evol. Microbiol. 2016, 66, 652–665. [Google Scholar] [CrossRef]
- Liu, Y.; Fan, X.; Zhang, T.; He, W.; Song, F. Effects of the Long-Term Application of Atrazine on Soil Enzyme Activity and Bacterial Community Structure in Farmlands in China. Environ. Pollut. 2020, 262, 114264. [Google Scholar] [CrossRef]
- Bergmann, G.T.; Bates, S.T.; Eilers, K.G.; Lauber, C.L.; Caporaso, J.G.; Walters, W.A.; Knight, R.; Fierer, N. The Under-Recognized Dominance of Verrucomicrobia in Soil Bacterial Communities. Soil Biol. Biochem. 2011, 43, 1450–1455. [Google Scholar] [CrossRef]
- Buckley, D.H.; Schmidt, T.M. Environmental Factors Influencing the Distribution of rRNA from Verrucomicrobia in Soil. FEMS Microbiol. Ecol. 2001, 35, 105–112. [Google Scholar] [CrossRef]
- Navarrete, A.A.; Soares, T.; Rossetto, R.; van Veen, J.A.; Tsai, S.M.; Kuramae, E.E. Verrucomicrobial Community Structure and Abundance as Indicators for Changes in Chemical Factors Linked to Soil Fertility. Antonie van Leeuwenhoek Int. J. Gen. Mol. Microbiol. 2015, 108, 741–752. [Google Scholar] [CrossRef]
- Otsuka, S.; Suenaga, T.; Vu, H.T.; Ueda, H.; Yokota, A.; Senoo, K. Brevifollis gellanilyticus gen. nov., sp. nov., a Gellan-Gum-Degrading Bacterium of the Phylum Verrucomicrobia. Int. J. Syst. Evol. Microbiol. 2013, 63, 3075–3078. [Google Scholar] [CrossRef]
- Vasconcellos, R.L.F.; Romagnoli, E.M.; Taketani, R.G.; Santos, S.N.; Zucchi, T.D.; Melo, I.S. Impact of Inoculation with Pseudomonas eestus CMAA 1215T on the Non-Target Resident Bacterial Community in a Saline Rhizosphere Soil. Curr. Microbiol. 2021, 78, 218–228. [Google Scholar] [CrossRef]
- Li, X.; Zhang, Y.; Ding, C.; Jia, Z.; He, Z.; Zhang, T.; Wang, X. Declined Soil Suppressiveness to Fusarium oxysporum by Rhizosphere Microflora of Cotton in Soil Sickness. Biol. Fertil. Soils 2015, 51, 935–946. [Google Scholar] [CrossRef]
- Ransom-Jones, E.; Jones, D.L.; McCarthy, A.J.; McDonald, J.E. The Fibrobacteres: An Important Phylum of Cellulose-Degrading Bacteria. Microb. Ecol. 2012, 63, 267–281. [Google Scholar] [CrossRef]
- Ren, N.; Wang, Y.; Ye, Y.; Zhao, Y.; Huang, Y.; Fu, W.; Chu, X. Effects of Continuous Nitrogen Fertilizer Application on the Diversity and Composition of Rhizosphere Soil Bacteria. Front. Microbiol. 2020, 11, 1948. [Google Scholar] [CrossRef] [PubMed]
- Zhao, Y.; Yao, Y.; Xu, H.; Xie, Z.; Guo, J.; Qi, Z.; Jiang, H. Soil Metabolomics and Bacterial Functional Traits Revealed the Responses of Rhizosphere Soil Bacterial Community to Long-Term Continuous Cropping of Tibetan Barley. PeerJ 2022, 10, e13254. [Google Scholar] [CrossRef] [PubMed]
- Piutti, S.; Semon, E.; Landry, D.; Hartmann, A.; Dousset, S.; Lichtfouse, E.; Topp, E.; Soulas, G.; Martin-Laurent, F. Isolation and Characterisation of Nocardioides sp. SP12, an Atrazine-Degrading Bacterial Strain Possessing the Gene trzN from Bulk- and Maize Rhizosphere Soil. FEMS Microbiol. Lett. 2003, 221, 111–117. [Google Scholar] [CrossRef]
- Hou, J.; Liu, W.; Wang, B.; Wang, Q.; Luo, Y.; Franks, A.E. PGPR Enhanced Phytoremediation of Petroleum Contaminated Soil and Rhizosphere Microbial Community Response. Chemosphere 2015, 138, 592–598. [Google Scholar] [CrossRef]
- Buckley, D.H.; Huangyutitham, V.; Nelson, T.A.; Rumberger, A.; Thies, J.E. Diversity of Planctomycetes in Soil in Relation to Soil History and Environmental Heterogeneity. Appl. Environ. Microbiol. 2006, 72, 4522–4531. [Google Scholar] [CrossRef]
- Akinola, S.A.; Ayangbenro, A.S.; Babalola, O.O. Metagenomic Insight into the Community Structure of Maize-Rhizosphere Bacteria as Predicted by Different Environmental Factors and Their Functioning within Plant Proximity. Microorganisms 2021, 9, 1419. [Google Scholar] [CrossRef]
- Xia, Z.; Wang, Q.; She, Z.; Gao, M.; Zhao, Y.; Guo, L.; Jin, C. Nitrogen Removal Pathway and Dynamics of Microbial Community with the Increase of Salinity in Simultaneous Nitrification and Denitrification Process. Sci. Total Environ. 2019, 697, 134047. [Google Scholar] [CrossRef]
- Dourado, M.N.; Camargo Neves, A.A.; Santos, D.S.; Araújo, W.L. Biotechnological and Agronomic Potential of Endophytic Pink-Pigmented Methylotrophic Methylobacterium spp. BioMed Res. Int. 2015, 2015, 909016. [Google Scholar] [CrossRef]
- Green, P.N. Methylobacterium. In Bergey’s Manual Systematics of Archaea and Bacteria; In Association with Bergey’s Manual Trust; Whitman, W.B., Ed.; John Wiley & Sons, Inc.: Hoboken, NJ, USA, 2015; pp. 1–8. [Google Scholar] [CrossRef]
- Jinal, H.N.; Amaresan, N.; Sankaranarayanan, A. Methylobacterium. In Beneficial Microbes in Agro-Ecology; Amaresan, N., Senthil Kumar, M., Annapurna, K., Kumar, K., Sankaranarayanan, A., Eds.; Academic Press: Cambridge, MA, USA, 2020; pp. 509–519. [Google Scholar] [CrossRef]
- Hördt, A.; López, M.G.; Meier-Kolthoff, J.P.; Schleuning, M.; Weinhold, L.M.; Tindall, B.J.; Gronow, S.; Kyrpides, N.C.; Woyke, T.; Göker, M. Analysis of 1,000+ Type-Strain Genomes Substantially Improves Taxonomic Classification of Alphaproteobacteria. Front. Microbiol. 2020, 11. [Google Scholar] [CrossRef]
- Vasilyeva, L.V. Stella, a New Genus of Soil Prosthecobacteria, with Proposals for Stella humosa sp. Nov. and Stella vacuolata sp. nov. Int. J. Syst. Bacteriol. 1985, 35, 518–521. [Google Scholar] [CrossRef]
- Wijayawardene, N.N.; Hyde, K.D.; Dai, D.Q. Outline of Ascomycota. In Encyclopedia of Mycology; Elsevier: Amsterdam, The Netherlands, 2021; Volume 1, pp. 246–254. [Google Scholar] [CrossRef]
- Ma, A.; Zhuang, X.; Wu, J.; Cui, M.; Lv, D.; Liu, C.; Zhuang, G. Ascomycota Members Dominate Fungal Communities during Straw Residue Decomposition in Arable Soil. PLoS ONE 2013, 8, e66146. [Google Scholar] [CrossRef]
- Xu, L.; Ravnskov, S.; Larsen, J.; Nicolaisen, M. Linking Fungal Communities in Roots, Rhizosphere, and Soil to the Health Status of Pisum Sativum. FEMS Microbiol. Ecol. 2012, 82, 736–745. [Google Scholar] [CrossRef]
- Miura, T.; Niswati, A.; Swibawa, I.G.; Haryani, S.; Gunito, H.; Shimano, S.; Fujie, K.; Kaneko, N. Diversity of Fungi on Decomposing Leaf Litter in a Sugarcane Plantation and Their Response to Tillage Practice and Bagasse Mulching: Implications for Management Effects on Litter Decomposition. Microb. Ecol. 2015, 70, 646–658. [Google Scholar] [CrossRef]
- Newsham, K.K. Phialophora Graminicola, a Dark Septate Fungus, Is a Beneficial Associate of the Grass Vulpia ciliata Ssp. ambigua. New Phytol. 1999, 144, 517–524. [Google Scholar] [CrossRef]
- Yao, Q.; Xu, Y.; Liu, X.; Liu, J.; Huang, X.; Yang, W.; Yang, Z.; Lan, L.; Zhou, J.; Wang, G. Dynamics of Soil Properties and Fungal Community Structure in Continuous-Cropped Alfalfa Fields in Northeast China. PeerJ 2019, 2019, e7127. [Google Scholar] [CrossRef]
- Dean, S.L.; Billingsley Tobias, T.; Phippen, W.B.; Clayton, A.W.; Gruver, J.; Porras-Alfaro, A. A Study of Glycine max (Soybean) Fungal Communities under Different Agricultural Practices. Plant Gene 2017, 11, 8–16. [Google Scholar] [CrossRef]
- Digby, A.L.; Gleason, F.H.; McGee, P.A. Some Fungi in the Chytridiomycota Can Assimilate Both Inorganic and Organic Sources of Nitrogen. Fungal Ecol. 2010, 3, 261–266. [Google Scholar] [CrossRef]
- Tian, L.; Shi, S.; Ma, L.; Tran, L.S.P.; Tian, C. Community Structures of the Rhizomicrobiomes of Cultivated and Wild Soybeans in Their Continuous Cropping. Microbiol. Res. 2020, 232, 126390. [Google Scholar] [CrossRef]
- Schlatter, D.C.; Burke, I.; Paulitz, T.C. Succession of Fungal and Oomycete Communities in Glyphosate-Killed Wheat Roots. Phytopathology 2018, 108, 582–594. [Google Scholar] [CrossRef]
- Borrell, A.N.; Shi, Y.; Gan, Y.; Bainard, L.D.; Germida, J.J.; Hamel, C. Fungal Diversity Associated with Pulses and Its Influence on the Subsequent Wheat Crop in the Canadian Prairies. Plant Soil 2017, 414, 13–31. [Google Scholar] [CrossRef]
- Lou, J.; Fu, L.; Peng, Y.; Zhou, L. Metabolites from Alternaria fungi and Their Bioactivities. Molecules 2013, 18, 5891–5935. [Google Scholar] [CrossRef]
- Espagne, E.; Lespinet, O.; Malagnac, F.; Da Silva, C.; Jaillon, O.; Porcel, B.M.; Couloux, A.; Aury, J.M.; Ségurens, B.; Poulain, J.; et al. The Genome Sequence of the Model Ascomycete Fungus Podospora anserina. Genome Biol. 2008, 9, R77. [Google Scholar] [CrossRef]


| Pa | NH4+ | NO3− | |||||
|---|---|---|---|---|---|---|---|
| n | Mean | SEM | Mean | SEM | Mean | SEM | |
| Suppression method 1 | |||||||
| DQ | 8 | 11.89 | 1.64 | 29.96 | 19.15 | 5.98 | 1.16 |
| R | 8 | 9.60 | 1.64 | 31.43 | 19.15 | 6.01 | 1.16 |
| SS | 8 | 12.65 | 1.80 | 27.03 | 19.22 | 3.33 | 1.49 |
| df | p-value | ||||||
| Suppression method | 2 | 0.218 | 0.539 | 0.451 | |||
| Bacteria | Archaea | AOA | AOB | nirS | nirK | ||||||||
|---|---|---|---|---|---|---|---|---|---|---|---|---|---|
| n | Mean | SEM | Mean | SEM | Mean | SEM | Mean | SEM | Mean | SEM | Mean | SEM | |
| Suppression method 1 | |||||||||||||
| DQ | 8 | 8.58 | 0.15 | 6.74 | 0.05 | 5.72 | 0.08 | 5.71 | 0.39 | 6.71 | 0.61 | 6.52 | 0.48 |
| R | 8 | 8.58 | 0.14 | 6.68 | 0.05 | 5.82 | 0.07 | 5.64 | 0.38 | 6.32 | 0.60 | 6.64 | 0.48 |
| SS | 12 | 8.56 | 0.14 | 6.75 | 0.04 | 5.73 | 0.06 | 5.65 | 0.38 | 6.64 | 0.59 | 6.55 | 0.48 |
| df | p-value | ||||||||||||
| Suppression method | 2 | 0.947 | 0.510 | 0.627 | 0.906 | 0.406 | 0.665 | ||||||
| Taxa | Treatments | Chao-1 | S’ | 1/λ | H’ | EH | ||||||
|---|---|---|---|---|---|---|---|---|---|---|---|---|
| n | Mean | SEM | Mean | SEM | Mean | SEM | Mean | SEM | Mean | SEM | ||
| Bacteria | Suppression method 1 | |||||||||||
| DQ | 8 | 1157 | 97.23 | 1152 | 94.71 | 594.18 | 47.17 | 6.68 | 0.08 | 0.950 | 0.002 | |
| R | 8 | 1314 | 97.23 | 1304 | 94.71 | 663.93 | 47.17 | 6.81 | 0.08 | 0.951 | 0.002 | |
| SS | 12 | 1233 | 79.39 | 1223 | 77.33 | 549.18 | 43.29 | 6.68 | 0.07 | 0.946 | 0.002 | |
| df | p-value | |||||||||||
| Suppression method | 2 | 0.530 | 0.535 | 0.074 | 0.444 | 0.224 | ||||||
| Fungi | Suppression method 1 | |||||||||||
| DQ | 8 | 173.88 | 41.38 | 173.88 | 41.38 | 44.85 | 10.71 | 4.36 | 0.10 | 0.853 | 0.04 | |
| R | 8 | 195.13 | 41.38 | 195.13 | 41.38 | 39.06 | 10.71 | 4.36 | 0.10 | 0.834 | 0.04 | |
| SS | 12 | 160.19 | 41.21 | 160.19 | 41.21 | 35.14 | 10.50 | 4.22 | 0.10 | 0.842 | 0.04 | |
| df | p-value | |||||||||||
| Suppression method | 2 | 0.333 | 0.333 | 0.181 | 0.573 | 0.740 | ||||||
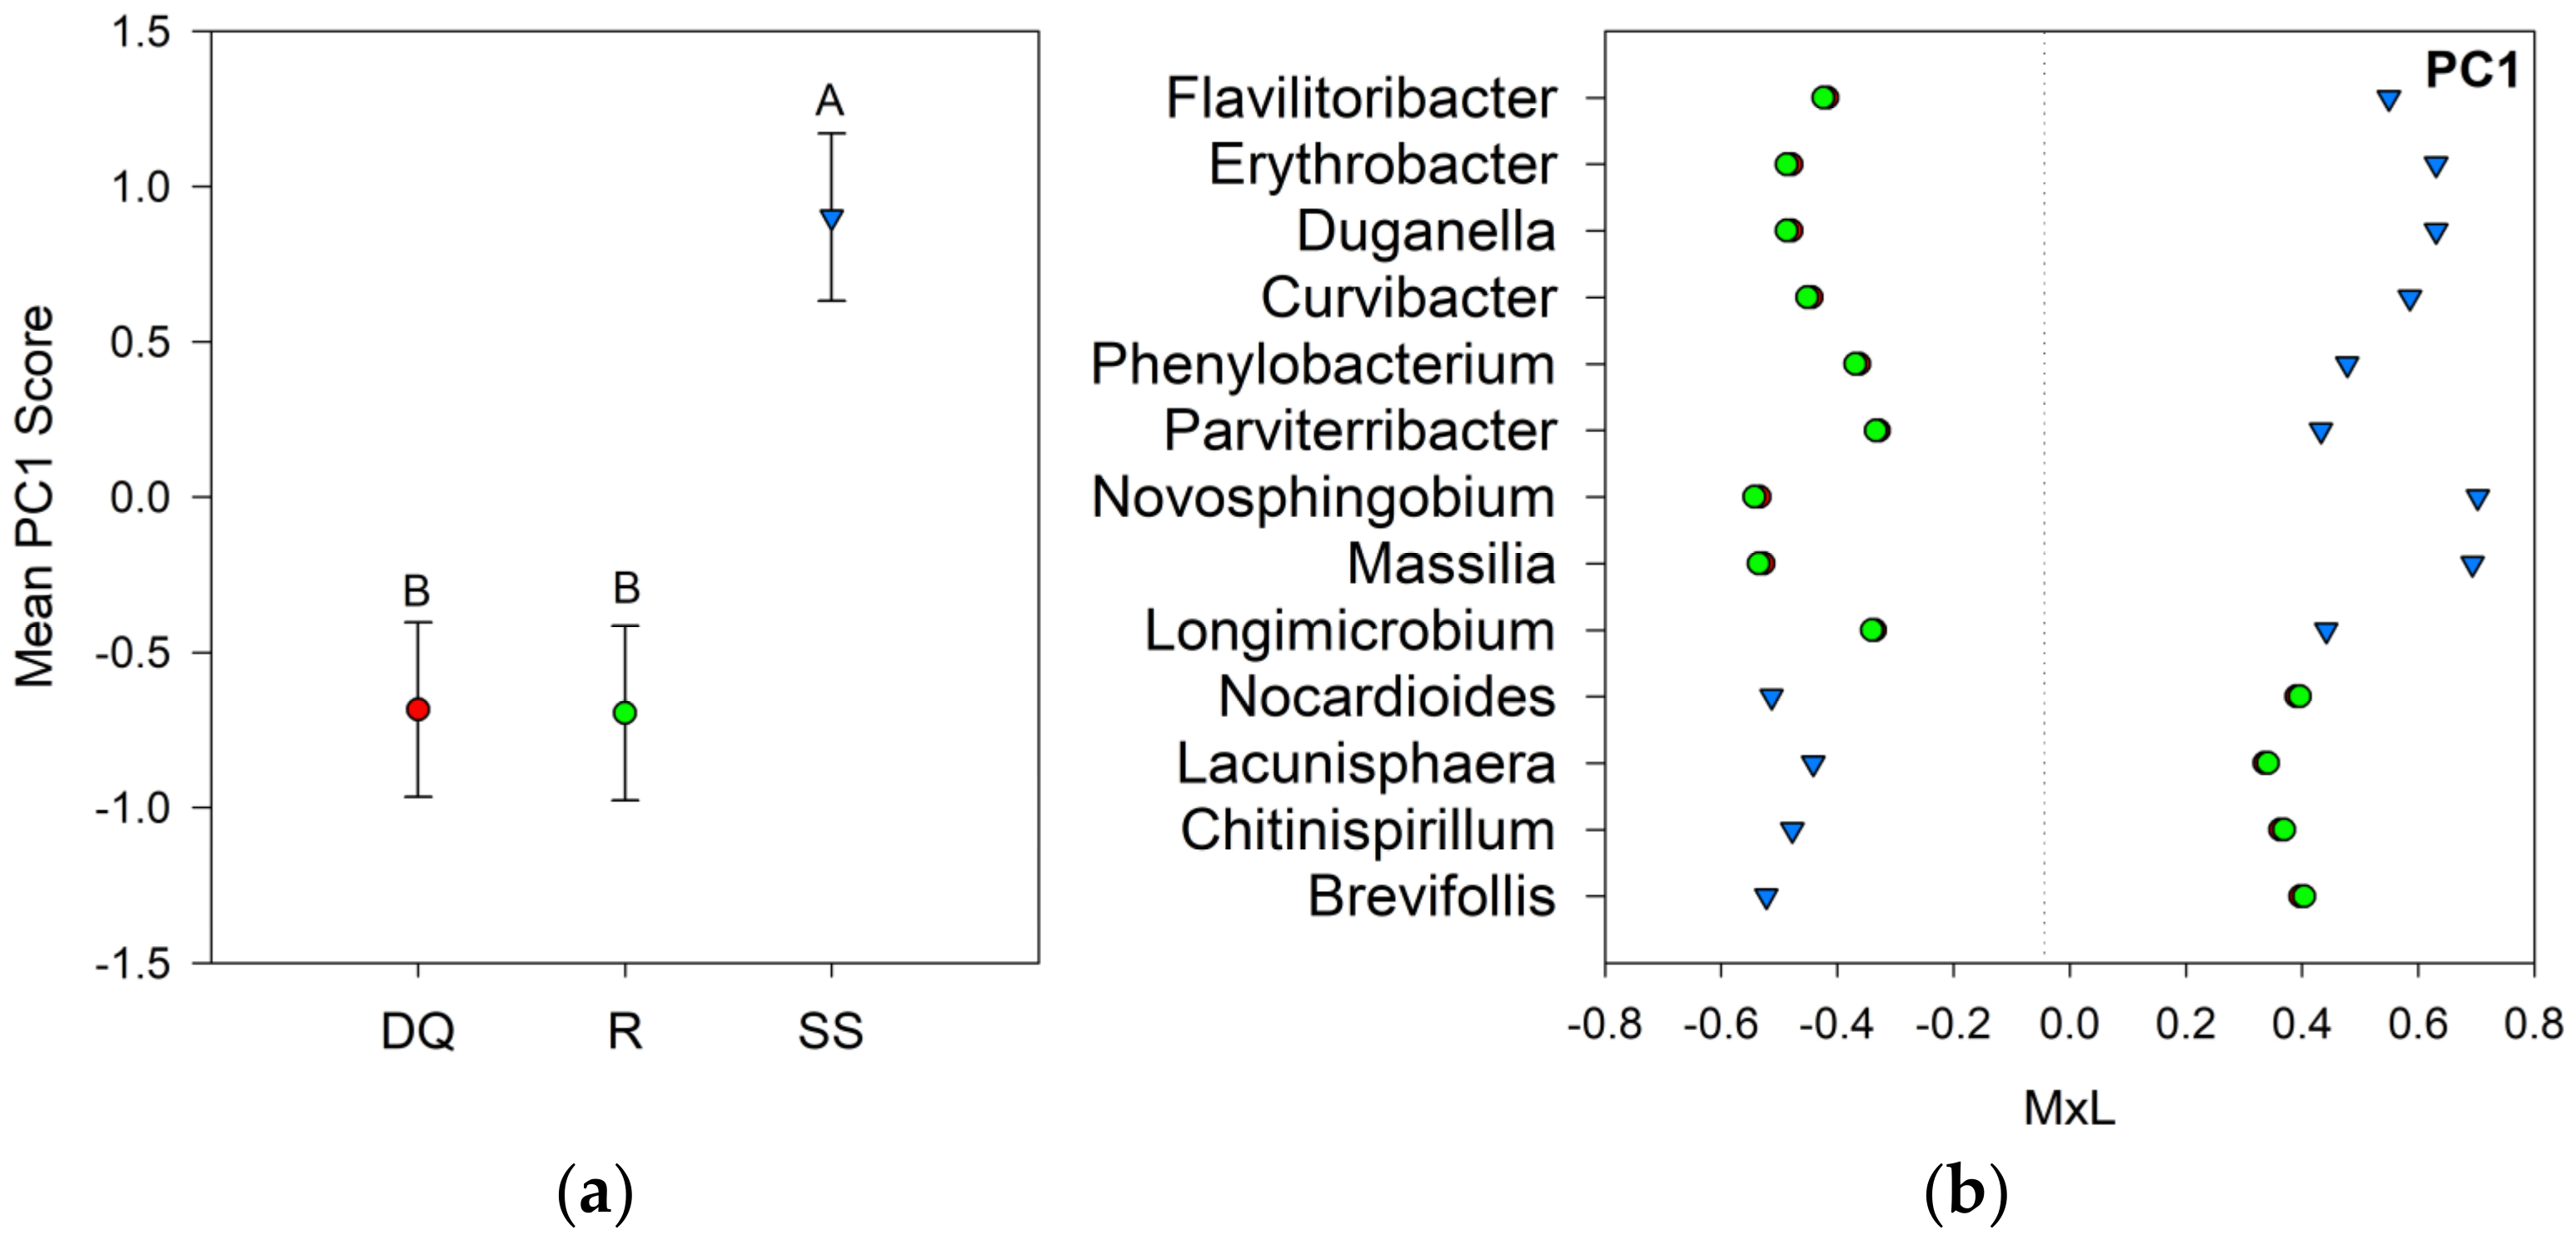
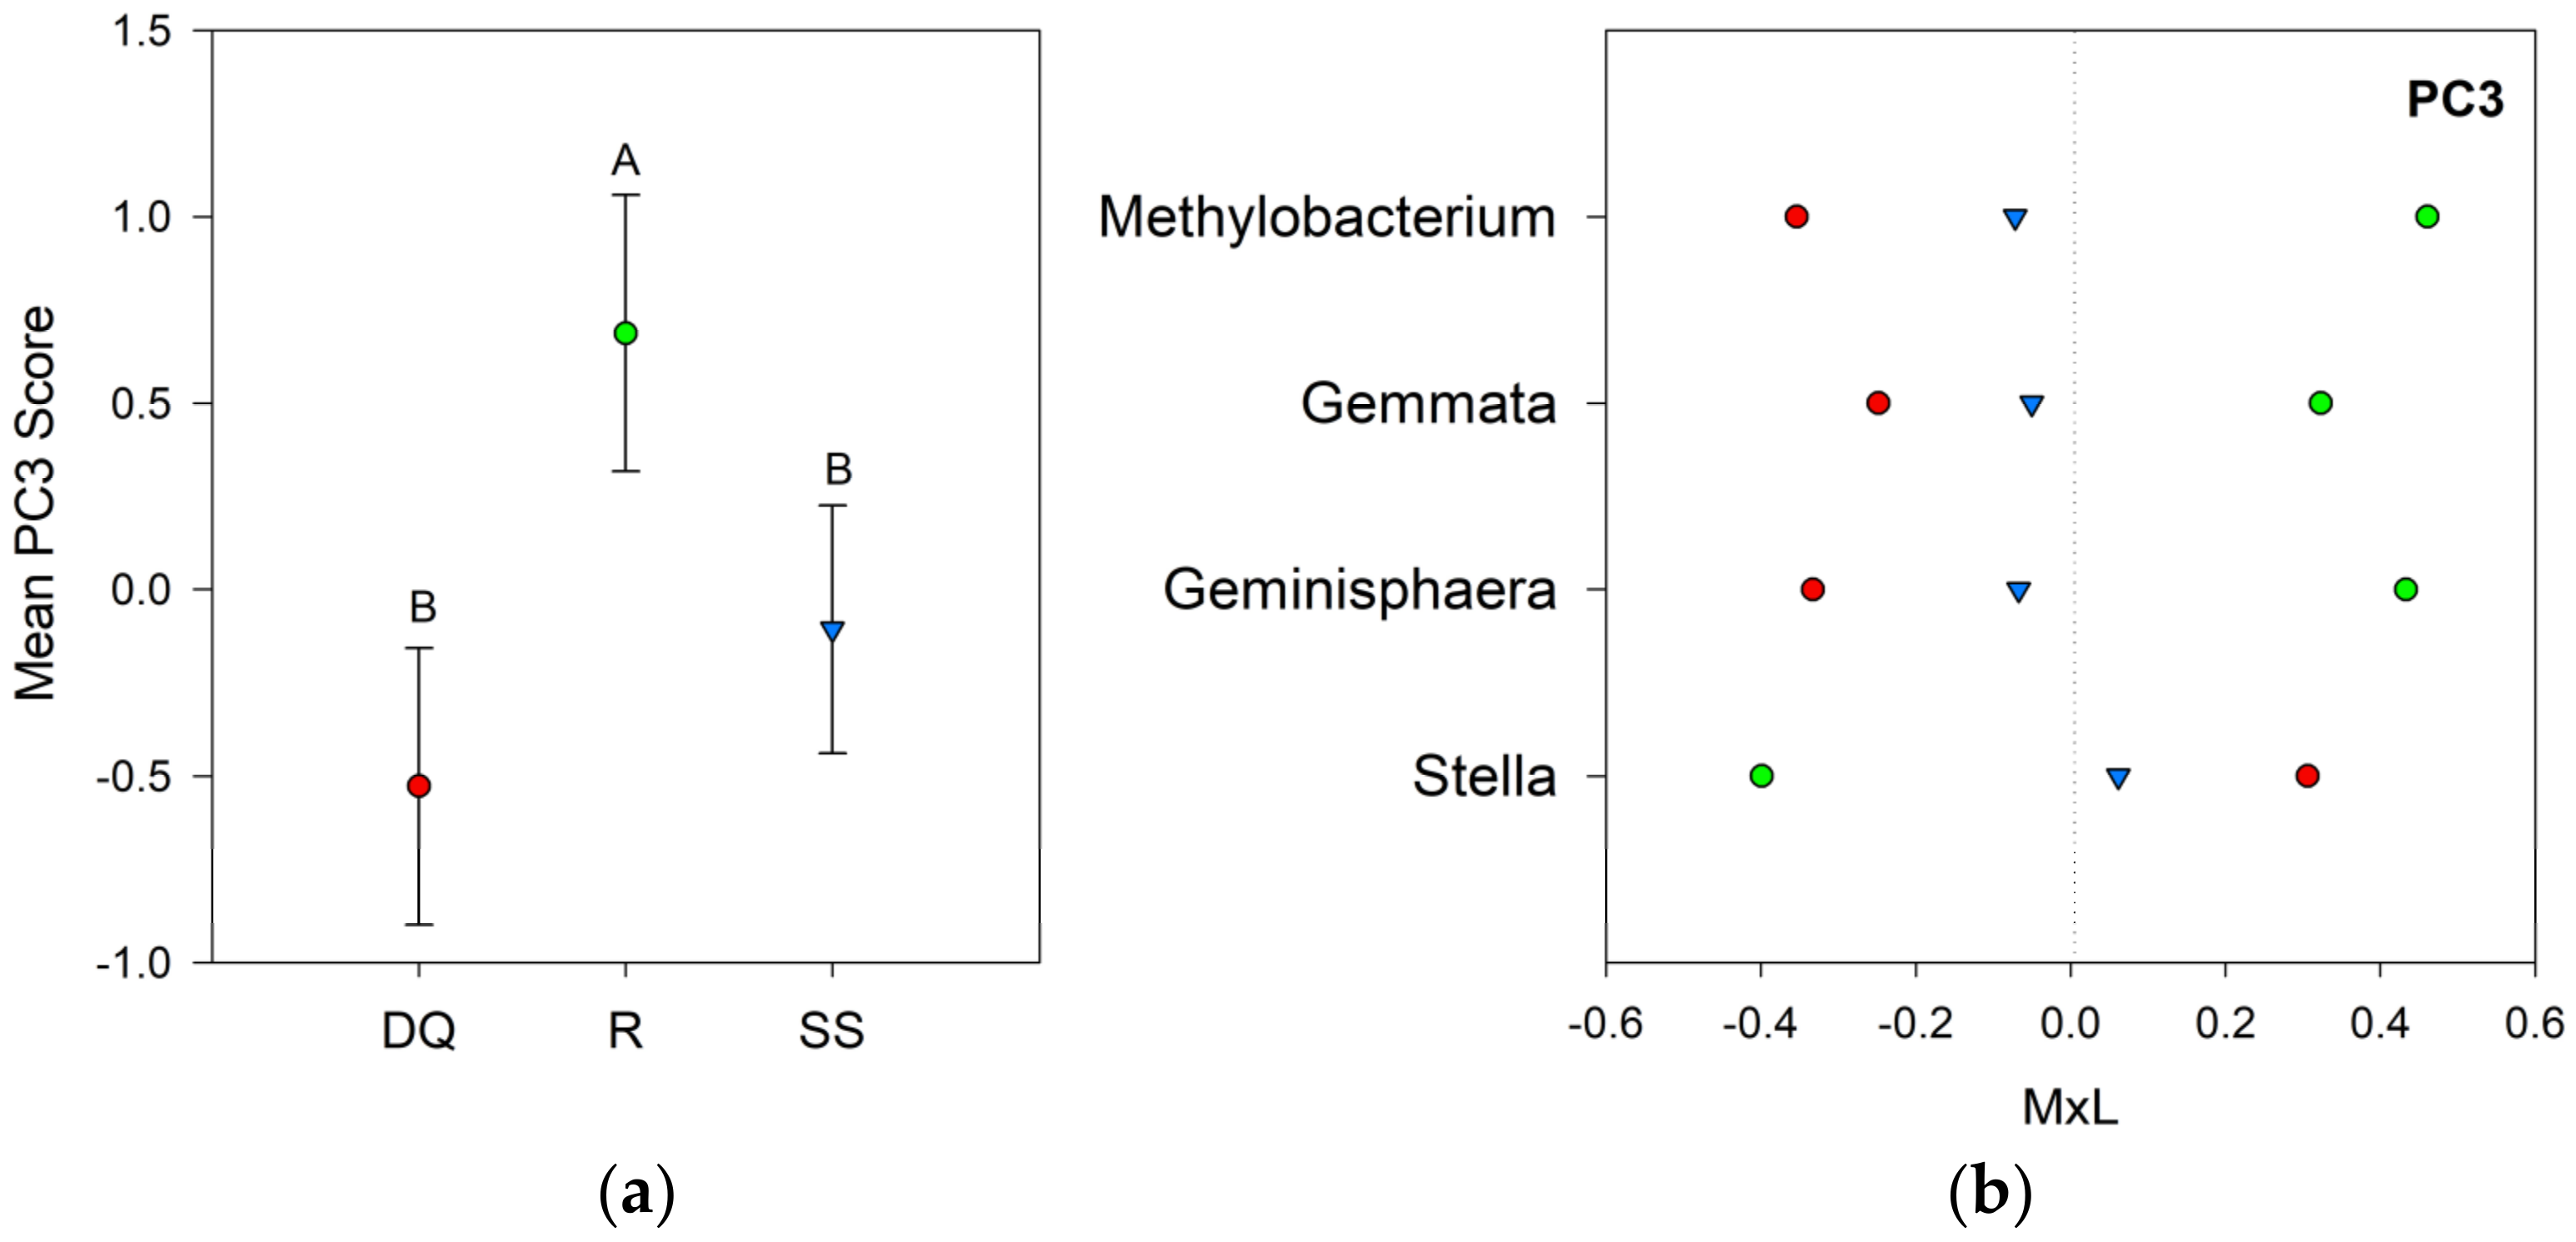
| Bacteria | |||||||
|---|---|---|---|---|---|---|---|
| PC1 | PC2 | PC3 | PC4 | PC5 | PC6 | PC7 | |
| Suppression method 1 | |||||||
| DQ | −0.68 B | −0.30 | −0.53 B | −0.36 | 0.34 | −0.37 | 0.49 |
| R | −0.70 B | −0.02 | 0.69 A | −0.06 | −0.55 | 0.47 | −0.27 |
| SS | 0.90 A | −0.01 | −0.11 B | 0.27 | 0.07 | −0.07 | −0.15 |
| p-value | 0.027 | 0.679 | 0.019 | 0.332 | 0.123 | 0.240 | 0.243 |
| Fungi | ||||||||
|---|---|---|---|---|---|---|---|---|
| PC1 | PC2 | PC3 | PC4 | PC5 | PC6 | PC7 | PC8 | |
| Suppression method 1 | ||||||||
| DQ | −0.11 B | −0.59 | −0.44 | 0.53 | −0.44 | −0.06 | −0.27 | −0.59 |
| R | −0.93 C | 0.12 | −0.07 | −0.04 | 0.33 | 0.42 | 0.40 | 0.12 |
| SS | 0.69 A | 0.18 | 0.59 | −0.41 | 0.16 | −0.24 | −0.23 | 0.18 |
| p-value | 0.001 | 0.409 | 0.415 | 0.368 | 0.139 | 0.281 | 0.686 | 0.409 |
Publisher’s Note: MDPI stays neutral with regard to jurisdictional claims in published maps and institutional affiliations. |
© 2022 by the authors. Licensee MDPI, Basel, Switzerland. This article is an open access article distributed under the terms and conditions of the Creative Commons Attribution (CC BY) license (https://creativecommons.org/licenses/by/4.0/).
Share and Cite
Morales, M.E.; Allegrini, M.; Iocoli, G.A.; Basualdo, J.; Villamil, M.B.; Zabaloy, M.C. Rhizospheric Microbiome Responses to Cover Crop Suppression Methods. Agronomy 2022, 12, 2246. https://doi.org/10.3390/agronomy12102246
Morales ME, Allegrini M, Iocoli GA, Basualdo J, Villamil MB, Zabaloy MC. Rhizospheric Microbiome Responses to Cover Crop Suppression Methods. Agronomy. 2022; 12(10):2246. https://doi.org/10.3390/agronomy12102246
Chicago/Turabian StyleMorales, Marianela E., Marco Allegrini, Gastón A. Iocoli, Jessica Basualdo, María B. Villamil, and María C. Zabaloy. 2022. "Rhizospheric Microbiome Responses to Cover Crop Suppression Methods" Agronomy 12, no. 10: 2246. https://doi.org/10.3390/agronomy12102246
APA StyleMorales, M. E., Allegrini, M., Iocoli, G. A., Basualdo, J., Villamil, M. B., & Zabaloy, M. C. (2022). Rhizospheric Microbiome Responses to Cover Crop Suppression Methods. Agronomy, 12(10), 2246. https://doi.org/10.3390/agronomy12102246