Article

Fractionation of Soil Organic Matter into Labile and Stable Fractions

1
Faculty of Agriculture, University of South Bohemia in Ceske Budejovice, 370 05 Ceske Budejovice, Czech Republic
2
Division of Crop Management Systems, Crop Research Institute, 161 06 Prague, Czech Republic
3
Faculty of Civil Engineering, Brno University of Technology, 602 00 Brno, Czech Republic
*
Author to whom correspondence should be addressed.
Agronomy 2022, 12(1), 73; https://doi.org/10.3390/agronomy12010073
Submission received: 7 December 2021 / Revised: 23 December 2021 / Accepted: 27 December 2021 / Published: 29 December 2021
(This article belongs to the Special Issue Land Management Impacts on Soil Properties and Soil Erosion Processes)

Abstract

:
The present study aims to test and evaluate the efficiency of a new modified method of organic matter evaluation. It allows the assessment of the quality and quantity of the primary soil organic matter and the stable organic fractions separately. The new method was tested in six soil samples of different localities in the Czech Republic. This method is based on observing reaction kinetics during the oxidation of soil organic matter and measuring the cation-exchange capacity of stable organic fractions. The results were compared with classical methods, which rely on the isolation of humic substances, determination of the content of humic acids and fulvic acids and their ratio CHA:CFA, quotient E4/6, and fractionation of soil organic matter according to resistance to oxidation. It turned out that the results of the new modified method are more sensitive in comparison with the results obtained by classical procedures. The linear regression demonstrated the dependence between the amounts of soil organic matter determined by the classical method compared with the modified method. Moreover, the new modified method was found to be faster and not demanding on laboratory equipment. The new method has been improved to be easily repeatable, and some shortcomings of the previous method were eliminated. Based on our results and other recent studies, the modified method may be recommended for the practical evaluation of soil organic matter conditions.

1. Introduction

Soil terrestrial ecosystems are a significant producer of food for humans, livestock feed, as well as a source of phytomass for energy purposes [1,2]. In recent years, many studies have pointed to the deteriorating quality of agricultural soils. Due to the growing worldwide population and deteriorating environment, an ever-increasing pressure is exerted on the production properties of the soils. Thus, the quality of agricultural soils is an increasingly actual topic [3,4,5,6].
Soil organic matter (SOM) is one of the most important factors determining soil fertility. Many previous studies have repeatedly shown the irreplaceable role of SOM. Soils with insufficient SOM are characterized by poor structure and low stability of aggregates [7,8]; they have low hydraulic conductivity and water-holding capacity [9], and generally low nutrient-binding capacity [4]. Moreover, the important roles of SOM in acid buffering were found [10]. The amount of organic carbon in the soil is also important in terms of its temporary storage in the soil. Small changes in the soil organic carbon stock could result in significant impacts on the atmospheric carbon concentration [11].
The adequate use of organic fertilizers is one measure leading to an increase in the amount of the SOM in the agricultural soils [12], which can increase microbial activity [13]. High microbial activity is one of the foundations of potential soil fertility [14]. However, the effect of organic fertilization depends not only on the quantity but also on the quality of the fertilizer used and the environmental conditions [15]. Moreover, farming methods (fertilization, tillage, irrigation, etc.) can affect the decomposition of organic matter [16,17]. For example, Li et al. [18] found that N fertilization decreases SOM decomposition and increases the efficiency of C sequestration in the soil through a higher portion of un-decomposed crop residues.
The high content of total organic carbon (TOC) is often highlighted in the literature as a sign of soil quality [19]. However, the amount of TOC is unequal to the SOM quality. Thus, it is evident that the amount of TOC in the soil cannot indicate the quality of SOM. Moreover, the farmers usually do not even distinguish between labile and stable forms of organic fertilizers and other sources of SOM.
In general, the less stable the organic matter, the more it contributes to soil fertility. Therefore, many authors consider the content of the labile fraction of SOM as a sign of potential soil fertility [16,20,21,22]. However, not only the labile fractions of SOM are important. The stable fractions, mainly due to their cation-exchange capacity (CEC) and the positive effect on soil structure (especially humic acid), are also essential [23,24]. Cation-exchange capacity is one of the most critical soil properties to measure soil ability to bind and hold positively charged ions [25,26].
However, the boundary between labile and stable organic matter is ambiguous. Many authors fractionate organic matter differently [20,21,22,23,24,27,28]. However, undoubtedly hot water extractable carbon can be considered labile [29]. From the point of view of stability, the opposite side is represented by black carbon [30]. The boundary between labile and stable SOM is given by resisting oxidation in the present study. The part of SOM which resists oxidation in a 0.4 mol/L solution of K2Cr2O7 in 12 M of H2SO4 at 90 °C for 30 min is considered stable.
Maroušek et al. [31] published a new analytical method that is relatively not demanding on laboratory equipment. In our work, we used the principle of this method to evaluate the quality and quantity of organic matter in soil samples. However, we proceeded to a slight modification. We used this method to evaluate three forest soil samples and three arable land samples. We also evaluated these samples by classical methods (determination of the content of humic acids and fulvic acids, their ratio CHA:CFA and the quotient E4/6).
The work aimed to compare classical and modified methods in terms of their effectiveness of sample evaluations according to the quality and quantity of SOM. The hypothesis that classical procedures could be replaced by the modified method was examined, which is undemanding in terms of instrumentation and brings results useful in agricultural practice.

2. Materials and Methods

2.1. Samples Used

Six soil samples from forest and agricultural land of the Czech Republic were tested using both the classical method (CM) and the newly modified method (MM), described by Maroušek et al. [31].
Soil samples were as follows (soil taxonomy according to the World reference base for soil resources 2014 [32]):
A:
Borová Lada locality at an altitude of 895 m, GPS coordinates: 48.986409, 13.671749; forest soil sample (O-horizon) of medium-heavy cambisols (forest composition: spruce 65%, pine 21%, birch 10%);
B:
Zahrádky near Borová Lada locality at an altitude of 880 m, GPS coordinates: 48.977437, 13.689511; forest soil sample (O-horizon) of medium-heavy gleysols (forest composition: spruce 81%, beech 11%, pine 4%);
C:
Plavsko near Stráž and Nežárkou locality at an altitude of 464 m, GPS coordinates: 49.088498, 14.894712; forest soil sample (O-horizon) of medium-heavy stagnosols (forest composition: pine 79%, spruce 13%, oak 4%);
D:
Opařany locality at an altitude of 465 m, GPS coordinates: 49.405163, 14.478683; agricultural soil sample (A-horizon) of medium-heavy cambisols;
E:
Třeboň locality at an altitude of 434 m, GPS coordinates: 49.023263, 14.647633; agricultural soil sample (A-horizon) of medium-heavy luvisols;
F:
Modřice u Brna locality at an altitude of 204 m, GPS coordinates: 49.115030, 16.614573; agricultural soil sample (A-horizon) of medium-heavy chernozems.
One composited soil sample was taken from each locality. The first group of samples (A, B, C) includes typical forest soils of the Czech Republic. Forest soils were chosen because significant differences in the quantity and quality of their organic matter could be expected. There was a presumption that these differences should be measurable by all methods and therefore clearly evaluable. This is important for illustration of the obtained results. The second group of samples (D, E, F) includes arable lands, represented by typical soil types of the Czech Republic. Sampling was performed using a pedological sampling rod in May 2020.
Twenty subsamples (diagonally across the forest/field) were taken from each locality and composited. Material from the composited samples was used for subsequent processes. The depth of sampling depended on the thickness of the soil horizon in the forest. The depth of sampling was 0–0.2 m on the arable lands. Samples were dried at 60 °C to constant weight. Particles larger than 2 mm were removed from the samples. The remaining soil was homogenized and sieved through a 0.25 mm sieve. The analysis was made using the resulting fine-grained soil.
The total organic carbon content of the samples was determined using the equipment Primacs SLC Analyzer (SKALAR, Netherlands) with a dual-oven design, allowing separate analysis of total carbon (TC) and inoragnic carbon (IC). Total carbon is determined by catalytic oxidation of the sample at 1100 °C, converting the carbon present in the sample to CO2, which is detected by the nondispersive infrared detector. Inorganic carbon is determined by acidification of the sample in the IC reactor, which converts the inorganic carbon to CO2. TC−IC = TOC.
The procedure for performing other analyses is described below. Each analysis was repeated six times for each individual sample.

2.2. Classical Method (CM)

The amount of carbon that belongs to humic acids (CHA) and the amount of carbon that belongs to fulvic acids (CFA) can be determined by the classical method. The sum of these values (CHA+FA) indicates the amount of humic substances. The quality of humic substances is derived from the CHA:CFA or the quotient E4/6. It is also possible to determine the amount of non-humidified SOM which has been designated as primary soil organic matter (PSOM). The carbon belonging to this fraction (CPSOM) can be determined by subtracting CHA and CFA from the TOC value. The degree of stability of the SOM is determined by fractionation according to resistance to oxidizing [28].
The humic substance content and the CHA:CFA were determined as follows: The soil samples were extracted in a Soxhlet extractor with a mixture of ethanol and benzene to remove soil bitumens (5 h). After drying, five grams of treated soil were used for the analysis. This was poured over with 100 mL of a 0.1 mol/L mixture of sodium pyrophosphate and sodium hydroxide (44.6 g Na4P2O7·10 H2O + 4 g NaOH was dissolved in distilled water made up to 1000 mL). After 12 h of extraction in a rotary shaker, the mixture was filtered. In addition, 200 mL of the extract was pipetted and precipitated with concentrated H2SO4 (98.08 g/mol) until turbidity appeared. After mixing, the precipitated extract was placed in a thermostat at 65 °C for 30 min. It was subsequently stored at 20 °C for 12 h. After filtering the humic acids and washing them with 0.1 mol/L H2SO4, the coagulated humic acid was dissolved with 0.05 mol/L NaOH. The CHA content was determined in dissolved CHA gel. The CFA carbon was determined in the filtrate after filtration of the humic acids. Subtraction of these two values from the TOC in the sample revealed the CPSOM content.
The determination of the color quotient E4/6 was performed after the decalcination of the samples with 0.2 mol/L H2SO4. In addition, 30 mL of 0.1 mol/L NaOH was added to 2 g of the decalcinated sample and allowed to stand for 24 h. Then, 5 mL of saturated Na2SO4 solution was added and immediately centrifuged. The soil was washed with a 0.01 mol/L NaOH until the supernatant was clear. The solution was made up to 500 mL with distilled water. Humic acids were precipitated from a total volume of 0.1 mol/L H2SO4, centrifuged, and washed with distilled water. The humic acid precipitate was then dissolved in 50 mL of 0.02 mol/L NaHCO3. The solution was adjusted to contain 13.6 mg of C in 100 mL with distilled water. Solution extinction measurement (Spectrophotometer Perkin Elmer model Lambda 15 UV–Vis) was then carried out at two wavelengths, and the color quotient E4/6 was determined: E465/E619.
Determination of the degree of stability of SOM in CM was performed by fractionating into four groups according to carbon content after oxidation with K2Cr2O7 solution (Chan et al. method [28]). Only the H2SO4 concentration was adjusted. Treated samples were weighted into three flasks in the amount of 0.25 g. Another three flasks were free of samples (blank samples). Five mL of K2Cr2O7 solution was added to these six flasks. Five mL of concentrated H2SO4 (98.08 g/mol) diluted in distilled water was added to one flask with the sample and one without the sample in an acid:water ratio of 0.5:1. Five mL of concentrated H2SO4 diluted in water was added to the second flask with the sample and the second one without the sample in a ratio of 1:1. Five mL of concentrated H2SO4 diluted in water was added to a third flask with the sample and a third one without the sample in a ratio of 2:1. All flasks were placed into a thermostat at 125 °C for 5 min. After cooling, the amount of residual K2Cr2O7 was determined in all flasks by titration with (NH4)2Fe(SO4)2·6H2O solution (automatic titrator DL 50 Mettler-Toledo, Greifensee, Switzerland). The oxidized carbon content of the first flask after a subtraction blank test corresponds to the carbon of the labile organic substances, the oxidized carbon content of the second flask corresponds to the carbon of the semi-labile organic substances, and the oxidized carbon content of the third flask corresponds to the carbon of the fraction of semi-stable substances. The fraction of the stable substances was calculated by subtracting the carbon of the semi-stable substances from the TOC.

2.3. Modified Method (MM)

The PSOM fraction and the stable organic fractions (SOF; the carbon belonging to SOF is indicated as CSOF) were evaluated separately. This allowed us to determine not only their quantity but also their quality. The quality of PSOM was evaluated according to its oxidation speed constant k. The quality of SOF was expressed in terms of their CEC.
The principle of this method is described by Maroušek [31]. Therefore, a procedure will be described below simplified.

2.3.1. Quality of Primary Soil Organic Matter

It was necessary to determine the kinetics of the oxidation of soil carbon. The soil samples (5 flasks for one soil sample) were dispersed in a solution of 0.4 mol/L of K2Cr2O7 in 12 M of H2SO4. Their organic substances were oxidized at the temperature of 60 °C in a water bath. During this time, four partial samples were taken out gradually in 10 min, 20 min, 30 min, and 40 min. Then, the amount of oxidizable carbon (COX) was determined (automatic titrator DL 50 Mettler-Toledo, Greifensee, Switzerland) in the samples. From the measured values, we calculated the speed constant of oxidation (it was the 1st order reaction). Then, the temperature was raised to 90 °C and, after 30 min, COX was determined in the sample from the last flask and was designated as CPSOM.
Calculation of the speed constant k for oxidation of PSOM of a soil sample was the following: five sub-samples were collected at intervals of 10 to 40 min, and the COX, which may be designated as COX1 to COX4, was determined. These samples were determined during the oxidation at 60 °C. CPSOM value was known from the end of the determination at 90 °C (30 min). It follows the calculation of the differences of the detected values: CPSOM–COX1, CPSOM–COX2, CPSOM–COX3, CPSOM–COX4. The logarithms of these differences were determined. These logarithms were recorded in the right coordinate system on the y-axis versus time in minutes on the x-axis. Because tg α is the ratio between the opposite and adjacent leg of a right-angled triangle, whose hypotenuse is a recorded trend line, the calculation of the constant k is 2.303 times that ratio and has the dimension (min). For clarity, we presented the results in seconds. The higher the value, the more labile PSOM is and therefore of better quality in terms of its main function in the soil (energy source for soil organisms and nutrient source for crops).

2.3.2. Calculation of the Amounts of CPSOM and CSOF

The value CPSOM is a measure of the quantity of the PSOM. In given conditions, stable organic fractions (especially humic acids) do not take part in the oxidation in a solution of 0.4 mol/L of K2Cr2O7 in 12 M of H2SO4. If TOC in a soil sample is determined, the difference between TOC and CPSOM is the amount of CSOF.

2.3.3. Determination of Quality of Stable Organic Fraction

In the MM, we derive the quality of SOF from their CEC. The PSOM may also have a quite high sorption capacity, but its CEC compared to HA is negligible. The cation-exchange capacity of SOF can be determined by conductometric titration with a volumetric solution of Ba(OH)2. However, the CEC value of the mineral portion of the soil sample must be subtracted. First, the CEC of the soil sample is determined, then the SOM is oxidized with hydrogen peroxide (15%) in acetic acid. The difference in results after re-determination of the CEC corresponds to the CEC of the mineral portion of the soil sample.

2.4. Statistical Analysis

The data of tables were statistically evaluated by an analysis of variance (ANOVA), and the results were subsequently compared by a post-hoc Tukey HSD test (Statistica 14.0 software, TIBCO Software, Inc., Palo Alto, CA, USA, 2021). Linear regression was performed using the QC Expert 3.3 Pro (TriloByte Statistical Software Ltd., Pardubice, Czech Republic), and the NCSS 2019 Statistical Software (NCSS, LLC., Kaysville, UT, USA). The graphical outputs of linear regression were performed using the Statistica 14.0 software. Linear regression modelling used the regression triplet [33] and consisted of the following steps: (1) model design, (2) preliminary data analysis (multicollinearity, heteroskedasticity, autocorrelation and influence points), (3) estimation of parameters using the classical least squares method (LSM) and subsequent testing of the significance of parameters using the Student’s t-test, mean square error of prediction, and Akaike information criterion (AIC), (4) regression diagnostics—identification of influence points and verification of the LSM assumptions, and (5) construction of the refined model [33]. Statistical significance was tested at a significance level of p = 0.05. The methods of principal component analysis (PCA) and factor analysis [33] were used for multivariate statistical analysis of the measured data.

3. Results

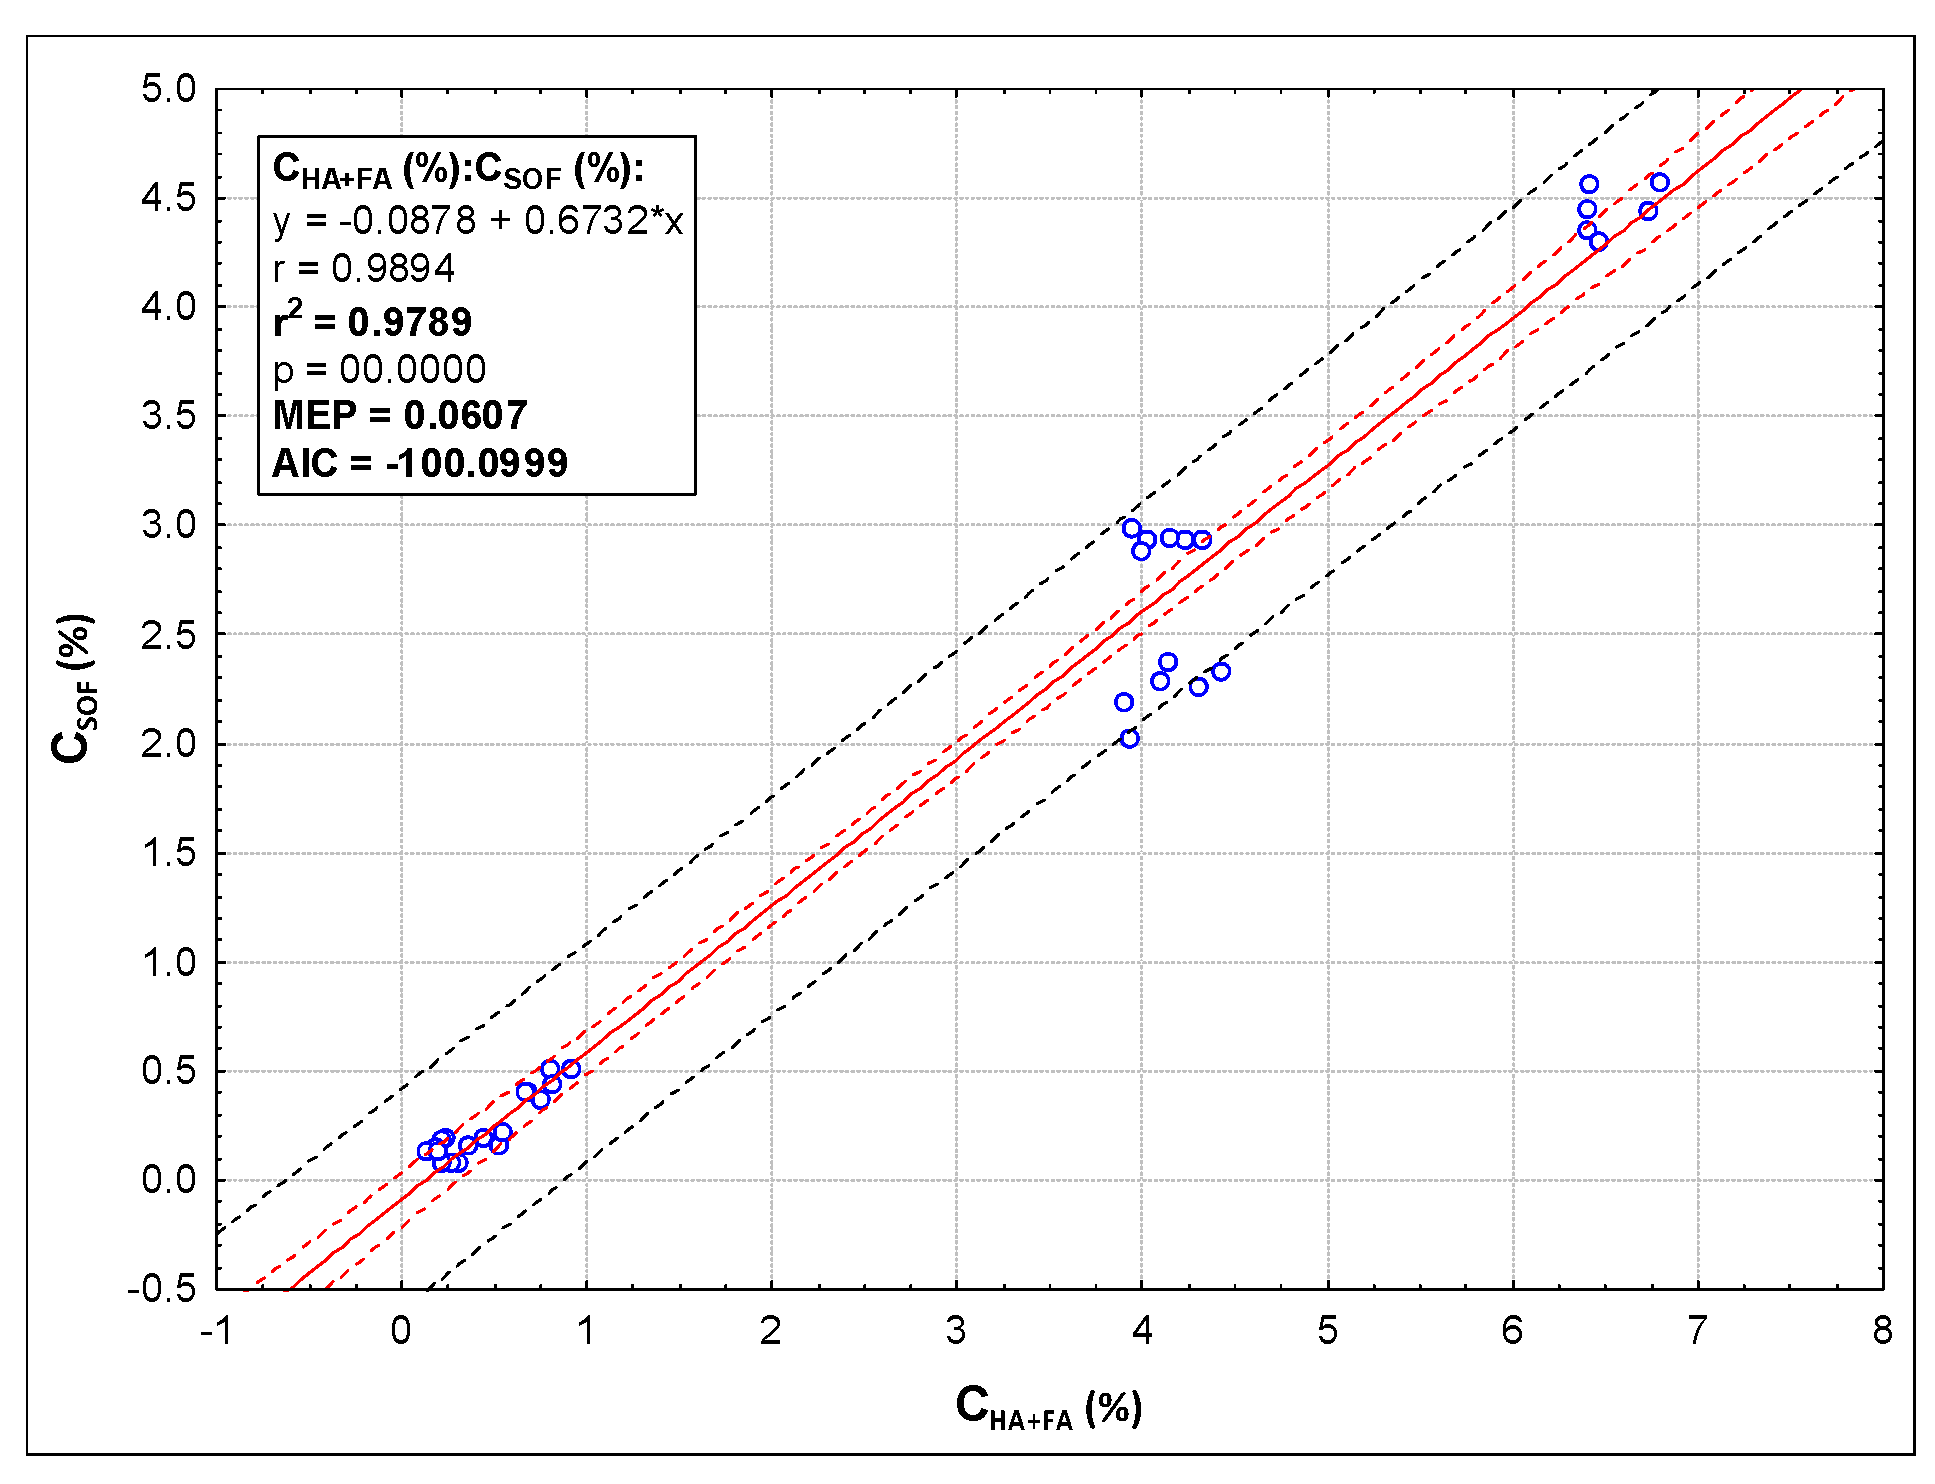
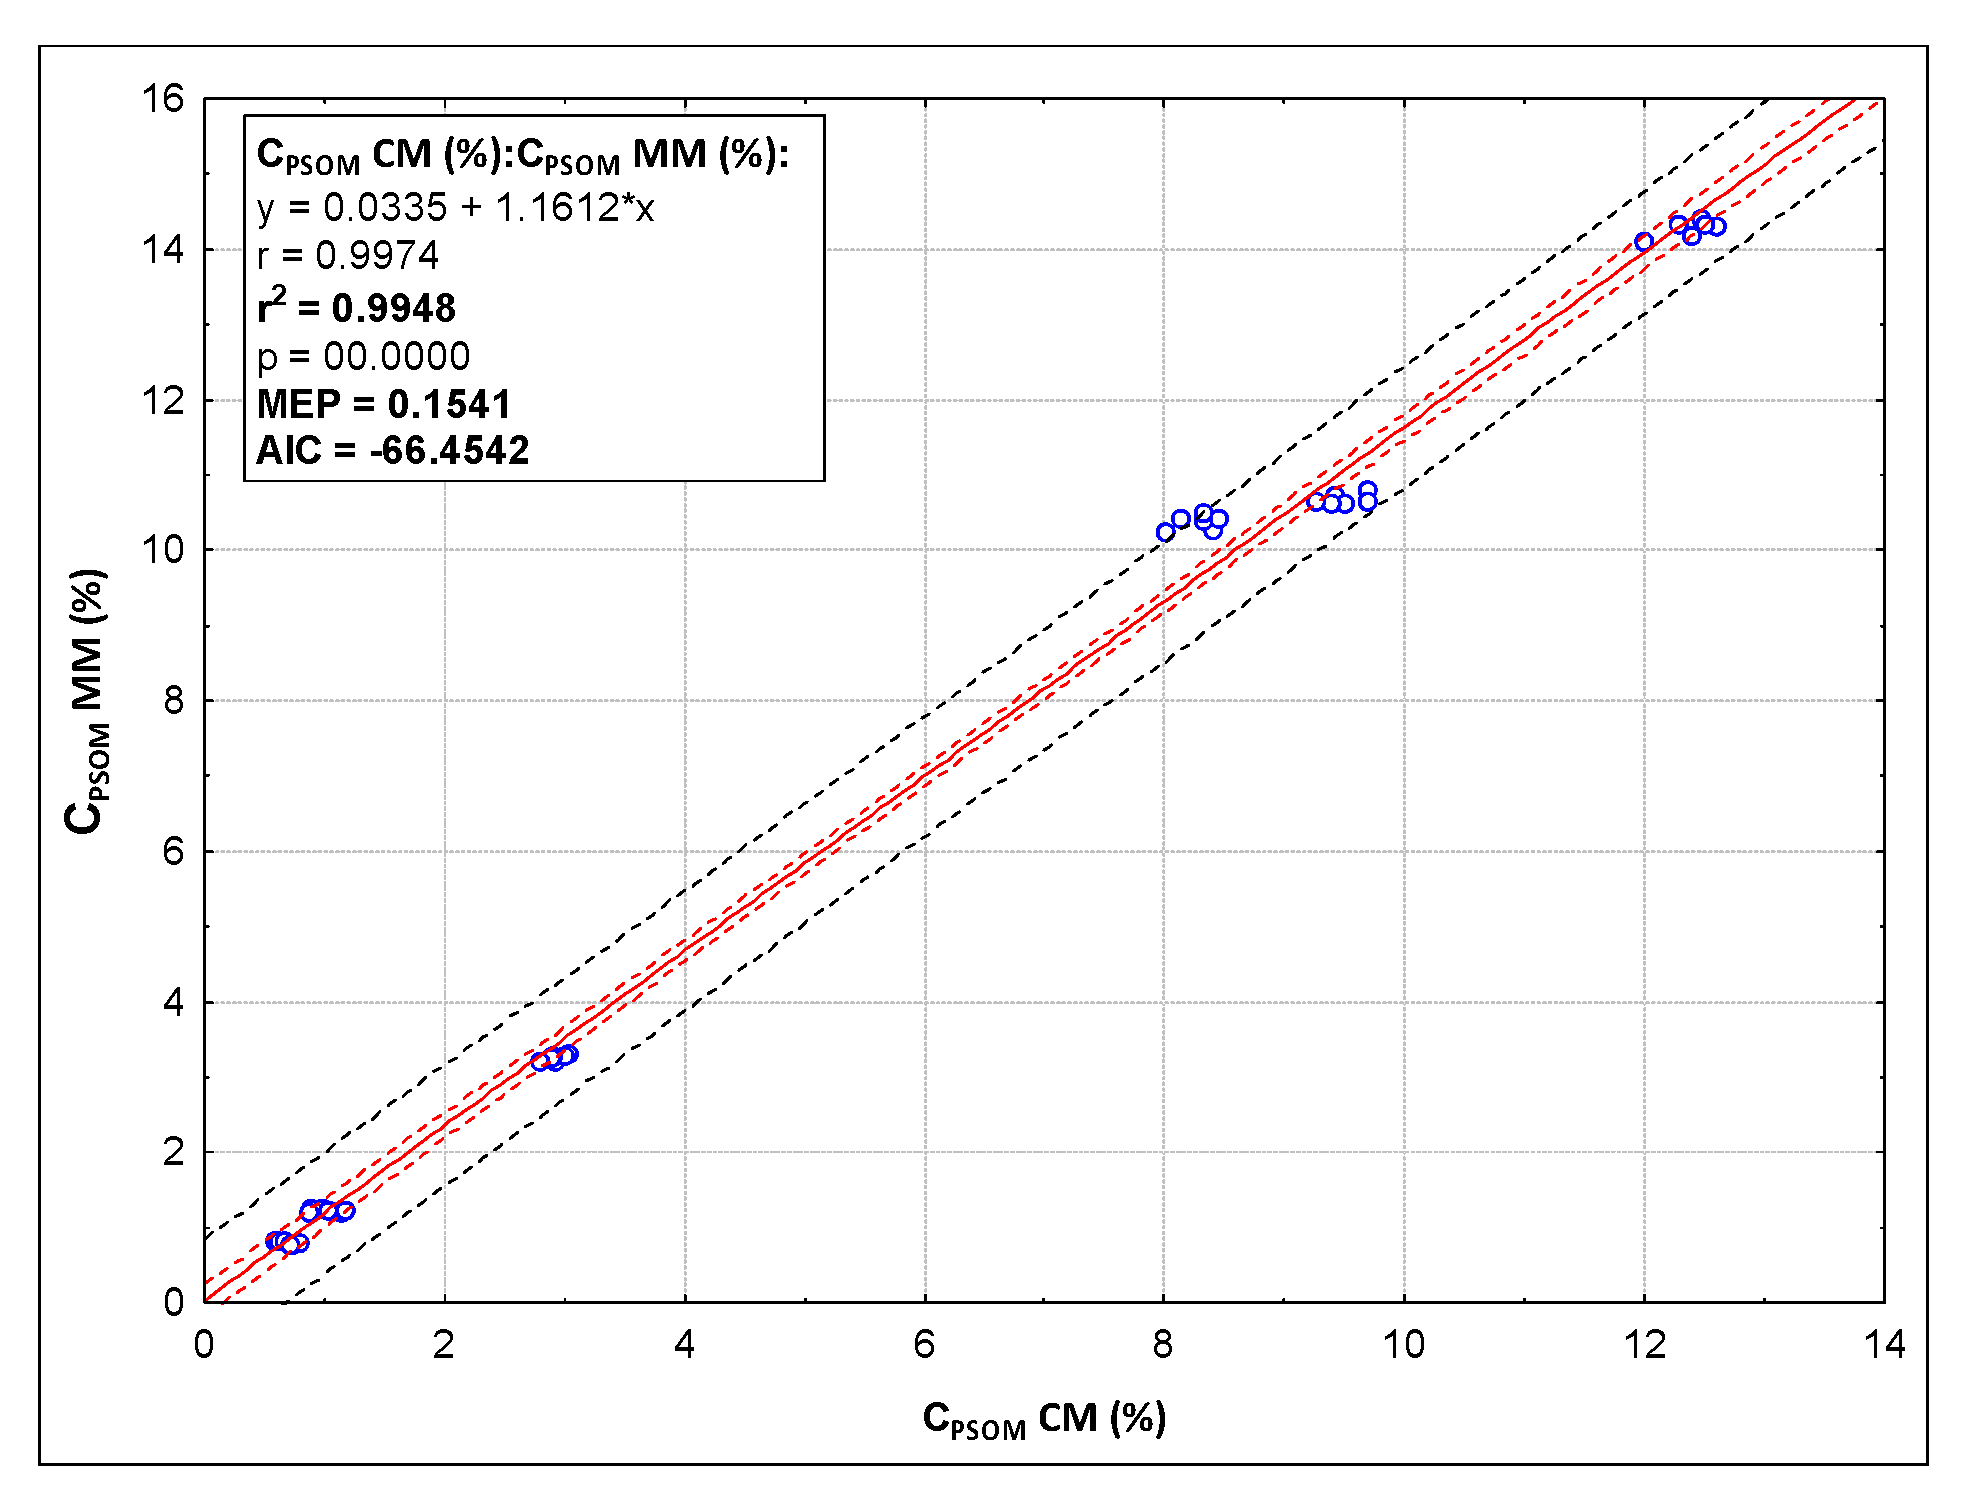
3.1. Fractionation According to the Carbon Content

It is apparent from Table 1 that the most of the TOC was in sample B (F(5, 30) = 120,100; p < 0.00001). Table 1 further shows the CPSOM and CHA+FA fraction content according to CM and the CPSOM and CSOF fraction content according to the MM. The amount of CSOF was statistically different in the majority of samples (D equal E) according to the MM (F(5, 30) = 3553.6; p < 0.00001). According to CM, CHA+FA was possible to differ for only four groups (F(5, 30) = 1926.9; p < 0.00001). According to both methods, the content of stable fractions was the lowest in samples D and E. It is evident that the higher CPSOM content was determined with the MM. However, it was found that the order of samples according to the values corresponded to CM.
A statistically significant linear regression dependence between CPSOM contents determined by CM and MM was demonstrated (data from all six localities). The equation of the straight line relating CPSOM MM and CPSOM CM is estimated as: CPSOM MM = (0.0335) + (1.1612) CPSOM CM using the 36 observations in this dataset. The statistical characteristics of the regression are as follows: R = 0.9974, R2 = 0.9948, MEP = 0.1541, AIC = −66.4542. The model is significant according to the Fisher–Snedecor model significance test (F = 6516.7399, quantile F = 4.1300, p = 1.9601 × 10−40). The model shows multicollinearity (MT) according to Scott’s criterion of multicollinearity (SC = 0.3333, MT is at the lower end of the test MT < 0.33, the model is not significantly affected by multicollinearity, and therefore there is no need to modify the model [33]). The assumption of homoscedasticity for residuals was validated (Cook–Weisberg test). Residuals do not have a normal distribution (Jarque–Bera Test). Residuals are positively autocorrelated (Durbin–Watson test) (Figure 1). The y-intercept, the estimated value of CPSOM MM when CPSOM CM is zero, is 0.0335 with a standard error of 0.1054. The slope, the estimated change in CPSOM MM per unit change in CPSOM CM, is 1.1612 with a standard error of 0.0144. The estimated slope is 1.1612. The lower limit of the 95% confidence interval for the slope is 1.1320, and the upper limit is 1.1905. The estimated intercept is 0.0335. The lower limit of the 95% confidence interval for the intercept is −0.1806, and the upper limit is 0.2477.
Other statistically significant linear regression is the dependence between CHA+FA and CSOF content (data from all six localities). The equation of the straight line relating CSOF and CHA+FA is estimated as: CSOF = (−0.0878) + (0.6732) CHA+FA using the 36 observations in this dataset. The statistical characteristics of the regression are as follows: R = 0.9894, R2 = 0.9789, MEP = 0.0607, AIC = −100.0999. The model is significant according to the Fisher–Snedecor model significance test (F = 1579.8090, quantile F = 4.1300, p = 4.3553 × 10⁻³⁰). The model shows multicollinearity (MT) according to Scott’s criterion of multicollinearity (SC = 0.3327, MT is at the lower end of the test MT < 0.33, the model is not significantly affected by multicollinearity, and, therefore, there is no need to modify the model [33]). The assumption of homoscedasticity for residuals was validated (Cook–Weisberg test). Residuals have a normal distribution (Jarque–Bera Test). Residuals are positively autocorrelated (Durbin–Watson test) (Figure 2). The y-intercept, the estimated value of CSOF when CHA+FA is zero, is −0.0878 with a standard error of 0.0609. The slope, the estimated change in CSOF per unit change in CHA+FA, is 0.6732 with a standard error of 0.0169. The estimated slope is 0.6732. The lower limit of the 95% confidence interval for the slope is 0.6387, and the upper limit is 0.7076. The estimated intercept is −0.0878. The lower limit of the 95% confidence interval for the intercept is −0.2116, and the upper limit is 0.0361.
The developed linear regression models (for CPSOM and CSOF parameters) show (R2 = 0.9948 and 0.978, respectively) that the modified method is consistent with the classical method.
Table 2 shows the results of SOM fractionation according to Chan et al. [28]. This method makes it possible to compare the percentage carbon content which belongs to the individual fractions according to oxidation resistance. It is then possible to compare the amount of carbon in the individual fractions and compare the individual samples with each other too. Some differences between the samples can be observed, so this method is useful for comparing samples. If we had evaluated the samples only according to the amount of labile organic matter, Fraction 1 would have been the most valuable. However, this is a very simplistic and, therefore, incorrect view. Thus, the interpretation and significance of the results for evaluating the quantity and quality of SOM are questionable.

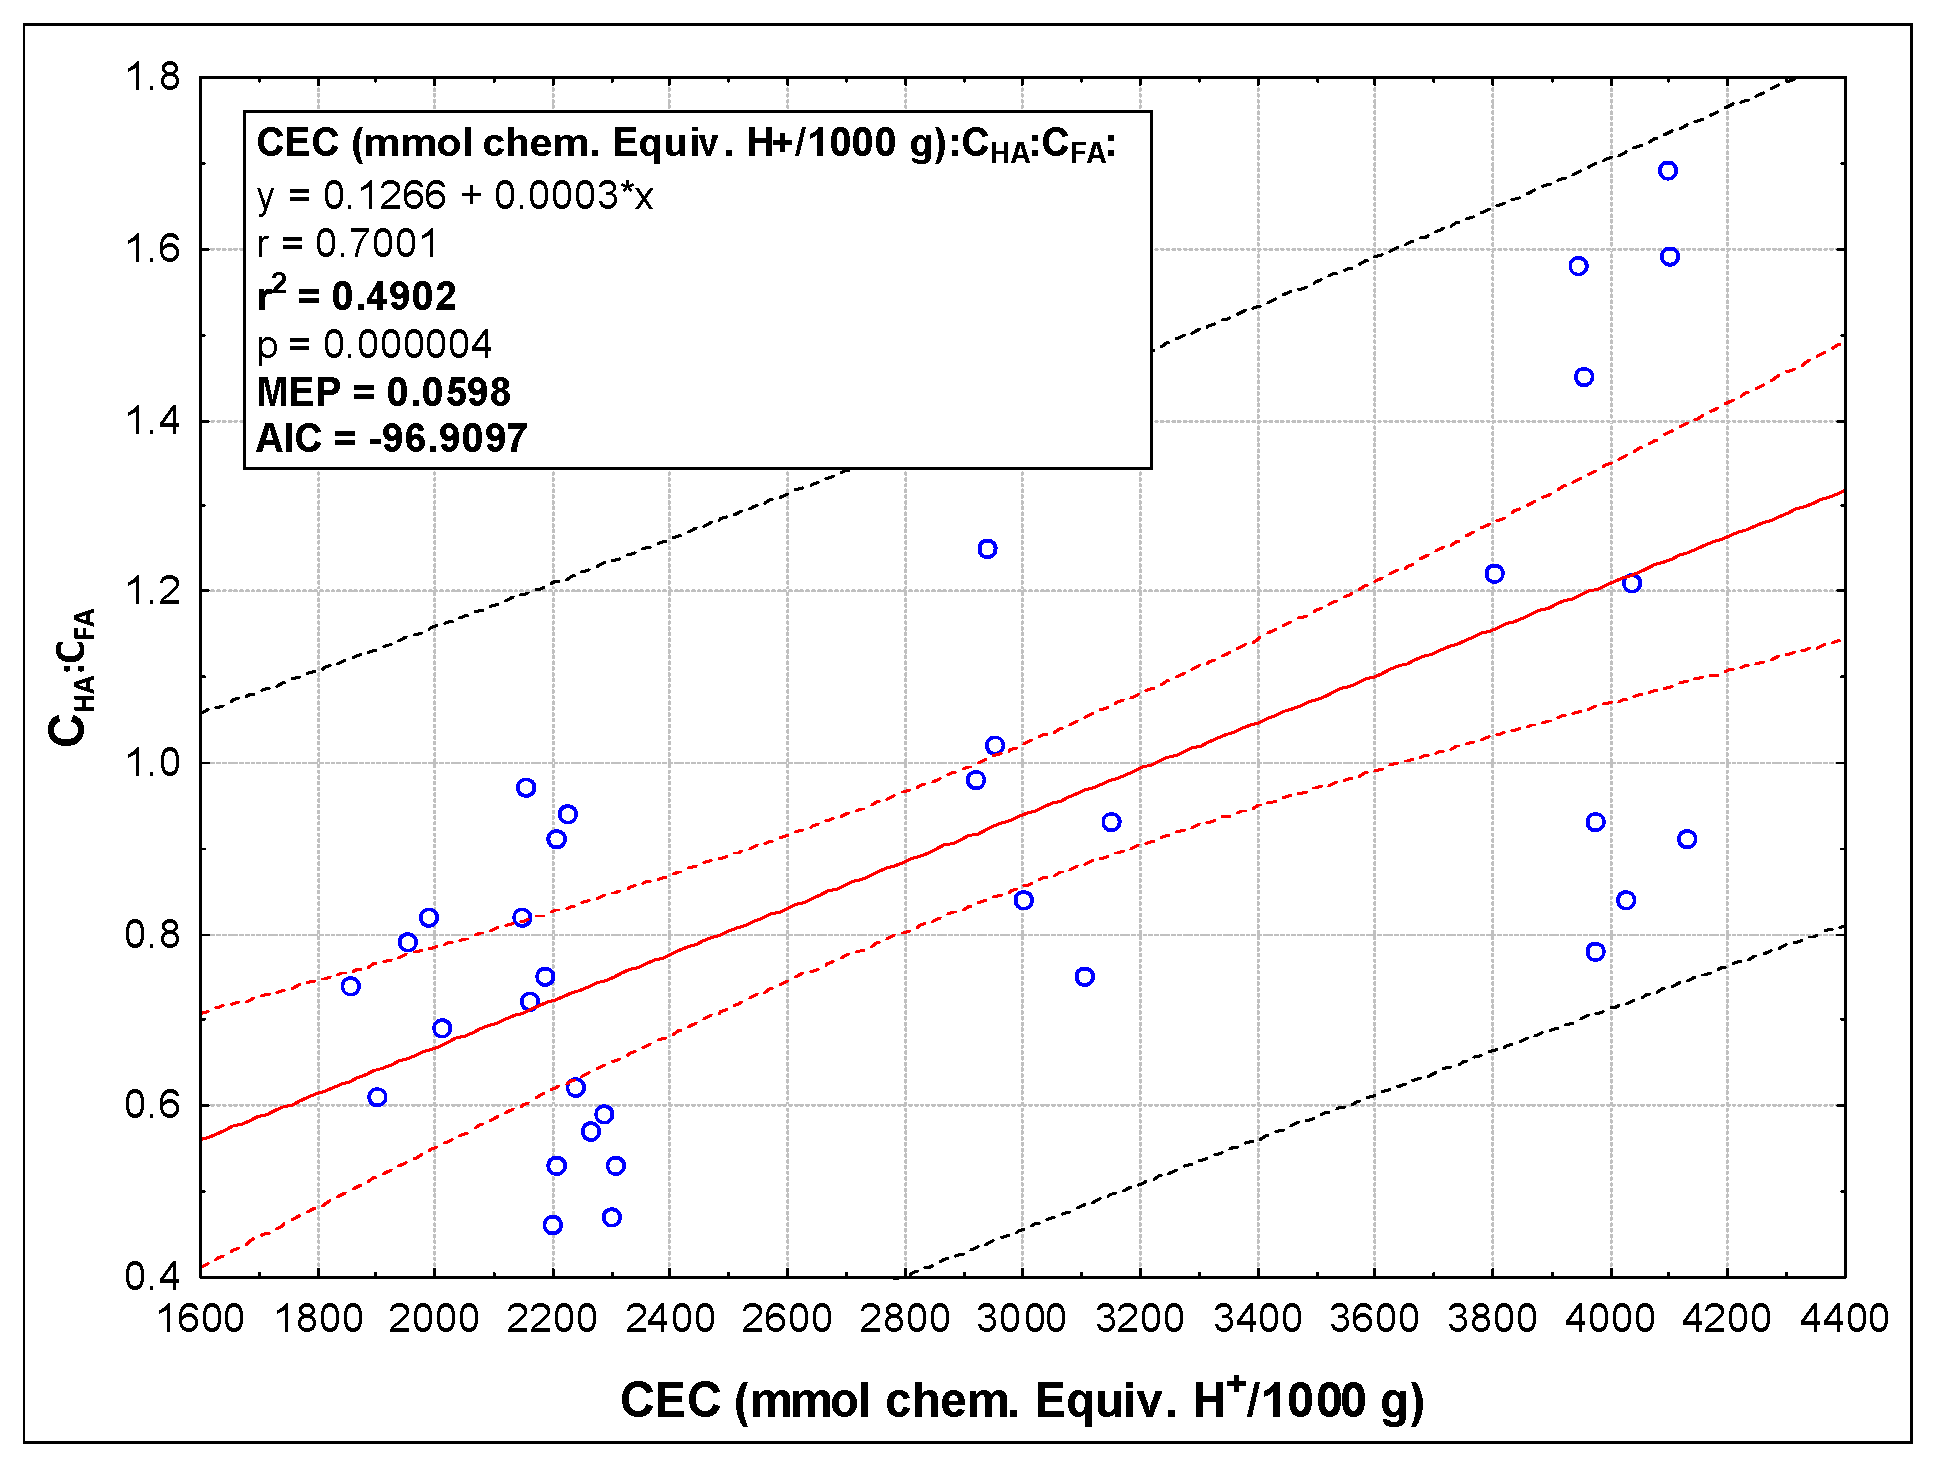
3.2. Evaluation of Soil Organic Matter Quality

The results obtained by evaluating SOM quality according to the MM are shown in Table 3. The SOF quality expressed in CEC value showed significant differences between some samples (F(5, 30) = 608.62; p < 0.00001). It is possible to distinguish four groups according to quality. The highest quality of this fraction was found in samples C and F. In addition, the evaluation of the quality of the PSOM fraction expressed by the constant k showed significant differences between the evaluated samples (F(5, 30) = 776.67; p < 0.00001). It is possible to distinguish even five qualitative groups.
Evaluation according to CM by the CHA:CFA did not prove as sensitive as the SOF quality evaluation according to their CEC. Evaluation of the quotient E4/6 revealed completely different results. According to E4/6, the humus quality in samples D and F was the best, while it appeared partly different according to both CM and the MM. The results of the evaluation of the quotient E4/6 seem confusing.
A statistically significant linear regression dependence between CEC and CHA:CFA was demonstrated (data from all six localities). The equation of the straight line relating CHA:CFA and CEC is estimated as: CHA:CFA = (0.1266) + (0.0003) CEC using the 36 observations in this dataset. The statistical characteristics of the regression are as follows: R = 0.7001, R2 = 0.4901, MEP = 0.0598, AIC = −96.9097. The model is significant according to the Fisher–Snedecor model significance test (F = 30.7672, quantile F = 4.1490, p = 4.0459 × 10⁻⁶). The model is correct according to Scott’s criterion of multicollinearity (SC = 0.3223). The residuals passed tests for heteroskedasticity (Cook–Weisberg test). Residuals have a normal distribution (Jarque–Bera Test). Residuals are positively autocorrelated (Durbin–Watson test) (Figure 3). The y-intercept, the estimated value of CHA:CFA when CEC is zero, is 0.1266 with a standard error of 0.1446. The slope, the estimated change in CHA:CFA per unit change in CEC, is 0.0003 with a standard error of 0.0000. The estimated slope is 0.0003. The lower limit of the 95% confidence interval for the slope is 0.0002 and the upper limit is 0.0004. The estimated intercept is 0.1266. The lower limit of the 95% confidence interval for the intercept is −0.1678 and the upper limit is 0.4211.

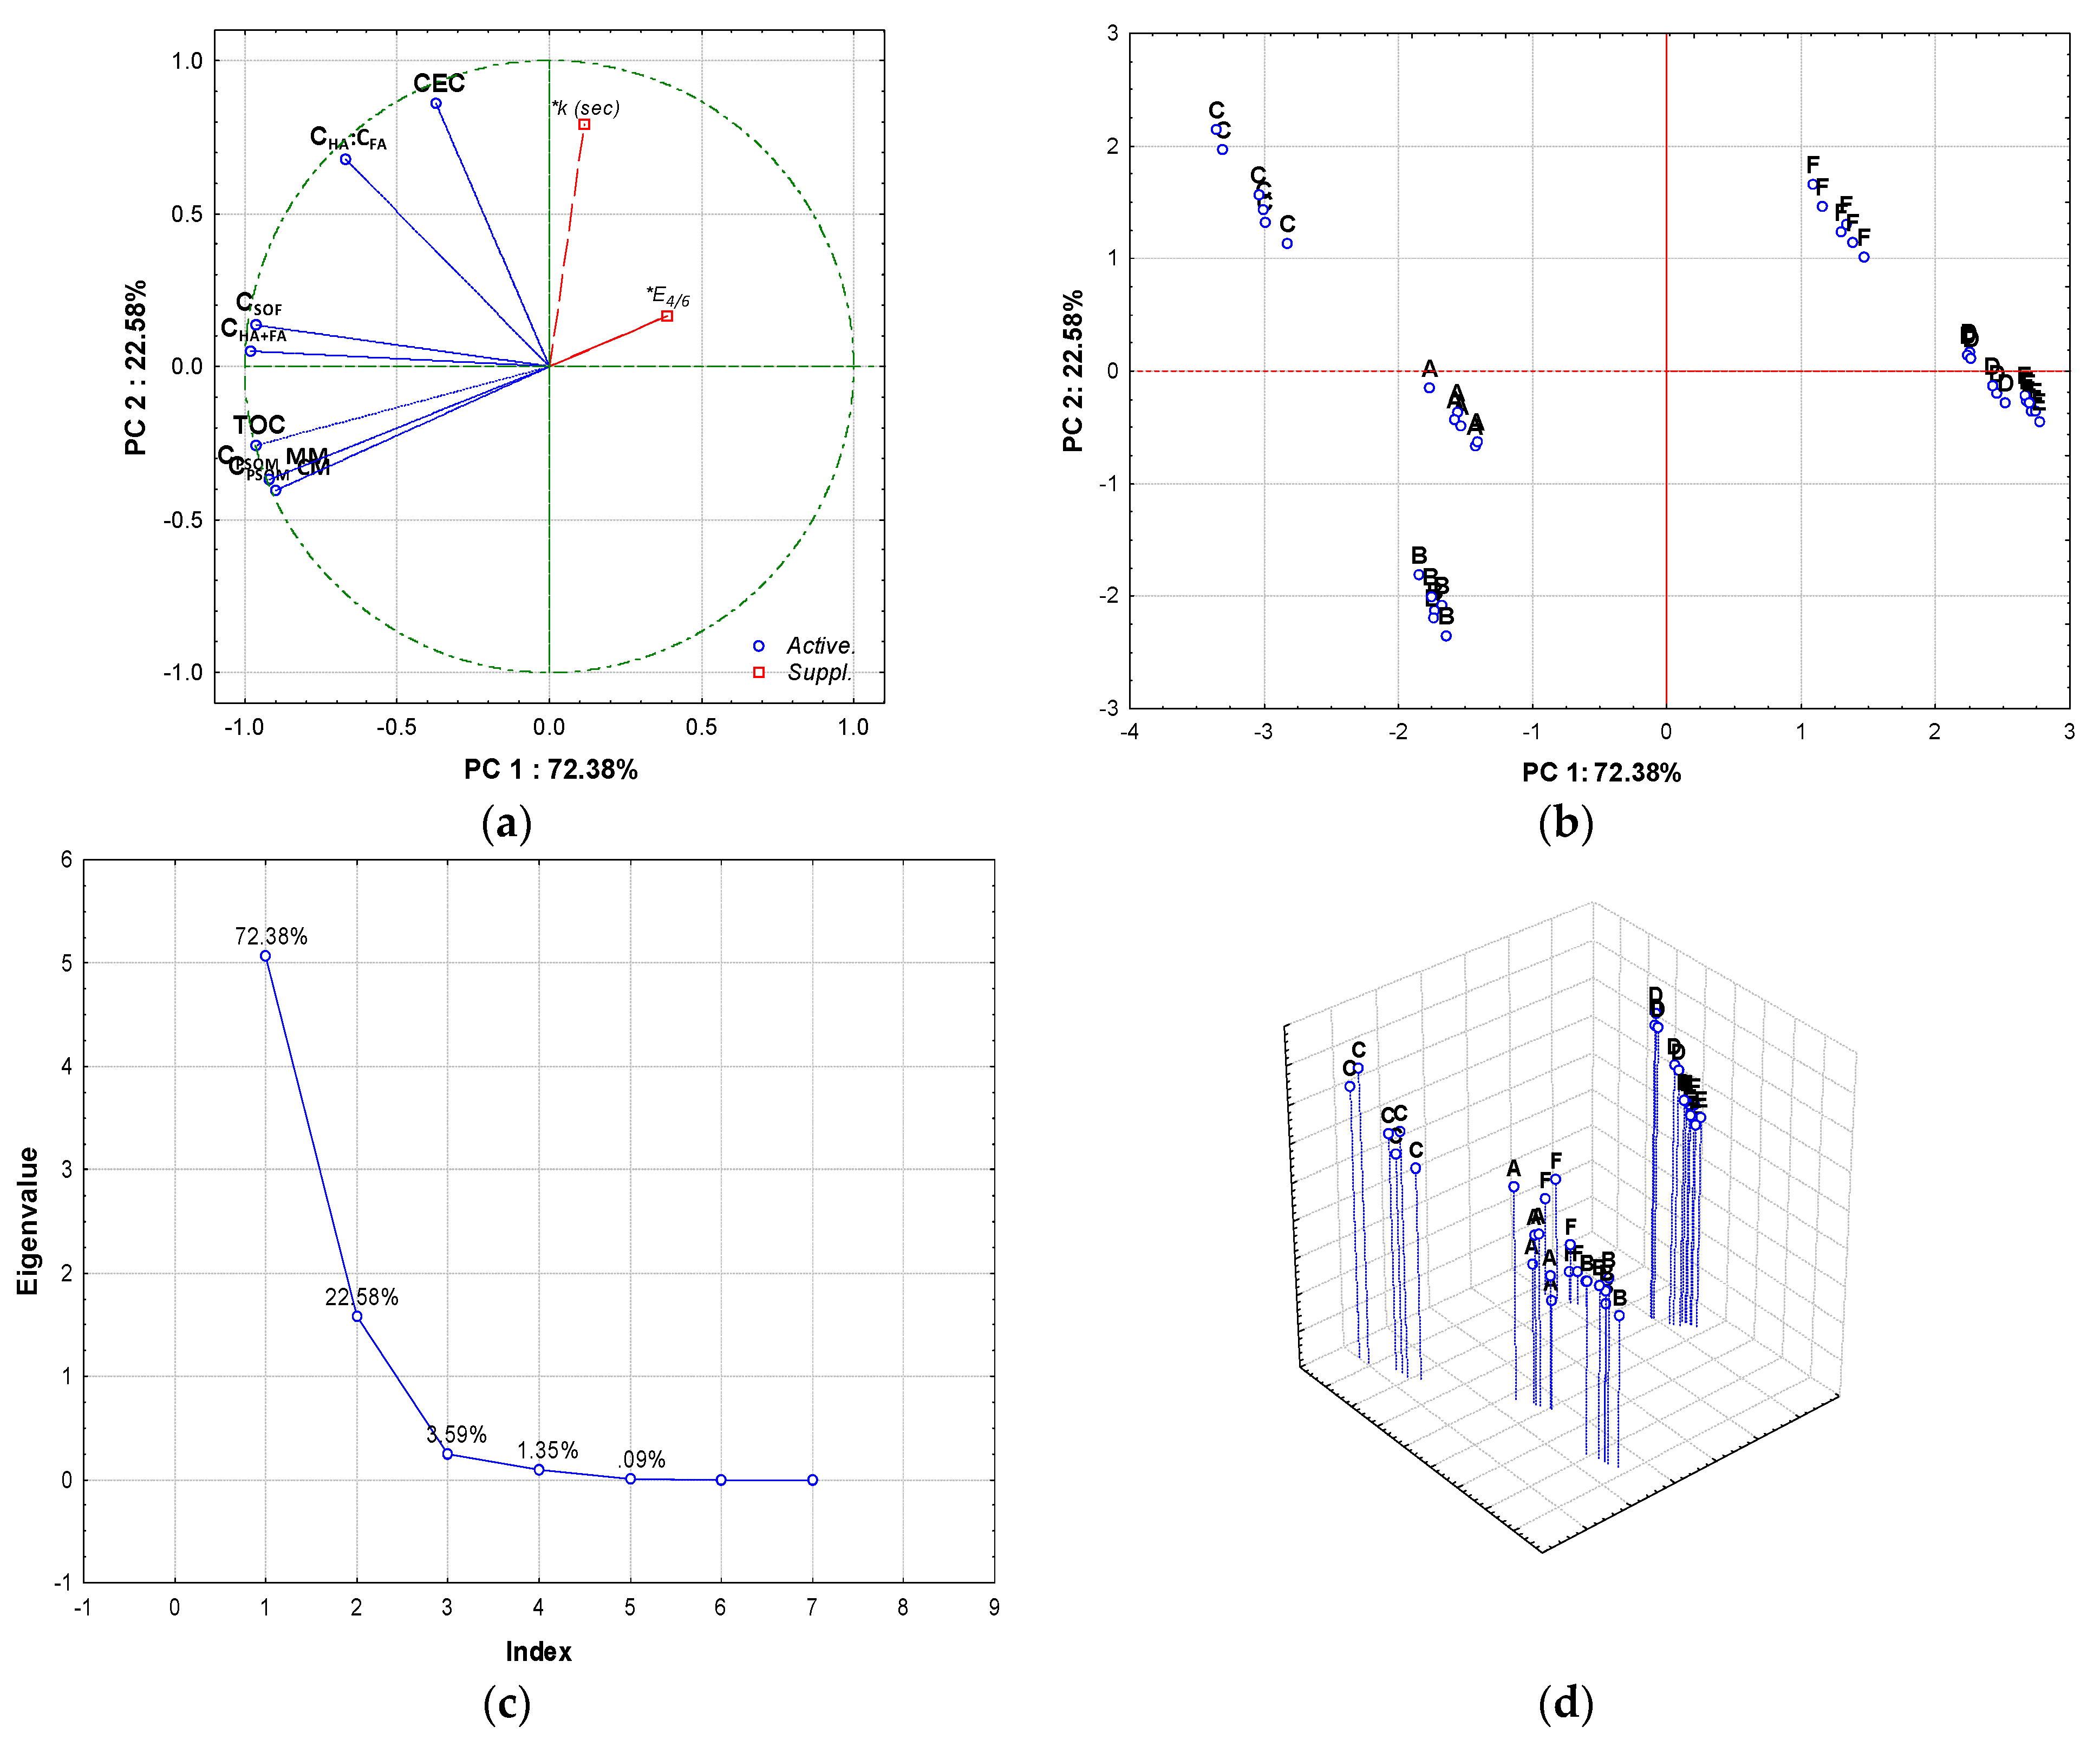
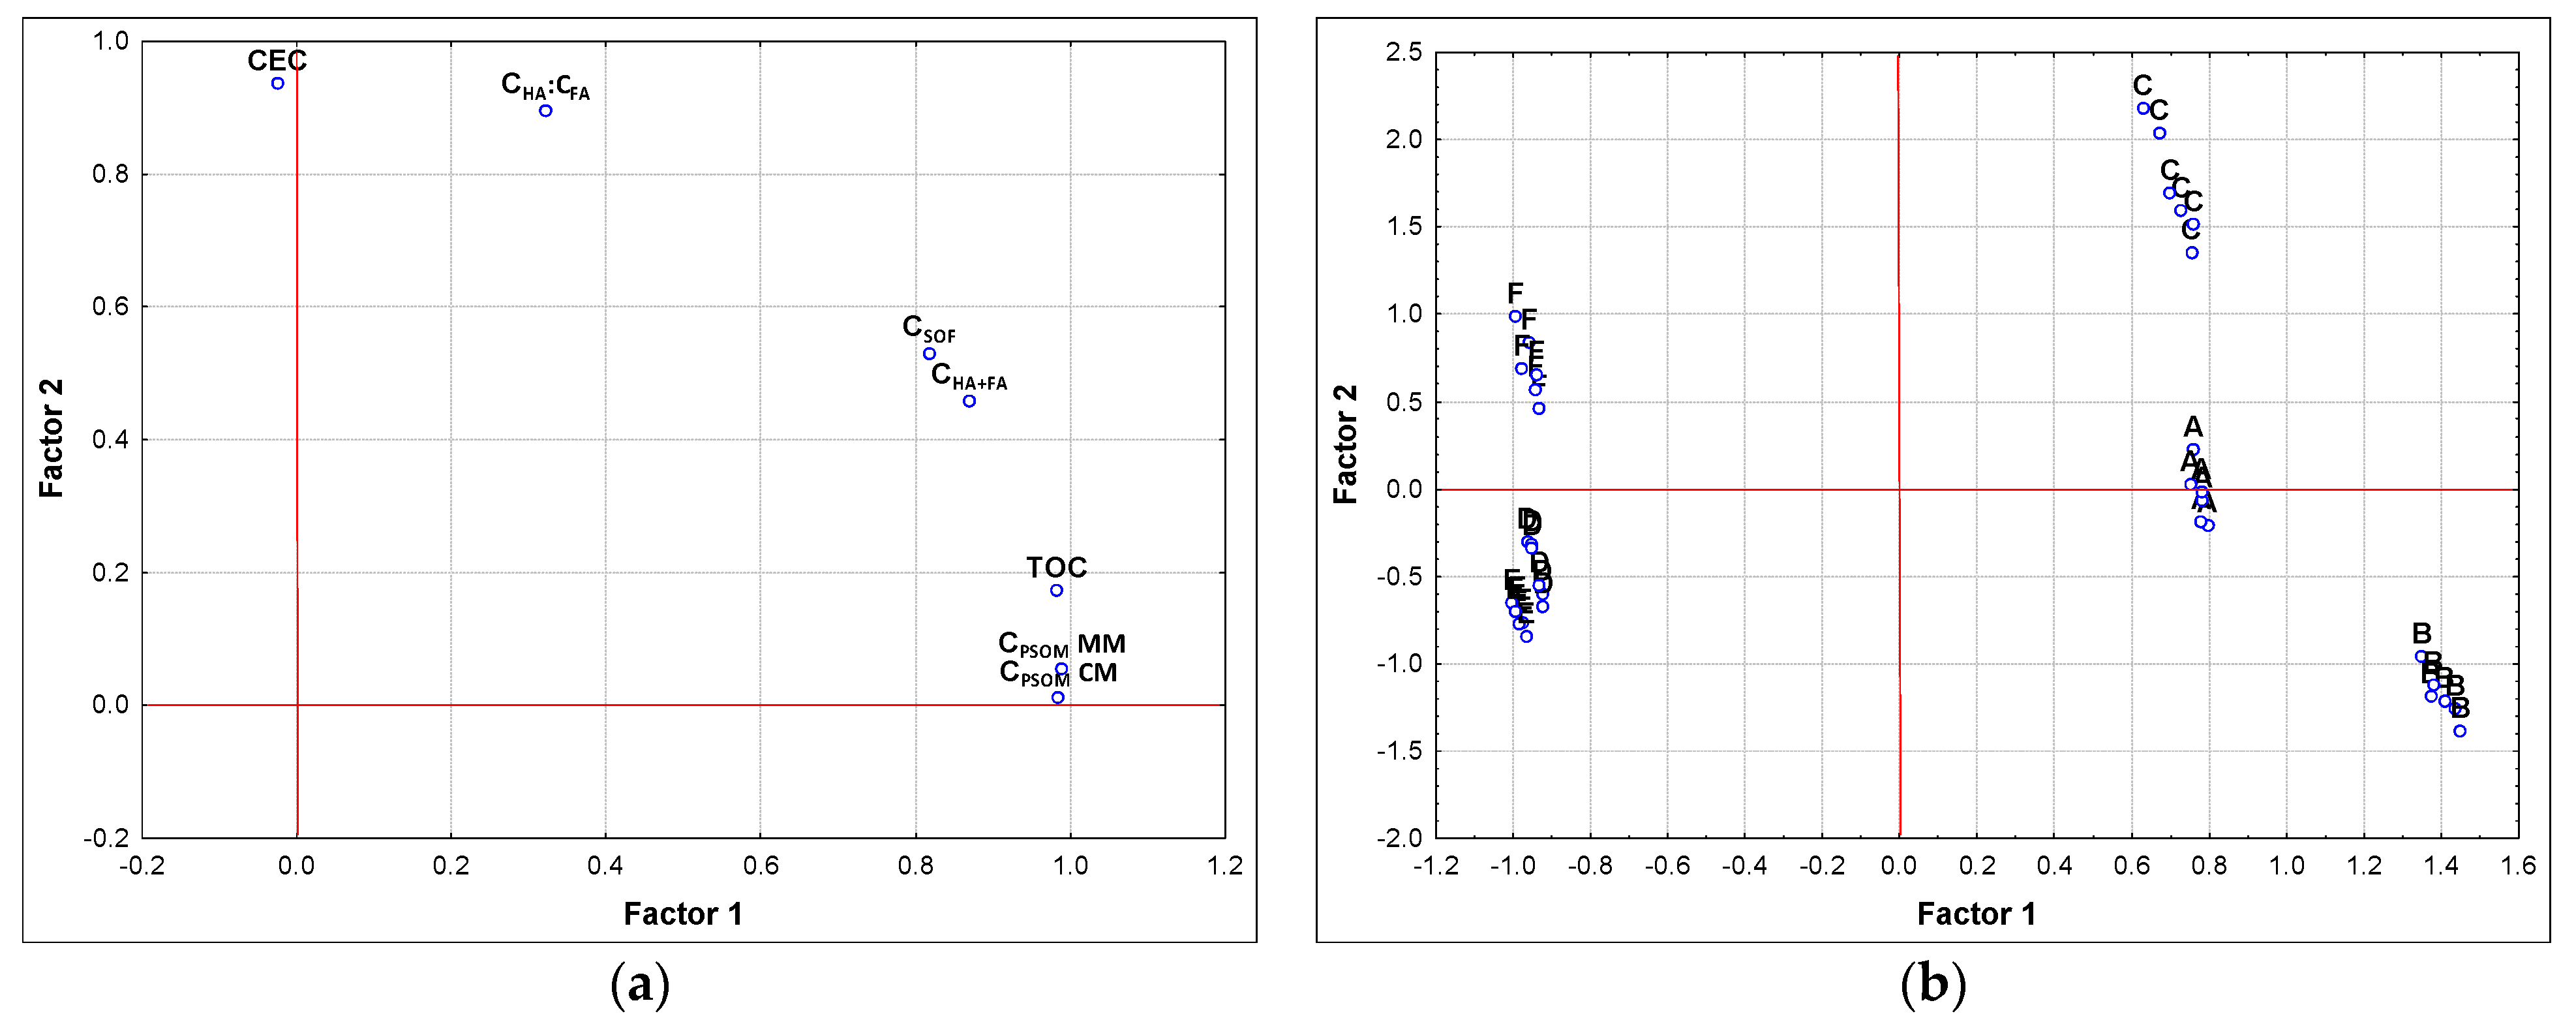
3.3. Evaluation of Results from the Point of View Principal Component Analysis and Factor Analysis

On the graph of component weights PC1, PC2, and PC3 (Figure 4), the first two axes are significant, which together exhaust about 95% of the variability. The PC1 axis in the PC1 × PC2 graph unambiguously characterizes CHA+FA, CSOF, which go directly along this axis and are correlated with it at a level exceeding −0.96 and −0.98 (high negative correlation) as well as TOC (r = −0.96). Furthermore, on the PC1 axis, there is a very significant correlation between CPSOM MM and CPSOM CM (r = −0.89 and −0.91). On the PC2 axis, there is a significant correlation between CEC and CHA:CFA (r = 0.85 and 0.67). In the scatterplot of the component score along the PC1 axis, sampling sites according to CHA+FA, CSOF, TOC, and also CPSOM MM and CPSOM CM are clearly located. The PCA divided the sites of interest into two distinct clusters (arable land and forest land).
Factor analysis (Figure 5) confirmed the results of PCA and differentiated similarly to the PCA method of the group of localities (see scattering diagrams of component scores).
Factor weights explain the correlations between factors and features (Table 4). They represent essential information on which the interpretation of factors is based. Factor 1 describes the properties in terms of CPSOM MM, CPSOM CM, TOC, CHA+FA, and CSOF. Factor 2 clearly describes CEC and CHA:CFA. Communality represents the proportion of character variability expressed by the factors in question. It is similar to the value of R2, which we obtain when the original characters are explained by regression by selected factors [33]. From the contribution of Factor 1 and Factor 2 to communality, it is clear how communality acquires high values (more than 0.9). Thus, the features of most values (TOC, CSOF, CHA+FA, CPSOM CM and CPSOM MM) are very well considered by the proposed factor model. For CEC and CHA:CFA parameters, communality is at a lower level (0.5–0.7).

4. Discussion

The CM is based on the isolation of humic substances by alkaline extraction of the soil sample and the precipitation of humic acids from the extract in an acidic environment. Therefore, they have some weaknesses. These include the impossibility of capturing all the extracted carbon or the blurred boundary between humidified and non-humidified organic material [34,35,36,37]. The Humification model on which the procedures in CM are based is therefore sometimes questioned [34,38]. Classical humification has been supplemented with selective preservation [39] and a progressive decomposition model (so-called “degradation concept”) [36]. Lehmann and Kleber [34] consider SOM as a continuum of progressively decomposing organic compounds and question the high resistance of humic acids to decomposition. The “Soil continuum model” focuses on the ability of decomposer organisms to access SOM and on the protection of organic matter from decomposition provided by soil minerals. Except for mineralization and humification, the stabilization of SOM must also be respected [40]. For these reasons, the procedures used in CM as comparative should only be considered roughly indicative.
The MM is not based on the alkaline extraction of organic matter from the soil sample. However, results may also be affected by specific problems. Chemical oxidation is only the simulation of the biodegradation process in natural conditions. Another disadvantage is that, for example, lignins belong to a stable fraction of SOM according to this method. However, they can be transformed by microorganisms in the soil [41]. Thus, the division into labile and stable organic fractions in the soil is not flawless. Only black carbon fraction, in particular, is difficult to decompose. Therefore, it is generally considered to be a stable fraction [42,43]. Another organic matter is more or less degradable. Thus, in MM, the boundary between labile and stable organic fractions was clearly defined. The part of SOM which resists oxidation in defined conditions (0.4 mol/L solution of K2Cr2O7 in 12 M of H2SO4 at 90 °C for 30 min) is considered stable.
During the PSOM quality assessment, we encountered specific procedural obstacles. It was problematic to maintain a constant temperature of 100 °C, which Maroušek et al. [31] use in their method. Therefore, we tried to optimize the method. Repeated empirical experiments have led us to conclude that a constant temperature is the best maintained in a water bath (compared to a laboratory thermostat or thermoblock). However, due to the boiling point of the water, we decreased the temperature to 90 °C. We also changed the time intervals during which SOM is oxidized. We used 40 min for the fourth flask (instead of 45 min). Thus, all intervals of oxidation are the same in terms of time. These measures can logically lead to less organic carbon being determined in the CPSOM fraction than at the original conditions (higher temperature and longer oxidation time).
Considering the quality of PSOM, it is the most stable in sample C. In terms of plant nutrition, this is not a positive phenomenon. This component of SOM should be a source of energy for soil edaphon and reserve plant nutrients. Thus, the higher lability of PSOM is particularly appreciated [20,22,44]. On the other hand, it should be considered that, at the appropriate temperature and humidity conditions, microbial biomass can rapidly multiply, resulting in rapid mineralization of organic matter and the most labile fractions being consumed rapidly [45]. The amount of non-humified soil fraction is always proportional to microbial biomass in the soil [46].
The MM reports that the CSOF content is substantially lower than CM for all samples (CM expressed the amount of carbon attributable to humic substances CHA+CFA). This is because CM captures fulvic acids in addition to humic acids in this fraction. In contrast, in the MM, the more labile fulvic acids are oxidized, and their carbon then enriches the CPSOM fraction. The stability of humic acids cannot be doubted. Humic acids are incomparably more resistant to decomposition than fulvic acids [47]. Thus, labile fulvic acids do not belong to the stable soil organic fraction with certainty.
According to the statistical evaluation, the determination of the CEC of the SOF fraction cannot be considered an equivalent substitute for the CHA:CFA. Nevertheless, CEC is a good indicator of soil quality [48,49]. This fact was more less confirmed in this research. Moral and Rebollo [50] deem the CEC a sensitive indicator for determining the soil’s nutrient holding capacity, fertility, and long-term productivity. This parameter can be an additional characteristic to evaluate SOM quality in various ecosystems (fields, forests, etc.). Moreover, the determination of the CEC of the SOF fraction is much less laborious and less time-consuming than determining the CHA:CFA.
The proposed MM is not intended for deep scientific investigation. It should give information to practical farmers about the condition of SOM. Information about SOM conditions will help farmers decide whether to apply more or less rapidly mineralizing fertilizers (such as slurry or green manure) or fertilizers with more stabilized organic matter, such as manure, compost or even digestate from biogas station. Thus, the farmers who have detailed information on SOM quality can make the right decisions about applying various agrotechnical measures to increase the microbial activity of the soil, which is crucial for improving soil fertility.
PSOM quality evaluation by determining the speed constant k of organic matter oxidation can also be used for other organic materials, such as biochar, organic waste, and compost. The classical method does not allow these data to be determined.

5. Conclusions

Six soil samples were analyzed by a Modified method, which is cheap and instrumentally undemanding. The samples were also analyzed in parallel by the currently used procedures based on the already obsolete humification model. The results were compared with each other. It was found that very similar results were achieved in the evaluation of SOM content. The performed principal component analysis and factor analysis confirm the results of linear regression models for parameters (CPSOM and CSOF). It was found that the newly used working procedures are consistent with the original methods of fractionation of humic substances. The analysis of samples thus confirmed that obsolete lengthy methods of assessing the quantity of SOM could be replaced by the Modified method. Multi-dimensional statistical methods have shown that the newly determined parameter, the CEC of the stable organic fraction, cannot fully replace the classic CHA:CFA parameter due to low communality. Therefore, we can only use it as an additional parameter to evaluate SOM quality. However, compared with classical procedures, the modified method enables assessing the quality of PSOM through the speed constant k of its oxidation. This part of SOM is essential for soil microorganisms, and it serves as a source of plant nutrients. Thus, information about its quality is very valuable. The obtained results give clear information on the state of SOM. By ingeniously applying suitable organic fertilizers, the farmers can improve soil properties, including soil fertility. It is planned to continue similar research, assessing more soil species and types to deepen the knowledge of the benefits of the new method.

Author Contributions

Conceptualization, M.K., L.K., and R.V.; Data curation, P.M., P.K., Y.T.M., M.G., and L.M.; Formal analysis, P.M., Y.T.M., and M.G.; Investigation, R.V.; Methodology, M.K. and L.K.; Project administration, P.K. and M.D.; Supervision, M.D.; Writing—original draft, M.K. and L.K.; Writing—review and editing, M.K., K.P., and L.M. All authors have read and agreed to the published version of the manuscript.

Funding

This work was supported by the University of South Bohemia in České Budějovice (No. GAJU 059/2019/Z) and the research plan of the Ministry of Agriculture of the Czech Republic (No. RO0418).

Institutional Review Board Statement

Not applicable.

Informed Consent Statement

Not applicable.

Data Availability Statement

Not applicable.

Conflicts of Interest

The authors declare no conflict of interest.

References

  1. Gregorich, E.G.; Carter, M.R.; Angers, D.A.; Monreal, C.; Ellert, B. Towards a minimum data set to assess soil organic matter quality in agricultural soils. Can. J. Soil Sci. 1994, 74, 367–385. [Google Scholar] [CrossRef] [Green Version]
  2. Maroušek, J.; Strunecký, O.; Stehel, V. Biochar farming: Defining economically perspective applications. Clean Technol. Environ. Policy 2019, 21, 1389–1395. [Google Scholar] [CrossRef]
  3. Osman, K.T. Soil Degradation, Conservation, and Remediation; Springer: Dordrecht, The Netherlands, 2014; ISBN 9789400775909. [Google Scholar]
  4. Lal, R. Soil carbon sequestration and aggregation by cover cropping. J. Soil Water Conserv. 2015, 70, 329–339. [Google Scholar] [CrossRef]
  5. Stehel, V.; Vochozka, M.; Maroušková, A.; Šál, J.; Kolář, L. Charred fermentation residues accelerate methanogenesis and sorb air pollutants. Energy Sources Part A Recover. Util. Environ. Eff. 2018, 40, 301–305. [Google Scholar] [CrossRef]
  6. Nachshon, U. Soil degradation processes: It’s time to take our head out of the sand. Geosciences 2021, 11, 2. [Google Scholar] [CrossRef]
  7. Darwish, O.H.; Persaud, N.; Martens, D.C. Effect of long-term application of animal manure on physical properties of three soils. Plant Soil 1995, 176, 289–295. [Google Scholar] [CrossRef]
  8. Zhang, G.X.; Shen, L.X.; Guo, Y.M. Effect of soil structure on water infiltration under moistube irrigation. J. Irrig. Drain. Eng. 2016, 35, 35–39. [Google Scholar]
  9. Leroy, B.L.M.; Herath, H.M.S.K.; Sleutel, S.; De Neve, S.; Gabriels, D.; Reheul, D.; Moens, M. The quality of exogenous organic matter: Short-term effects on soil physical properties and soil organic matter fractions. Soil Use Manag. 2008, 24, 139–147. [Google Scholar] [CrossRef]
  10. Jiang, J.; Wang, Y.P.; Yu, M.; Cao, N.; Yan, J. Soil organic matter is important for acid buffering and reducing aluminum leaching from acidic forest soils. Chem. Geol. 2018, 501, 86–94. [Google Scholar] [CrossRef]
  11. Stockmann, U.; Adams, M.A.; Crawford, J.W.; Field, D.J.; Henakaarchchi, N.; Jenkins, M.; Minasny, B.; McBratney, A.B.; De Courcelles, V.D.R.; Singh, K.; et al. The knowns, known unknowns and unknowns of sequestration of soil organic carbon. Agric. Ecosyst. Environ. 2013, 164, 80–99. [Google Scholar] [CrossRef]
  12. Hutchinson, J.J.; Campbell, C.A.; Desjardins, R.L. Some perspectives on carbon sequestration in agriculture. Agric. For. Meteorol. 2007, 142, 288–302. [Google Scholar] [CrossRef]
  13. Tian, J.; Lou, Y.; Gao, Y.; Fang, H.; Liu, S.; Xu, M.; Blagodatskaya, E.; Kuzyakov, Y. Response of soil organic matter fractions and composition of the microbial community to long-term organic and mineral fertilization. Biol. Fertil. Soils 2017, 53, 523–532. [Google Scholar] [CrossRef]
  14. Kalantary, F.; Kahani, M. Optimization of the biological soil improvement procedure. Int. J. Environ. Sci. Technol. 2018, 16, 4231–4240. [Google Scholar] [CrossRef]
  15. Lützow, M.V.; Kögel-Knabner, I.; Ekschmitt, K.; Matzner, E.; Guggenberger, G.; Marschner, B.; Flessa, H. Stabilization of organic matter in temperate soils: Mechanisms and their relevance under different soil conditions—A review. Eur. J. Soil Sci. 2006, 57, 426–445. [Google Scholar] [CrossRef]
  16. Bongiorno, G.; Bünemann, E.K.; Oguejiofor, C.U.; Meier, J.; Gort, G.; Comans, R.; Mäder, P.; Brussaard, L.; de Goede, R. Sensitivity of labile carbon fractions to tillage and organic matter management and their potential as comprehensive soil quality indicators across pedoclimatic conditions in Europe. Ecol. Indic. 2019, 99, 38–50. [Google Scholar] [CrossRef]
  17. Kopecký, M.; Peterka, J.; Kolář, L.; Konvalina, P.; Maroušek, J.; Váchalová, R.; Herout, M.; Strunecký, O.; Batt, J.; Tran, D.K. Influence of selected maize cultivation technologies on changes in the labile fraction of soil organic matter sandy-loam cambisol soil structure. Soil Tillage Res. 2021, 207, 104865. [Google Scholar] [CrossRef]
  18. Li, X.G.; Jia, B.; Lv, J.; Ma, Q.; Kuzyakov, Y.; Li, F.M. Nitrogen fertilization decreases the decomposition of soil organic matter and plant residues in planted soils. Soil Biol. Biochem. 2017, 112, 47–55. [Google Scholar] [CrossRef]
  19. Bünemann, E.K.; Bongiorno, G.; Bai, Z.; Creamer, R.E.; De Deyn, G.; de Goede, R.; Fleskens, L.; Geissen, V.; Kuyper, T.W.; Mäder, P.; et al. Soil quality—A critical review. Soil Biol. Biochem. 2018, 120, 105–125. [Google Scholar] [CrossRef]
  20. Haynes, R.J. Labile Organic Matter Fractions as Central Components of the Quality of Agricultural Soils: An Overview. Adv. Agron. 2005, 85, 221–268. [Google Scholar]
  21. Kolář, L.; Vaněk, V.; Kužel, S.; Peterka, J.; Borová-Batt, J.; Pezlarová, J. Relationships between quality and quantity of soil labile fraction of the soil carbon in Cambisols after liming during 5 years. Plant. Soil Environ. 2011, 57, 193–200. [Google Scholar] [CrossRef] [Green Version]
  22. Maia, S.M.F.; Xavier, F.A.S.; Oliveira, T.S.; Mendonça, E.S.; Araújo Filho, J.A. Organic carbon pools in a Luvisol under agroforestry and conventional farming systems in the semi-arid region of Ceará, Brazil. Agrofor. Syst. 2007, 71, 127–138. [Google Scholar] [CrossRef]
  23. Rodrigues, A.F.; Novotny, E.H.; Knicker, H.; de Oliveira, R.R. Humic acid composition and soil fertility of soils near an ancient charcoal kiln: Are they similar to Terra Preta de Índios soils? J. Soils Sediments 2019, 19, 1374–1381. [Google Scholar] [CrossRef]
  24. Mendonça, E.S.; Rowell, D.L. Mineral and Organic Fractions of Two Oxisols and Their Influence on Effective Cation-Exchange Capacity. Soil Sci. Soc. Am. J. 1996, 60, 1888–1892. [Google Scholar] [CrossRef]
  25. Rahal, N.S.; Alhumairi, B.A.J. Modelling of soil cation exchange capacity for some soils of east gharaf lands from mid-Mesopotamian plain (Wasit province/Iraq). Int. J. Environ. Sci. Technol. 2019, 16, 3183–3192. [Google Scholar] [CrossRef]
  26. Arthur, E. Rapid estimation of cation exchange capacity from soil water content. Eur. J. Soil Sci. 2017, 68, 365–373. [Google Scholar] [CrossRef]
  27. Von Lützow, M.; Kögel-Knabner, I.; Ekschmitt, K.; Flessa, H.; Guggenberger, G.; Matzner, E.; Marschner, B. SOM fractionation methods: Relevance to functional pools and to stabilization mechanisms. Soil Biol. Biochem. 2007, 39, 2183–2207. [Google Scholar] [CrossRef]
  28. Chan, K.Y.; Bowman, A.; Oates, A. Oxidizible organic carbon fractions and soil quality changes in an oxic paleustalf under different pasture leys. Soil Sci. 2001, 166, 61–67. [Google Scholar] [CrossRef]
  29. Körschens, M.; Schulz, E.; Behm, R. Heißwasserlöslicher C und N im boden als kriterium für das N-Nachlieferungsvermögen. Zentralbl. Mikrobiol. 1990, 145, 305–311. [Google Scholar] [CrossRef]
  30. Schmidt, M.W.I.; Noack, A.G.; Osmond, G. Black carbon in soils and sediments: Analysis, distribution, implications, and current challenges. Glob. Biogeochem. Cycles 2000, 14, 777–793. [Google Scholar] [CrossRef]
  31. Maroušek, J.; Bartoš, P.; Filip, M.; Kolář, L.; Konvalina, P.; Maroušková, A.; Moudrý, J.; Peterka, J.; Šál, J.; Šoch, M.; et al. Advances in the agrochemical utilization of fermentation residues reduce the cost of purpose-grown phytomass for biogas production. Energy Sources Part A Recover. Util. Environ. Eff. 2020, 00, 1–11. [Google Scholar] [CrossRef]
  32. IUSS Working Group. WRB World reference base for soil resources 2014. In International Soil Classification System for Naming soils and Creating Legends for Soil Maps; Food and Agriculture Organization of the United Nations: Rome, Italy, 2014; ISBN 9789251083697. [Google Scholar]
  33. Meloun, M.; Militký, J. Statistical Data Analysis, A Practical Guide with 1250 Exercises and Answer Key on CD; Woodhead Publishing India: New Delhi, India, 2011. [Google Scholar]
  34. Lehmann, J.; Kleber, M. The contentious nature of soil organic matter. Nature 2015, 528, 60–68. [Google Scholar] [CrossRef] [PubMed]
  35. Rice, J.A. Humin. Soil Sci. 2001, 166, 848–857. [Google Scholar] [CrossRef]
  36. Burdon, J. Are the traditional concepts of the structures of humic substances realistic? Soil Sci. 2001, 166, 752–769. [Google Scholar] [CrossRef]
  37. Knicker, H.; Hilscher, A.; González-Vila, F.J.; Almendros, G. A new conceptual model for the structural properties of char produced during vegetation fires. Org. Geochem. 2008, 39, 935–939. [Google Scholar] [CrossRef] [Green Version]
  38. Heymann, K.; Lehmann, J.; Solomon, D.; Liang, B.; Neves, E.; Wirick, S. Can functional group composition of alkaline isolates from black carbon-rich soils be identified on a sub-100nm scale? Geoderma 2014, 235–236, 163–169. [Google Scholar] [CrossRef]
  39. Marín-Spiotta, E.; Gruley, K.E.; Crawford, J.; Atkinson, E.E.; Miesel, J.R.; Greene, S.; Cardona-Correa, C.; Spencer, R.G.M. Paradigm shifts in soil organic matter research affect interpretations of aquatic carbon cycling: Transcending disciplinary and ecosystem boundaries. Biogeochemistry 2014, 117, 279–297. [Google Scholar] [CrossRef]
  40. Blume, H.-P.; Brümmer, G.W.; Horn, R.; Kandeler, E.; Kögel-Knabner, I.; Kretzschmar, R.; Stahr, K.; Wilke, B.-M. Scheffer/Schachtschabel: Lehrbuch der Bodenkunde; Spektrum Akademischer Verlag: Heidelberg, Germany, 2010. [Google Scholar]
  41. Klotzbücher, T.; Kaiser, K.; Guggenberger, G.; Gatzek, C.; Kalbitz, K. A new conceptual model for the fate of lignin in decomposing plant litter. Ecology 2011, 92, 1052–1062. [Google Scholar] [CrossRef]
  42. Rumpel, C.; Kögel-Knabner, I. Deep soil organic matter-a key but poorly understood component of terrestrial C cycle. Plant Soil 2011, 338, 143–158. [Google Scholar] [CrossRef]
  43. Kopecký, M.; Kolář, L.; Váchalová, R.; Konvalina, P.; Batt, J.; Mráz, P.; Menšík, L.; Hoang, T.N.; Dumbrovský, M. Black Carbon and Its Effect on Carbon Sequestration in Soil. Agronomy 2021, 11, 2261. [Google Scholar] [CrossRef]
  44. Ghani, A.; Dexter, M.; Perrott, K.W. Hot-water extractable carbon in soils: A sensitive measurement for determining impacts of fertilization, grazing, and cultivation. Soil Biol. Biochem. 2003, 35, 1231–1243. [Google Scholar] [CrossRef]
  45. Lalande, R.; Gagnon, B.; Royer, I. Impact of natural or industrial liming materials on soil properties and microbial activity. Can. J. Soil Sci. 2009, 89, 209–222. [Google Scholar] [CrossRef]
  46. Lovell, R.D.; Jarvis, S.C. Soil microbial biomass and activity in soil from different grassland management treatments stored under controlled conditions. Soil Biol. Biochem. 1998, 30, 2077–2085. [Google Scholar] [CrossRef]
  47. Campbell, C.A.; Paul, E.A.; Rennie, D.A.; Mccallum, K.J. Applicability of the Carbon-Dating Method of Analysis To Soil Humus Studies. Soil Sci. 1967, 104, 217–224. [Google Scholar] [CrossRef] [Green Version]
  48. Taghizadeh-Mehrjardi, R. Digital mapping of cation exchange capacity using genetic programming and soil depth functions in Baneh region, Iran. Arch. Agron. Soil Sci. 2016, 62, 109–126. [Google Scholar] [CrossRef]
  49. Khaledian, Y.; Kiani, F.; Ebrahimi, S.; Brevik, E.C.; Aitkenhead-Peterson, J. Assessment and Monitoring of Soil Degradation during Land Use Change Using Multivariate Analysis. Land Degrad. Dev. 2017, 28, 128–141. [Google Scholar] [CrossRef]
  50. Moral, F.J.; Rebollo, F.J. Characterization of soil fertility using the Rasch model. J. Soil Sci. Plant Nutr. 2017, 17, 486–498. [Google Scholar] [CrossRef]
Figure 1. Linear regression dependence between the carbon of primary soil organic matter contents determined by classical and modified methods. Note: CPSOM CM—the carbon belonging to primary soil organic matter determined with the classical method (%); CPSOM MM—the carbon belonging to primary soil organic matter determined with the modified method (%).
Agronomy 12 00073 g001
Figure 2. Linear regression dependence between the carbon belonging to humic acids and fulvic acids and the carbon belonging to stable organic fractions. Note: CHA+FA–the carbon belonging to humic acids and fulvic acids (%); CSOF–the carbon belonging to stable organic fractions (%).
Agronomy 12 00073 g002
Figure 3. Linear regression of dependence between cation-exchange capacity (CEC) and the ratio of carbon that belongs to humic acids and fulvic acids (CHA:CFA).
Agronomy 12 00073 g003
Figure 4. Principal component analysis of soil organic matter parameters (TOC, CSOF, CHA+FA, CHA:CFA, CPSOM CM, CPSOM MM, CEC, constant k, quotient E4/6) in various soil samples: (a) Graph of component weights 1 and 2 (PC1 × PC2) for soil organic matter parameters; (b) the scatterplot of the component score PC1 × PC2 for individual localities; (c) scree plot; (d) 3D graph PC1 × PC2 × PC3 for individual localities. Note: TOC–total organic carbon (%); CSOF–the carbon belonging to stable organic fractions (%); CHA+FA–the carbon belonging to humic acids and fulvic acids (%); CPSOM CM–the carbon belonging to primary soil organic matter determined by the classical method (%); CPSOM MM—the carbon belonging to primary soil organic matter determined by the modified method (%); CEC–the cation-exchange capacity of stable organic fractions (mmol chem. equiv. H+/1000 g); CHA:CFA–the ratio of carbon that belongs to humic acids and fulvic acids; k (sec) –the speed constant of oxidation.
Agronomy 12 00073 g004
Figure 5. Factor analysis of soil organic matter parameters (TOC, CSOF, CHA+FA, CHA:CFA, CPSOM CM, CPSOM MM, CEC) in individual localities: (a) graph of factor weights (Factor 1 × Factor 2) for soil organic matter parameters; (b) scattering diagram of component scores Factor 1 × Factor 2 for individual localities. Note: TOC–total organic carbon (%); CSOF–the carbon belonging to stable organic fractions (%); CHA+FA–the carbon belonging to humic acids and fulvic acids (%); CPSOM CM–the carbon belonging to primary soil organic matter determined by the classical method (%); CPSOM MM–the carbon belonging to primary soil organic matter determined by the modified method (%); CEC–the cation-exchange capacity of stable organic fractions (mmol chem. equiv. H+/1000 g); CHA:CFA–the ratio of carbon that belongs to humic acids and fulvic acids.
Agronomy 12 00073 g005
Table 1. Soil carbon fractionation of samples A, B, C, D, E, F according to Classical method (CM) and Modified method (MM) (±SD).
ParameterMethodSample
ABCDEF
TOCC-Analyzer 13.61   ±   0.08 d 16.51   ±   0.08 f 14.82   ±   0.05 e 1.40   ±   0.02 b 0.90   ±   0.01 a 3.70   ±   0.02 c
CPSOMCM 9.50   ±   0.17 a e 12.38   ±   0.21 a f 8.28   ±   0.17 a d 1.02   ±   0.12 a b 0.69   ±   0.07 a a 2.93   ±   0.08 a c
CPSOMMM 10.67   ±   0.07 b e 14.27   ±   0.11 b f 10.37   ±   0.10 b d 1.22   ±   0.02 b b 0.79   ±   0.02 b a 3.26   ±   0.04 b c
CHA+FACM 4.11   ±   0.15 b c 4.13   ±   0.21 b c 6.54   ±   0.18 b d 0.39   ±   0.14 b a 0.22   ±   0.07 b a 0.77   ±   0.09 b b
CSOFMM 2.93   ±   0.04 a d 2.24   ±   0.13 a c 4.45   ±   0.11 a e 0.18   ±   0.02 a a 0.11   ±   0.03 a a 0.44   ±   0.06 a b
Note: TOC—total organic carbon (%); CPSOM—the carbon belonging to primary soil organic matter (%); CHA+FA—the carbon belonging to humic acids and fulvic acids (%); CSOF—the carbon belonging to stable organic fractions (%); significant differences between samples within parameters are shown in upper case letters (Tukey’s honest significance test; p = 0.05); significant differences between methods within samples are shown in lower case letters (Tukey’s honest significance test; p = 0.05).
Table 2. Determination of the degree of stability of soil organic matter by oxidation resistance according to Chan’s et al. method [28] in samples A, B, C, D, E, F by division into four fractions with a representation of the C content in % of the total amount of TOC (±SD).
FractionSample
ABCDEF
1 31.42   ±   1.16 c b 34.88   ±   1.72 d c 35.92   ±   1.87 d c 18.03   ±   0.76 a a 16.97   ±   0.96 a a 30.33   ±   2.26 d b
2 25.25   ±   0.81 b ab 28.00   ±   1.93 c b 23.92   ±   1.71 b a 25.93   ±   1.82 b ab 23.92   ±   0.82 b a 26.43   ±   1.50 b ab
3 17.80   ±   0.59 a c 15.38   ±   0.83 a b 12.38   ±   1.15 a a 20.42   ±   0.66 a d 18.10   ±   0.68 a c 15.03   ±   0.54 a b
4 25.53   ±   1.44 b b 21.73   ±   2.78 b a 27.78   ±   1.83 c b 35.62   ±   1.78 c c 41.02   ±   0.85 c d 28.20   ±   1.75 bc b
Note: Fraction 1 = 12N H2SO4 (labile); Fraction 2 = 18N–12N H2SO4 (semi-labile); Fraction 3 = 24N–18N H2SO4 (semi-stable); Fraction 4 = TOC-24N H2SO4 (stable); significant differences between samples within fractions are shown in upper case letters (Tukey’s honest significance test; p = 0.05); significant differences between fractions within individual samples are shown in lower case letters (Tukey’s honest significance test; p = 0.05).
Table 3. Expression of stable organic fraction quality by the cation-exchange capacity of humic substances according to a Modified method (MM), by the CHA:CFA ratio and quotient E4/6 according to a Classical method (CM) and expression of primar soil organic matter quality by speed constant k of its oxidation according to MM (±SD).
ParameterMethodSample
ABCDEF
CECMM3012 ± 86c1978 ± 93a4088 ± 119d2196 ± 31b2261 ± 43b3991 ± 99d
CHA:CFACM0.96 ± 0.16b0.75 ± 0.08ab1.71 ± 0.19c0.82 ± 0.13b0.53 ± 0.05a0.98 ± 0.17b
E4/6CM14.30 ± 0.57c3.55 ± 0.22b4.13 ± 0.12b2.81 ± 0.26a3.59 ± 0.19b2.67 ± 0.25a
Speed constant k (s)MM3.16 ± 0.08d4.49 ± 0.11e0.81 ± 0.08a2.06 ± 0.12b1.88 ± 0.06b2.65 ± 0.14c
Note: CEC–the cation-exchange capacity of stable organic fractions (mmol chem. equiv. H+/1000 g); CHA:CFA–the ratio of carbon that belongs to humic acids and fulvic acids; E4/6–the quotient E4/6; significant differences between samples within parameters are shown in upper case letters (Tukey’s honest significance test; p = 0.05).
Table 4. Factor weights and contributions of a given factor to the communality for individual traits after rotation of varimax normalized soil organic matter.
ParameterFactor WeightsContributions of a Given Factor to the Communality
Factor 1Factor 2Factor 1Factor 2Communalities
TOC0.98320.17330.91040.95110.9378
CSOF0.81820.52940.58230.91000.9055
CHA+FA0.87020.45870.67240.92580.9220
CPSOM CM0.98490.01100.92660.92760.9213
CPSOM MM0.98930.05450.93280.93870.9286
CEC–0.02490.93550.00000.57300.5360
CHA:CFA0.32270.89530.07750.80360.7428
Note: TOC–total organic carbon (%); CSOF–the carbon belonging to stable organic fractions (%); CHA+FA–the carbon belonging to humic acids and fulvic acids (%); CPSOM CM–the carbon belonging to primary soil organic matter determined by the classical method (%); CPSOM MM–the carbon belonging to primary soil organic matter determined by the modified method (%); CEC–the cation-exchange capacity of stable organic fractions (mmol chem. equiv. H+/1000 g); CHA:CFA–the ratio of carbon that belongs to humic acids and fulvic acids.
Publisher’s Note: MDPI stays neutral with regard to jurisdictional claims in published maps and institutional affiliations.

