Article

Control of Substrate Water Availability Using Soil Sensors and Effects of Water Deficit on the Morphology and Physiology of Potted Hebe andersonii

by
Daniel Bañón
1,*,
Beatriz Lorente
1,
Sebastián Bañón
2,
María Fernanda Ortuño
1,
María Jesús Sánchez-Blanco
1 and
Juan José Alarcón
1
1
Department of Irrigation, Centro de Edafología y Biología Aplicada del Segura (CEBAS-CSIC), 30100 Murcia, Spain
2
Department of Agricultural Engineering, UPCT—Technical University of Cartagena, 30203 Cartagena, Spain
*
Author to whom correspondence should be addressed.
Agronomy 2022, 12(1), 206; https://doi.org/10.3390/agronomy12010206
Submission received: 30 November 2021 / Revised: 10 January 2022 / Accepted: 12 January 2022 / Published: 15 January 2022
(This article belongs to the Special Issue Advances in Plant Physiology of Abiotic Stresses)

Abstract

:
Many plant producers tend to overwater crops to prevent water stress and salt-induced damage. These practices waste irrigation water and cause leaching that harms the environment and increases production costs. In order to optimize water consumption and minimize the environmental impact of plant production, this study aimed to determine the physiological and morphological responses of Hebe andersonii to three substrate volumetric water contents (49%, 39%, and 32%). The experiment was conducted in a greenhouse with an irrigation protocol that consisted of adding small volumes of water to avoid leaching while monitoring substrate moisture with dielectric soil sensors. The results showed that moderately low substrate moisture improved the water-use efficiency, while growth was significantly reduced under more severe water deficit conditions (but without leaf chlorosis or abscission). The photosynthetic activity of Hebe was primarily controlled by the stomatal aperture, which was co-determined by the substrate moisture and seasonal temperature. Hebe leaves promoted non-photochemical quenching when carbon assimilation was limited by a water deficit, and accumulated solutes through an osmotic adjustment process (especially Cl, Na+, and K+) to maintain their water status. Overall, Hebe andersoni cv. Variegata could successfully grow and improve its water-use efficiency in low substrate moisture and under a non-draining irrigation regime.

1. Introduction

Managing the irrigation of potted crops is a complex task because substrates can easily dry out due to their low water retention capacity and the small volume of the containers [1]. These conditions lead many ornamental plant producers to overwater their crops in order to avoid drought, while others irrigate the potting substrate to full container capacity to maximize growth, regardless of the plant’s water requirements. These practices waste irrigation water and cause leachate, which harms the environment and increases production costs [2,3]. Several studies have suggested that applying more water than required to cover evapotranspiration is undesirable for economic and social reasons [3]. Additionally, it is well known that high substrate moisture can increase plant susceptibility to fungi [4].
Another factor that leads to excessive water use in pot cultures is salt flushing, which is a technique used to leach salts out of the substrate and prevent them from accumulating in the root system. Salt flushing presents the disadvantage of draining away fertilizers, leaving them unavailable to the plant and diminishing vegetative development [3,5]. Another drawback is that the discharge of pesticides and other chemical pollutants commonly found in agricultural drainage is likely to violate environmental policies [6]. Such arguments, added to increasing consumer demands, are promoting plant production based on environmentally friendly practices.
One indicator that measures sustainability in crop production is water-use efficiency (WUE) [7]. In short, the goal of optimizing WUE consists of minimizing water consumption without compromising crop yield. In this sense, closed-loop irrigation systems have been developed to minimize water drainage from greenhouses, but their commercial applications are still limited [8] because of high investment costs and challenges in recycling nutrient solutions. An alternative approach to improving irrigation efficiency would be to maintain the substrate moisture constant via the recurrent addition of small volumes of water [3,9]. In the case of ornamental plants, Nemali and van Iersel [2] reduced water demand and improved plant quality by implementing this strategy. Such irrigation systems can reduce or eliminate leaching, which should result in substantial water savings in commercial-scale production [10]. However, little research has been done to identify the effects of low substrate moisture on the quality and production of ornamental potted crops [11].
Despite the benefits of high water-use efficiencies, low substrate moisture levels may expose plants to severe water stress, and negatively affect plant metabolic and physiological processes [12]. However, plant tolerance to a water deficit depends on the species and the magnitude and duration of the water deficit [13]. Therefore, it is necessary to know the adaptive capacity to drought and the physiological mechanisms of tolerance for each cultivar of interest. Understanding the adaptation mechanisms to drought would allow for identifying the most resistant varieties and help to decide on optimal irrigation conditions [13,14,15].
Adaptations in plant growth and morphology in response to a water deficit have been widely described [16,17]. Morphological variations due to a water deficit help to reverse metabolic imbalances and improve plant water status [18]. Some examples of such variations are the size and thickness of leaves [3] or the root-to-shoot ratio [19]. Stomatal adjustment is another adaptive process used by plants in the face of water stress [15,20]. The stomatal aperture affects transpiration, CO2 uptake, and growth. In general, gas exchange measurements are considered efficient indicators of plant fitness to water stress [3]. Similarly, changes in CO2 assimilation can be studied by analyzing some parameters related to chlorophyll fluorescence [21].
Soil–plant water relations can also influence nutrient availability [22]. Given that reduced transpiration hinders the translocation of some nutrients to the aerial part of plants [23], changes in nutrient composition can be used as a tool to diagnose the level of water stress of a plant [24]. For instance, an accumulation of solutes can be important for lowering TLP and hence maintaining turgor, even with a declining water potential, and, in turn, maintaining open stomata and CO2 assimilation at levels that would otherwise be inhibited [25]. Similarly, numerous nutrients can be used as indicators for plant stress since many of them regulate plant metabolism, and act as enzyme activators under stressful conditions [26].
Hebe is a genus of shrubs native to Oceania that holds great interest in ornamental horticulture worldwide. These versatile plants are excellent for borders, containers, and mass plantings. It has gained distinct relevance in some Western countries, such as the United Kingdom [27]. British nurseries have produced numerous hybrid cultivars of Hebe that have become popular for home decoration and landscaping. Hebe x andersonii is one of these hybrids and the subject of this paper. Although not native to the Mediterranean region, this hybrid is widely used for ornamental purposes in Mediterranean climates given its excellent adaptability. The fleshy and waxy leaves of Hebe help it to retain moisture and tolerate dry spells. Its grayish-green leaves with yellow-cream spots combine ornamentally with its purple-violet flowers that bloom in clusters at the apex of the stems [28].
Although Hebe is frequently produced in nurseries of Oceania, America, and Europe, there is little research on the impact of irrigation on its growth and physiology. Information on substrate moisture conditions to optimize water use is essential if over-irrigation is to be avoided and crop health ensured. Given the scarce information on the response of Hebe to a water deficit and the global need for sustainable practices in nursery production, the objectives of this experiment were as follows: (i) to ascertain and evaluate the morphological and physiological responses of Hebe to water availability, and (ii) to identify irrigation strategies to improve water-use efficiency without substantial loss of ornamental quality. These objectives were addressed by assessing the effects of substrate moisture on the growth, ornamental quality, water relations, gas exchange, photochemical behavior, plant mineral composition, and water-use efficiency of Hebe.

2. Materials and Methods

2.1. Plants and Culture Conditions

Seedlings of the ornamental shrub Hebe x andersonii cv. Variegata (7–8 cm high) were obtained from a commercial grower (Viveros Bermejo S.L., Totana, Spain). Round PVC pots (15.5 cm diameter and 2.3 L volume) were used to transplant the seedlings. Pots were filled with a commercial soilless substrate composed of peat, coconut fiber, and perlite (67/30/3, v/v/v) (Fertiberia S.A., Madrid, Spain). The water release curve for the substrate was determined in the laboratory following De Boodt’s method [29]. Ten different suctions were applied to the sample: 10, 20, 30, 40, 50, 60, 70, 80, 90, and 100 hPa. The moisture release properties of the substrate were: 63.2% maximum water holding capacity, 28.1% easily available water (EAW), and 5.8% water buffer capacity (Figure 1). Plant available water, 33.9% for our substrate, is defined as the amount of water held between the maximum water holding capacity and the wilting point. Usually, water available to plants in a substrate is defined as the VWC between −1 and −10 kPa of the soil water potential (Ψw) [30]. This includes the EAW (−1 to −5 kPa) and the water buffer capacity (−5 to −10 kPa) [29]. The critical Ψw at which many crops cultivated in a substrate undergo water stress is around −10 kPa. The pots were placed in openings (16 cm× 16 cm) in a metal grid made of corrugated bars (8 mm ø) 80 cm off the ground. The whole setup was placed in a polycarbonate greenhouse (15 m × 8 m × 6 m) at the Agricultural Experimental Station of the Technical University of Cartagena, Spain (lat. 37°35′ N, long. 0°59′ W). The experiment ran from February to September 2020.

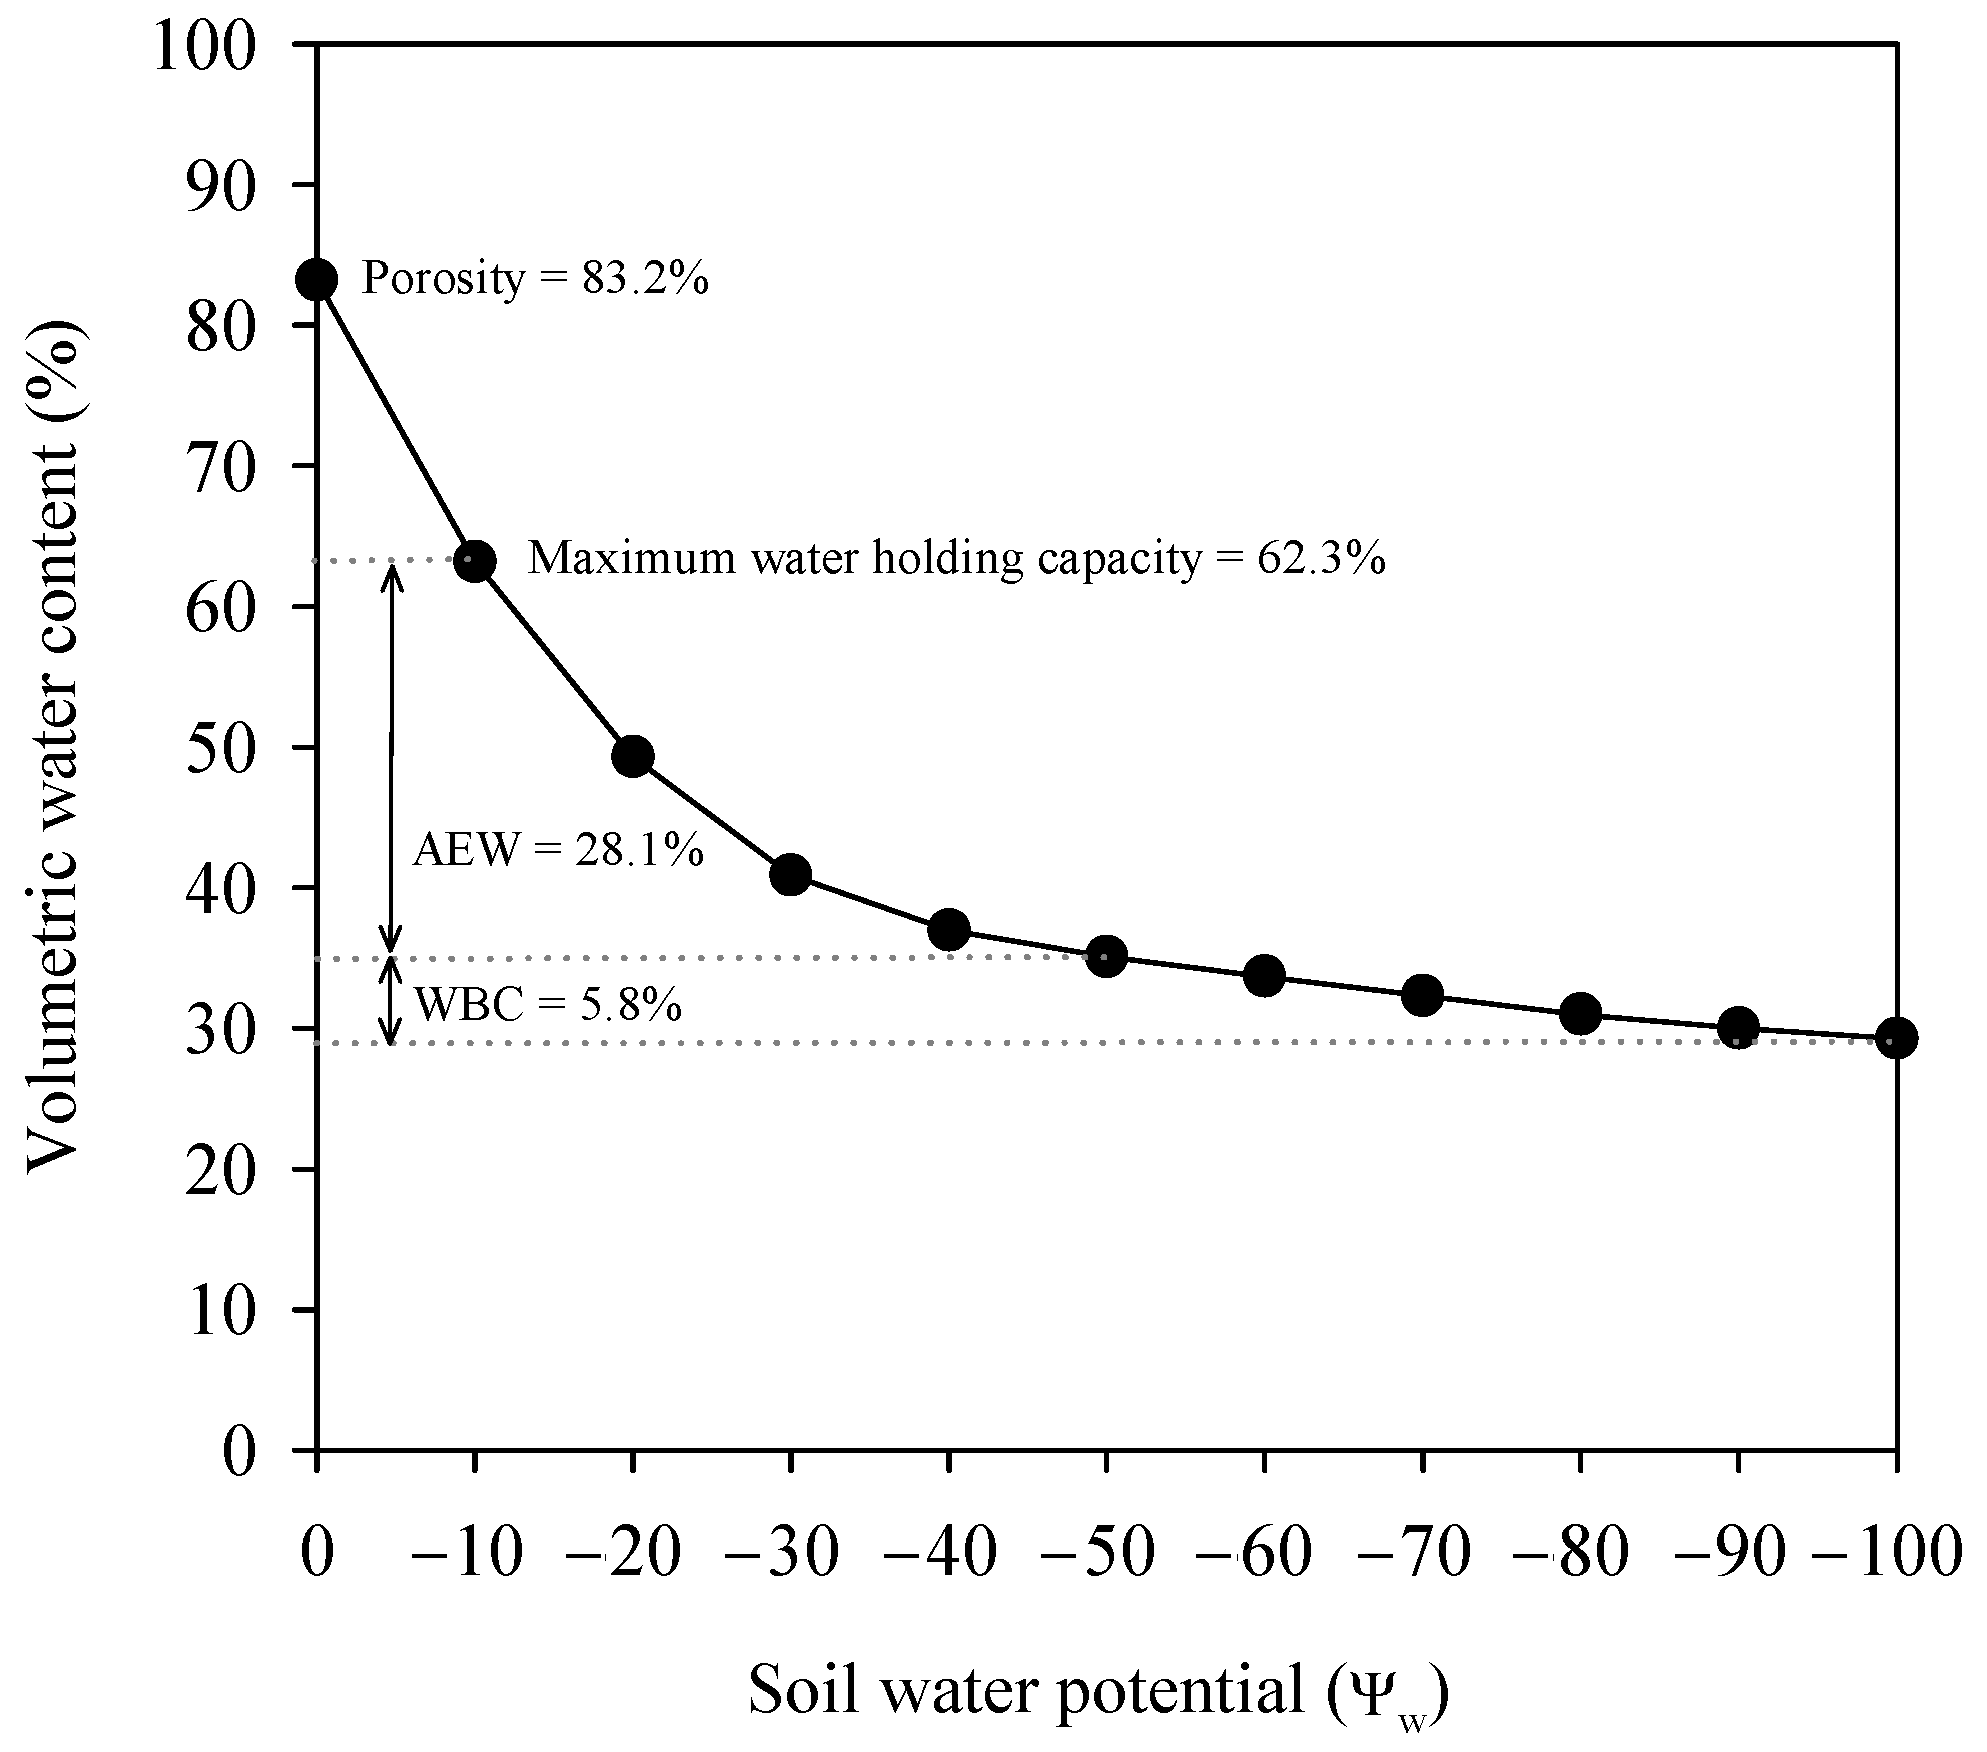
2.2. Irrigation System and Treatments

Pressure-compensating and anti-drain emitters were used to irrigate the plants (Netafim Ltd., Corporate Headquarters, Israel). The emitters were tested for flow rate consistency before the experiment began. An irrigation pipe (50 cm × 4 mm) was used to supply water to the emitters, with their flow rates ranging between 1.44 and 1.56 L h−1. The emitters were connected to a straight-arrow dripper inserted into the substrate of the pots. Two emitters per pot and 30 plants per treatment were employed. Centrifugal electric pumps (Mod. Prisma15 3M, ESPA, Banyoles, Spain) were used to drive the water through the emitters. Latching solenoid valves (Aquanet Plus, Netafim, Fresno, CA, USA) were used to open or close the water flow. A separate tank, pump, and irrigation lines were provided for each treatment. The irrigation solution (stored in black 1000 L polypropylene tanks) was prepared with commercial complex fertilizer with a nutrient balance of 4-1.7-4.5-4-1.4 (N-P2O5-K2O-CaO-MgO). Nitric acid was added to adjust the pH of the irrigation solution. The final EC and pH of the irrigation solution were 1.77 dS m−1 and 7.45, respectively. The concentration of the main ions in the nutrient solution is listed in Table 1.
A data logger for temperature and humidity (LOG 32 TH, Dostmann electronic GmbH, Germany) was used to measure and record air temperature and humidity in the greenhouse. Data were collected every minute and daily averages were calculated. Vapor pressure deficit (VPD) values were computed using the equation described by Steiner et al. [31]. Daily average temperature and VPD data are shown in Figure 2.
The experiment consisted of three treatments of different substrate moisture levels under a non-leaching irrigation regime. The average VWC percentages were 49.28, 38.44, and 32.16% for each treatment, which, in this work, are referred to as the control, VWC39%, and VWC32%, respectively. The Ψw values that correspond to these water content percentages can be drawn from Figure 1. The irrigation was controlled using soil moisture sensors (EC5; METER Group, Inc., Pullman, WA, USA) connected to a CR1000 datalogger with a 16-channel relay controller (SMD-CD16D; Campbell Scientific Inc., Logan, UT, USA) operating solenoid valves on each of the tanks that contained the irrigation solutions. EC5 sensors determined the VWC by measuring the dielectric constant of the medium (voltage) using capacitance frequency domain technology [32]. For more information, see Decagon-METER Group’s EC5 manual.
Soil sensors were fully inserted vertically in the east-facing quadrant of the root ball, between two emitters. Three probes per treatment were installed in random pots, with one sensor per pot. The volumetric water content (VWC) was calculated from the voltage output of the EC5 sensors (mV) using a substrate-specific calibration equation. The calibration line was obtained following the procedure described by Valdés et al. [33]: VWC = 4.942 mV − 0.676, R2 = 0.98. The CR1000 data-logger was programmed using Loggernet 3 (Campbell Scientific Inc.) to log the sensor output every 1 h during the experiment. The outputs were immediately converted to VWC by the CR1000 using the calibration equation. An example of the evolution of substrate moisture over time is given in Figure 3.
From 9 a.m. to 2 p.m., the CR1000 compared the VWC every hour with a specific irrigation set-point for each treatment (see Figure 3). Irrigation was activated automatically and independently in each treatment when the set-point was reached. The CR1000 was programmed to count every irrigation event automatically. For all treatments, the water applied at each irrigation event was the same, around 50 mL pot−1 (3 L h−1 flow rate in a 60 s irrigation event). Water consumption was the result of multiplying the total number of irrigation events by the volume of each irrigation.
Easily available water (EAW) is the percentage of water that is immediately available for plant uptake. Plants can take up this water with little capillary force. As plants continuously extract water from the substrate, the available water decreases, and plants must exert more effort to extract water from the substrate [34]. The VWC set-points selected for the treatments in this experiment provided different percentages of depletion of EAW. The control treatment (49% VWC) triggered the irrigation when half of the EAW was depleted; therefore, the plant used little energy to take up the water through its roots. The VWC39% treatment started irrigating when 88% of the EAW was depleted; the plants had to exert some effort to absorb water. Meanwhile, VWC32% plants had to absorb the water buffer since the EAW was completely depleted, which entailed drought stress.
The water applied to each treatment corresponded to water consumption since there was no leaching. Evapotranspiration was calculated by dividing the total volume of water applied by the number of days of the experiment (152 days). WUE was calculated as the ratio between the dry mass produced and the water transpired between the beginning and end of the experimental period.

2.3. Growth, SPAD, and Color

Plant height and width were measured in ten plants per treatment at the end of the experiment. Two width measurements were taken: one at its widest section, and the other perpendicular to it. Plant height was measured from the substrate surface to the most distal shoot. The number of shoots (with and without flowers) per plant was also determined.
The dry weights of the roots, stems, and leaves were determined in the same plants. The different plant tissues were dried until constant weight in an isothermal oven at 65 °C (Mod. 210, PSelecta, Barcelona, Spain). Then, the dry mass was weighed with an analytical balance (Mod. TE2145, Sartorius Weighing Technology, GmBH, Goettingen, Germany). The root to shoot ratio was calculated using the dry weight values.
The average leaf area was measured using Easy Leaf Area software [35], which analyses the area of the leaves in digital photographs by counting pixels and referring them to the image of a red square of a known area. Fifteen leaves per plant and 10 plants per treatment were randomly chosen for this purpose. The specific leaf area (SLA) was obtained by dividing the leaf area by the dry weight.
SPAD (relative chlorophyll content) values were measured using a chlorophyll meter (SPAD-502, Minolta Camera Co., Ltd., Osaka, Japan). Leaf color was analyzed with a Minolta CR10 colorimeter (Konica Minolta Sensing, Inc., Osaka, Japan), which calculated the color coordinates CIELab (lightness, hue angle, and chrome). Six plants per treatment were sampled for SPAD and color measurements. In each plant, two leaves located at mid-height and facing south were selected for each existing shoot. Additionally, the number of total stems and flowering stems per plant was measured.

2.4. Substrate EC and Plant Mineral Content

The electrical conductivity of the 1:2 extract v/v (EC1:2) was tested at the end of the experiment, following the procedure described by Sonneveld and van den Ende [36], whereby one volume of the substrate was combined with two volumes of distilled water. Then, the mixture was stirred by hand and left to stand for half an hour. Finally, the samples were filtered through filter paper and the EC of the leachate was measured with a hand-held EC tester (ECTestr11, Eutech Instruments Pte Ltd., Singapore).
Plant mineral content was determined in six pots per treatment. For this, oven-dried leaves, stems, and roots were ground to a fine dry powder. Inorganic elements (Na+, K+, P, Ca2+, and Mg2+) were determined using inductively coupled plasma emission spectrophotometry (IRIS Intrepid II XDL ICP-OES, Thermo Fischer Scientific, Waltham, MA, USA). Plant tissues were extracted by mixing 100 mg of dry powder with 40 mL of deionized water. The mixture was stirred for 30 min in a rotary shaker at 30 rpm and passed through a 0.45 μm PTFE syringe filter. Chloride concentration was analyzed in the aqueous extract using a chloride analyzer (Mod. 926, Sherwood Scientific, Cambridge, UK). Total nitrogen was measured with a nitrogen analyzer (Mod. Flash EA 1112, Thermo Fischer Scientific, Waltham, MA, USA).

2.5. Plant Water Status

Leaf water potential (Ψl), leaf osmotic potential (Ψs), leaf turgor potential (Ψt), and leaf osmotic potential at full turgor (Ψ100s) were determined in six plants per treatment during the central hours of illumination at four stages of growth. As an additional metric for determining plant drought tolerance, water potential at the turgor loss point (Ψtlp) was calculated for each treatment using Equations (6) and (7) proposed by [37]. Ψl was measured with a pressure chamber (Mod. 3000; Soil Moisture Equipment Co., Santa Barbara, CA, USA) in mature leaves according to Scholander et al. [38]. The leaves were wrapped in a plastic bag, cut from the main stem with a sharp blade, and quickly placed in the chamber, being careful to leave enough petiole to be inserted into the nozzle of the pressure chamber. Compressed nitrogen gas was used to increase the pressure in the chamber at a rate of 0.03 MPa s−1 until the suppuration of a sap drop was visible. The same leaves used for Ψl were frozen in liquid nitrogen (−196 °C) and stored at −30 °C. After thawing, the osmotic potential (Ψs) was measured in the extracted sap using a WESCOR 5520 vapor pressure osmometer (Wescor Inc., Logan, UT, USA). The leaf turgor potential was estimated as the difference between Ψl and Ψs. The leaf osmotic potential at full turgor was measured using the same procedure for Ψs, but on leaves that had been previously placed in distilled water until full saturation was reached.

2.6. Gas Exchange and Chlorophyll Fluorescence

The gas and photochemical parameters considered in this work were as follows: (i) stomatal conductance (gs), (ii) net photosynthetic rate (Pn), (iii) intrinsic water-use efficiency (Pn/gs), (iv) apparent electron transport rate (ETR), and (v) the ETR/Pn ratio. These parameters were quantified for Hebe leaves using a portable photosynthesis system (Mod. LI-6400; LI-COR Inc., Lincoln, NE, USA). The CO2 concentration was set at 400 ppm, the flow rate was set at 500 µmol s−1, and the photosynthetically active radiation (PAR) was set at 1000 µmol m−2 s−1 [39]. The effective photochemical quantum yield of photosystem II (ePSII) was used to estimate the electron transport rate (ETR) according to the equation of Krall and Edwards (1992): ETR = ePSII × PFD × 0.84 × 0.5, where PFD represents the photon flux density incident on the leaf, 0.84 represents the leaf absorbance, and 0.5 represents a factor implying an equal distribution of energy between photosystems II and I. The intrinsic water-use efficiency was estimated as the ratio between Pn and gs (Pn/gs). Gas exchange, water potential, and chlorophyll fluorescence values were measured simultaneously around noon to minimize the influence of temperature variations.
At the end of the experiment, chlorophyll fluorescence parameters were measured with a pulse-modulated fluorometer (Mod. FMS-2, Hansatech Instruments, Norfolk, UK). The parameters determined were as follows: (i) maximum quantum yield of PSII (Fv/Fm), (ii) effective quantum yield of PSII (ePSII), and (iii) non-photochemical quenching (NPQ). Each leaf was dark-adapted with a shutter-plate leaf clip 30 min before each measurement, following the method described by Sheng et al. [40]. Once in darkness, the minimum fluorescence (Fo) was measured, and a light irradiation pulse of 5000 μmol m−2 s−1 was administered for 0.7 to measure the maximum fluorescence of the dark-adapted leaf (Fm). The sample was then irradiated with actinic light of 400 μmol m−2 s−1 for 150 s to measure fluorescence under stationary light (Fs). Next, radiation of 5000 μmol m−2 s−1 was administered for 0.7 s to determine the maximum fluorescence of the light-adapted leaf (Fm′). Finally, the actinic radiation was turned off and far-red radiation was turned on for a period of 5 s to reoxidize the centers of PSII. Then, the minimum fluorescence of the light-adapted leaf (Fo′) was measured. Fv/Fm, ePSII, and NPQ were estimated from Fo, Fm, Fs, Fm′, and Fo′, according to the equations described in Brestic and Zivcak [41].

2.7. Leaf Cross-Sectional Anatomy

For the analysis at the end of the experiment, six healthy mature leaves per treatment were selected from the fifth fully expanded leaf starting from the tip. Leaf cross-sections were cut from the middle portion of each leaf, avoiding the central nerve. Four sections per leaf of approximately 10 µm thickness were cut with a hand microtome (Mod. 501, Nahita, Navarra, Spain). The sections were stained with 0.5% toluidine blue and transferred to a glass slide for microscopic observation. Measurements were taken with an optical microscope at ×40 magnification (Mod. BX51, Olympus, Tokyo, Japan). The thickness of the total blade, palisade parenchyma (PP), spongy parenchyma (SP), epidermis (E), and cuticle (C) were measured with a micrometric eyepiece.

2.8. Experimental Design and Statistical Analysis

Plants were arranged on crop benches in a randomized block design. Each of the three treatments (control, VWC39%, and VWC32%) was divided into three blocks, and each block was randomly populated with ten plants. Differences were assessed via one-way analysis of variance (ANOVA) using Statgraphics Centurion (v.XVI, StatPoint Technologies, Inc., Warrenton, VA, USA). When the ANOVA indicated significant effects, means were separated by the Least Significant Difference (LSD) test. Plotting was performed with the SigmaPlot program (v.14.5, Systat Software Inc., San Jose, CA, USA).

3. Results and Discussion

3.1. Water Consumption and Water-Use Efficiency

Hebe consumed less water when the substrate moisture decreased (Table 2), a pattern that has been reported in many other species exposed to a water deficit [1,10,42,43]. In this experiment, evapotranspiration equaled the water consumption per day and per plant since no leaching was produced during irrigation and, therefore, water consumption was entirely due to evapotranspiration. Consequently, evapotranspiration varied in the same proportion as water consumption (Table 2). The reduction in water consumption can be explained considering that evaporation losses occur mainly in the outermost layer of the substrate [44]. As humidity decreases, the outermost layer of the substrate dries out and the rate of evaporative water loss is reduced. Kool et al. [45] and Navarro et al. [46] indicated that water loss through evaporation represented 30% or more of the evapotranspiration in other ornamental shrubs. Additionally, transpiration was also diminished by other factors, such as growth reduction, stomatal regulation, and morphological changes [47].
In addition to reducing water consumption, low substrate moisture improved the water-use efficiency of Hebe by 8% in VWC39% and 45% in VWC32%. The water-use efficiency increased because water consumption was reduced more than plant growth, and Hebe required less water to produce one unit of dry weight. In our experiment, the water-use efficiency was generally high since there was no leaching, and water losses were entirely due to evapotranspiration. The lack of leaching also implied a minimal environmental impact since no water was wasted and no chemical fertilizers were leached.

3.2. Growth and Development

The dry weights of the Hebe plants decreased significantly with lower substrate moisture (Table 3). Growth decline is one of the first adaptive responses to a water deficit [48], which is usually followed by a decline in transpiration [49,50]. Although this reduction affected all plant organs (leaves, stems, and roots), the leaves were the least affected compared with the roots and stems (Table 3). Nevertheless, all dry weight values were significantly lower in VWC32% than in VWC39% because the former suffered greater water stress. In particular, the reductions in dry weight in VWC39% were 13%, 19%, and 36% for leaves, stems, and roots, respectively, while in VWC32%, these reductions were 24%, 45%, and 47%, respectively, compared with the control. The difference in the development of root dry weight compared with the aerial dry weight (leaves and stems) resulted in the reduction of the root-to-shoot ratio in the treatments with restricted water availability (Table 3).
The leaf area of Hebe was reduced with decreasing substrate moisture (Table 3). Leaf growth is considered one of the parameters most sensitive to a water deficit [51,52]. This reduction is attributed to an adaptive mechanism that helps to limit water loss through transpiration [53]. Low water availability reduced the specific leaf area of VWC32% plants (Table 3), which is a behavior that has been observed in other species under a water deficit [54,55,56]. Lower SLA corresponds to thicker and/or denser leaf blades, resulting in improved drought resistance due to lower transpiration rates [13]. Microscopic measurements confirmed the increase in leaf blade thickness suggested by the decrease in SLA in VWC32%, as is discussed in the following section.
SPAD values in VWC32% were significantly reduced compared with the control (Table 3), which could suggest a loss of leaf chlorophyll. However, this reduction in chlorophyll was not visually apparent. The absence of significant effects in the colorimetry study (data not shown) confirmed the absence of yellowing and necrosis in the leaves; therefore, the impact of the water deficit on chlorophyll content was not large.
Plants in VWC32% were shorter and narrower than control plants, whereas those in VWC39% only decreased in width (Table 3). The differences in width could be related to an overall reduction in the number of shoots, while the reduction in plant height could be driven by a decline in leaf water potential since small reductions in water potential affect cell expansion [57]. However, under less water-limiting conditions (VWC39%), water stress was not sufficient to affect plant height (Table 3).
Only VWC32% plants reduced both the number of stems and the number of flowering stems. Burnett and van Iersel [42] found a directly proportional relationship between the number of shoots and substrate moisture in Gaura lindheimeri. In other shrubs, size was negatively correlated with substrate moisture [58,59]. Gradual leaf drop is an adaptation mechanism in response to a water deficit [60], which attempts to maximize photosynthetic activity by concentrating nutrients and resources on fewer leaves. Although leaf abscission was observed in several species under a water deficit [61,62], in our study, none of the three treatments promoted leaf abscission.
The influence of low moisture substrate on flowering capacity is well established in ornamental species, such as carnations, petunias, impatiens, and geraniums [3,13,63,64]. In our study, while VWC39% plants did not modify their number of flowering stems, the same parameter was considerably reduced in VWC32% plants. Zhen and Burnett [1] noted the inhibition of flowering stems in Lavandula when substrate moisture was lower than 20%. In this study, 32% VWC was sufficient to reduce the presence of flowers in Hebe. However, this does not have a major impact from an ornamental point of view since this species has scarce and short-lived flowers.

3.3. Leaf Anatomy Changes

Hebe leaves in the control group presented a cross-sectional structure in which the palisade parenchyma was more developed than the spongy parenchyma, the upper epidermis was thicker than the lower epidermis, and both cuticles had similar thickness (Table 4). Only VWC32% significantly increased the total leaf thickness compared with the control. In addition, VWC32% decreased the proportion of spongy parenchyma in favor of thicker palisade parenchyma and increased the thickness of the lower cuticle and lower epidermis. On the other hand, VWC39% increased the thickness of the lower epidermis and lower cuticle compared with the control (Table 4).
As noted above, morphological adaptations to a water deficit modulated transpiration and photosynthesis. The sensitivity of both processes may not necessarily be identical. For instance, an increase in leaf thickness will decrease transpiration while increasing photosynthesis [65,66]. Transpiration occurs not only through the stomata but also through the cuticle [67]. In this sense, Holmgren et al. [3] reported that, depending on the species, water loss through the cuticle is 1.7 to 28.6% of that through the stomata. The characteristics of Hebe leaves (fleshy and with a waxy cuticle) suggest a good aptitude for restricting non-stomatal water losses. Thick leaves have higher photosynthetic activity per unit weight because they have a greater density of pigments, proteins, and other metabolites [54]. Moreover, thick leaves have a higher SLA and, therefore, less transpiration surface area exposed to the air [68]. The leaves in VWC32% were the thickest and showed more developed palisade parenchyma than spongy parenchyma. Since the palisade parenchyma is richer in chloroplasts than the spongy parenchyma, a reduction in the latter would make it easier for CO2 to reach the chloroplasts present in the palisade parenchyma [69,70]. This anatomical response would imply an increase in chloroplast density in order to adapt the photosynthetic efficiency of Hebe to the new stress conditions.

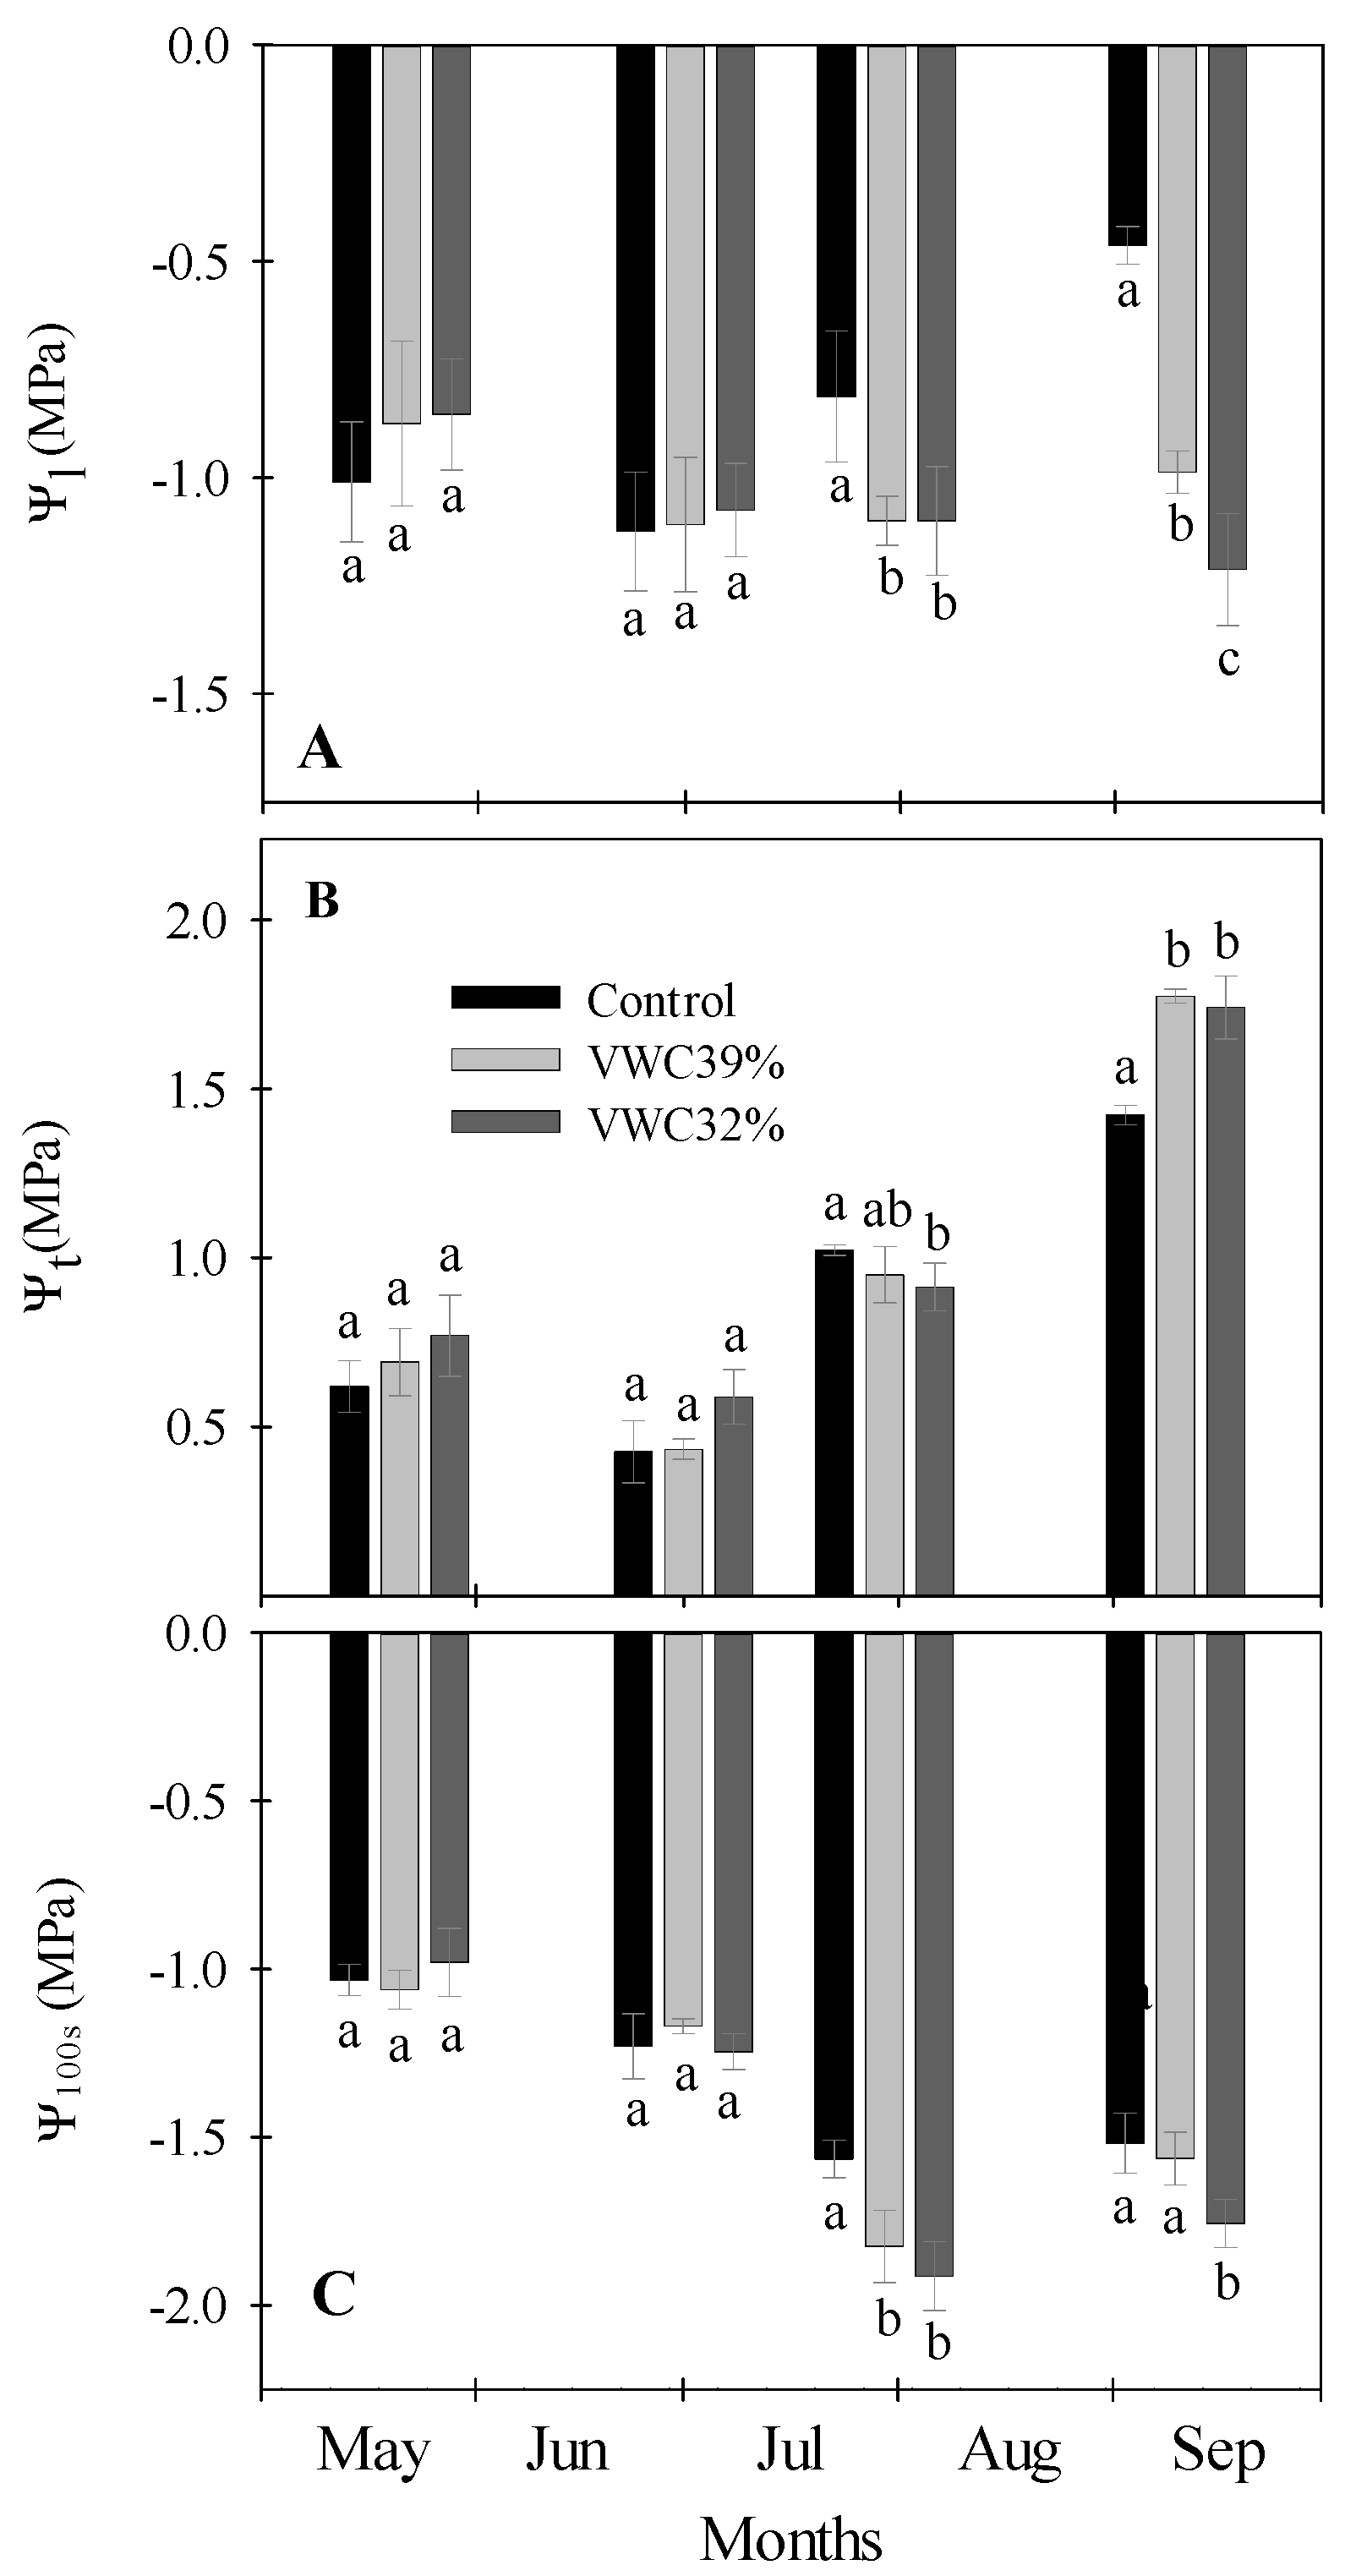
3.4. Plant Water Relations

Five months after the start of the experiment (May), all treatments had similar leaf water potentials (Ψl′s) (Figure 4A); however, in July the treatments with reduced water availability started to show lower Ψl values than the control. These differences became more apparent at the end of the experiment (September) when the differences in Ψl between all treatments became significant (Figure 4A). The turgor potentials (Ψt′s) were similar for all treatments until July (Figure 4B) but increased at the end of the experiment in VWC39% and VWC32%. Decreases in osmotic potentials at full turgor (Ψ100s′s) were observed in the last two measurements of the experiment in the VWC32% and VWC39% treatments (Figure 4C), indicating the plants under a water deficit developed an osmotic adjustment.
The measurements of Ψl indicated that Hebe took around six months to change its water status (Figure 4A), which highlights its good adaptation to water stress. The evolution of Ψ100s indicated that the plants developed osmotic adjustment to maintain leaf turgor during the warmer and drier summer. When comparing treatments, it can be observed that an osmotic regulation was promoted by decreasing the water availability. This suggested that Hebe increased the concentration of osmoregulatory solutes to prevent turgor loss. However, this osmotic adjustment process itself can damage cell organelles or restrict growth since plant solutes are retained and cannot be used for other cellular processes [20,71]. Although it has been suggested that osmotic adjustments may have a positive effect on the esthetics of plants subjected to a water deficit [72], this did not contribute to the maintenance of Hebe inflorescences in the most severe treatment. However, this osmotic adjustment probably contributed to the maintenance of leaf quality in both the VWC39% and VWC32% treatments. Osmotic adjustments also play a role in reducing the turgor loss point of plants and maintaining turgor, even at low water potentials [73]. The Ψtlp values of Hebe were −1.62 ± 0.13 MPa for the control, −1.67 ± 0.09 MPa for VWC39%, and −1.89 ± 0.11 MPa for VWC32%. The turgor loss points were lower than the Ψl’s values (Figure 4A), which indicates that the leaves did not lose their turgor under the amount of water stress applied in this experiment. This decrease suggested that Hebe plants adapted to the water stress by lowering the Ψtlp.

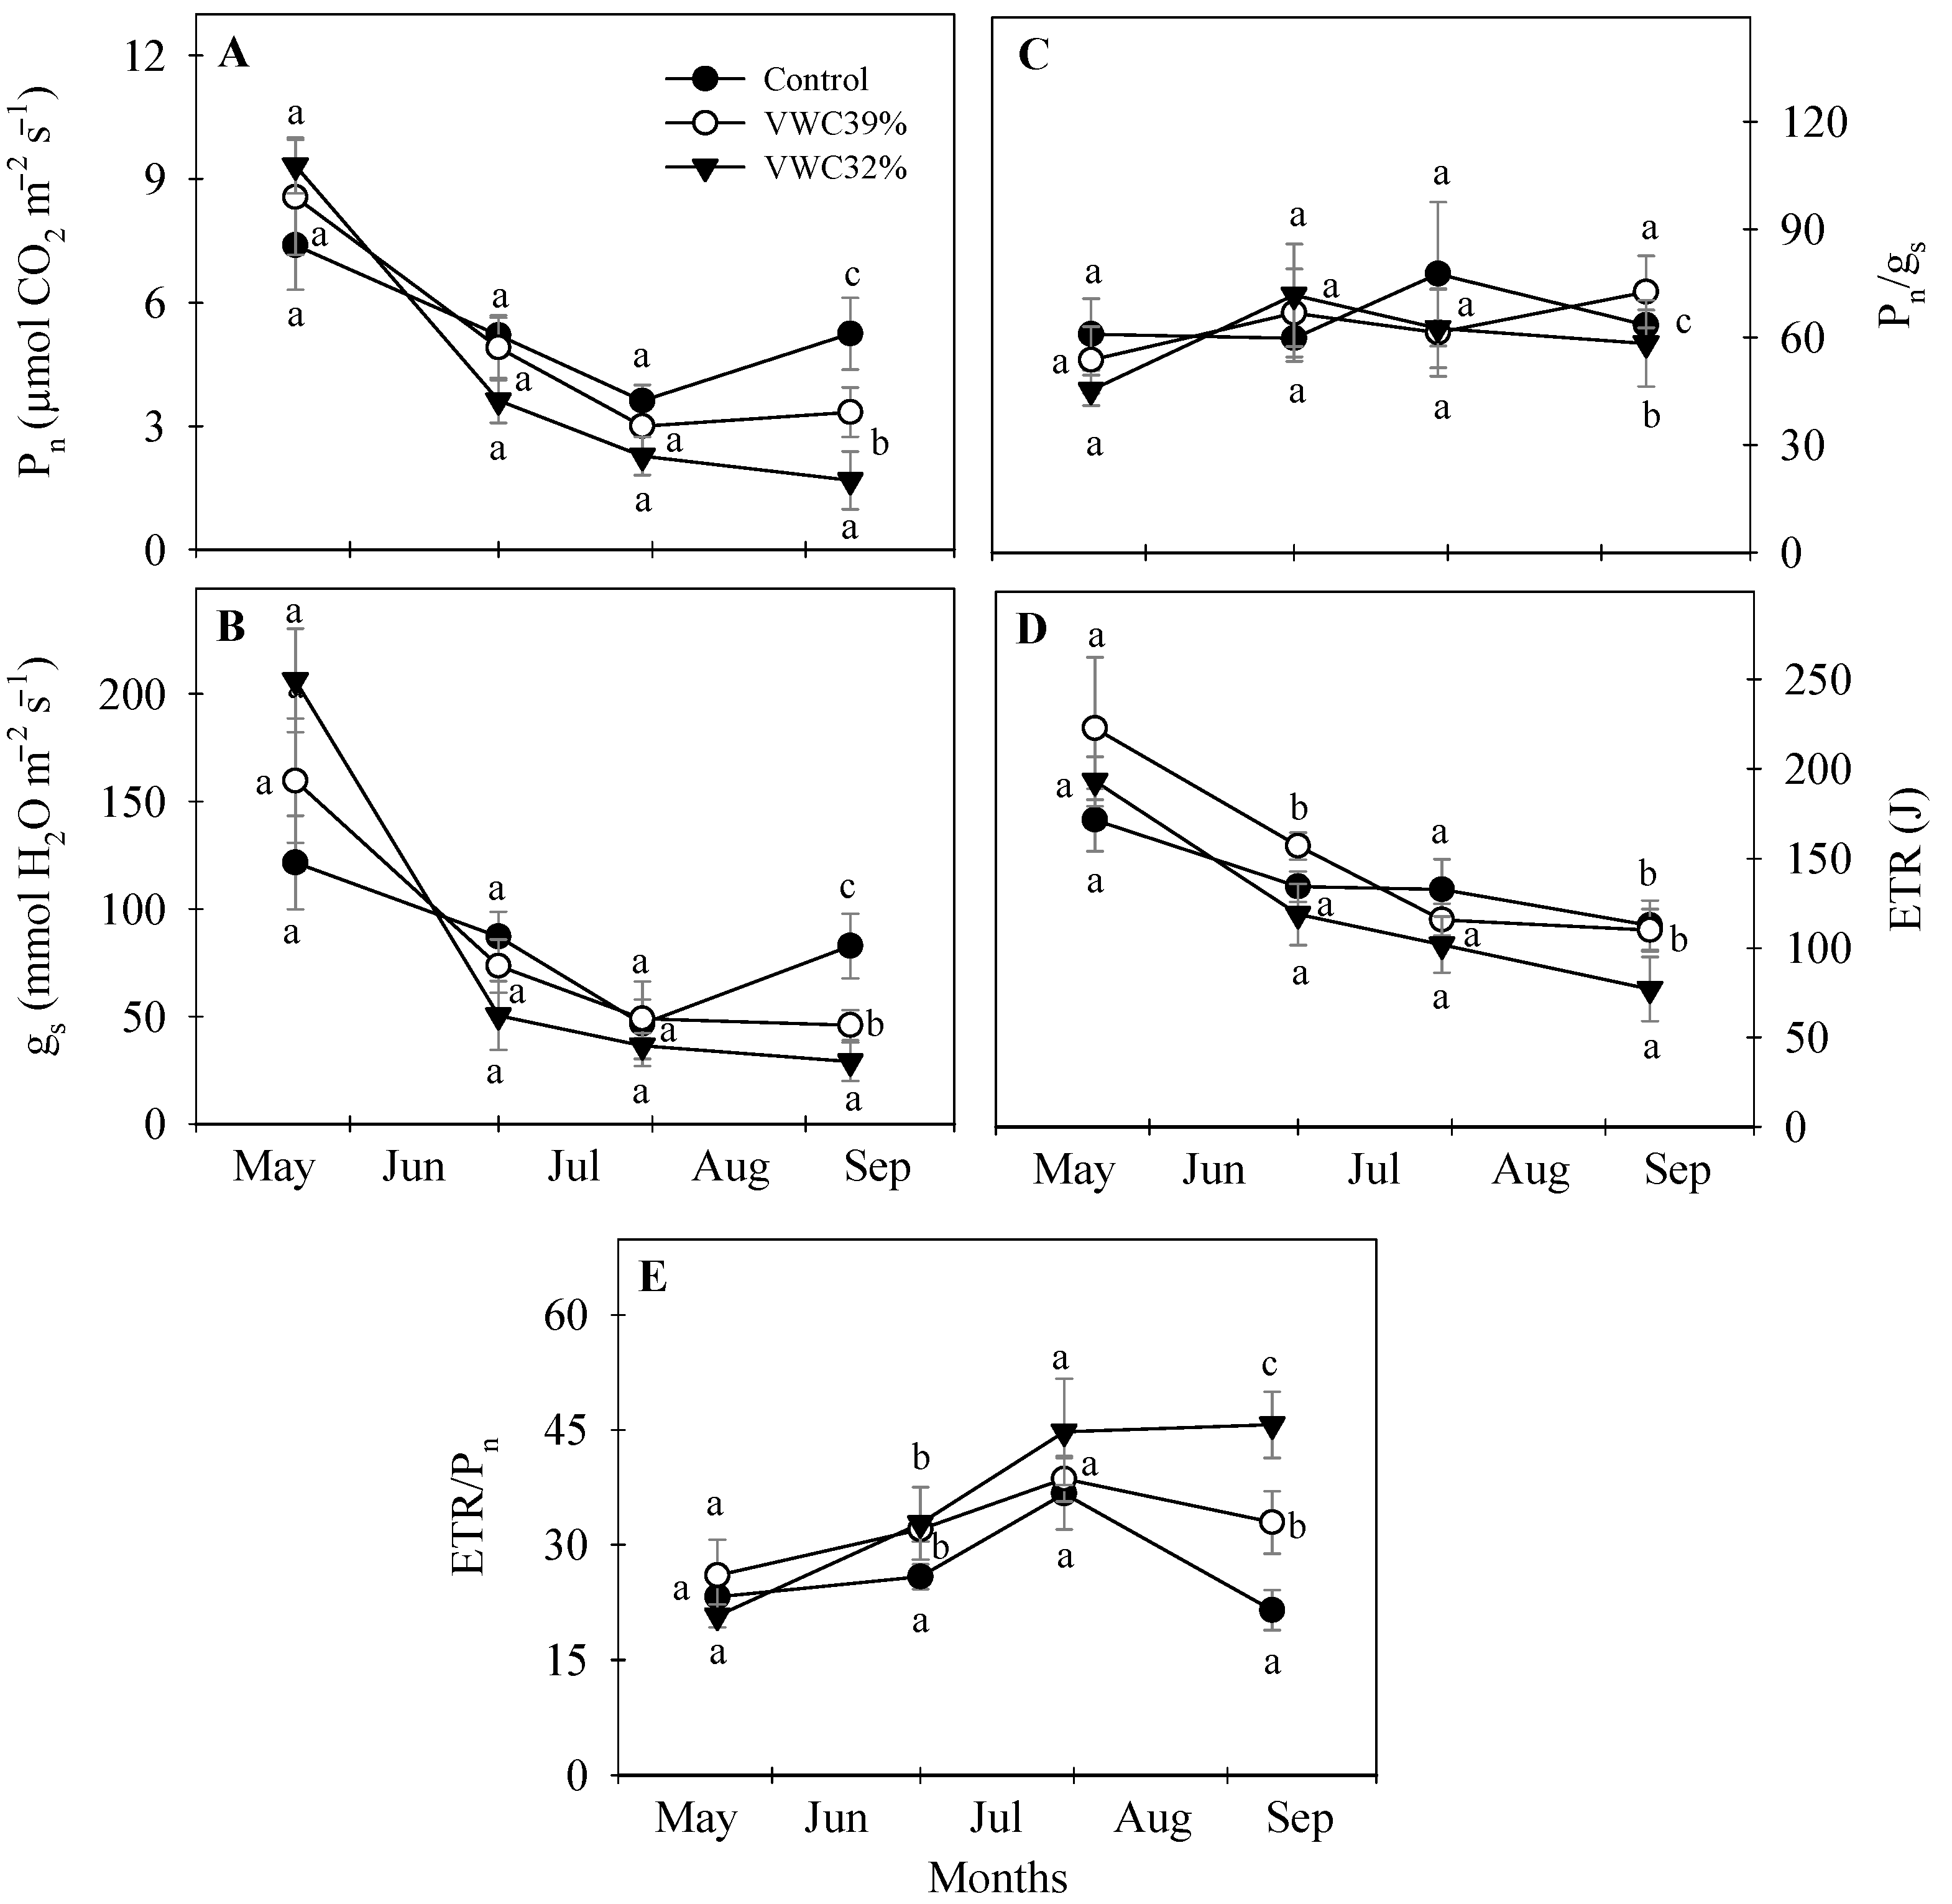
3.5. Leaf Gas Exchange

The photosynthetic activity of Hebe decreased from the beginning of the experiment, and only at the end of the experiment were there significant differences between the treatments (Figure 5A). Stomatal conductance (gs) behaved similarly to Pn (Figure 5B) and consequently the evolution of the Pn/gs ratio did not change during the experiment (Figure 5C). While the ETR decreased throughout the experiment (Figure 5D), the ETR/Pn ratio increased until July (Figure 5E), indicating that the ETR decreased less than Pn. Only at the end of the experiment were there statistically significant differences between all treatments regarding the ETR/Pn ratio (Figure 5E).
The decrease in Pn with increasing summer temperature showed the sensitivity of this process to heat [74]. Given the strong correlation between gs and Pn, it is likely that the influence of environmental conditions on gs controlled Pn values via the stomatal aperture. The strong relationship between these two variables was evident from the stability of the Pn/gs ratio observed during the experiment. Stomatal closure in the face of a water deficit is a common physiological behavior that usually leads to parallel decreases in Pn and gs [75,76,77]. The substrate moisture had a smaller effect than the temperature on gas exchange parameters because only a small reduction in Pn and gs was observed in VWC39% and VWC32% at the end of the experimental period. At this time, the plants that received less water were more sensitive to environmental stress, as reflected by the lower Ψl values (Figure 4A).
The ETR gradually fell with temperature in a similar pattern to Pn (Figure 5D). Silim et al. [78] found lower ETR values at 27 °C in cultivated Populus sp. than at 19 °C, and other authors have suggested that water stress can damage the photochemical apparatus of plants [79]. For example, Singal et al. [80] found a decrease in the activity of many enzymes of the Calvin cycle in plants subjected to water stress. In the case of Hebe, the evolution of ETR and Pn caused the ETR/Pn ratio to increase with temperature throughout the experiment. Especially at the end of the experiment, there was a clear difference in the ETR/Pn ratio among the three irrigation treatments (Figure 5E).

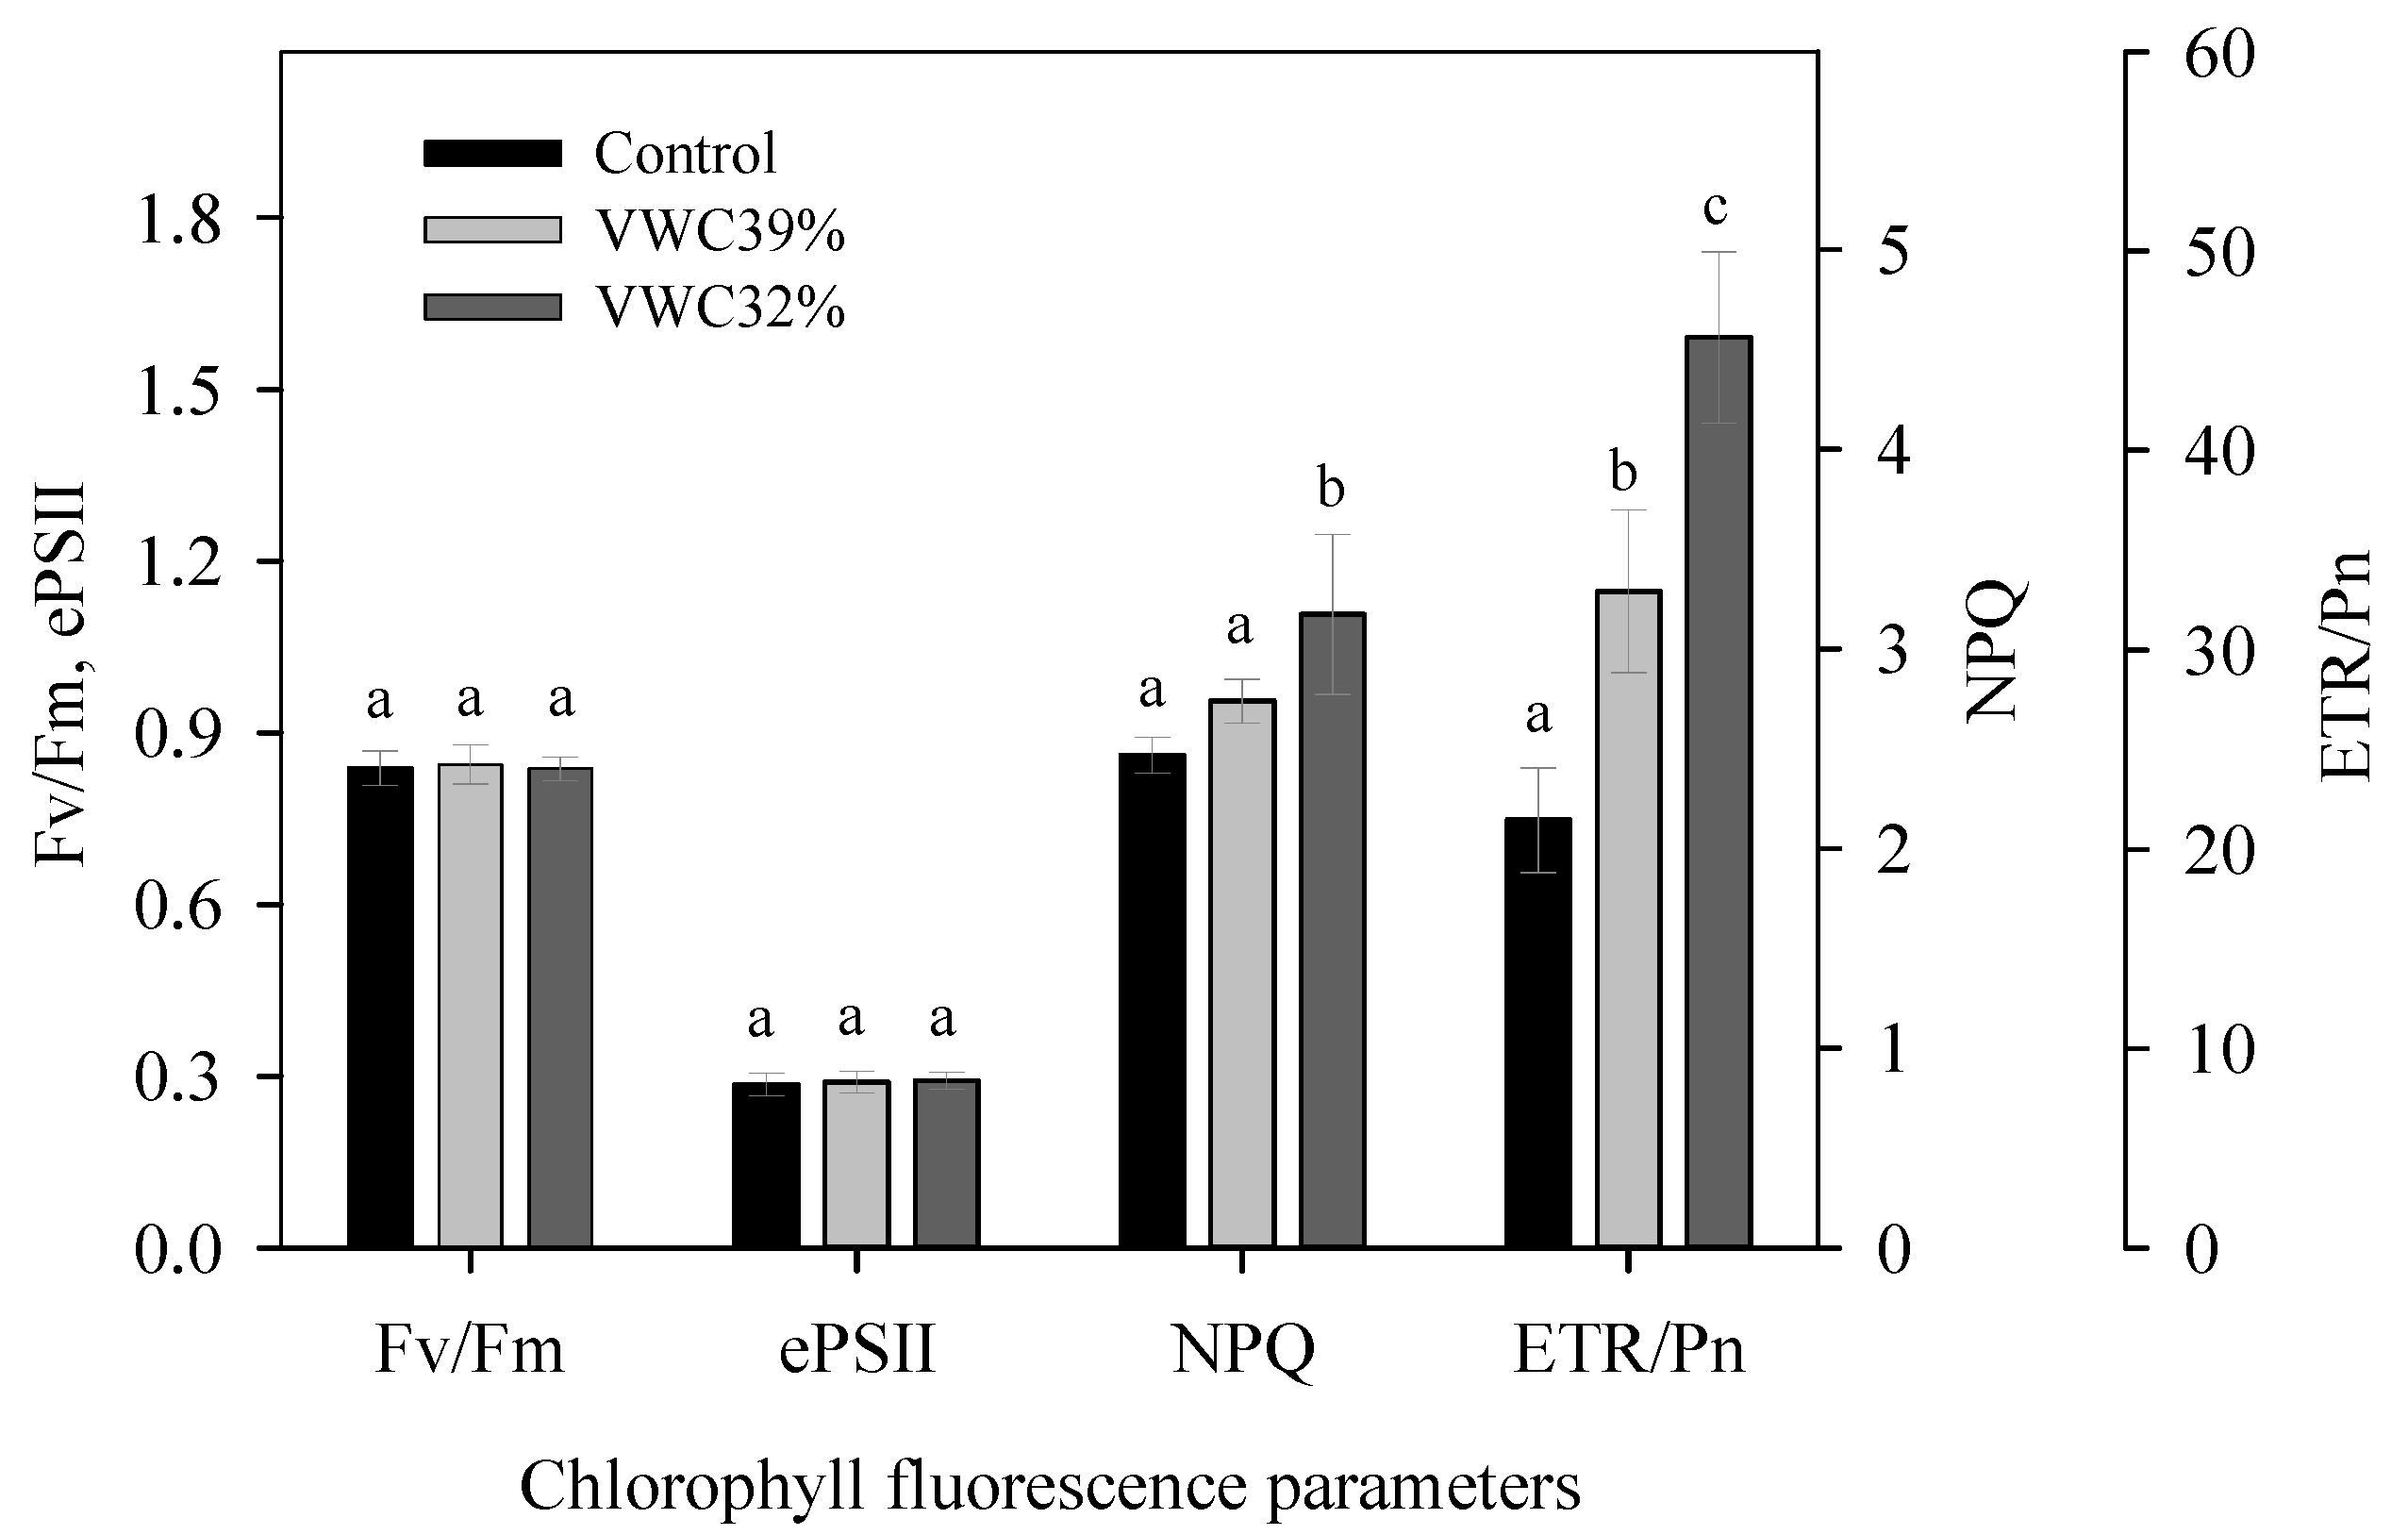
3.6. Chlorophyll Fluorescence

The maximum quantum yield of the photosystem II (Fv/Fm) and the effective quantum yield (ePSII) were similar in all treatments at the end of the experiment (Figure 6). However, the non-photochemical quenching (NPQ) increased in VWC32%, while the ETR/Pn ratio increased in both VWC39% and VWC32%. An increase in the ETR/Pn ratio is an indication that some of the photochemical excitation energy was used in other non-CO2 assimilatory processes [81]. Since the stability of the Fv/Fm and ePSII ratios indicated good photochemical functioning [82], this excess energy was probably dissipated as heat. This hypothesis was supported by the increase in NPQ (Figure 6), which is a defense mechanism that dissipates the excess energy and prevents its photochemical apparatus from being damaged under the stress conditions tested in this work [83].

3.7. Substrate EC and Plant Mineral Content

The EC1:2 of the substrate at the end of the experimental period was similar between the treatments, with 1.98 ± 0.19, 2.04 ± 0.20, and 2.11 ± 0.22 dS m−1 in the control, VWC39%, and VWC32%, respectively. Not leaching plant pots can cause salts to accumulate in the substrate and, depending on the EC of the irrigation solution, salinity may reach harmful values at the end of the experiment that can impair growth and cause leaf damage [84,85]. EC1:2 values around 2 dS m−1 have been related to reduced growth, wilting, leaf necrosis, and chlorosis in many crops [86]; thus, Hebe may be considered moderately tolerant to salinity.
In general, the plant nutrient content increased with decreasing substrate moisture, except for calcium and magnesium, which practically did not change (Table 5). Reduced substrate moisture often produces varied effects on the mineral content of leaves [87]. In our experiment, lower substrate moisture increased N, K+, P, Cl, and Na+, especially in VWC32% plants.
The nitrogen content increased in the stems and roots but did not change in the leaves. It was suggested that small changes in tissue nitrogen can decisively affect plant growth [88], and in this sense, the slight increase in nitrogen in VWC32% plants could have had a positive effect on plant growth. A water deficit promoted an accumulation of phosphorus only in the stems (Table 5). The aerial part of Hebe accumulated potassium when the substrate moisture decreased, and only the roots of VWC32% plants increased their potassium content. This increase suggests that Hebe can efficiently incorporate potassium into its tissues under an irrigation regime at low substrate moisture. Potassium has traditionally been associated with good plant quality [89], better resistance to phytosanitary problems [90], and the adjustment of the osmotic potential of plant tissues [24].
Sodium and chloride behaved similarly in response to the decreasing substrate moisture, where the content of both ions increased in the aerial part and decreased in the roots (Table 5). This trend suggested that lower substrate moisture promotes the translocation of saline ions from the roots to the shoot [91]. This can be explained by the fact that plants need to osmotically adjust in response to a water deficit and maintain turgor and turgor-dependent processes. It is worth mentioning that the highest Cl and Na+ concentrations in Hebe leaves (30 and 5.5 mg g−1) did not produce visual leaf damage. In this sense, Bañón et al. [82] reported similar salt concentrations in the leaves of Lantana camara that also did not cause leaf damage.

4. Conclusions

Hebe showed significant differences in the physiological and morphological responses depending on the substrate moisture. Hebe plants at 39% VWC improved water-use efficiency without substantially reducing growth and esthetics. In contrast, further reduction in water availability negatively affected the flowering and growth of Hebe plants at 32% VWC. Low water availability decreased the photosynthetic activity due to a decrease in stomatal conductance without damaging the photochemical apparatus. The low substrate moisture favored the accumulation of osmoregulatory solutes, especially Cl, Na+, and K+, which contributed to the maintenance of plant turgor and decreased their leaf turgor loss point. Overall, Hebe andersoni cv. Variegata can be considered as a good candidate for improving the water-use efficiency and the sustainability of nursery production, as it can grow successfully without leaching and at constant low substrate moisture.

Author Contributions

Conceptualization, M.J.S.-B., J.J.A. and S.B.; data curation, S.B. and M.F.O.; formal analysis, D.B. and S.B.; funding acquisition, M.J.S.-B. and M.F.O.; investigation, D.B., B.L. and S.B.; methodology, D.B. and B.L.; project administration, M.J.S.-B. and M.F.O.; resources, M.J.S.-B.; supervision, M.F.O. and J.J.A.; visualization, D.B. and B.L.; writing—original draft, D.B.; writing—review and editing, M.J.S.-B., J.J.A. and S.B. All authors have read and agreed to the published version of the manuscript.

Funding

This research was funded by the Ministry of Science, Innovation, and Universities of Spain; the European Regional Development Fund (RTI2018-093997-B-I00).

Institutional Review Board Statement

Not applicable.

Informed Consent Statement

Not applicable.

Data Availability Statement

Data sharing is not applicable.

Conflicts of Interest

The authors declare no conflict of interest. The funders had no role in the design of the study; in the collection, analyses, or interpretation of data; in the writing of the manuscript; or in the decision to publish the results.

References

  1. Zhen, S.; Burnett, S.E. Effects of Substrate Volumetric Water Content on English Lavender Morphology and Photosynthesis. HortScience 2015, 50, 909–915. [Google Scholar] [CrossRef]
  2. Nemali, K.S.; van Iersel, M.W. An Automated System for Controlling Drought Stress and Irrigation in Potted Plants. Sci. Hortic. 2006, 110, 292–297. [Google Scholar] [CrossRef]
  3. Álvarez, S.; Navarro, A.; Bañón, S.; Sánchez-Blanco, M.J. Regulated Deficit Irrigation in Potted Dianthus Plants: Effects of Severe and Moderate Water Stress on Growth and Physiological Responses. Sci. Hortic. 2009, 122, 579–585. [Google Scholar] [CrossRef] [Green Version]
  4. Singh, V.K.; Singh, Y.; Kumar, P. Diseases of Ornamental Plants and Their Management. In Eco-Friendly Innovative Approaches in Plant Disease Management; International Book Distributors and Publisher: New Delhi, India, 2012; pp. 543–572. ISBN 81-7089-375-5. [Google Scholar]
  5. Álvarez, S.; Gómez-Bellot, M.J.; Castillo, M.; Bañón, S.; Sánchez-Blanco, M.J. Osmotic and Saline Effect on Growth, Water Relations, and Ion Uptake and Translocation in Phlomis Purpurea Plants. Environ. Exp. Bot. 2012, 78, 138–145. [Google Scholar] [CrossRef] [Green Version]
  6. Mangiafico, S.S.; Newman, J.; Merhaut, D.J.; Gan, J.; Faber, B.; Wu, L. Nutrients and Pesticides in Stormwater Runoff and Soil Water in Production Nurseries and Citrus and Avocado Groves in California. HortTechnology 2009, 19, 360–367. [Google Scholar] [CrossRef] [Green Version]
  7. Ucar, Y.; Kazaz, S.; Eraslan, F.; Baydar, H. Effects of Different Irrigation Water and Nitrogen Levels on the Water Use, Rose Flower Yield and Oil Yield of Rosa Damascena. Agric. Water Manag. 2017, 182, 94–102. [Google Scholar] [CrossRef]
  8. Rouphael, Y.; Raimondi, G.; Caputo, R.; Pascale, S.D. Fertigation Strategies for Improving Water Use Efficiency and Limiting Nutrient Loss in Soilless Hippeastrum Production. HortScience 2016, 51, 684–689. [Google Scholar] [CrossRef] [Green Version]
  9. Belayneh, B.E.; Lea-Cox, J.D.; Lichtenberg, E. Costs and Benefits of Implementing Sensor-Controlled Irrigation in a Commercial Pot-in-Pot Container Nursery. HortTechnology 2013, 23, 760–769. [Google Scholar] [CrossRef] [Green Version]
  10. Iersel, M.W.V.; Dove, S.; Kang, J.-G.; Burnett, S.E. Growth and Water Use of Petunia as Affected by Substrate Water Content and Daily Light Integral. HortScience 2010, 45, 277–282. [Google Scholar] [CrossRef] [Green Version]
  11. Montesano, F.F.; van Iersel, M.W.; Boari, F.; Cantore, V.; D’Amato, G.; Parente, A. Sensor-Based Irrigation Management of Soilless Basil Using a New Smart Irrigation System: Effects of Set-Point on Plant Physiological Responses and Crop Performance. Agric. Water Manag. 2018, 203, 20–29. [Google Scholar] [CrossRef]
  12. Caser, M.; Lovisolo, C.; Scariot, V. The Influence of Water Stress on Growth, Ecophysiology and Ornamental Quality of Potted Primula Vulgaris ‘Heidy’ Plants. New Insights to Increase Water Use Efficiency in Plant Production. Plant Growth Regul. 2017, 83, 361–373. [Google Scholar] [CrossRef] [Green Version]
  13. Sánchez-Blanco, M.J.; Ortuño, M.F.; Bañon, S.; Álvarez, S. Deficit Irrigation as a Strategy to Control Growth in Ornamental Plants and Enhance Their Ability to Adapt to Drought Conditions. J. Hortic. Sci. Biotechnol. 2019, 94, 137–150. [Google Scholar] [CrossRef]
  14. Toscano, S.; Ferrante, A.; Romano, D. Response of Mediterranean Ornamental Plants to Drought Stress. Horticulturae 2019, 5, 6. [Google Scholar] [CrossRef] [Green Version]
  15. Tribulato, A.; Toscano, S.; Di Lorenzo, V.; Romano, D. Effects of Water Stress on Gas Exchange, Water Relations and Leaf Structure in Two Ornamental Shrubs in the Mediterranean Area. Agronomy 2019, 9, 381. [Google Scholar] [CrossRef] [Green Version]
  16. Toscano, S.; Ferrante, A.; Tribulato, A.; Romano, D. Leaf Physiological and Anatomical Responses of Lantana and Ligustrum Species under Different Water Availability. Plant Physiol. Biochem. 2018, 127, 380–392. [Google Scholar] [CrossRef]
  17. Rafi, Z.N.; Kazemi, F.; Tehranifar, A. Morpho-Physiological and Biochemical Responses of Four Ornamental Herbaceous Species to Water Stress. Acta Physiol. Plant 2018, 41, 7. [Google Scholar] [CrossRef]
  18. Giordano, M.; Petropoulos, S.A.; Cirillo, C.; Rouphael, Y. Biochemical, Physiological, and Molecular Aspects of Ornamental Plants Adaptation to Deficit Irrigation. Horticulturae 2021, 7, 107. [Google Scholar] [CrossRef]
  19. Fascella, G.; Maggiore, P.; Demma Carà, M.; Zizzo, G.V. Growth and Flowering Response of Euphorbia × Lomi Poysean Cultivars under Two Irrigation Regimes. Acta Hortic. 2011, 893, 939–943. [Google Scholar] [CrossRef]
  20. Álvarez, S.; Gómez-Bellot, M.J.; Acosta-Motos, J.R.; Sánchez-Blanco, M.J. Application of Deficit Irrigation in Phillyrea Angustifolia for Landscaping Purposes. Agric. Water Manag. 2019, 218, 193–202. [Google Scholar] [CrossRef]
  21. Castillo-Campohermoso, M.A.; Broetto, F.; Rodríguez-Hernández, A.M.; de Abril Alexandra Soriano-Melgar, L.; Mounzer, O.; Sánchez-Blanco, M.J. Plant-Available Water, Stem Diameter Variations, Chlorophyll Fluorescence, and Ion Content in Pistacia Lentiscus under Salinity Stress. Terra Latinoam. 2020, 38, 103–111. [Google Scholar] [CrossRef]
  22. Wang, Y.; Sun, Y.; Niu, G.; Deng, C.; Wang, Y.; Gardea-Torresdey, J. Growth, Gas Exchange, and Mineral Nutrients of Ornamental Grasses Irrigated with Saline Water. HortScience 2019, 54, 1840–1846. [Google Scholar] [CrossRef] [Green Version]
  23. Steudle, E. Water Uptake by Roots: Effects of Water Deficit. J. Exp. Bot. 2000, 51, 1531–1542. [Google Scholar] [CrossRef] [PubMed] [Green Version]
  24. Marschner, P.; Rengel, Z. Chapter 12—Nutrient Availability in Soils. In Marschner’s Mineral Nutrition of Higher Plants (Third Edition); Marschner, P., Ed.; Academic Press: San Diego, CA, USA, 2012; pp. 315–330. ISBN 978-0-12-384905-2. [Google Scholar]
  25. Álvarez, S.; Rodríguez, P.; Broetto, F.; Sánchez-Blanco, M.J. Long Term Responses and Adaptive Strategies of Pistacia Lentiscus under Moderate and Severe Deficit Irrigation and Salinity: Osmotic and Elastic Adjustment, Growth, Ion Uptake and Photosynthetic Activity. Agric. Water Manag. 2018, 202, 253–262. [Google Scholar] [CrossRef] [Green Version]
  26. Demetriou, G.; Neonaki, C.; Navakoudis, E.; Kotzabasis, K. Salt Stress Impact on the Molecular Structure and Function of the Photosynthetic Apparatus—The Protective Role of Polyamines. Biochim. Biophys. Acta—Bioenerg. 2007, 1767, 272–280. [Google Scholar] [CrossRef] [Green Version]
  27. Warrington, I.J.; Southward, R.C. Seasonal Frost Tolerance of Hebe Species and Cultivars. N. Z. J. Crop Hortic. Sci. 1995, 23, 437–445. [Google Scholar] [CrossRef] [Green Version]
  28. Kristensen, L.N. The genus Hebe: A botanical report. Tidsskr. Planteavls 1989, 93, 369–437. [Google Scholar]
  29. de Boodt, M.; Verdonck, O.; Cappaert, I. Determination and Study of the Water Availability of Substrates for Ornamental Plant Growing. Acta Hortic. 1974, 1, 51–58. [Google Scholar] [CrossRef]
  30. Arguedas Rodríguez, F.R. Calibrating Capacitance Sensors to Estimate Water Content, Matric Potential, and Electrical Conductivity in Soilless Substrates. Master’s Thesis, University of Maryland, College Park, MD, USA, 2009. [Google Scholar]
  31. Steiner, J.L.; Howell, T.A.; Schneider, A.D. Lysimetric Evaluation of Daily Potential Evapotranspiration Models for Grain Sorghum. Agron. J. 1991, 83, 240–247. [Google Scholar] [CrossRef]
  32. Gaskin, G.J.; Miller, J.D. Measurement of Soil Water Content Using a Simplified Impedance Measuring Technique. J. Agric. Eng. Res. 1996, 63, 153–159. [Google Scholar] [CrossRef]
  33. Valdés, R.; Miralles, J.; Ochoa, J.; Sánchez-Blanco, M.J.; Bañón Arias, S. Saline Reclaimed Wastewater Can Be Used to Produce Potted Weeping Fig (Ficus Benjamina L.) with Minimal Effects on Plant Quality. Span. J. Agric. Res. 2012, 10, 1167. [Google Scholar] [CrossRef] [Green Version]
  34. Miralles, J.; van Iersel, M.W. A Calibrated Time Domain Transmissometry Soil Moisture Sensor Can Be Used for Precise Automated Irrigation of Container-Grown Plants. HortScience 2011, 46, 889–894. [Google Scholar] [CrossRef] [Green Version]
  35. Easlon, H.M.; Bloom, A.J. Easy Leaf Area: Automated Digital Image Analysis for Rapid and Accurate Measurement of Leaf Area. Appl. Plant Sci. 2014, 2, 1400033. [Google Scholar] [CrossRef]
  36. Sonneveld, C.; van den Ende, J. Soil Analysis by Means of a 1:2 Volume Extract. Plant Soil 1971, 35, 505–516. [Google Scholar] [CrossRef]
  37. Petruzzellis, F.; Savi, T.; Bacaro, G.; Nardini, A. A Simplified Framework for Fast and Reliable Measurement of Leaf Turgor Loss Point. Plant Physiol. Biochem. 2019, 139, 395–399. [Google Scholar] [CrossRef] [Green Version]
  38. Scholander, P.F.; Bradstreet, E.D.; Hemmingsen, E.A.; Hammel, H.T. Sap Pressure in Vascular Plants. Science 1965, 148, 339–346. [Google Scholar] [CrossRef]
  39. Gómez-Bellot, M.J.; Nortes, P.A.; Sánchez-Blanco, M.J.; Ortuño, M.F. Sensitivity of Thermal Imaging and Infrared Thermometry to Detect Water Status Changes in Euonymus Japonica Plants Irrigated with Saline Reclaimed Water. Biosyst. Eng. 2015, 133, 21–32. [Google Scholar] [CrossRef]
  40. Sheng, M.; Tang, M.; Chen, H.; Yang, B.; Zhang, F.; Huang, Y. Influence of Arbuscular Mycorrhizae on Photosynthesis and Water Status of Maize Plants under Salt Stress. Mycorrhiza 2008, 18, 287–296. [Google Scholar] [CrossRef]
  41. Brestic, M.; Zivcak, M. PSII Fluorescence Techniques for Measurement of Drought and High Temperature Stress Signal in Crop Plants: Protocols and Applications. In Molecular Stress Physiology of Plants; Rout, G.R., Das, A.B., Eds.; Springer: Berlin/Heidelberg, Germany, 2013; pp. 87–131. ISBN 978-81-322-0807-5. [Google Scholar]
  42. Burnett, S.E.; van Iersel, M.W. Morphology and Irrigation Efficiency of Gaura Lindheimeri Grown with Capacitance Sensor-Controlled Irrigation. HortScience 2008, 43, 1555–1560. [Google Scholar] [CrossRef] [Green Version]
  43. Garland, K.F.; Burnett, S.E.; Day, M.E.; van Iersel, M.W. Influence of Substrate Water Content and Daily Light Integral on Photosynthesis, Water Use Efficiency, and Morphology of Heuchera Americana. J. Am. Soc. Hort. Sci. 2012, 137, 57–67. [Google Scholar] [CrossRef] [Green Version]
  44. Paço, T.A.; Ferreira, M.I.; Rosa, R.D.; Paredes, P.; Rodrigues, G.C.; Conceição, N.; Pacheco, C.A.; Pereira, L.S. The Dual Crop Coefficient Approach Using a Density Factor to Simulate the Evapotranspiration of a Peach Orchard: SIMDualKc Model versus Eddy Covariance Measurements. Irrig. Sci. 2012, 30, 115–126. [Google Scholar] [CrossRef]
  45. Kool, D.; Agam, N.; Lazarovitch, N.; Heitman, J.L.; Sauer, T.J.; Ben-Gal, A. A Review of Approaches for Evapotranspiration Partitioning. Agric. For. Meteorol. 2014, 184, 56–70. [Google Scholar] [CrossRef]
  46. Navarro, A.; Bañon, S.; Olmos, E.; Sánchez-Blanco, M.J. Effects of Sodium Chloride on Water Potential Components, Hydraulic Conductivity, Gas Exchange and Leaf Ultrastructure of Arbutus Unedo Plants. Plant Sci. 2007, 172, 473–480. [Google Scholar] [CrossRef]
  47. Waisel, Y.; Eshel, A.; Kafkafi, U. Plant Roots: The Hidden Half, 3rd ed.; Books in soils, plants, and the environment; M. Dekker: New York, NY, USA; Basel, Switzerland, 2002; ISBN 978-0-8247-0631-9. [Google Scholar]
  48. Chaves, M.M.; Oliveira, M.M. Mechanisms Underlying Plant Resilience to Water Deficits: Prospects for Water-Saving Agriculture. J. Exp. Bot. 2004, 55, 2365–2384. [Google Scholar] [CrossRef] [Green Version]
  49. Wu, Y.; Huang, M.; Warrington, D.N. Growth and Transpiration of Maize and Winter Wheat in Response to Water Deficits in Pots and Plots. Environ. Exp. Bot. 2011, 71, 65–71. [Google Scholar] [CrossRef]
  50. Lu, Y.; Ma, D.; Chen, X.; Zhang, J. A Simple Method for Estimating Field Crop Evapotranspiration from Pot Experiments. Water 2018, 10, 1823. [Google Scholar] [CrossRef] [Green Version]
  51. Jones, P.; Jones, J.W.; Allen, L.H., Jr. Seasonal Carbon and Water Balances of Soybeans Grown Under Stress Treatments in Sunlit Chambers. Trans. ASAE 1985, 28, 2021–2028. [Google Scholar] [CrossRef]
  52. Fernández-García, N.; Olmos, E.; Bardisi, E.; García-De la Garma, J.; López-Berenguer, C.; Rubio-Asensio, J.S. Intrinsic Water Use Efficiency Controls the Adaptation to High Salinity in a Semi-Arid Adapted Plant, Henna (Lawsonia Inermis L.). J. Plant Physiol. 2014, 171, 64–75. [Google Scholar] [CrossRef] [PubMed]
  53. Álvarez, S.; Sánchez-Blanco, M.J. Changes in Growth Rate, Root Morphology and Water Use Efficiency of Potted Callistemon Citrinus Plants in Response to Different Levels of Water Deficit. Sci. Hortic. 2013, 156, 54–62. [Google Scholar] [CrossRef] [Green Version]
  54. Liu, F.; Stützel, H. Biomass Partitioning, Specific Leaf Area, and Water Use Efficiency of Vegetable Amaranth (Amaranthus Spp.) in Response to Drought Stress. Sci. Hortic. 2004, 102, 15–27. [Google Scholar] [CrossRef]
  55. del Amor, F.M.; Marcelis, L.F.M. Differential Effect of Transpiration and Ca Supply on Growth and Ca Concentration of Tomato Plants. Sci. Hortic. 2006, 111, 17–23. [Google Scholar] [CrossRef]
  56. Dwyer, J.M.; Hobbs, R.J.; Mayfield, M.M. Specific Leaf Area Responses to Environmental Gradients through Space and Time. Ecology 2014, 95, 399–410. [Google Scholar] [CrossRef] [PubMed]
  57. Taiz, L.; Zeiger, E. (Eds.) Plant Physiology; Sinauer Associates: Sunderland, MA, USA, 2010; ISBN 978-0-87893-565-9. [Google Scholar]
  58. Álvarez, S.; Bañón, S.; Sánchez-Blanco, M.J. Regulated Deficit Irrigation in Different Phenological Stages of Potted Geranium Plants: Water Consumption, Water Relations and Ornamental Quality. Acta Physiol. Plant. 2012, 35, 1257–1267. [Google Scholar] [CrossRef] [Green Version]
  59. Alem, P.; Thomas, P.A.; van Iersel, M.W. Controlled Water Deficit as an Alternative to Plant Growth Retardants for Regulation of Poinsettia Stem Elongation. HortScience 2015, 50, 565–569. [Google Scholar] [CrossRef] [Green Version]
  60. Ammar, A.; Ben Aissa, I.; Mars, M.; Gouiaa, M. Comparative Physiological Behavior of Fig (Ficus Carica L.) Cultivars in Response to Water Stress and Recovery. Sci. Hortic. 2020, 260, 108881. [Google Scholar] [CrossRef]
  61. Giovannelli, A.; Deslauriers, A.; Fragnelli, G.; Scaletti, L.; Castro, G.; Rossi, S.; Crivellaro, A. Evaluation of Drought Response of Two Poplar Clones (Populus x Canadensis Monch “I-214” and P. Deltoides Marsh. ’Dvina’) through High Resolution Analysis of Stem Growth. J. Exp. Bot. 2007, 58, 2673–2683. [Google Scholar] [CrossRef] [Green Version]
  62. Gu, M.; Robbins, J.A.; Rom, C.R. The Role of Ethylene in Water-Deficit Stress Responses in Betula Papyrifera Marsh. HortScience 2007, 42, 1392–1395. [Google Scholar] [CrossRef] [Green Version]
  63. McMichael, B.L.; Jordan, W.R.; Powell, R.D. Abscission Processes in Cotton: Induction by Plant Water Deficit1. Agron. J. 1973, 65, 202–204. [Google Scholar] [CrossRef]
  64. Blanusa, T.; Vysini, E.; Cameron, R.W.F. Growth and Flowering of Petunia and Impatiens: Effects of Competition and Reduced Water Content Within a Container. HortScience 2009, 44, 1302–1307. [Google Scholar] [CrossRef] [Green Version]
  65. Fitter, A.; Hay, R. Introduction. In Environmental Physiology of Plants; Elsevier: Amsterdam, The Netherlands, 2002; pp. 1–20. [Google Scholar]
  66. Giuliani, R.; Koteyeva, N.; Voznesenskaya, E.; Evans, M.A.; Cousins, A.B.; Edwards, G.E. Coordination of Leaf Photosynthesis, Transpiration, and Structural Traits in Rice and Wild Relatives (Genus Oryza). Plant Physiol. 2013, 162, 1632–1651. [Google Scholar] [CrossRef] [Green Version]
  67. Jenks, M.A.; Hasegawa, P.M. (Eds.) Plant Abiotic Stress; John Wiley & Sons: Hoboken, NJ, USA, 2008; ISBN 978-0-470-99411-5. [Google Scholar]
  68. Lichtenthaler, H.K.; Ač, A.; Marek, M.V.; Kalina, J.; Urban, O. Differences in Pigment Composition, Photosynthetic Rates and Chlorophyll Fluorescence Images of Sun and Shade Leaves of Four Tree Species. Plant Physiol. Biochem. 2007, 45, 577–588. [Google Scholar] [CrossRef]
  69. Acosta-Motos, J.-R.; Diaz-Vivancos, P.; Álvarez, S.; Fernández-García, N.; Sanchez-Blanco, M.J.; Hernández, J.A. Physiological and Biochemical Mechanisms of the Ornamental Eugenia Myrtifolia L. Plants for Coping with NaCl Stress and Recovery. Planta 2015, 242, 829–846. [Google Scholar] [CrossRef] [Green Version]
  70. Yahia, E.M.; Carrillo-López, A.; Barrera, G.M.; Suzán-Azpiri, H.; Bolaños, M.Q. Chapter 3—Photosynthesis. In Postharvest Physiology and Biochemistry of Fruits and Vegetables; Yahia, E.M., Ed.; Woodhead Publishing: Thorston, UK, 2019; pp. 47–72. ISBN 978-0-12-813278-4. [Google Scholar]
  71. Munns, R.; Passioura, J.B.; Colmer, T.D.; Byrt, C.S. Osmotic Adjustment and Energy Limitations to Plant Growth in Saline Soil. New Phytol. 2020, 225, 1091–1096. [Google Scholar] [CrossRef] [Green Version]
  72. Zollinger, N.; Kjelgren, R.; Cerny-Koenig, T.; Kopp, K.; Koenig, R. Drought Responses of Six Ornamental Herbaceous Perennials. Sci. Hortic. 2006, 109, 267–274. [Google Scholar] [CrossRef]
  73. Bartlett, M.K.; Scoffoni, C.; Sack, L. The Determinants of Leaf Turgor Loss Point and Prediction of Drought Tolerance of Species and Biomes: A Global Meta-Analysis: Drivers of Plant Drought Tolerance. Ecol. Lett. 2012, 15, 393–405. [Google Scholar] [CrossRef]
  74. Maroco, J.P.; Pereira, J.S.; Chaves, M.M. Stomatal Responses to Leaf-to-Air Vapour Pressure Deficit in Sahelian Species. Aust. J. Plant Physiol. 1997, 24, 381–387. [Google Scholar] [CrossRef]
  75. Medrano, H. Regulation of Photosynthesis of C3 Plants in Response to Progressive Drought: Stomatal Conductance as a Reference Parameter. Ann. Bot. 2002, 89, 895–905. [Google Scholar] [CrossRef] [PubMed]
  76. Steduto, P.; Hsiao, T.C.; Fereres, E. On the Conservative Behavior of Biomass Water Productivity. Irrig. Sci. 2007, 25, 189–207. [Google Scholar] [CrossRef] [Green Version]
  77. Yu, D.J.; Kim, S.J.; Lee, H.J. Stomatal and Non-Stomatal Limitations to Photosynthesis in Field-Grown Grapevine Cultivars. Biol. Plant 2009, 53, 133–137. [Google Scholar] [CrossRef]
  78. Silim, S.N.; Ryan, N.; Kubien, D.S. Temperature Responses of Photosynthesis and Respiration in Populus Balsamifera L.: Acclimation versus Adaptation. Photosynth. Res. 2010, 104, 19–30. [Google Scholar] [CrossRef]
  79. Lawlor, D.W.; Tezara, W. Causes of Decreased Photosynthetic Rate and Metabolic Capacity in Water-Deficient Leaf Cells: A Critical Evaluation of Mechanisms and Integration of Processes. Ann. Bot. 2009, 103, 561–579. [Google Scholar] [CrossRef] [Green Version]
  80. Singal, H.R.; Sheoran, I.S.; Singh, R. Effect of Water Stress on Photosynthesis and in Vitro Activities of the PCR Cycle Enzymes in Pigeonpea (Cajanus Cajan L.). Photosynth. Res. 1985, 7, 69–76. [Google Scholar] [CrossRef]
  81. D’Ambrosio, N.; Arena, C.; De Santo, A.V. Temperature Response of Photosynthesis, Excitation Energy Dissipation and Alternative Electron Sinks to Carbon Assimilation in Beta Vulgaris L. Environ. Exp. Bot. 2006, 55, 248–257. [Google Scholar] [CrossRef]
  82. Bañón, S.; Miralles, J.; Ochoa, J.; Franco, J.A.; Sánchez-Blanco, M.J. Effects of Diluted and Undiluted Treated Wastewater on the Growth, Physiological Aspects and Visual Quality of Potted Lantana and Polygala Plants. Sci. Hortic. 2011, 129, 869–876. [Google Scholar] [CrossRef]
  83. Müller, P.; Li, X.-P.; Niyogi, K.K. Non-Photochemical Quenching. A Response to Excess Light Energy1. Plant Physiol. 2001, 125, 1558–1566. [Google Scholar] [CrossRef] [PubMed] [Green Version]
  84. Navarro, A.; Bañón, S.; Conejero, W.; Sánchez-Blanco, M.J. Ornamental Characters, Ion Accumulation and Water Status in Arbutus Unedo Seedlings Irrigated with Saline Water and Subsequent Relief and Transplanting. Environ. Exp. Bot. 2008, 62, 364–370. [Google Scholar] [CrossRef]
  85. Cassaniti, C.; Leonardi, C.; Flowers, T.J. The Effects of Sodium Chloride on Ornamental Shrubs. Sci. Hortic. 2009, 122, 586–593. [Google Scholar] [CrossRef]
  86. Camberato, D.M.; Lopez, R.G.; Mickelbart, M.V. PH and Electrical Conductivity Measurements in Soilless Substrates; Purdue University Libraries: West Lafayette, IN, USA, 2009; pp. 1–7. [Google Scholar]
  87. Alam, S.M. Nutrient Uptake by Plants Under Stress Conditions. In Handbook of Plant and Crop Stress; Pessarakli, M., Ed.; CRC Press: Boca Raton, FL, USA, 1999; pp. 285–313. [Google Scholar]
  88. Lawlor, D.W.; Lemaire, G.; Gastal, F. Nitrogen, Plant Growth and Crop Yield. In Plant Nitrogen; Lea, P.J., Morot-Gaudry, J.-F., Eds.; Springer: Berlin/Heidelberg, Germany, 2001; pp. 343–367. [Google Scholar]
  89. Lester, G.E.; Jifon, J.L.; Makus, D.J. Impact of Potassium Nutrition on Food Quality of Fruits and Vegetables: A Condensed and Concise Review of the Literature. Better Crops 2010, 94, 18–21. [Google Scholar]
  90. Yermiyahu, U.; Israeli, L.; David, D.R.; Faingold, I.; Elad, Y. Higher Potassium Concentration in Shoots Reduces Gray Mold in Sweet Basil. Phytopathology 2015, 105, 1059–1068. [Google Scholar] [CrossRef]
  91. Gómez-Bellot, M.J.; Álvarez, S.; Castillo, M.; Bañón, S.; Ortuño, M.F.; Sánchez-Blanco, M.J. Water Relations, Nutrient Content and Developmental Responses of Euonymus Plants Irrigated with Water of Different Degrees of Salinity and Quality. J. Plant Res. 2013, 126, 567–576. [Google Scholar] [CrossRef]
Figure 1. Water retention curve of the substrate (peat, coconut fiber, perlite (67/30/3, v/v/v)) following De Boodt’s method. The value of VWC at saturation (Ψw = 0) was estimated from the measurement of porosity (83.2%). EAW: easily available water, WBC: water buffer capacity.
Agronomy 12 00206 g001
Figure 2. Daily average temperature (black line) and vapor pressure deficit (VPD) (gray line) during the experiment. The arrows indicate the days on which physiological parameters were measured.
Agronomy 12 00206 g002
Figure 3. Fluctuations in the substrate moisture when irrigating with small volumes of water. Lines represent three different volumetric water contents (VWCs): 49.28% VWC (control, black line), VWC 38.44% (VWC39%, light grey line), and VWC 32.16% (VWC32%, dark grey line).
Agronomy 12 00206 g003
Figure 4. Water–plant relations in Hebe during the experiment: leaf water potential at midday (Ψl) (A), leaf turgor potential (Ψt) (B), and leaf osmotic potential at full turgor (Ψ100s) (C). Control (black), VWC39% (light gray), and VWC32% (dark gray) indicate Hebe plants cultivated at 49.28%, 38.44%, and 32.16% VWC, respectively. Values are means (n = 5) and vertical bars indicate ± standard error. Different letters indicate statistically significant differences between means at p < 0.05 according to the least significant difference (LSD) test.
Agronomy 12 00206 g004
Figure 5. Time evolution of net photosynthesis at midday (Pn) (A), stomatal conductance at midday (gs) (B), Pn/gs ratio (C), ETR (D), and ETR/Pn ratio (E). Control (black), VWC39% (light gray), and VWC32% (dark gray) denote Hebe plants grown at 49.28%, 38.44%, and 32.16% VWC, respectively. Values are means (n = 5) and vertical bars show ± standard error. Different letters indicate statistically significant differences between means at p < 0.05 according to the least significant difference (LSD) test.
Agronomy 12 00206 g005
Figure 6. Effect of substrate moisture on several chlorophyll fluorescence parameters of Hebe leaves at the end of the experiment: maximum quantum yield of photosystem II (PSII) (Fv/Fm), effective quantum yield (ePSII), non-photochemical quenching (NPQ), and the ratio of the electron transport rate to the photosynthesis rate (ETR/Pn). Control (black), VWC39% (light gray), and VWC32% (dark gray) denote Hebe plants grown over 152 days at 49.28%, 38.44%, and 32.16% VWC, respectively. Values are means (n = 5) and vertical bars indicate ± standard error. Different letters indicate statistically significant differences between means at p < 0.05 according to the least significant difference (LSD) test.
Agronomy 12 00206 g006
Table 1. Composition of major ions in the irrigation solution used in the experiment.
IonConcentration (mg L−1)
NO3280.23
NH4+1.89
H2PO417.09
K+56.06
Ca2+125.72
Mg2+57.18
SO42−258.99
Cl245.28
Na+161.37
HCO3105.11
B3+0.61
Mn2+0.45
Fe3+0.07
Zn2+0.07
Cu2+0.09
Table 2. Water consumption, average daily evapotranspiration (ET), and water-use efficiency (WUE) of Hebe plants after 152 days of cultivation at three different volumetric water contents (VWCs): 49.28% VWC (control), VWC 38.44% (VWC39%), and VWC 32.16% (VWC32%).
ControlVWC39%VWC32%
Water consumption (L pot−1) *37.9527.7016.40
ET (mL pot−1 day−1) *249.67182.24107.89
WUE (g L−1)1.70 a1.83 b2.47 c
Different letters in the same row indicate statistically significant differences between means at p < 0.05 according to the least significant difference (LSD) test. * No statistical analysis was performed.
Table 3. Growth and development parameters of Hebe plants under three different volumetric water contents (VWCs) over 152 days: control (49.28% VWC), VWC39% (VWC 38.44%), and VWC32% (VWC 32.16%).
ControlVWC39%VWC32%
Plant dry weight (g)64.42 c50.6 b40.5 a
Leaf dry weight (g)26.72 c23.3 b20.3 a
Stem dry weight (g)18.27 c14.8 b9.97 a
Root dry weight (g)19.43 c12.49 b10.22 a
Root-to-shoot ratio0.423 b0.328 a0.338 a
Leaf area (dm2)28.32 c22.45 b13.5 a
SLA * (cm2 g−1)105.99 c96.35 b66.5 a
SPAD **52.11 b47.78 ab43.43 a
Plant height (cm)30.83 b31.43 b26.33 a
Plant width (cm)39.83 c37.54 b33.58 a
No. of stems10.97 b10.03 ab9.67 a
No. of flowerings stems3.33 b3.01 b1.23 a
Different letters in the same row indicate statistically significant differences between means at p < 0.05 according to the least significant difference (LSD) test. * SLA (specific leaf area). ** SPAD (relative chlorophyll content in leaves).
Table 4. Thickness of the cross-sectional layer of Hebe leaves (µm) and percentage of each component in response to three different volumetric water contents (VWCs) after 152 days: control (VWC 49.28%), VWC39% (VWC 38.44%), and VWC32% (VWC 32.16%).
ControlVWC39%VWC32%
Total leaf thickness (µm)474.88 a486.89 ab506.2 b
Upper cuticle (%)1.67 a1.69 a1.58 a
Upper epidermis (%)3.46 a3.47 a3.53 a
Palisade parenchyma (%)51.83 a52.19 ab54.37 b
Spongy parenchyma (%)40.34 b40.09 b37.93 a
Lower epidermis (%)1.17 a1.44 b1.47 b
Lower cuticle (%)1.52 b1.12 a1.12 a
Different letters in the same row indicate statistically significant differences between means at p < 0.05 according to the least significant difference (LSD) test.
Table 5. Plant macronutrient (N, P, K+) and mineral content (Ca2+, Mg2+, Na+, Cl) in leaves, stems, and roots of Hebe at the end of the experiment. Control, VWC39%, and VWC32% denote Hebe plants grown over 152 days at 49.28%, 38.44%, and 32.16% VWC, respectively.
Element (mg g−1)Plant OrganControlVWC39%VWC32%
NLeaf19.19 a19.74 a20.68 a
Stem13.57 a18.37 b19.49 b
Root11.8 a15.23 b16.2 b
PLeaf2.03 a2.25 a2.14 a
Stem2.19 a2.78 b3.43 c
Root0.78 a0.73 a0.81 a
K+Leaf22.09 a26.55 b28.63 c
Stem6.77 a9.09 b16.6 c
Root3.72 a3.21 a5.93 b
Ca2+Leaf13.45 a12.73 a12.27 a
Stem3.4 a3.74 a4.07 a
Root8.02 a8.71 a9.43 a
Mg2+Leaf3.28 a3.21 a3.45 a
Stem2.74 a3.13 a3.23 a
Root3.36 b2.54 a2.81 ab
Na+Leaf2.18 a3.31 b5.51 c
Stem1.92 a3.81 b8.49 c
Root12.42 b9.01 a9.67 a
ClLeaf11.01 a19.11 b30.41 c
Stem4.47 a8.94 b18.31 c
Root24.69 c20.46 b17.19 a
Different letters in the same row indicate statistically significant differences between means at p < 0.05 according to the least significant difference (LSD) test.
Publisher’s Note: MDPI stays neutral with regard to jurisdictional claims in published maps and institutional affiliations.

