
Organic Matter and Mineral Composition of Silicate Soils: FTIR Comparison Study by Photoacoustic, Diffuse Reflectance, and Attenuated Total Reflection Modalities


Abstract
1. Introduction
2. Materials and Methods
2.1. Soils
2.1.1. Sod-Podzolic Soil
2.1.2. Chernozem Soils
2.2. Instrumentation
2.2.1. DRIFT
2.2.2. ATR–FTIR
2.2.3. FTIR–PAS
3. Results
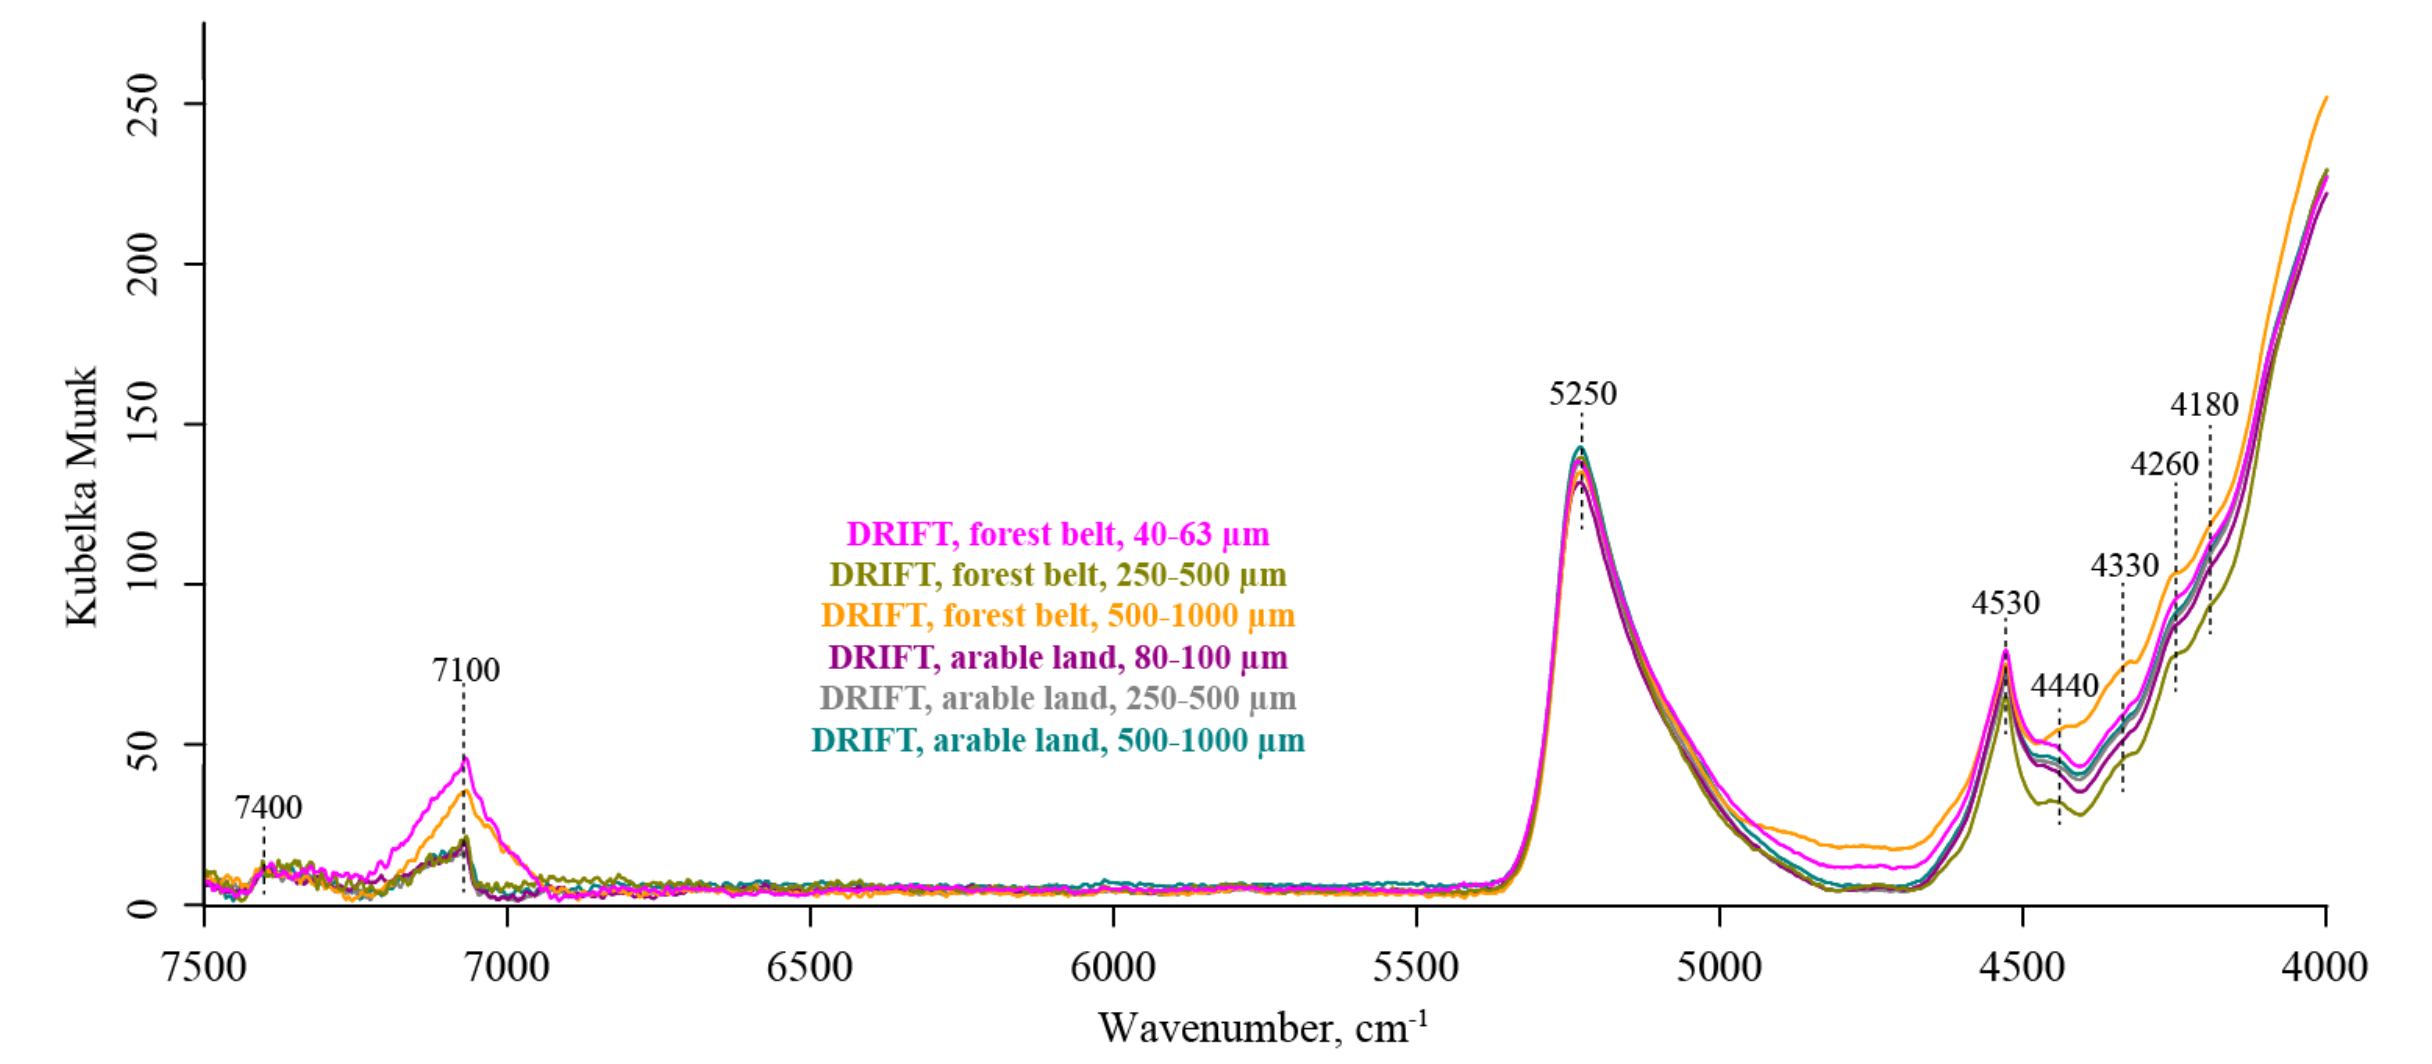
3.1. NIR Region (7500–4000 cm−1)
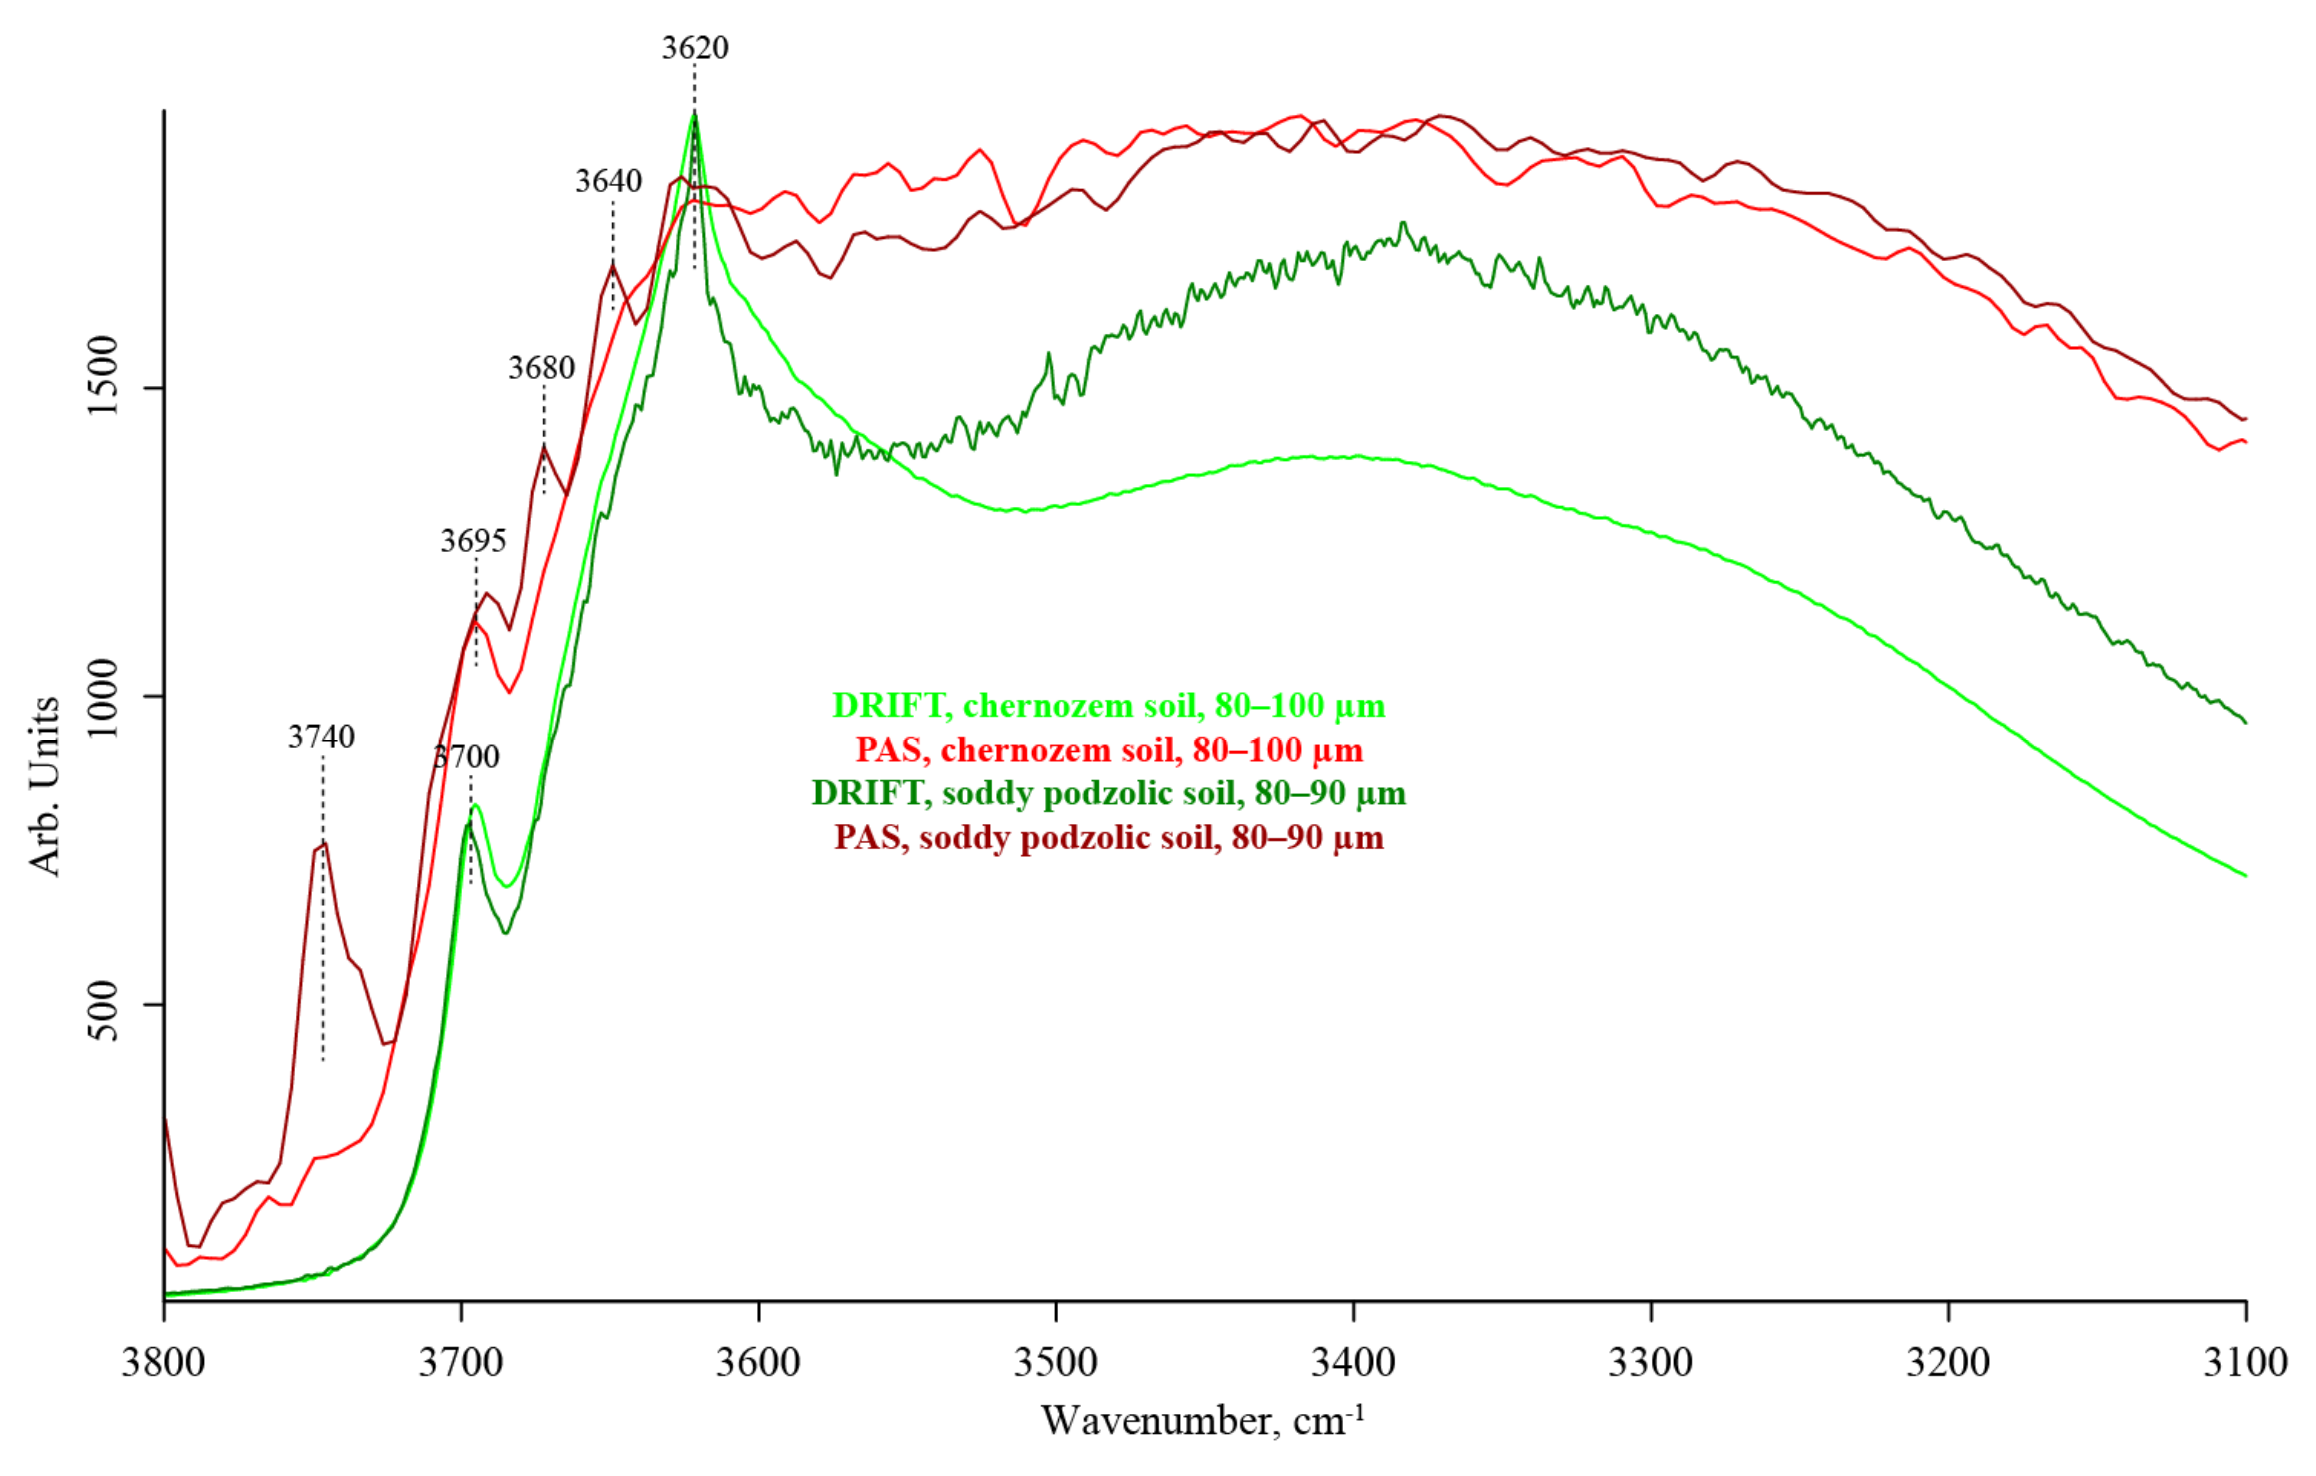
3.2. Hydrogen-Speciation Region (4000–3100 cm−1)
3.3. CH Region (3100–2800 cm−1)
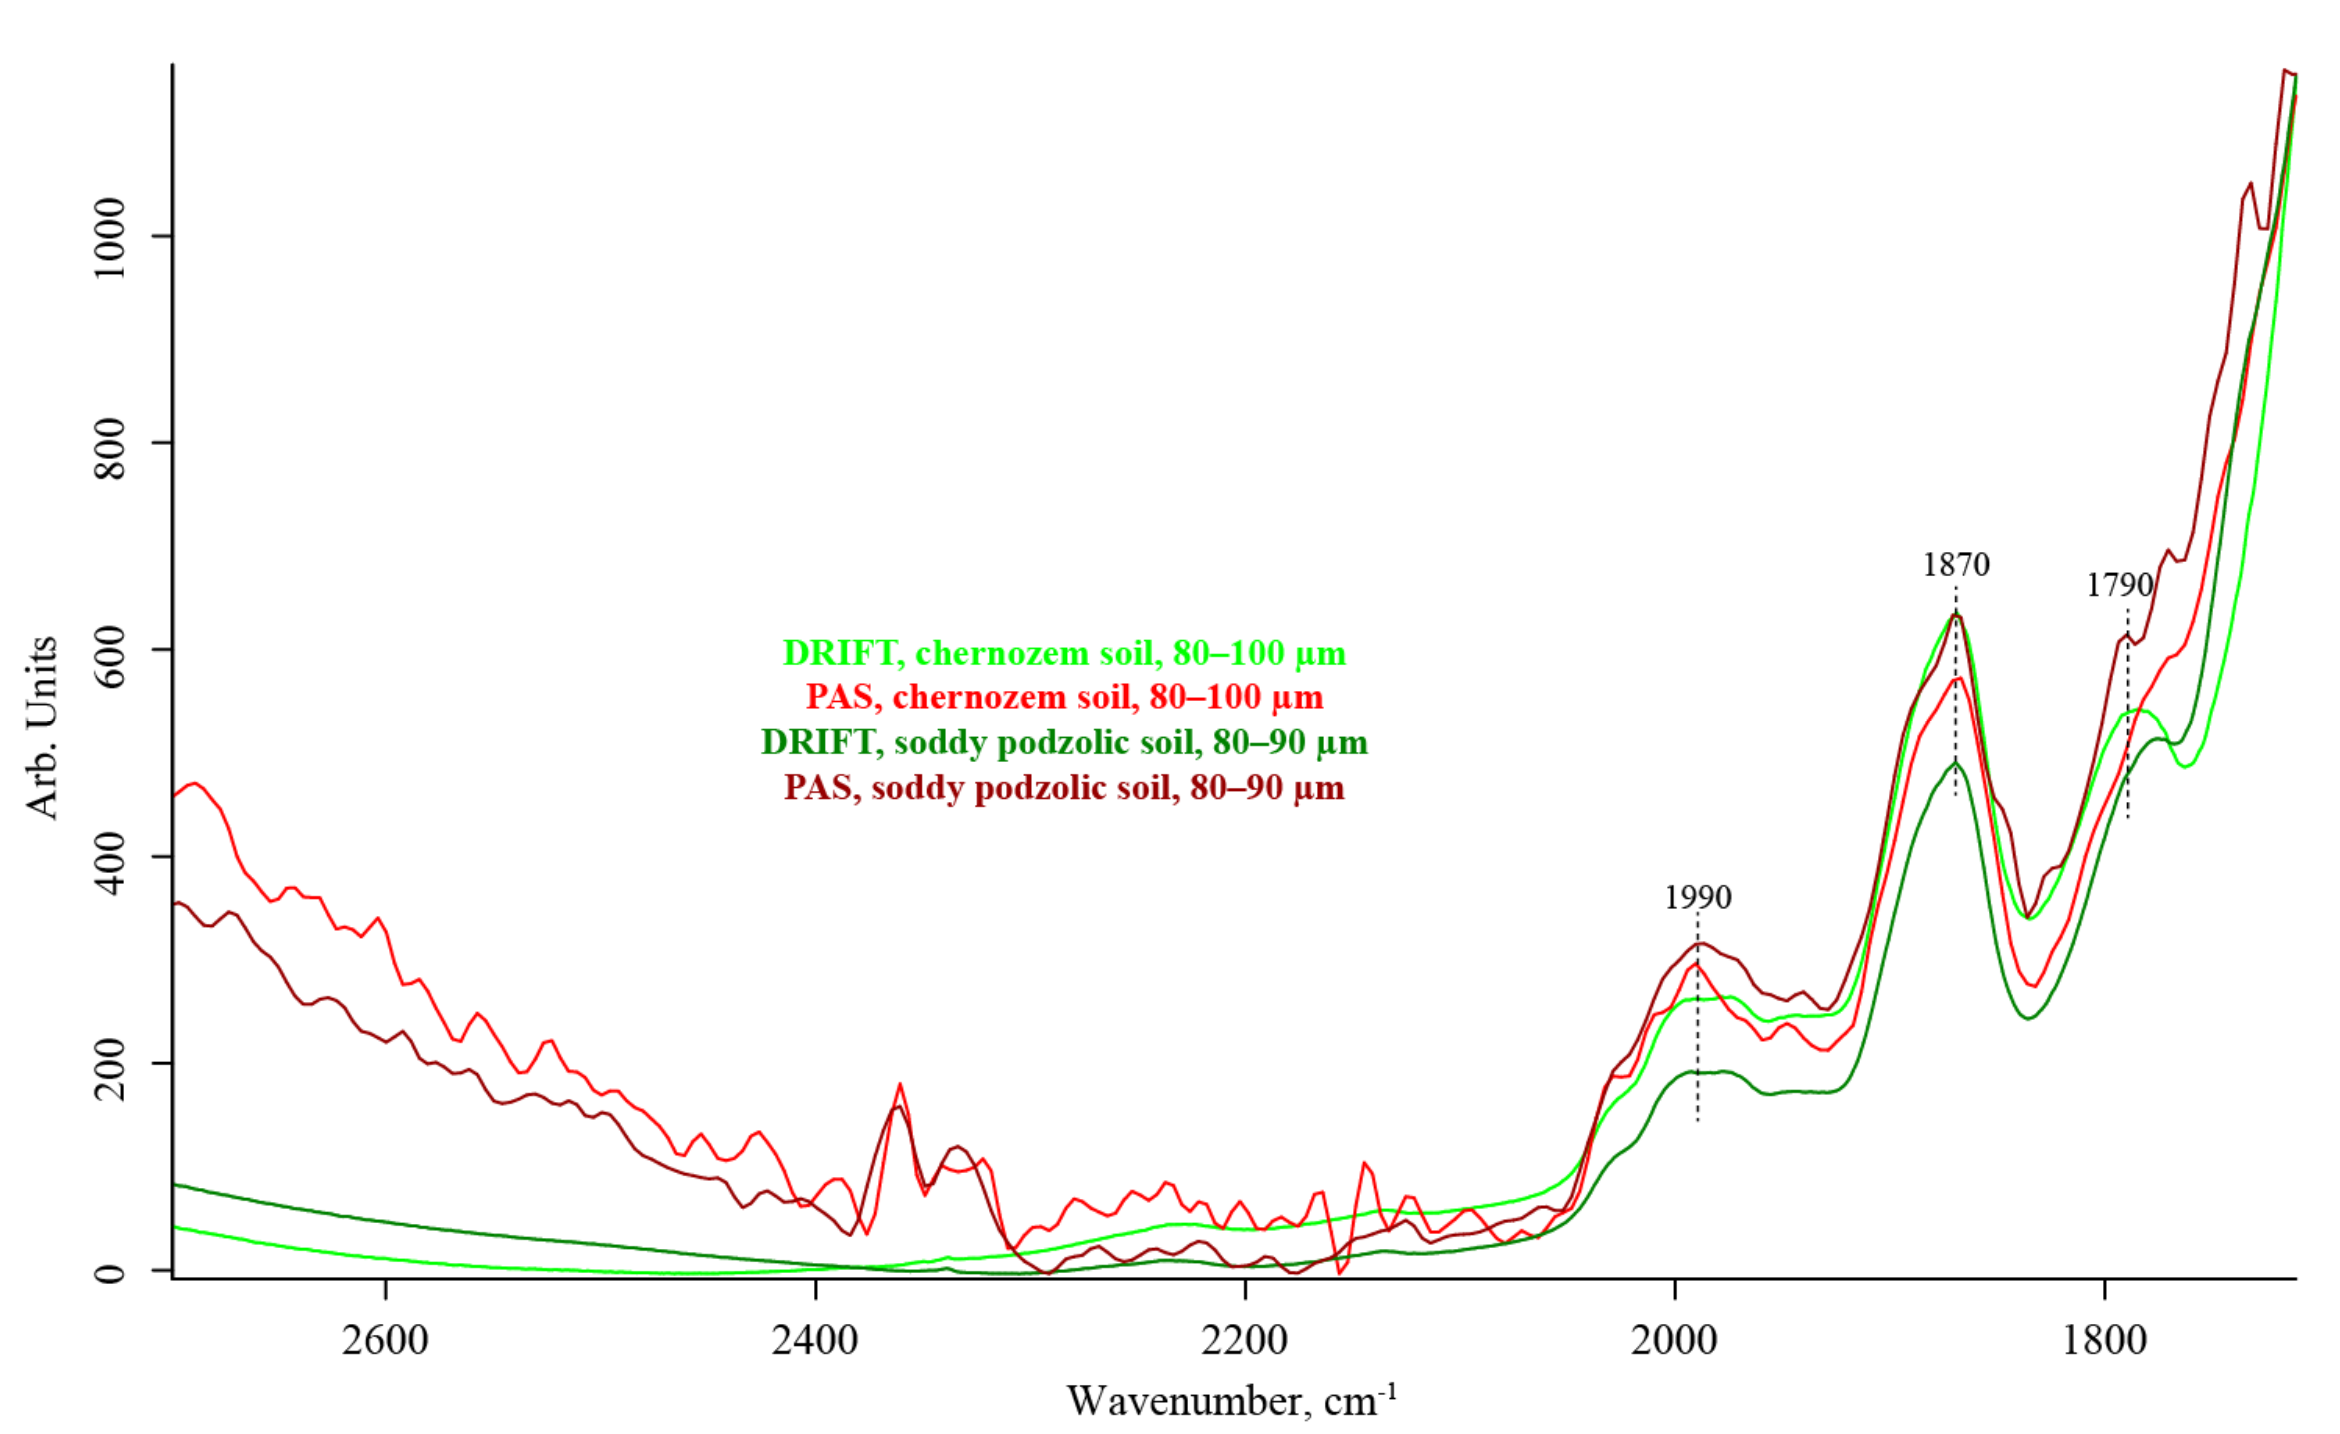
3.4. Quartz Combination Region (2800–1700 cm−1)
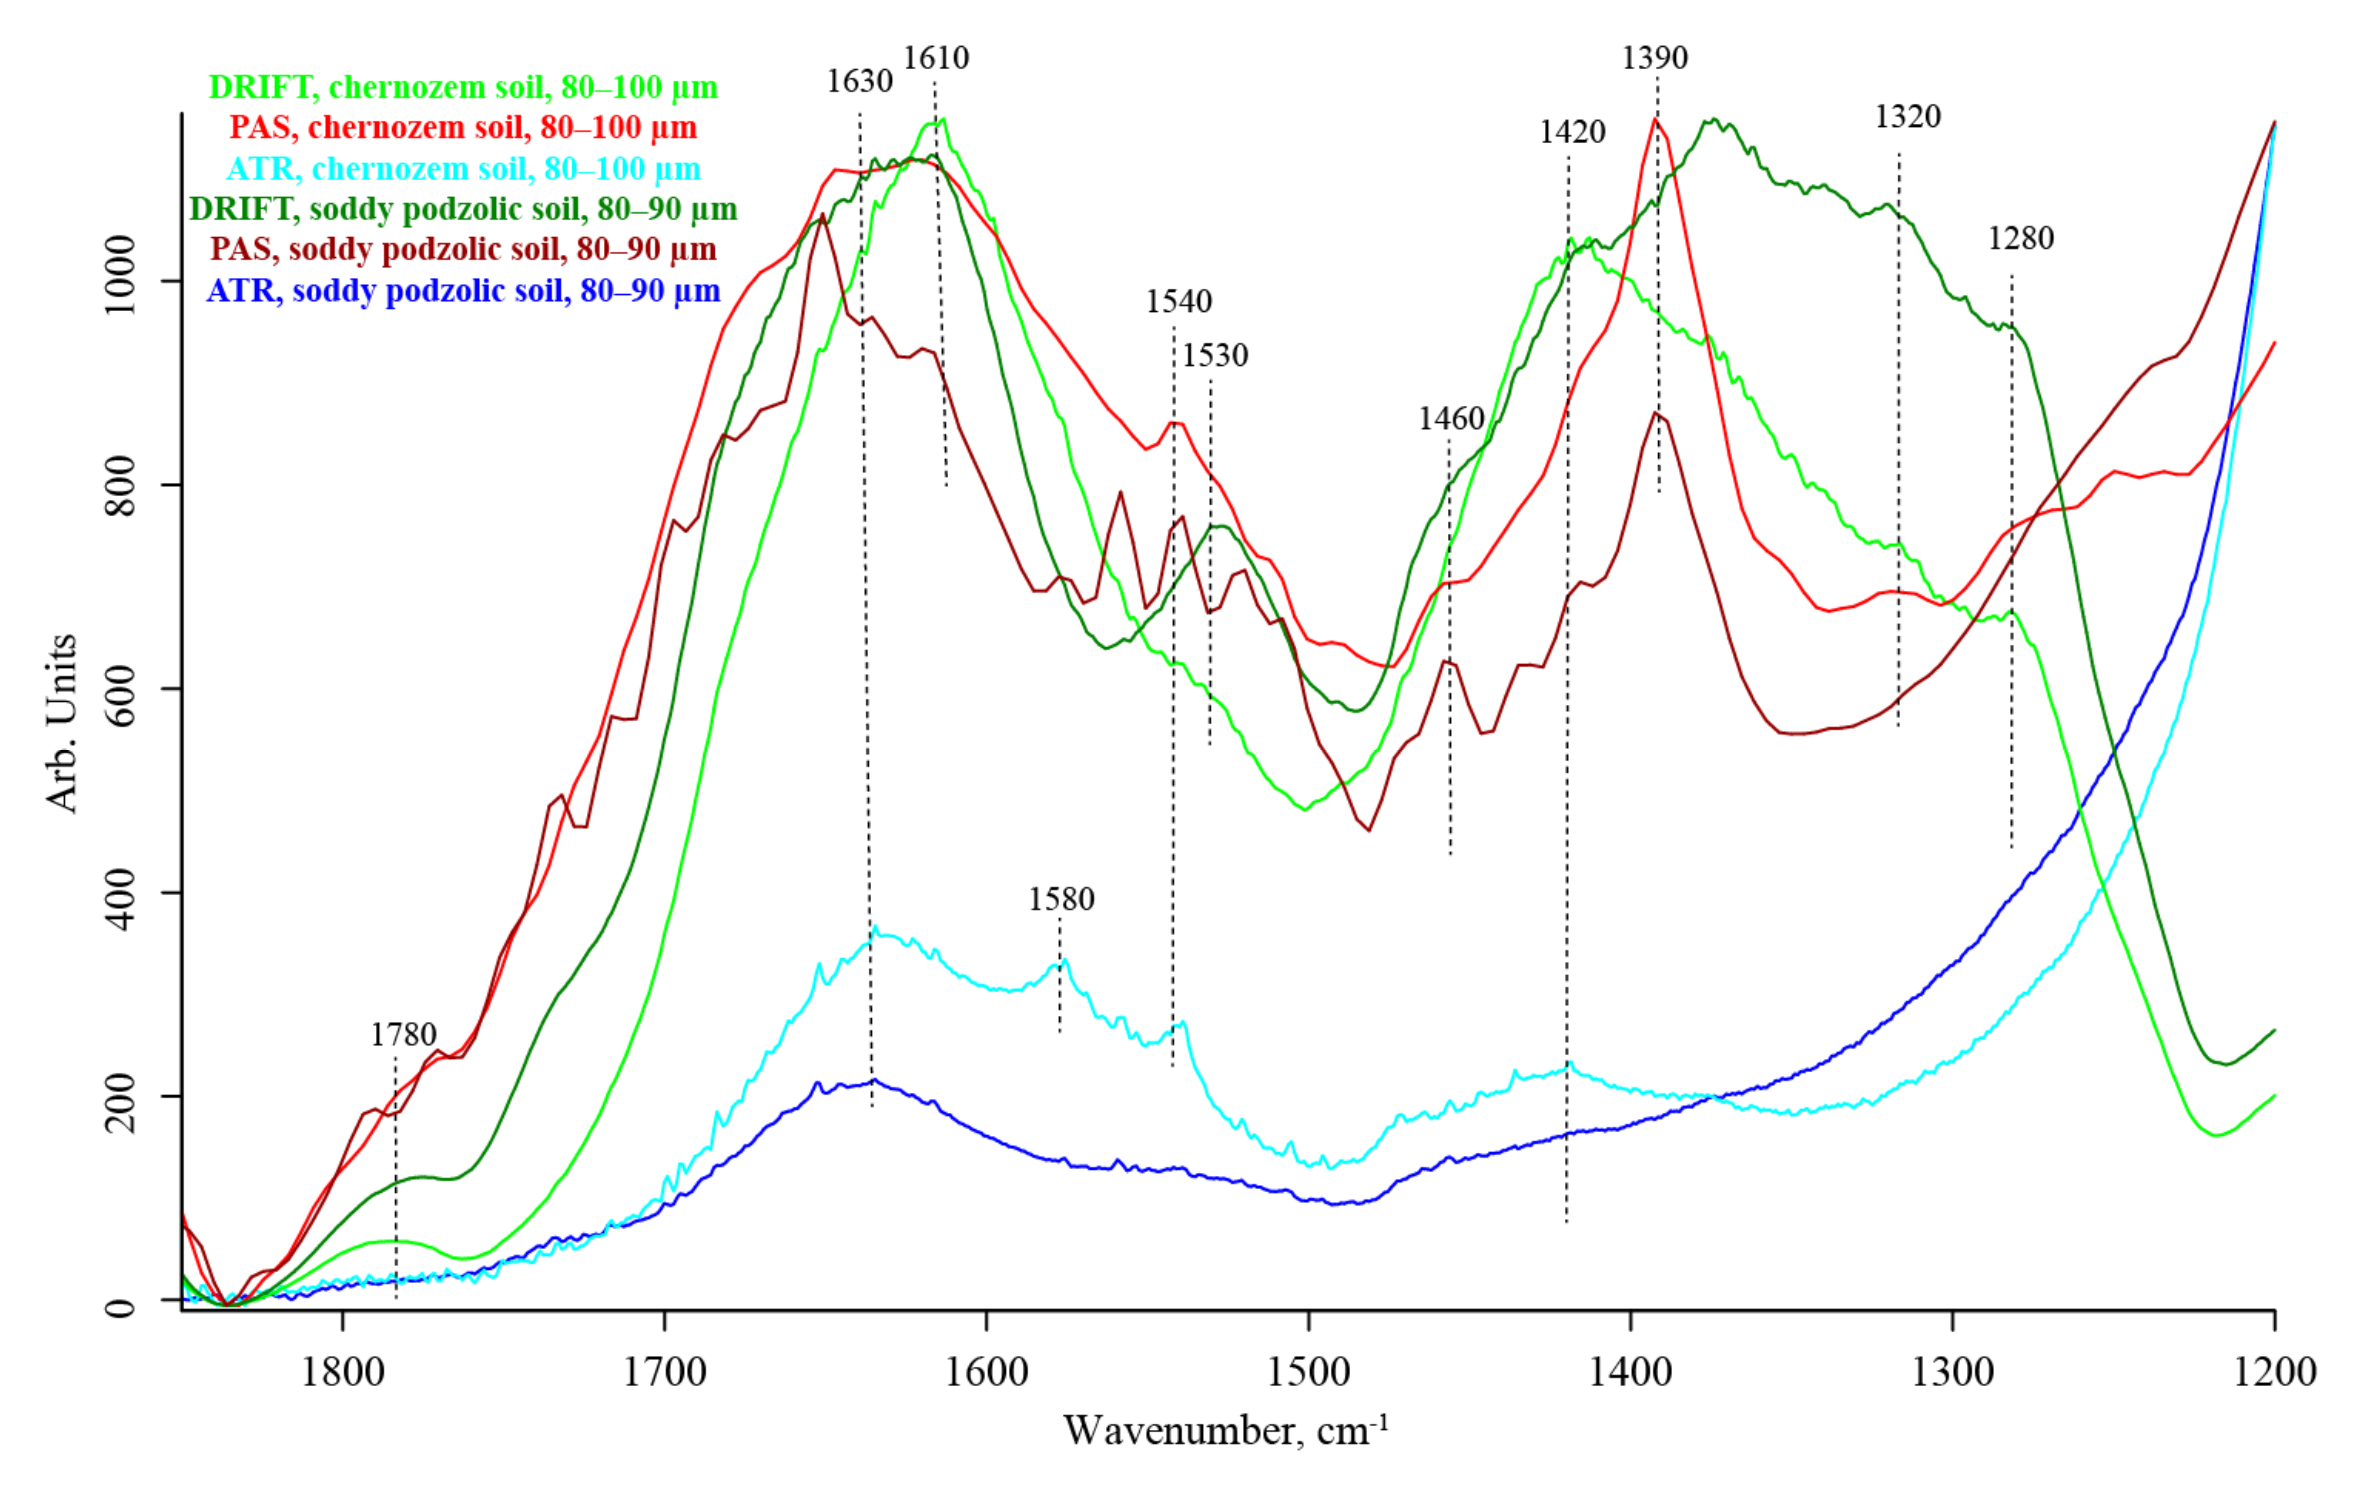
3.5. SOM Region (1700–1170 cm−1)
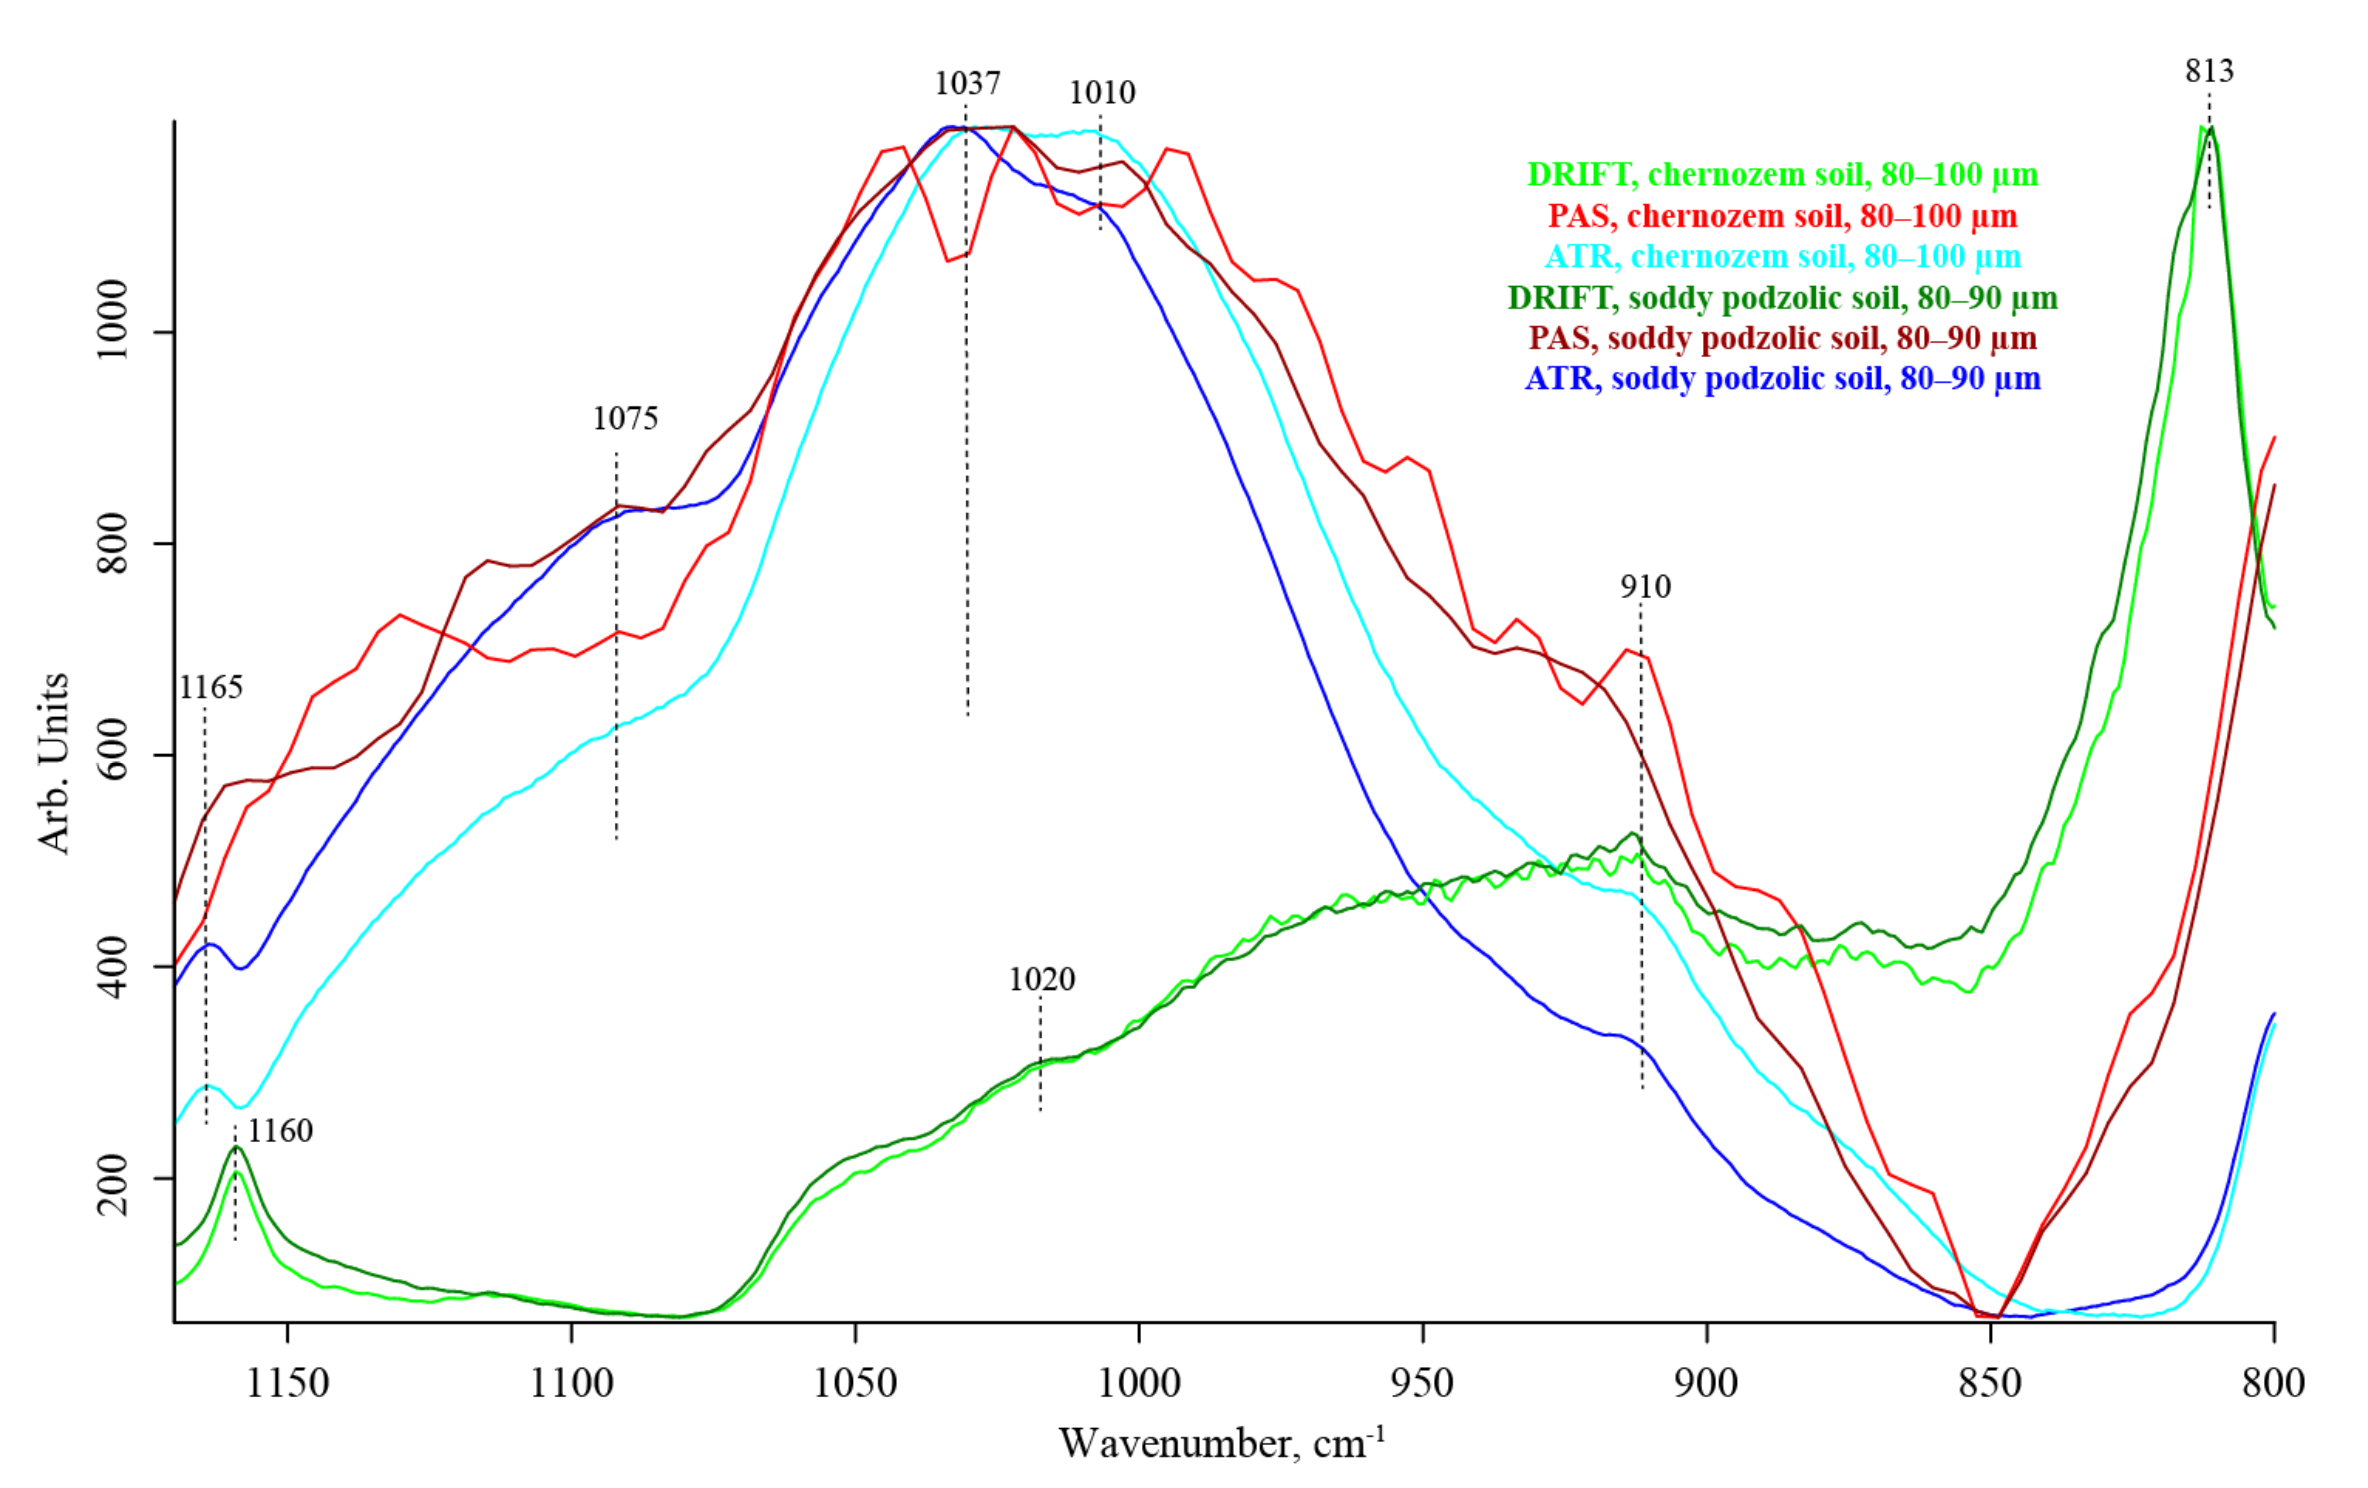
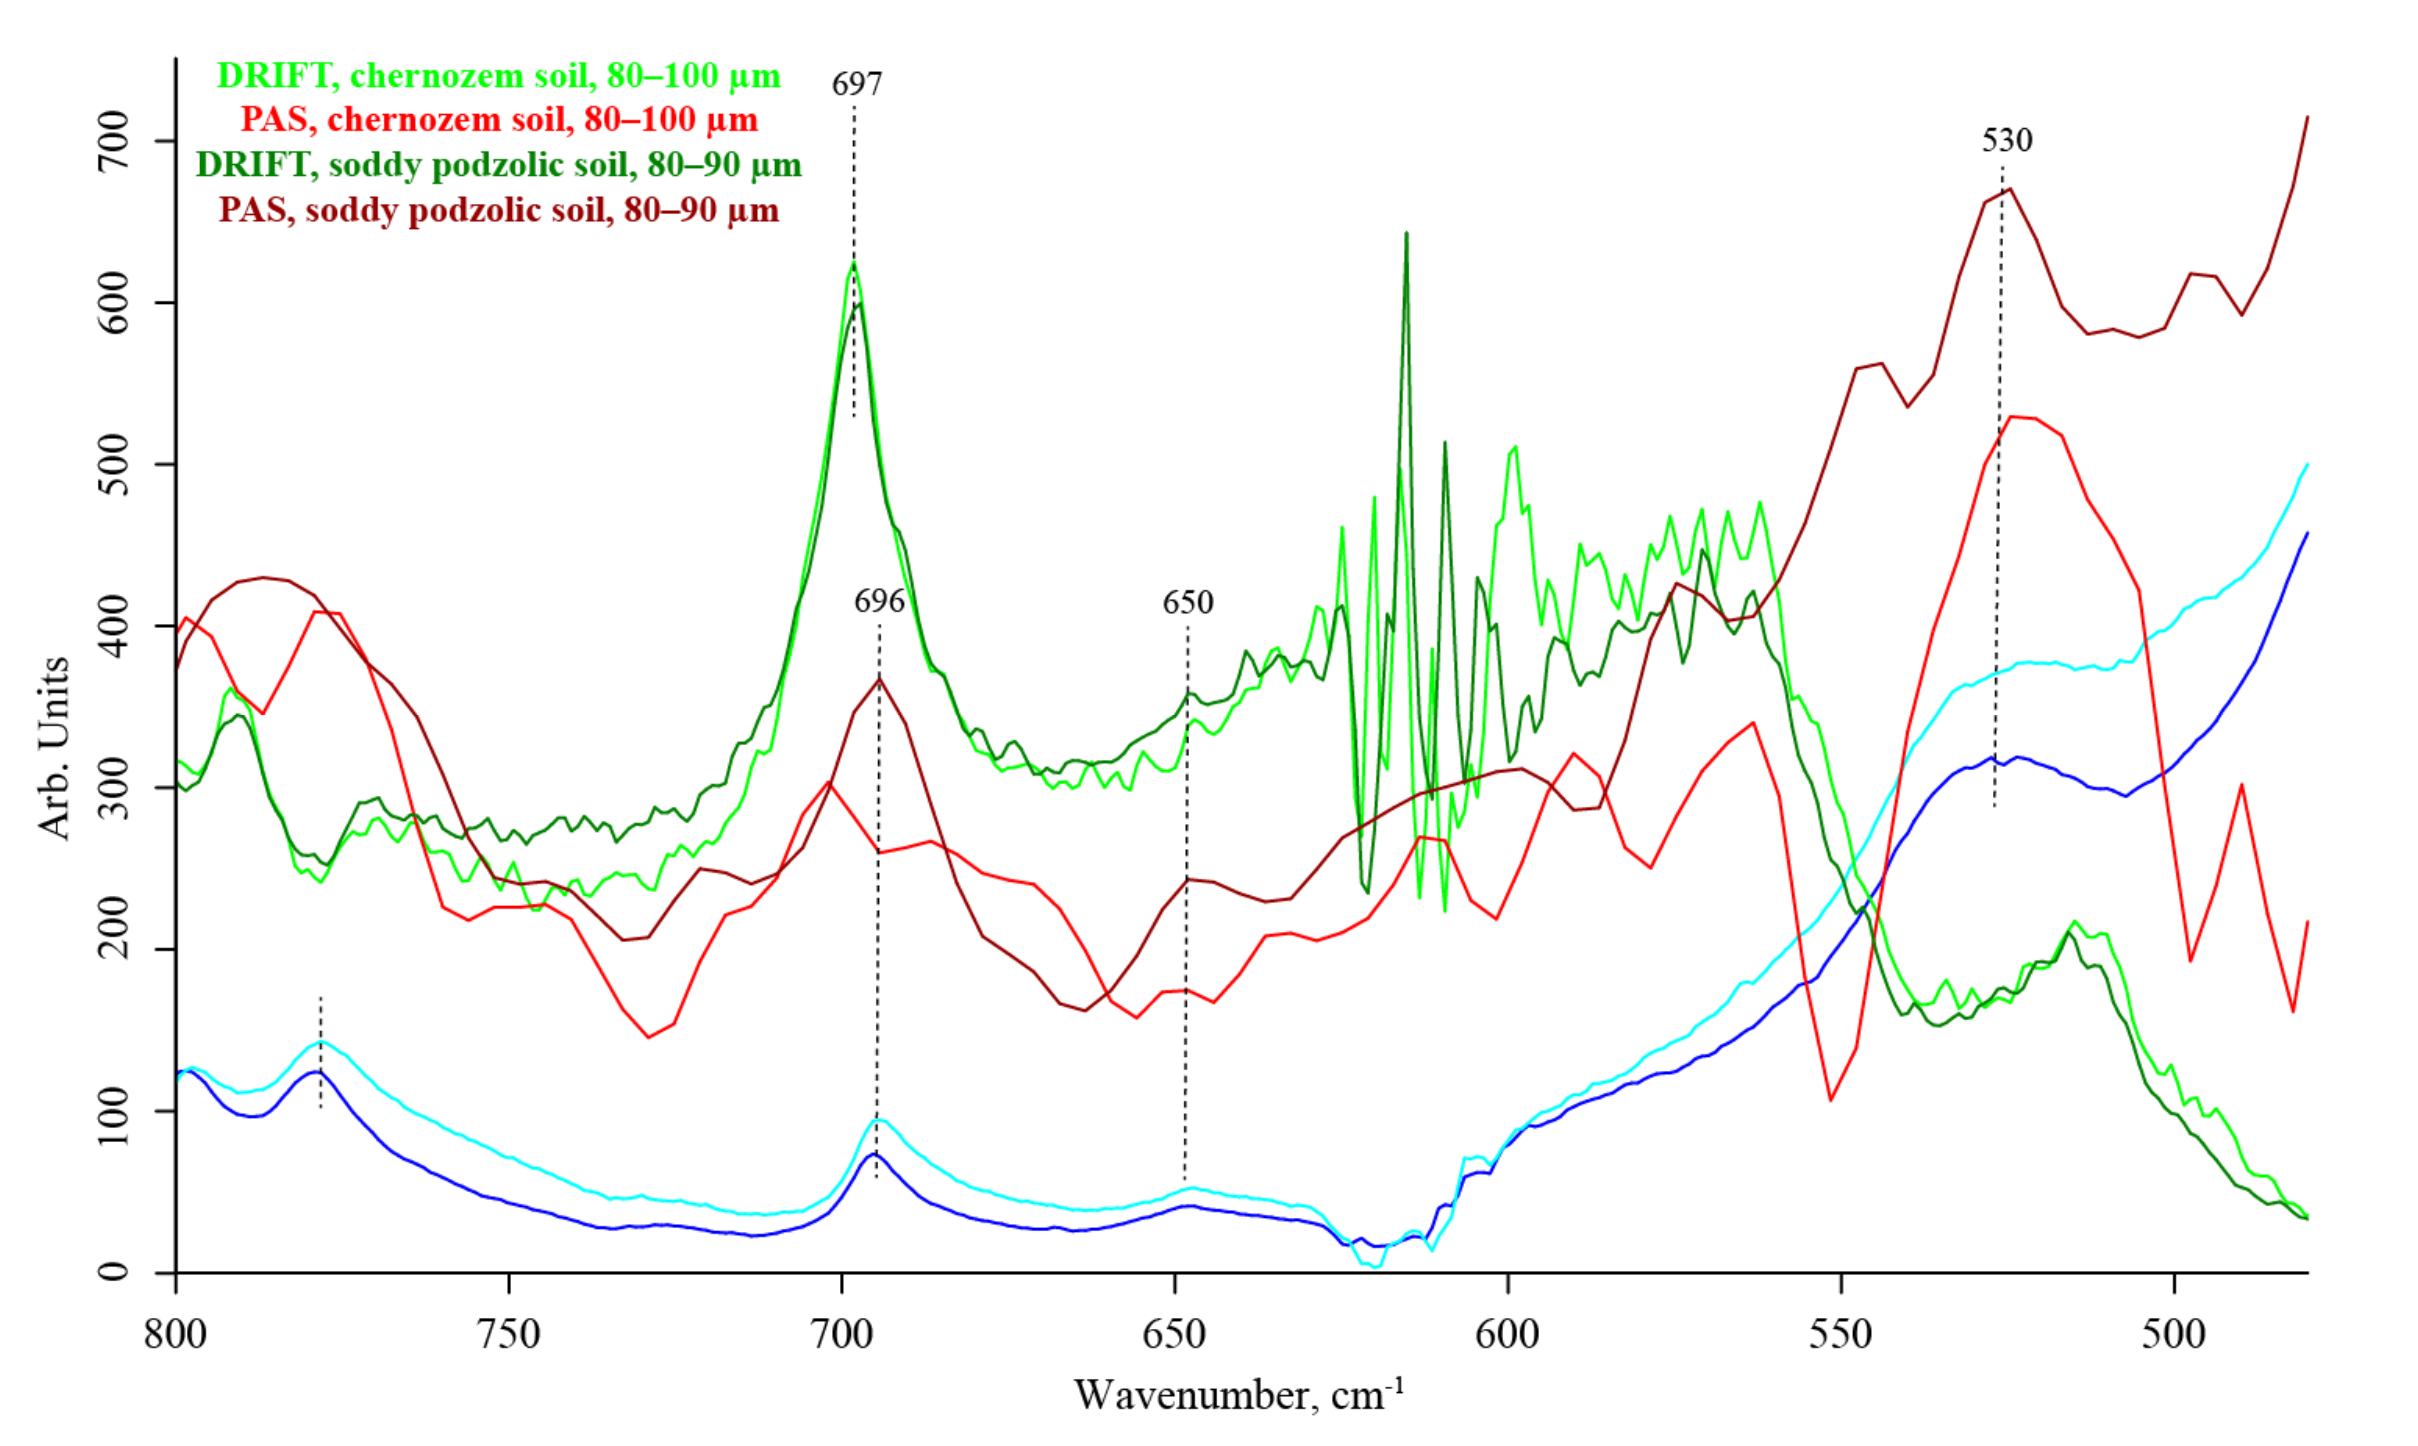
3.6. Quartz Overtone Region (1170–800 cm−1)
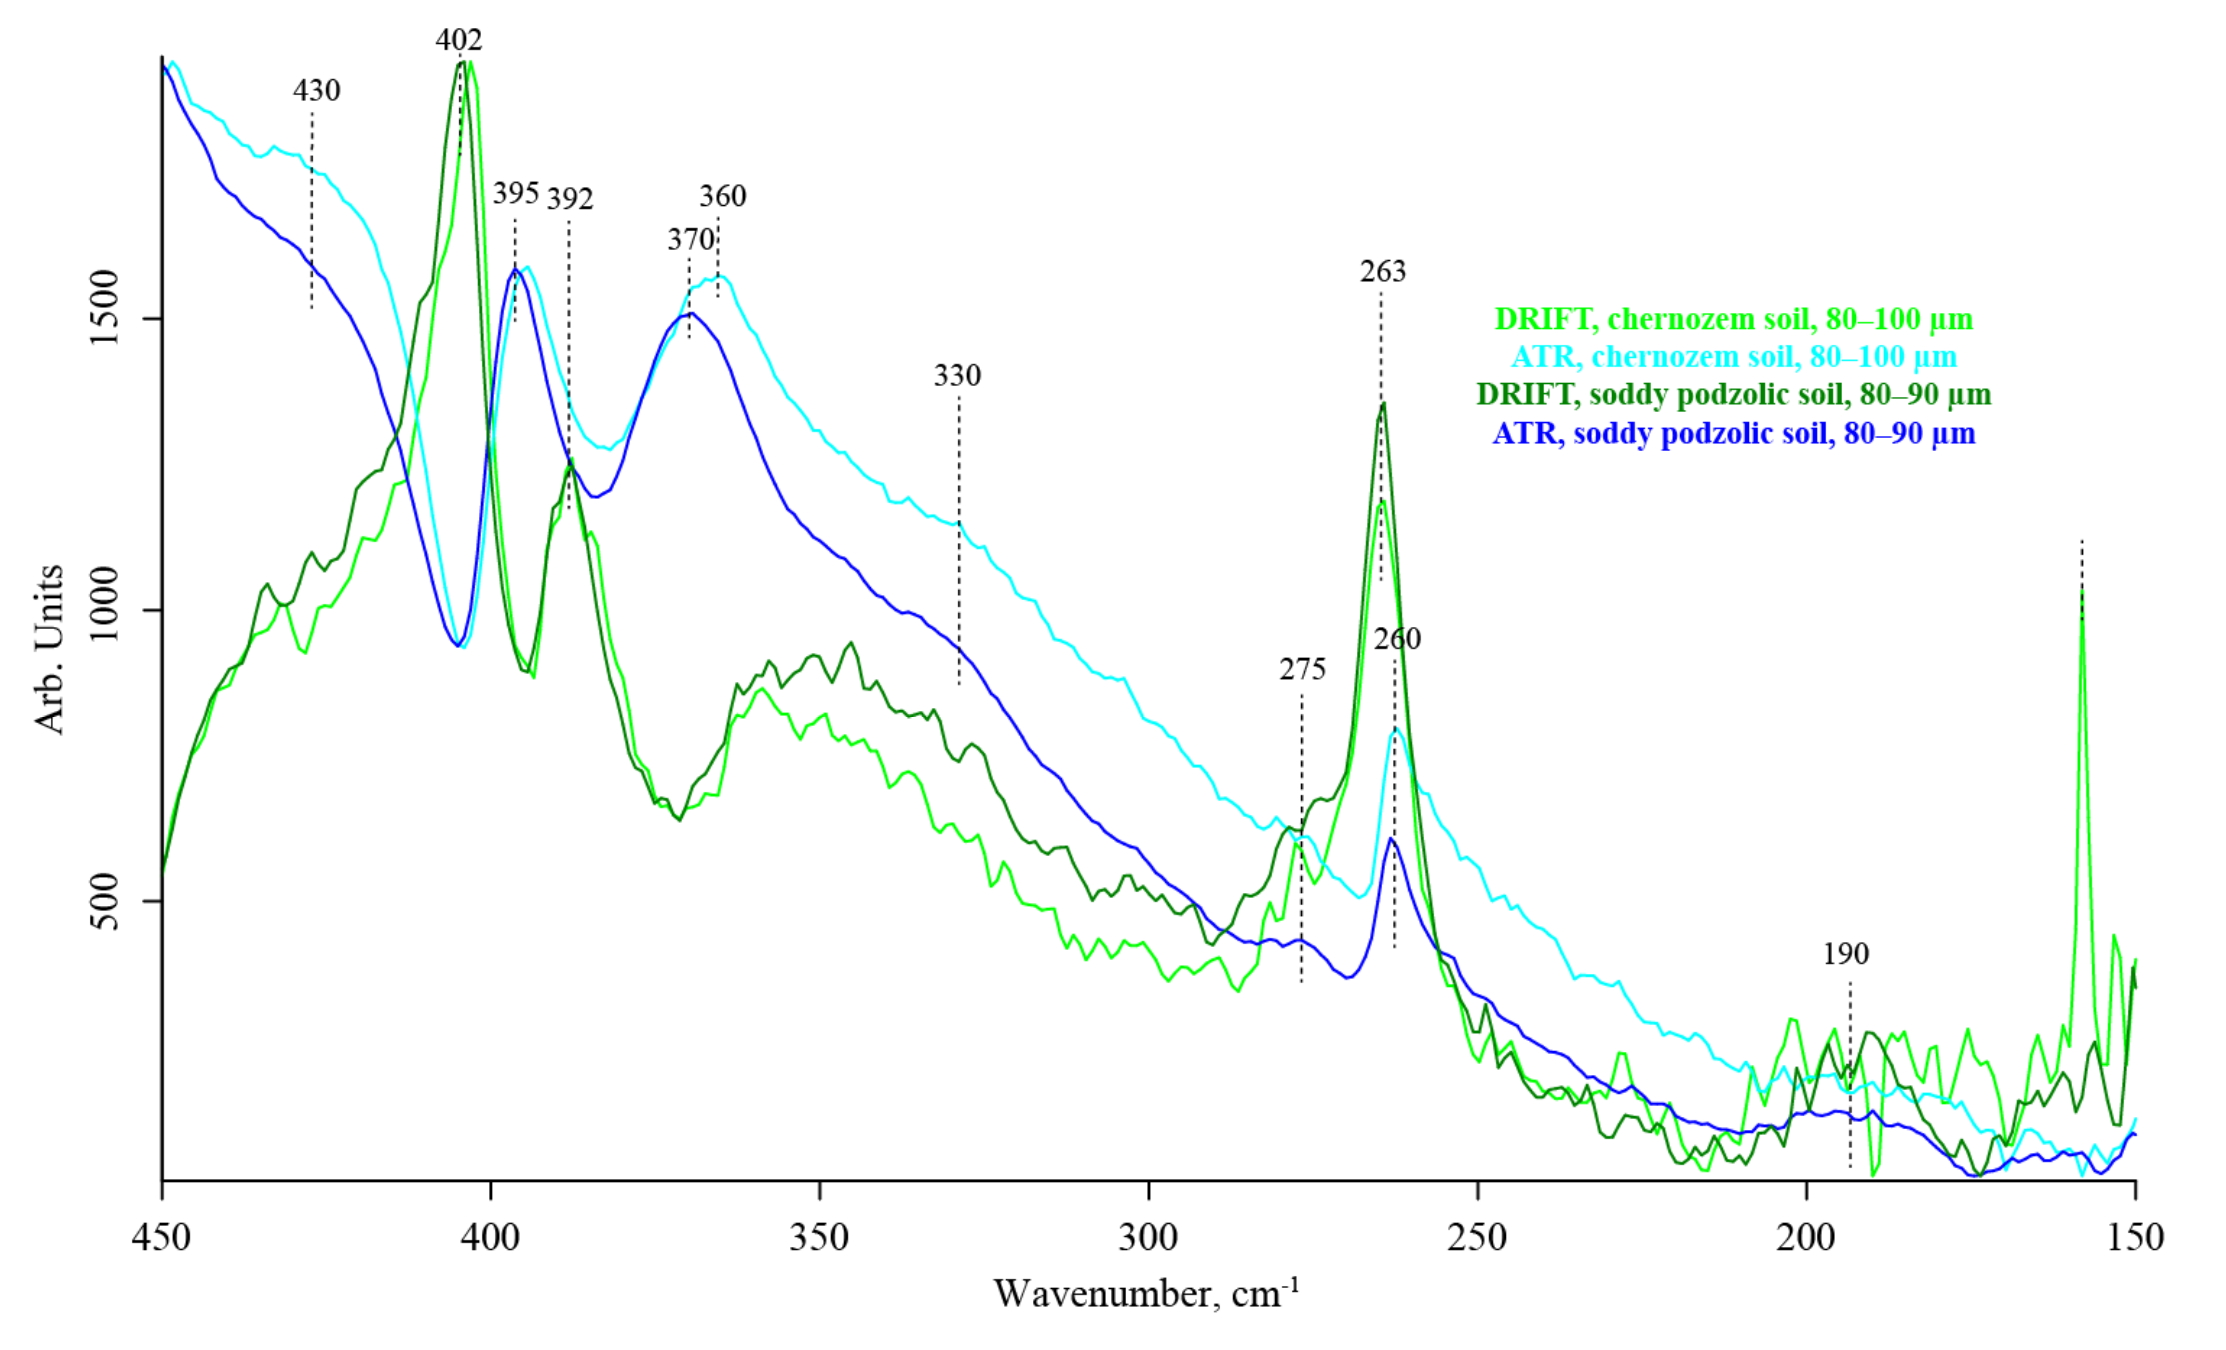
3.7. Quartz Lattice Region (800–150 cm−1)
4. Discussion
4.1. Common Features of IR Spectra in Different Modalities
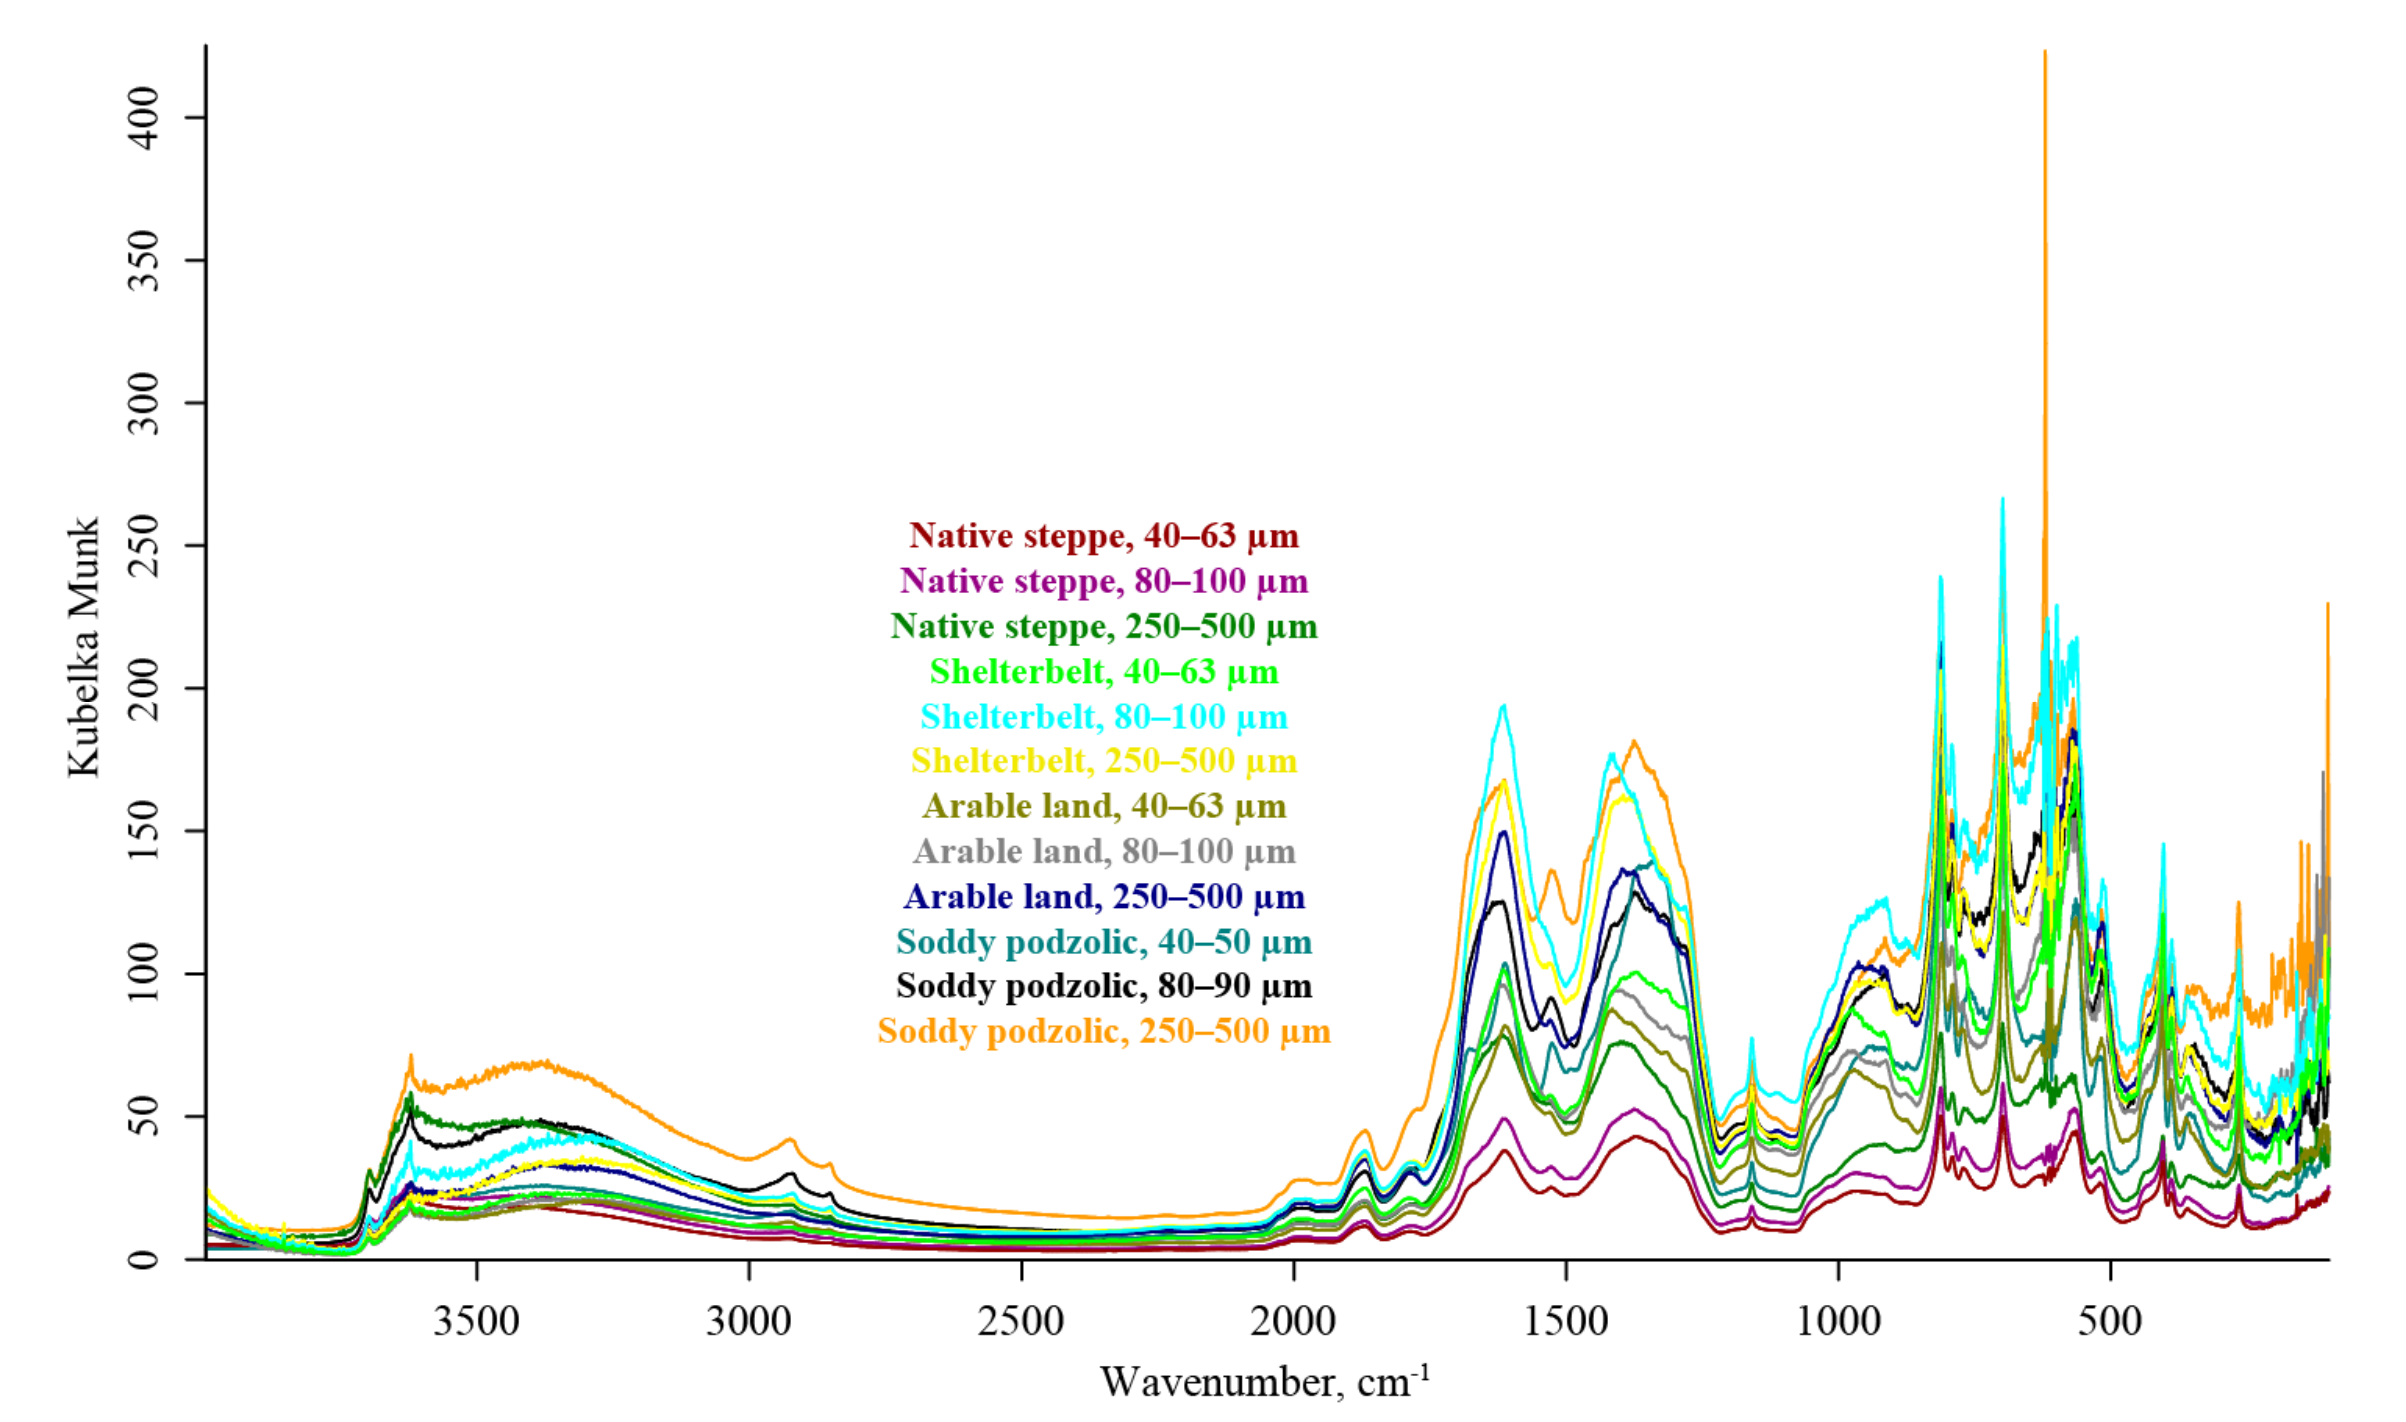
4.2. DRIFT
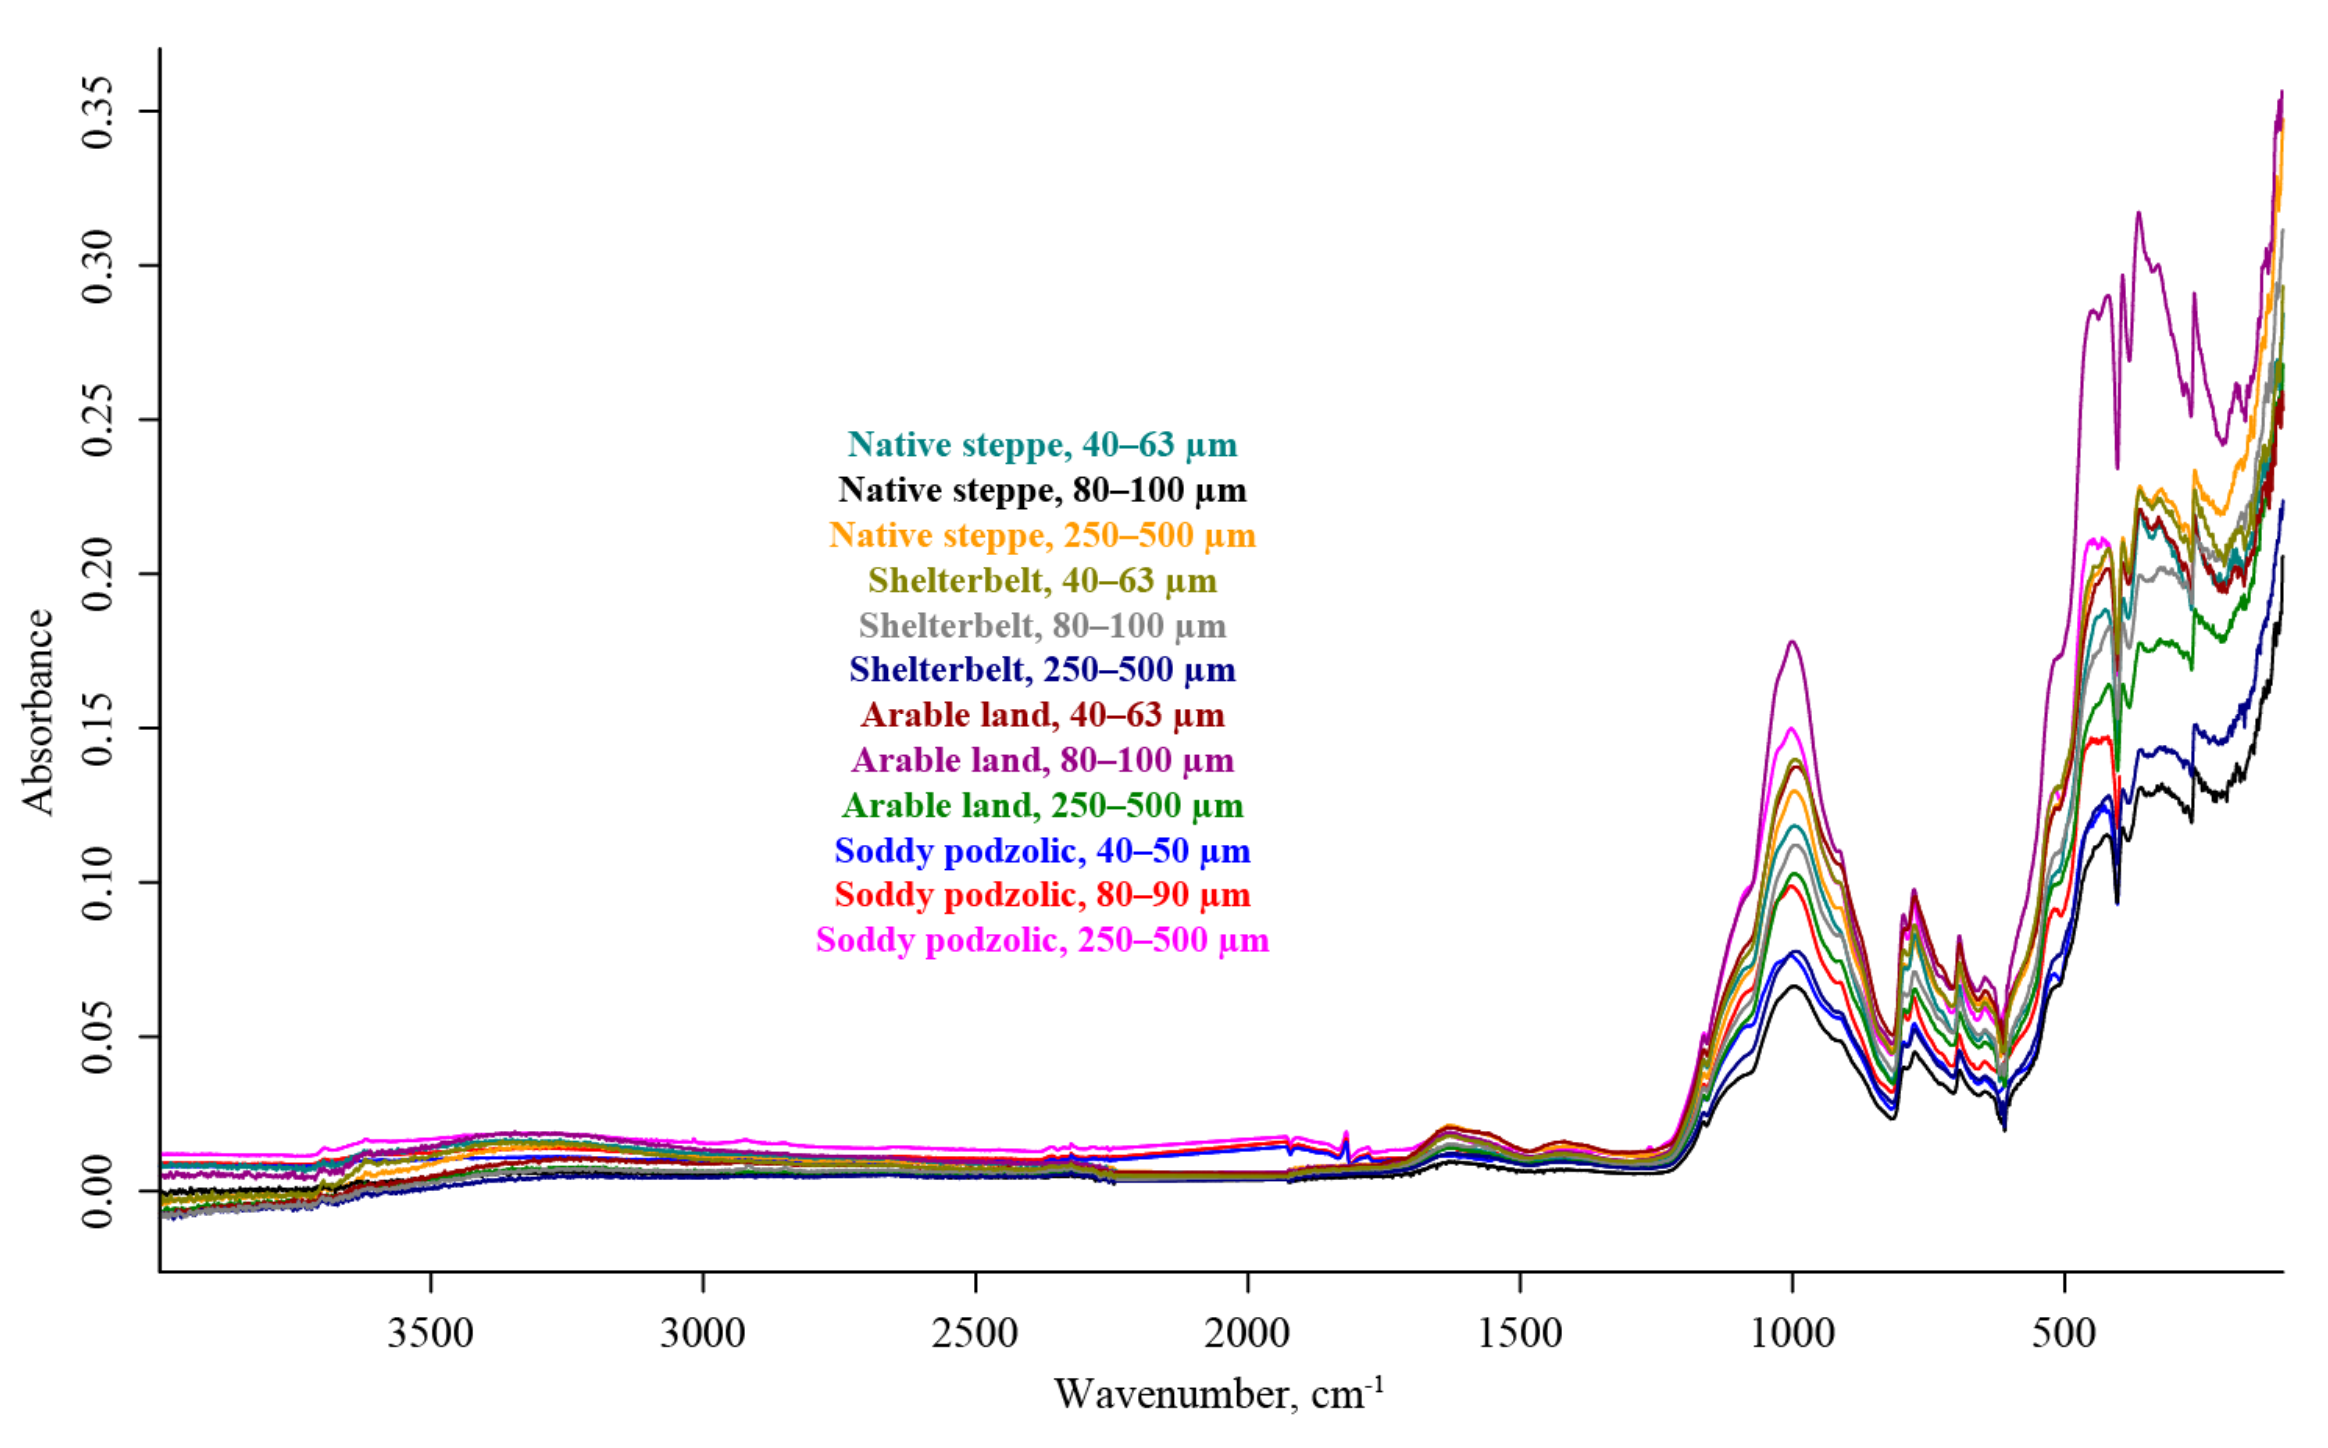
4.3. ATR–FTIR
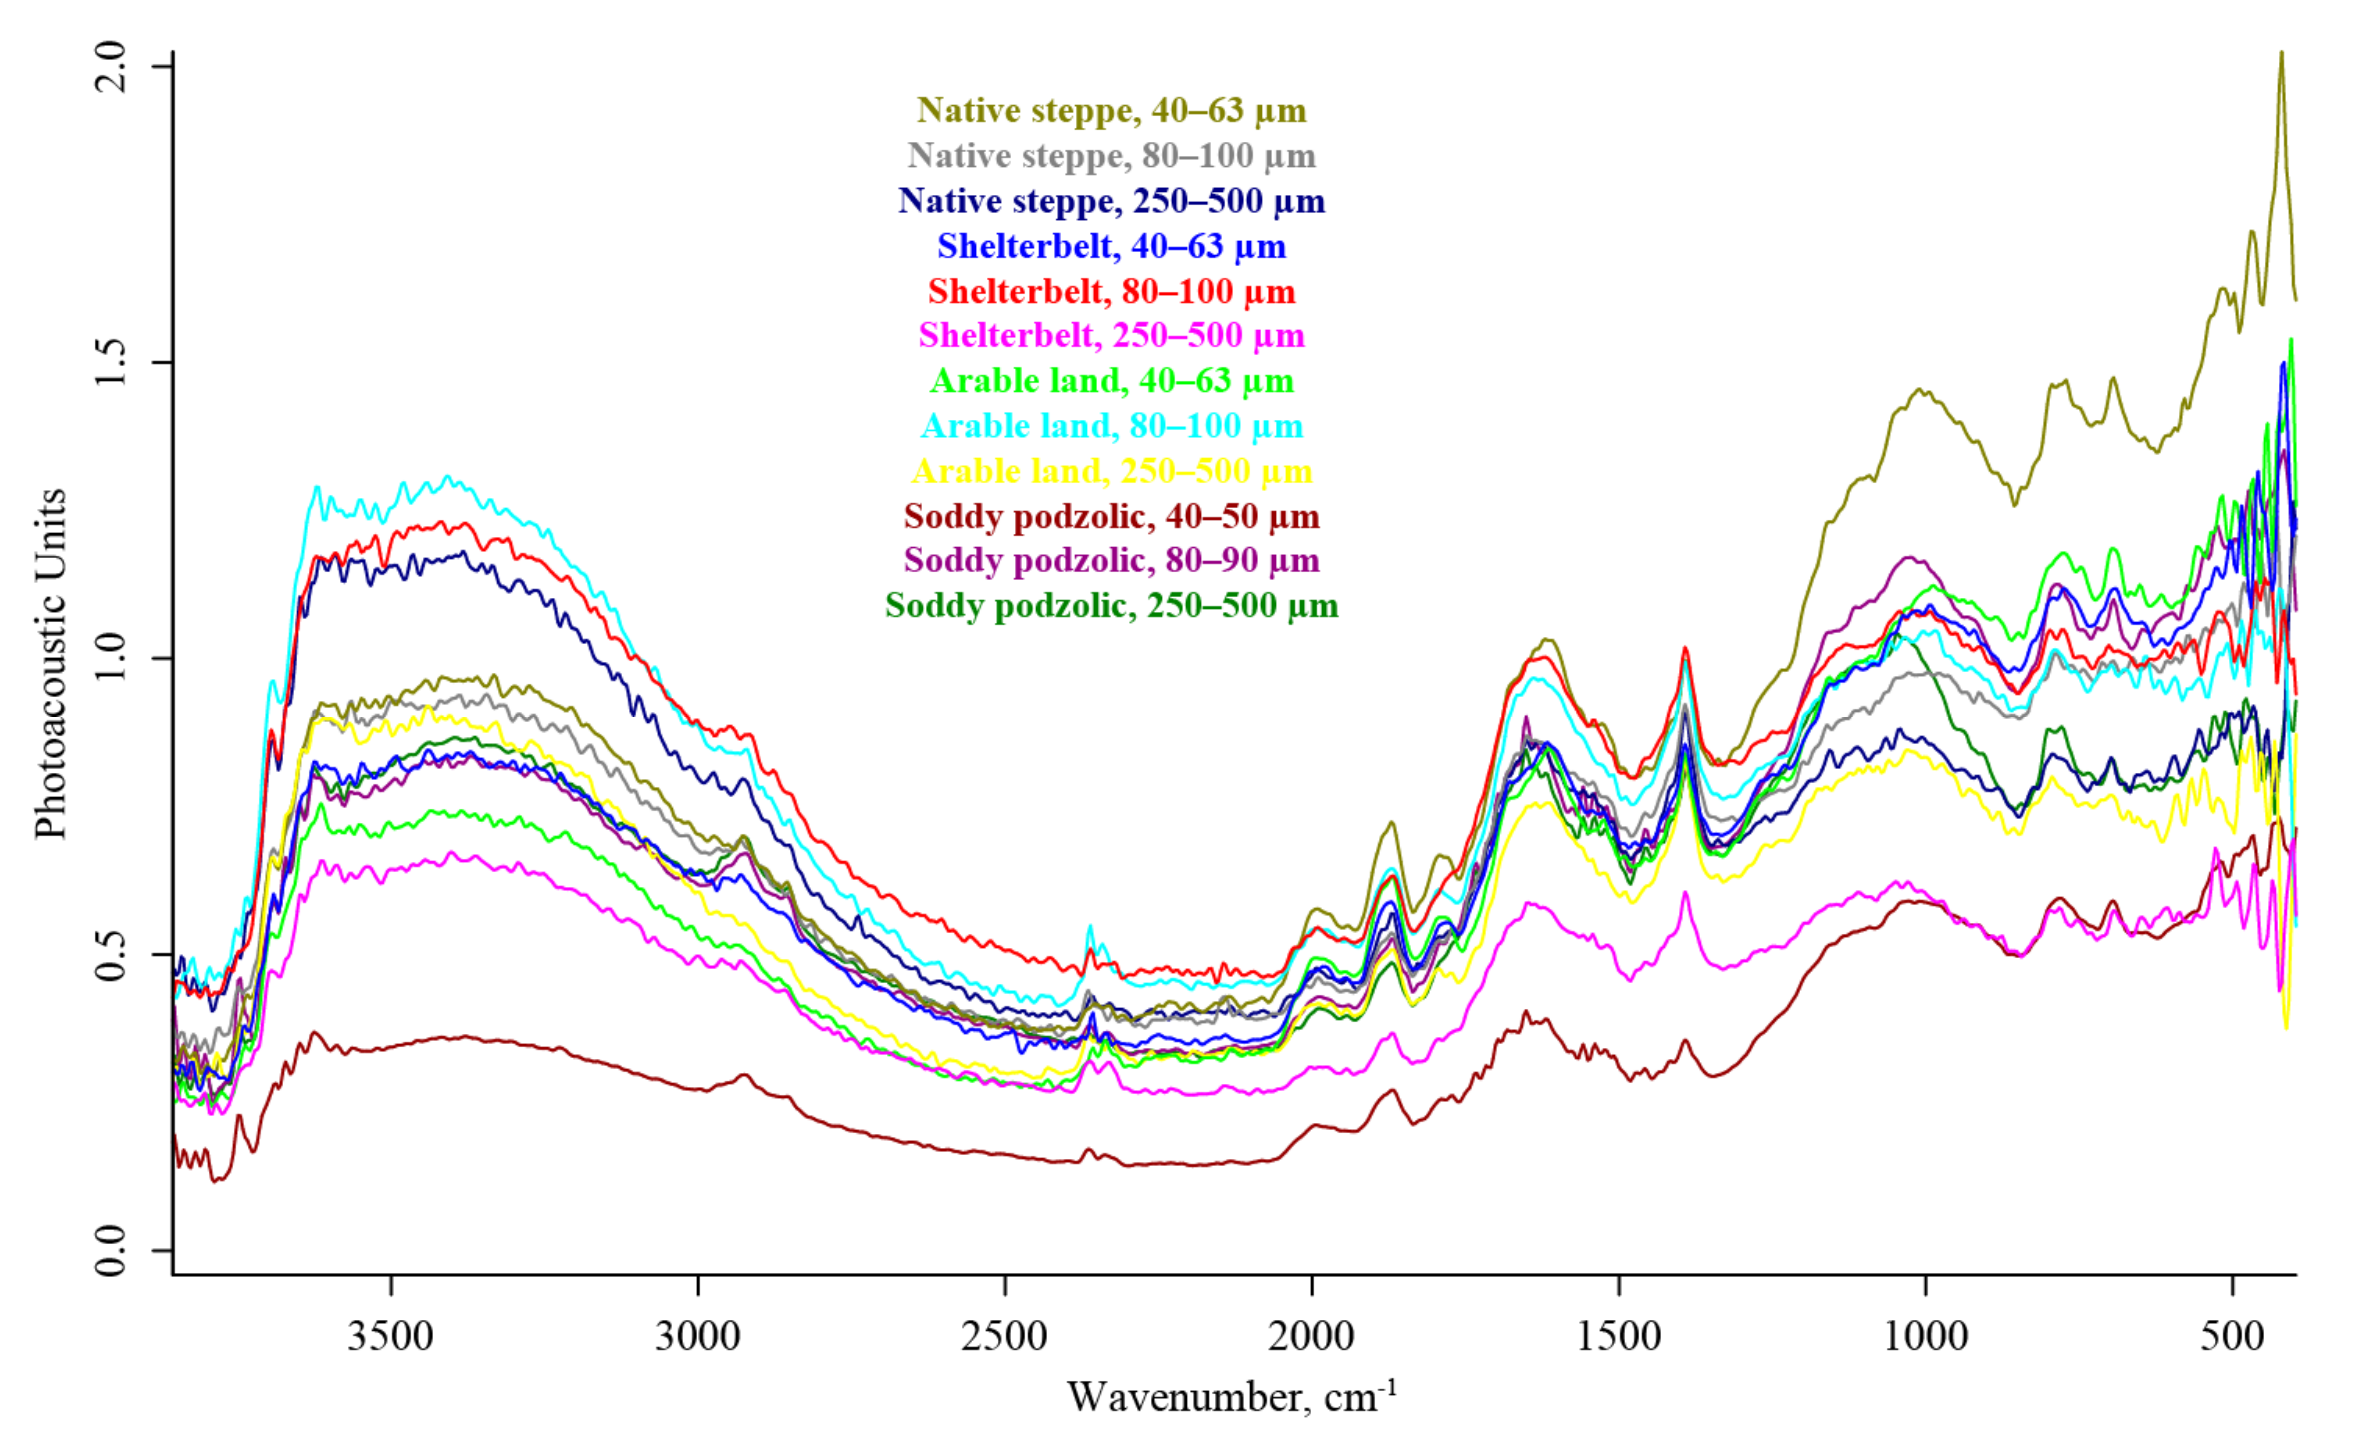
4.4. FTIR–PAS
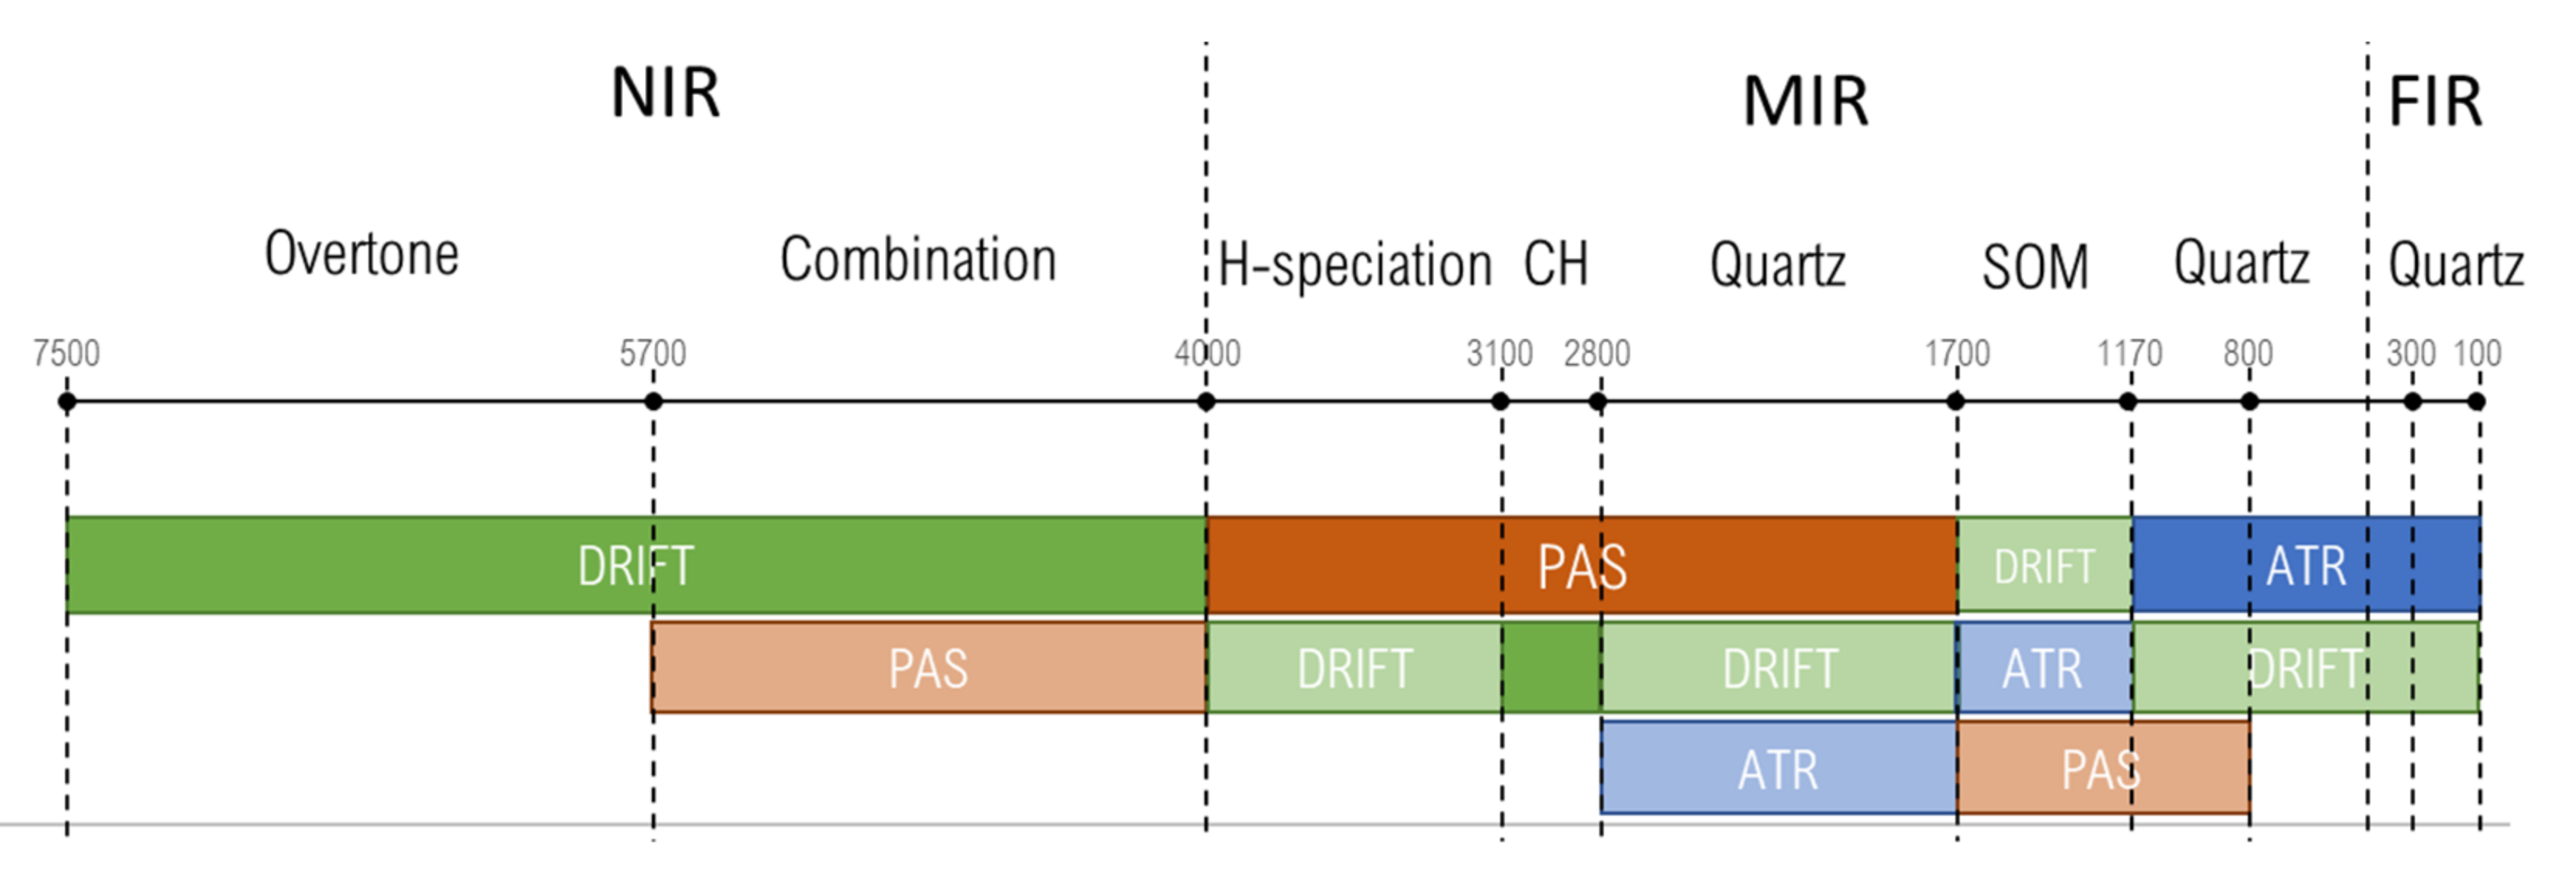
4.5. Summary. Modality Comparison
- A survey of SOM in specific samples (soil types, layers, or similar tasks)—the primary bands of CHx, Amide I–III region, and carboxylate groups—may be implemented with DRIFT and FTIR–PAS. DRIFT can be used in the broadest region for all soil types and fractions; ATR–FTIR could be selected from the viewpoint of simplicity and rapidity and does not require a sensitive detector, though some SOM bands may not be revealed; FTIR–PAS at a low IMF with a check of artifacts from gaseous water can be used the same way as DRIFT.
- A survey of inorganic matrix soil constituents in particular samples (specific soil types, layers, aggregates, fractions), DRIFT should be selected as the primary modality to have the highest sensitivity; ATR–FTIR can also be used as a primary technique but would still require a sensitive detector for the region 2000–1000 cm−1.
- A more widespread and general task of soil comparison simultaneously by SOM and inorganic bands should rely on at least two IR modalities. In this case, DRIFT should be the primary modality to have the highest sensitivity for assessing the maximum number of all the bands. ATR–FTIR and FTIR–PAS cannot be recommended as primary modalities due to low sensitivity in some parts of the spectra and high noise levels. However, DRIFT/ATR–FTIR or FTIR–PAS/ATR–FTIR should be used; most likely, all three modalities may provide the complete picture.
- Finally, a task for FTIR may compare differences in similar samples. For this task, all three modalities should be used together. In this case, DRIFT with a high-sensitive detector is a primary technique used to survey the whole spectrum in the NIR region and mid-IR region 4000–1200 cm−1. It is used to cross-check the major hydrogen-bond, C–H, and HOH bands. ATR–FTIR at 2000–300 cm−1 is used to continue the most information-bearing spectrum from 1500 cm−1 to 150 cm−1. DRIFT and ATR–FTIR can be normalized using three major SiO2 bands at 697 cm−1, 395 cm−1, and 265 cm−1. The region 4000–1500 cm−1 should be covered by DRIFT and FTIR–PAS, and the spectra should be normalized with the triplet at 2000–1700 cm−1. The region 1500–900 cm−1 should be assessed with all three modalities (preferably, FTIR–PAS at two IMFs, a rapid and a slow scan mode). This approach would reveal possible artifact bands, optical/thermal saturation and provide information on the nature of complex bands. As we mentioned above, DRIFT measurements should be corrected to radiation reflections from matrix particles, and FTIR–PAS or ATR–FTIR may be a valuable addition as less dependent on the particle size.
5. Conclusions
Supplementary Materials
Author Contributions
Funding
Data Availability Statement
Acknowledgments
Conflicts of Interest
References
- Ichwana, I.; Nasution, Z.; Munawar, A.A. The application of fourier transform infrared photoacoustics spectroscopy (FTIR-PAS) for rapid soil quality evaluation. Rona Tek. Pertan. 2017, 1, 1–10. [Google Scholar] [CrossRef]
- Volkov, D.S.; Rogova, O.B.; Proskurnin, M.A. Photoacoustic and photothermal methods in spectroscopy and characterization of soils and soil organic matter. Photoacoustics 2020, 17, 100151. [Google Scholar] [CrossRef] [PubMed]
- Imeson, A. Desertification, Land Degradation and Sustainability; Wiley: Chichester, UK, 2012. [Google Scholar]
- Boix-Fayos, C.; Calvo-Cases, A.; Imeson, A.C.; Soriano-Soto, M.D. Influence of soil properties on the aggregation of some Mediterranean soils and the use of aggregate size and stability as land degradation indicators. Catena 2001, 44, 47–67. [Google Scholar] [CrossRef]
- Delelegn, Y.T.; Purahong, W.; Blazevic, A.; Yitaferu, B.; Wubet, T.; Goransson, H.; Godbold, D.L. Changes in land use alter soil quality and aggregate stability in the highlands of northern Ethiopia. Sci. Rep. 2017, 7, 1–12. [Google Scholar] [CrossRef]
- Sorour, M.M.; Saleh, M.M.; Mahmoud, R.A. Thermal conductivity and diffusivity of soil. Int. Commun. Heat Mass Transf. 1990, 17, 189–199. [Google Scholar] [CrossRef]
- Bristow, K.L.; Kluitenberg, G.J.; Goding, C.J.; Fitzgerald, T.S. A small multi-needle probe for measuring soil thermal properties, water content and electrical conductivity. Comput. Electron. Agric. 2001, 31, 265–280. [Google Scholar] [CrossRef]
- Jong van Lier, Q.d.; Durigon, A. Soil thermal diffusivity estimated from data of soil temperature and single soil component properties. Rev. Bras. Ciência Solo 2013, 37, 106–112. [Google Scholar] [CrossRef]
- Józefaciuk, G.; Sławiński, C.; Walczak, R.T.; Bieganowski, A. Review of Current Problems in Agrophysics; Inst. of Agrophysics PAS: Lublin, Poland, 2005. [Google Scholar]
- Lal, R. Soil carbon sequestration impacts on global climate change and food security. Science 2004, 304, 1623–1627. [Google Scholar] [CrossRef]
- Chen, Y.; Zou, C.; Mastalerz, M.; Hu, S.; Gasaway, C.; Tao, X. Applications of micro-fourier transform infrared spectroscopy (FTIR) in the geological sciences--A review. Int. J. Mol. Sci. 2015, 16, 30223–30250. [Google Scholar] [CrossRef]
- Falkowski, P.; Scholes, R.J.; Boyle, E.; Canadell, J.; Canfield, D.; Elser, J.; Gruber, N.; Hibbard, K.; Hogberg, P.; Linder, S.; et al. The global carbon cycle: A test of our knowledge of earth as a system. Science 2000, 290, 291–296. [Google Scholar] [CrossRef]
- Pansu, M.; Gautheyrou, J. Characterization of humic compounds. In Handbook of Soil Analysis: Mineralogical, Organic and Inorganic Methods; Springer: Berlin/Heidelberg, Germany, 2006; pp. 399–451. [Google Scholar]
- Christensen, B.T. Physical fractionation of soil and organic matter in primary particle size and density separates. In Advances in Soil Science; Stewart, B.A., Ed.; Advances in Soil Science; Springer: New York, NY, USA, 1992; pp. 1–90. [Google Scholar]
- Fultz, L.M.; Moore-Kucera, J.; Calderón, F.; Acosta-Martínez, V. Using fourier-transform mid-infrared spectroscopy to distinguish soil organic matter composition dynamics in aggregate fractions of two agroecosystems. Soil Sci. Soc. Am. J. 2014, 78, 1940–1948. [Google Scholar] [CrossRef]
- Ge, Y.; Thomasson, J.A.; Morgan, C.L.S. Mid-infrared attenuated total reflectance spectroscopy for soil carbon and particle size determination. Geoderma 2014, 213, 57–63. [Google Scholar] [CrossRef]
- Tinti, A.; Tugnoli, V.; Bonora, S.; Francioso, O. Recent applications of vibrational mid-Infrared (IR) spectroscopy for studying soil components: A review. J. Cent. Eur. Agric. 2015, 16, 1–22. [Google Scholar] [CrossRef]
- Linker, R. Application of FTIR spectroscopy to agricultural soils analysis. In Fourier Transforms—New Analytical Approaches and FTIR Strategies; Nikolic, G., Ed.; InTech: London, UK, 2011; pp. 385–404. [Google Scholar]
- Rossel, R.V.; Walvoort, D.J.J.; McBratney, A.B.; Janik, L.J.; Skjemstad, J.O. Visible, near infrared, mid infrared or combined diffuse reflectance spectroscopy for simultaneous assessment of various soil properties. Geoderma 2006, 131, 59–75. [Google Scholar] [CrossRef]
- Volkov, D.S.; Rogova, O.B.; Proskurnin, M.A. Temperature dependences of IR spectra of humic substances of brown coal. Agronomy 2021, 11, 1822. [Google Scholar] [CrossRef]
- Yuan, Y.; Cai, X.; Tan, B.; Zhou, S.; Xing, B. Molecular insights into reversible redox sites in solid-phase humic substances as examined by electrochemical in situ FTIR and two-dimensional correlation spectroscopy. Chem. Geol. 2018, 494, 136–143. [Google Scholar] [CrossRef]
- Karpukhina, E.; Mikheev, I.; Perminova, I.; Volkov, D.; Proskurnin, M. Rapid quantification of humic components in concentrated humate fertilizer solutions by FTIR spectroscopy. J. Soils Sed. 2018, 19, 2729–2739. [Google Scholar] [CrossRef]
- Boguta, P.; Sokołowska, Z.; Skic, K. Use of thermal analysis coupled with differential scanning calorimetry, quadrupole mass spectrometry and infrared spectroscopy (TG-DSC-QMS-FTIR) to monitor chemical properties and thermal stability of fulvic and humic acids. PLoS ONE 2017, 12, e0189653. [Google Scholar] [CrossRef] [PubMed]
- Morra, M.J.; Marshall, D.B.; Lee, C.M. FT-IR analysis of aldrich humic acid in water using cylindrical internal reflectance. Commun. Soil Sci. Plant. Anal. 2008, 20, 851–867. [Google Scholar] [CrossRef]
- Tatzber, M.; Stemmer, M.; Spiegel, H.; Katzlberger, C.; Haberhauer, G.; Mentler, A.; Gerzabek, M.H. FTIR-spectroscopic characterization of humic acids and humin fractions obtained by advanced NaOH, Na4P2O7, and Na2CO3 extraction procedures. J. Plant. Nutr. Soil Sci. 2007, 170, 522–529. [Google Scholar] [CrossRef]
- Tanykova, N.; Petrova, Y.; Kostina, J.; Kozlova, E.; Leushina, E.; Spasennykh, M. Study of organic matter of unconventional reservoirs by IR Spectroscopy and IR microscopy. Geosciences 2021, 11, 277. [Google Scholar] [CrossRef]
- Dudek, M.; Kabała, C.; Łabaz, B.; Mituła, P.; Bednik, M.; Medyńska-Juraszek, A. Mid-infrared spectroscopy supports identification of the origin of organic matter in soils. Land 2021, 10, 215. [Google Scholar] [CrossRef]
- Slaný, M.; Jankovič, Ľ.; Madejová, J. Structural characterization of organo-montmorillonites prepared from a series of primary alkylamines salts: Mid-IR and near-IR study. Appl. Clay Sci. 2019, 176, 11–20. [Google Scholar] [CrossRef]
- Madejová, J.; Sekeráková, Ľ.; Bizovská, V.; Slaný, M.; Jankovič, Ľ. Near-infrared spectroscopy as an effective tool for monitoring the conformation of alkylammonium surfactants in montmorillonite interlayers. Vib. Spectrosc. 2016, 84, 44–52. [Google Scholar] [CrossRef]
- Du, C.; Wang, J.; Zhou, Z.; Shen, Y.; Zhou, J. In situ measurement of ammonia concentration in soil headspace using fourier transform mid-infrared photoacoustic spectroscopy. Pedosphere 2015, 25, 605–612. [Google Scholar] [CrossRef]
- Du, C.; Zhou, J. Evaluation of soil fertility using infrared spectroscopy: A review. Environ. Chem. Lett. 2008, 7, 97–113. [Google Scholar] [CrossRef]
- Ma, F.; Du, C.; Zhang, Y.; Xu, X.; Zhou, J. LIBS and FTIR–ATR spectroscopy studies of mineral–organic associations in saline soil. Land Degrad. Dev. 2020, 32, 1786–1795. [Google Scholar] [CrossRef]
- Woolverton, P.; Dragila, M.I. Characterization of hydrophobic soils: A novel approach using mid-infrared photoacoustic spectroscopy. Appl. Spectrosc. 2014, 68, 1407–1410. [Google Scholar] [CrossRef]
- Xie, H.T.; Yang, X.M.; Drury, C.F.; Yang, J.Y.; Zhang, X.D. Predicting soil organic carbon and total nitrogen using mid- and near-infrared spectra for Brookston clay loam soil in Southwestern Ontario, Canada. Can. J. Soil Sci. 2011, 91, 53–63. [Google Scholar] [CrossRef]
- Calderón, F.J.; Mikha, M.M.; Vigil, M.F.; Nielsen, D.C.; Benjamin, J.G.; Reeves, J.B. Diffuse-reflectance mid-infrared spectral properties of soils under alternative crop rotations in a semi-arid climate. Commun. Soil Sci. Plant. Anal. 2011, 42, 2143–2159. [Google Scholar] [CrossRef]
- Stenberg, B.; Rossel, R.A.V.; Mouazen, A.M.; Wetterlind, J. Visible and near infrared spectroscopy in soil science. Adv. Agron. 2010, 107, 163–215. [Google Scholar]
- Du, C.; Zhou, J.; Wang, H.; Chen, X.; Zhu, A.; Zhang, J. Determination of soil properties using Fourier transform mid-infrared photoacoustic spectroscopy. Vib. Spectrosc. 2009, 49, 32–37. [Google Scholar] [CrossRef]
- Spence, A.; Kelleher, B.P. FT-IR spectroscopic analysis of kaolinite–microbial interactions. Vib. Spectrosc. 2012, 61, 151–155. [Google Scholar] [CrossRef]
- Niemeyer, J.; Chen, Y.; Bollag, J.M. Characterization of humic acids, composts, and peat by diffuse reflectance fourier-transform infrared spectroscopy. Soil Sci. Soc. Am. J. 1992, 56, 135–140. [Google Scholar] [CrossRef]
- Tatzber, M.; Stemmer, M.; Spiegel, H.; Katzlberger, C.; Haberhauer, G.; Gerzabek, M.H. An alternative method to measure carbonate in soils by FT-IR spectroscopy. Environ. Chem. Lett. 2006, 5, 9–12. [Google Scholar] [CrossRef]
- Wang, S.; Zhang, Z.; Yin, X.; Wang, N.; Chen, D. Influences of nitrogen application levels on properties of humic acids in chernozem amended with different types of organic materials. Sustainability 2019, 11, 5405. [Google Scholar] [CrossRef]
- Minasny, B.; Tranter, G.; McBratney, A.B.; Brough, D.M.; Murphy, B.W. Regional transferability of mid-infrared diffuse reflectance spectroscopic prediction for soil chemical properties. Geoderma 2009, 153, 155–162. [Google Scholar] [CrossRef]
- Reeves, J.B. Near- versus mid-infrared diffuse reflectance spectroscopy for soil analysis emphasizing carbon and laboratory versus on-site analysis: Where are we and what needs to be done? Geoderma 2010, 158, 3–14. [Google Scholar] [CrossRef]
- Yeasmin, S.; Singh, B.; Johnston, C.T.; Sparks, D.L. Evaluation of pre-treatment procedures for improved interpretation of mid infrared spectra of soil organic matter. Geoderma 2017, 304, 83–92. [Google Scholar] [CrossRef]
- Leue, M.; Ellerbrock, R.H.; Bänninger, D.; Gerke, H.H. Impact of soil microstructure geometry on DRIFT spectra: Comparisons with beam trace modeling. Soil Sci. Soc. Am. J. 2010, 74, 1976–1986. [Google Scholar] [CrossRef]
- Brown, D.J.; Shepherd, K.D.; Walsh, M.G.; Mays, M.D.; Reinsch, T.G. Global soil characterization with VNIR diffuse reflectance spectroscopy. Geoderma 2006, 132, 273–290. [Google Scholar] [CrossRef]
- Nguyen, T.T.; Janik, L.J.; Raupach, M. Diffuse reflectance infrared fourier transform (DRIFT) spectroscopy in soil studies. Soil Res. 1991, 29, 49–67. [Google Scholar] [CrossRef]
- Mandelis, A.; Boroumand, F.; Van den Bergh, H. Quantitative diffuse reflectance and transmittance spectroscopy of loosely packed powders. Spectrochim. Acta A Mol. Spectrosc. 1991, 47, 943–971. [Google Scholar] [CrossRef]
- Artz, R.R.; Chapman, S.J.; Robertson, A.J.; Potts, J.; Laggoun-Défarge, F.; Gogo, S.; Comont, L.; Disnar, J.-R.; Francez, A.-J. FTIR spectroscopy can be used as a screening tool for organic matter quality in regenerating cutover peatlands. Soil Biol. Biochem. 2008, 40, 515–527. [Google Scholar] [CrossRef]
- Artz, R.; Chapman, S.; Campbell, C.D. Substrate utilisation profiles of microbial communities in peat are depth dependent and correlate with whole soil FTIR profiles. Soil Biol. Biochem. 2006, 38, 2958–2962. [Google Scholar] [CrossRef]
- Fernandes, A.N.; Giovanela, M.; Esteves, V.I.; Sierra, M.M.d.S. Elemental and spectral properties of peat and soil samples and their respective humic substances. J. Mol. Struct. 2010, 971, 33–38. [Google Scholar] [CrossRef]
- Krivoshein, P.K.; Volkov, D.S.; Rogova, O.B.; Proskurnin, M.A. FTIR photoacoustic spectroscopy for identification and assessment of soil components: Chernozems and their size fractions. Photoacoustics 2020, 18, 100162. [Google Scholar] [CrossRef] [PubMed]
- Xing, Z.; Tian, K.; Du, C.; Li, C.; Zhou, J.; Chen, Z. Agricultural soil characterization by FTIR spectroscopy at micrometer scales: Depth profiling by photoacoustic spectroscopy. Geoderma 2019, 335, 94–103. [Google Scholar] [CrossRef]
- Vaudour, E.; Cerovic, Z.G.; Ebengo, D.M.; Latouche, G. Predicting key agronomic soil properties with UV-Vis fluorescence measurements combined with Vis-NIR-SWIR reflectance spectroscopy: A farm-scale study in a Mediterranean viticultural agroecosystem. Sensors 2018, 18, 1157. [Google Scholar] [CrossRef] [PubMed]
- Yeasmin, S.; Singh, B.; Johnston, C.T.; Sparks, D.L. Organic carbon characteristics in density fractions of soils with contrasting mineralogies. Geochim. Cosmochim. Acta 2017, 218, 215–236. [Google Scholar] [CrossRef]
- Janik, L.J.; Merry, R.H.; Forrester, S.T.; Lanyon, D.M.; Rawson, A. rapid prediction of soil water retention using mid infrared spectroscopy. Soil Sci. Soc. Am. J. 2007, 71, 507–514. [Google Scholar] [CrossRef]
- Jahn, B.R.; Linker, R.; Upadhyaya, S.K.; Shaviv, A.; Slaughter, D.C.; Shmulevich, I. Mid-infrared spectroscopic determination of soil nitrate content. Biosys. Eng. 2006, 94, 505–515. [Google Scholar] [CrossRef]
- Linker, R.; Weiner, M.; Shmulevich, I.; Shaviv, A. Nitrate determination in soil pastes using attenuated total reflectance mid-infrared spectroscopy: Improved accuracy via soil identification. Biosys. Eng. 2006, 94, 111–118. [Google Scholar] [CrossRef]
- Linker, R.; Shmulevich, I.; Kenny, A.; Shaviv, A. Soil identification and chemometrics for direct determination of nitrate in soils using FTIR-ATR mid-infrared spectroscopy. Chemosphere 2005, 61, 652–658. [Google Scholar] [CrossRef] [PubMed]
- Liu, L.; Huan, H.; Zhang, M.; Shao, X.; Zhao, B.; Cui, X.; Zhu, L. Photoacoustic spectrometric evaluation of soil heavy metal contaminants. IEEE Photonics J. 2019, 11, 1–7. [Google Scholar] [CrossRef]
- Xing, Z.; Du, C.; Tian, K.; Ma, F.; Shen, Y.; Zhou, J. Application of FTIR-PAS and Raman spectroscopies for the determination of organic matter in farmland soils. Talanta 2016, 158, 262–269. [Google Scholar] [CrossRef]
- Du, C.; Linker, R.; Shaviv, A. Identification of agricultural Mediterranean soils using mid-infrared photoacoustic spectroscopy. Geoderma 2008, 143, 85–90. [Google Scholar] [CrossRef]
- Du, C.; Linker, R.; Shaviv, A. Characterization of soils using photoacoustic mid-infrared spectroscopy. Appl. Spectrosc. 2007, 61, 1063–1067. [Google Scholar]
- Manhães, R.S.T.; Auler, L.T.; Sthel, M.S.; Alexandre, J.; Massunaga, M.S.O.; Carrió, J.G.; Dos Santos, D.R.; Da Silva, E.C.; Garcia-Quiroz, A.; Vargas, H. Soil characterisation using X-ray diffraction, photoacoustic spectroscopy and electron paramagnetic resonance. Appl. Clay Sci. 2002, 21, 303–311. [Google Scholar] [CrossRef]
- Schmidt, R.L. Applications of photoacoustic spectroscopy to the study of soils and clay minerals. In Advanced Chemical Methods for Soil and Clay Minerals Research; Stucki, J.W., Banwart, W.L., Eds.; Springer: Dordrecht, Germany, 1980; pp. 451–465. [Google Scholar]
- Bauer, A.; Hertzberg, O.; Kuderle, A.; Strobel, D.; Pleitez, M.A.; Mantele, W. IR-spectroscopy of skin in vivo: Optimal skin sites and properties for non-invasive glucose measurement by photoacoustic and photothermal spectroscopy. J. Biophoton. 2018, 11, e201600261. [Google Scholar] [CrossRef]
- Brangule, A.; Skadins, I.; Reinis, A.; Gross, K.A.; Kroica, J. In vitro characterization perspectives using fourier transform infrared photoacoustic spectroscopy (FTIR-PAS) and diffuse reflectance infrared spectroscopy (DRIFT). Key Eng. Mater. 2017, 758, 273–277. [Google Scholar] [CrossRef]
- Kizil, R.; Irudayaraj, J. Fourier transform infrared photoacoustic spectroscopy (FTIR-PAS). In Encyclopedia of Biophysics; Roberts, G.C.K., Ed.; Springer: Berlin/Heidelberg, Germany, 2013; pp. 840–844. [Google Scholar]
- Michaelian, K.H.; Wen, Q. Photoacoustic infrared spectroscopy of solids. J. Phys. Conf. Ser. 2010, 214, 012004. [Google Scholar] [CrossRef]
- Changwen, D.; Jianmin, Z.; Goyne, K.W. Organic and inorganic carbon in paddy soil as evaluated by mid-infrared photoacoustic spectroscopy. PLoS ONE 2012, 7, e43368. [Google Scholar] [CrossRef] [PubMed]
- Doerr, S.H.; Thomas, A.D. The role of soil moisture in controlling water repellency: New evidence from forest soils in Portugal. J. Hydrol. 2000, 231-232, 134–147. [Google Scholar] [CrossRef]
- Ma’Shum, M.; Tate, M.E.; Jones, G.P.; Oades, J.M. Extraction and characterization of water-repellent materials from Australian soils. J. Soil Sci. 1988, 39, 99–110. [Google Scholar] [CrossRef]
- Du, C.; Ma, Z.; Zhou, J.; Goyne, K.W. Application of mid-infrared photoacoustic spectroscopy in monitoring carbonate content in soils. Sens. Actuat. B 2013, 188, 1167–1175. [Google Scholar] [CrossRef]
- Ma, F.; Zeng, Y.; Du, C.; Shen, Y.; Ma, H.; Xu, S.; Zhou, J. Soil variability description using Fourier transform mid-infrared photoacoustic spectroscopy coupling with RGB method. Catena 2017, 152, 190–197. [Google Scholar] [CrossRef]
- Du, C.; Zhou, J.; Liu, J. Identification of Chinese medicinal fungus Cordyceps sinensis by depth-profiling mid-infrared photoacoustic spectroscopy. Spectrochim. Acta A Mol. Biomol. Spectrosc. 2017, 173, 489–494. [Google Scholar] [CrossRef]
- Ma, F.; Du, C.; Zhou, J. A self-adaptive model for the prediction of soil organic matter using mid-infrared photoacoustic spectroscopy. Soil Sci. Soc. Am. J. 2016, 80. [Google Scholar] [CrossRef]
- Peltre, C.; Bruun, S.; Du, C.; Thomsen, I.K.; Jensen, L.S. Assessing soil constituents and labile soil organic carbon by mid-infrared photoacoustic spectroscopy. Soil Biol. Biochem. 2014, 77, 41–50. [Google Scholar] [CrossRef]
- Du, C.; Goyne, K.W.; Miles, R.J.; Zhou, J. A 1915–2011 microscale record of soil organic matter under wheat cultivation using FTIR-PAS depth-profiling. Agron. Sustain. Dev. 2013, 34, 803–811. [Google Scholar] [CrossRef]
- Huang, P.-M.; Wang, M.-K.; Chiu, C.-Y. Soil mineral–organic matter–microbe interactions: Impacts on biogeochemical processes and biodiversity in soils. Pedobiologia 2005, 49, 609–635. [Google Scholar] [CrossRef]
- Du, C.; Zhou, G.; Wang, H.; Chen, X.; Zhou, J. Depth profiling of clay–xanthan complexes using step-scan mid-infrared photoacoustic spectroscopy. J. Soils Sed. 2010, 10, 855–862. [Google Scholar] [CrossRef]
- Pasieczna-Patkowska, S.; Madej, J. Comparison of photoacoustic, diffuse reflectance, attenuated total reflectance and transmission infrared spectroscopy for the study of biochars. Pol. J. Chem. Technol. 2018, 20, 75–83. [Google Scholar] [CrossRef]
- Sorokina, N.P.; Kozlov, D.N.; Kuznetsova, I.V. Assessment of the postagrogenic transformation of soddy-podzolic soils: Cartographic and analytic support. Eurasian Soil Sci. 2013, 46, 1007–1019. [Google Scholar] [CrossRef]
- Travnikova, L.S.; Artem’eva, Z.S.; Sorokina, N.P. Distribution of the particle-size fractions in soddy-podzolic soils subjected to sheet erosion. Eurasian Soil Sci. 2010, 43, 459–467. [Google Scholar] [CrossRef]
- Volkov, D.S.; Rogova, O.B.; Proskurnin, M.A.; Farkhodov, Y.R.; Markeeva, L.B. Thermal stability of organic matter of typical chernozems under different land uses. Soil Tillage Res. 2020, 197, 104500. [Google Scholar] [CrossRef]
- Cherkassov, G.N.; Masyutenko, N.P.; Gostev, A.V.; Pykhtin, I.G.; Zdorovtsov, I.P.; Akimenko, A.S. Long-term field experiments on chernozemic soils of kursk region, Russia. In Proceedings of the Soil Organic Matter Dynamics in Long-Therm Field Experiments and their Modelling, Kursk, Russia, 14–17 September 2010; p. 35. [Google Scholar]
- Kuznetsova, I.V. Changes in the physical status of the typical and leached chernozems of Kursk oblast within 40 years. Eurasian Soil Sci. 2013, 46, 393–400. [Google Scholar] [CrossRef]
- Khaidapova, D.D.; Chestnova, V.V.; Shein, E.V.; Milanovskii, E.Y. Rheological properties of typical chernozems (Kursk oblast) under different land uses. Eurasian Soil Sci. 2016, 49, 890–897. [Google Scholar] [CrossRef]
- McClelland, J.F.; Jones, R.W.; Bajic, S.J.; Griffiths, P.R. Photoacoustic spectroscopy. In Handbook of Vibrational Spectroscopy; Chalmers, J.M., Griffiths, P.R., Eds.; Wiley: Chichester, UK, 2006. [Google Scholar]
- Michaelian, K.H. Photoacoustic IR Spectroscopy: Instrumentation, Applications and Data Analysis, 2nd ed.; Revised and Enlarged Edition Ed.; Wiley-VCH: Weinheim, Germany, 2010; p. 402. [Google Scholar]
- Khaidapova, D.D.; Klyueva, V.V.; Skvortsova, E.B.; Abrosimov, K.N. Rheological properties and tomographically determined pore space of undisturbed samples of typical chernozems and soddy-podzolic soils. Eurasian Soil Sci. 2018, 51, 1191–1199. [Google Scholar] [CrossRef]
- Chizhikova, N.; Varlamov, E.; Savich, V. Behavior of minerals in agro soddy podzolic soils resulted from different rates of organic fertilizers. Dokuchaev Soil Bull. 2014, 91–110. [Google Scholar] [CrossRef]
- Goncharov, V.D.; Moiseev, K.G. Dependence of the aggregate swelling parameters in soddy-podzolic soils on their properties. Eurasian Soil Sci. 2013, 46, 548–555. [Google Scholar] [CrossRef]
- Gusarov, A.V.; Sharifullin, A.G.; Golosov, V.N. Contemporary trend in erosion of arable ordinary chernozems (Haplic Chernozems (Pachic)) within the Volga Upland (Saratov Oblast, Russia). Eurasian Soil Sci. 2018, 51, 1514–1532. [Google Scholar] [CrossRef]
- Chendev, Y.G.; Khokhlova, O.S.; Alexandrovskiy, A.L. Agrogenic evolution of automorphic chernozems in the forest-steppe zone (Belgorod oblast). Eurasian Soil Sci. 2017, 50, 499–514. [Google Scholar] [CrossRef]
- Mikhailova, E.A.; Post, C.J. Organic carbon stocks in the Russian Chernozem. Eur. J. Soil Sci. 2006, 57, 330–336. [Google Scholar] [CrossRef]
- Schwanninger, M.; Rodrigues, J.C.; Fackler, K. A review of band assignments in near infrared spectra of wood and wood components. J. Near Infrared Spectrosc. 2011, 19, 287–308. [Google Scholar] [CrossRef]
- Beć, K.B.; Futami, Y.; Wójcik, M.J.; Ozaki, Y. A spectroscopic and theoretical study in the near-infrared region of low concentration aliphatic alcohols. Phys. Chem. Chem. Phys. 2016, 18, 13666–13682. [Google Scholar] [CrossRef] [PubMed]
- Krongtaew, C.; Messner, K.; Ters, T.; Fackler, K. Characterization of key parameters for biotechnological lignocellulose conversion assessed by FT-NIR spectroscopy. Part I: Qualitative analysis of pretreated straw. BioResources 2010, 5, 2063–2080. [Google Scholar]
- Workman, J.; Weyer, L. Practical Guide to Interpretive Near-Infrared Spectroscopy; CRC Press: Boca Raton, USA, 2007. [Google Scholar]
- Heaney, P.J.; Kronenberg, A.K.; Prewitt, C.T.; Gibbs, G.V. Chapter 4. Hydrogen speciation and chemical weakening of quartz. In Silica; De Gruyter: Berlin, Germany, 1994; pp. 123–176. [Google Scholar]
- Russell, J.D.; Fraser, A.R. Infrared methods. In Clay Mineralogy: Spectroscopic and Chemical Determinative Methods; Wilson, M.J., Ed.; Springer: Dordrecht, The Netherlands, 1994; pp. 11–67. [Google Scholar]
- Madejová, J.; Komadel, P. Baseline studies of the clay minerals society source clays: Infrared methods. Clays Clay Miner. 2001, 49, 410–432. [Google Scholar] [CrossRef]
- Marchessault, R.H.; Liang, C.Y. Infrared spectra of crystalline polysaccharides. III. Mercerized cellulose. J. Polym. Sci. 1960, 43, 71–84. [Google Scholar] [CrossRef]
- Hofmeister, A.M.; Bowey, J.E. Quantitative infrared spectra of hydrosilicates and related minerals. Mon. Not. R. Astron. Soc. 2006, 367, 577–591. [Google Scholar] [CrossRef]
- Shinoda, K.; Aikawa, N. Absorption coefficients of overtone and combination modes of quartz. Mineral. Mag. 1994, 58, 601–606. [Google Scholar] [CrossRef]
- Spitzer, W.G.; Kleinman, D.A. Infrared lattice bands of quartz. Phys. Rev. 1961, 121, 1324–1335. [Google Scholar] [CrossRef]
- Calderón, F.J.; Reeves, J.B.; Collins, H.P.; Paul, E.A. Chemical differences in soil organic matter fractions determined by diffuse-reflectance mid-infrared spectroscopy. Soil Sci. Soc. Am. J. 2011, 75, 568–579. [Google Scholar] [CrossRef]
- Changwen, D.; Jing, D.; Jianmin, Z.; Huoyan, W.; Xiaoqin, C. Characterization of greenhouse soil properties using mid-infrared photoacoustic spectroscopy. Spectrosc. Lett. 2011, 44, 359–368. [Google Scholar] [CrossRef]
- Holman, H.-Y.N.; Wozei, E.; Lin, Z.; Comolli, L.R.; Ball, D.A.; Borglin, S.; Fields, M.W.; Hazen, T.C.; Downing, K.H. Real-time molecular monitoring of chemical environment in obligate anaerobes during oxygen adaptive response. Proc. Natl. Acad. Sci. USA 2009, 106, 12599–12604. [Google Scholar] [CrossRef] [PubMed]
- Max, J.-J.; Chapados, C. Isotope effects in liquid water by infrared spectroscopy. III. H2O and D2O spectra from 6000 to 0 cm (-1). J. Chem. Phys. 2009, 131, 184505. [Google Scholar] [CrossRef] [PubMed]
- Tan, C.Z. Optical interference in overtones and combination bands in α-quartz. J. Phys. Chem. Solids 2003, 64, 121–125. [Google Scholar] [CrossRef]
- Hadži, D.; Pintar, M. The OH in-plane deformation and the C-O stretching frequencies in monomeric carboxylic acids and their association shifts. Spectrochim. Acta 1958, 12, 162–168. [Google Scholar] [CrossRef]
- Asselin, M.; Sandorfy, C. Anharmonicity and hydrogen bonding. The in-plane OH bending and its combination with the OH stretching vibration. Can. J. Chem. 1971, 49, 1539–1544. [Google Scholar] [CrossRef]
- Bock, J.; Su, G.-J. Interpretation of the infrared spectra of fused silica. J. Am. Ceram. Soc. 1970, 53, 69–73. [Google Scholar] [CrossRef]
- Senesi, N.; D’Orazio, V.; Ricca, G. Humic acids in the first generation of EUROSOILS. Geoderma 2003, 116, 325–344. [Google Scholar] [CrossRef]
- Koike, C.; Noguchi, R.; Chihara, H.; Suto, H.; Ohtaka, O.; Imai, Y.; Matsumoto, T.; Tsuchiyama, A. Infrared spectra of silica polymorphs and the conditions of their formation. Astrophys. J. 2013, 778, 60. [Google Scholar] [CrossRef]
- Cavalli, M.; Gnappi, G.; Montenero, A.; Bersani, D.; Lottici, P.P.; Kaciulis, S.; Mattogno, G.; Fini, M. Hydroxy- and fluorapatite films on Ti alloy substrates: Sol-gel preparation and characterization. J. Mater. Sci. 2001, 36, 3253–3260. [Google Scholar] [CrossRef]
- Lucas, S.; Tognonvi, M.T.; Gelet, J.-L.; Soro, J.; Rossignol, S. Interactions between silica sand and sodium silicate solution during consolidation process. J. Non-Cryst. Solids 2011, 357, 1310–1318. [Google Scholar] [CrossRef]
- Bleken, B.T.; Mino, L.; Giordanino, F.; Beato, P.; Svelle, S.; Lillerud, K.P.; Bordiga, S. Probing the surface of nanosheet H-ZSM-5 with FTIR spectroscopy. Phys. Chem. Chem. Phys. 2013, 15, 13363–13370. [Google Scholar] [CrossRef]
- De Benedetto, G.E.; Laviano, R.; Sabbatini, L.; Zambonin, P.G. Infrared spectroscopy in the mineralogical characterization of ancient pottery. J. Cult. Herit. 2002, 3, 177–186. [Google Scholar] [CrossRef]
- Roeges, N.P.G. A Guide to the Complete Interpretation of Infrared Spectral of Organic Structures; Wiley: Chichester, UK, 1994. [Google Scholar]
- Yu, H.-G.; Nyman, G. The infrared and Uv-visible spectra of polycyclic aromatic hydrocarbons containing (5, 7)-member ring defects: A theoretical study. Astrophys. J. 2012, 751, 3. [Google Scholar] [CrossRef]
- Inoue, A.; Watanabe, T. Infrared spectra of interstratified illite/smectite from hydrothermally altered tuffs (Shinzan, Japan) and diagenetic bentonites (Kinnekulle, Sweden). Clay Sci. 1989, 7, 263–275. [Google Scholar] [CrossRef]
- Noda, L.; Sensato, F.; Gonçalves, N. Titanyl sulphate, an inorganic polymer: Structural studies and vibrational assignment. Química Nova 2019, 42, 1112–1115. [Google Scholar] [CrossRef]
- Workman, J. The Handbook of Organic Compounds, Three-Volume Set: NIR, IR, R, and UV-Vis Spectra Featuring Polymers and Surfactants; Elsevier Science: Amsterdam, The Netherlands, 2000. [Google Scholar]
- Rothman, L.S. Infrared energy levels and intensities of carbon dioxide. Part 3. Appl. Opt. 1986, 25, 1795–1816. [Google Scholar] [CrossRef]
- Lin-Vien, D.; Colthup, N.B.; Fateley, W.G.; Grasselli, J.G. The Handbook of Infrared and Raman Characteristic Frequencies of Organic Molecules; Elsevier Science: Amsterdam, The Netherlands, 1991. [Google Scholar]
- Frost, R.L.; Vassallo, A.M. The dehydroxylation of the kaolinite clay minerals using infrared emission spectroscopy. Clays Clay Miner. 1996, 44, 635–651. [Google Scholar] [CrossRef]
- Vempati, R.K.; Loeppert, R.H.; Sittertz-Bhatkar, H.; Burghardt, R.C. Infrared vibrations of hematite formed from aqueous- and dry-thermal incubation of si-containing ferrihydrite. Clays Clay Miner. 1990, 38, 294–298. [Google Scholar] [CrossRef]
- Wenrich, M.L.; Christensen, P.R. Optical constants of minerals derived from emission spectroscopy: Application to quartz. J. Geophys. Res. Solid Earth 1996, 101, 15921–15931. [Google Scholar] [CrossRef]
- Colthup, N.B.; Daly, L.H.; Wiberley, S.E. Introduction to Infrared and Raman Spectroscopy; Elsevier Science: Amsterdam, The Netherlands, 1990. [Google Scholar]
- Chen, S.; Yin, X.; Wang, S.; Wu, J. Effects of organic material types on temporal changes in characteristics of humic acids extracted from a chernozem. Sustainability 2019, 11, 5683. [Google Scholar] [CrossRef]
- Tatzber, M.; Mutsch, F.; Mentler, A.; Leitgeb, E.; Englisch, M.; Gerzabek, M.H. Determination of organic and inorganic carbon in forest soil samples by mid-infrared spectroscopy and partial least squares regression. Appl. Spectrosc. 2010, 64, 1167–1175. [Google Scholar] [CrossRef] [PubMed]
- Sahba, N.; Rockett, T.J. Infrared absorption coefficients of silica glasses. J. Am. Ceram. Soc. 1992, 75, 209–212. [Google Scholar] [CrossRef]
- Cummings, K.D.; Tanner, D.B. Far-infrared ordinary-ray optical constants of quartz. J. Opt. Soc. Am. 1980, 70, 123–126. [Google Scholar] [CrossRef]
- Beder, E.C.; Bass, C.D.; Shackleford, W.L. Transmissivity and absorption of fused quartz between 0.22 μ and 3.5 μ from room temperature to 1500 °C. Appl. Opt. 1971, 10, 2263–2268. [Google Scholar] [CrossRef] [PubMed]
- Bertaux, J.; Froehlich, F.; Ildefonse, P. Multicomponent analysis of FTIR spectra; quantification of amorphous and crystallized mineral phases in synthetic and natural sediments. J. Sediment. Res. 1998, 68, 440–447. [Google Scholar] [CrossRef]
- Volkov, D.S.; Krivoshein, P.K.; Proskurnin, M.A. Detonation nanodiamonds: A comparison study by photoacoustic, diffuse reflectance, and attenuated total reflection FTIR spectroscopies. Nanomaterials 2020, 10, 2501. [Google Scholar] [CrossRef] [PubMed]
- Spitsyn, B.V.; Davidson, J.L.; Gradoboev, M.N.; Galushko, T.B.; Serebryakova, N.V.; Karpukhina, T.A.; Kulakova, I.I.; Melnik, N.N. Inroad to modification of detonation nanodiamond. Diam. Relat. Mater. 2006, 15, 296–299. [Google Scholar] [CrossRef]
- Park, Y.; Noda, I.; Jung, Y.M. Novel developments and applications of two-dimensional correlation spectroscopy. J. Mol. Struct. 2016, 1124, 11–28. [Google Scholar] [CrossRef]
- Ma, F.; Chen, J.-b.; Wu, X.-X.; Zhou, Q.; Sun, S.-Q. Rapid discrimination of Panax notogeinseng of different grades by FT-IR and 2DCOS-IR. J. Mol. Struct. 2016, 1124, 131–137. [Google Scholar] [CrossRef]
- Noda, I. Frontiers of two-dimensional correlation spectroscopy. Part 1. New concepts and noteworthy developments. J. Mol. Struct. 2014, 1069, 3–22. [Google Scholar] [CrossRef]
- Noda, I. Frontiers of two-dimensional correlation spectroscopy. Part 2. Perturbation methods, fields of applications, and types of analytical probes. J. Mol. Struct. 2014, 1069, 23–49. [Google Scholar] [CrossRef]
- Chen, W.; Qian, C.; Liu, X.-Y.; Yu, H.-Q. Two-dimensional correlation spectroscopic analysis on the interaction between humic acids and TiO2 nanoparticles. Environ. Sci. Technol. 2014, 48, 11119–11126. [Google Scholar] [CrossRef]
- Ma, F.; Du, C.; Zhou, J.; Shen, Y. Optimized self-adaptive model for assessment of soil organic matter using fourier transform mid-infrared photoacoustic spectroscopy. Chemom. Intellig. Lab. Syst. 2017, 171, 9–15. [Google Scholar] [CrossRef]


| # | Band, cm−1 | Quartz/Silicate/Si–O Constituents, Water, Inorganic Constituents | Organic Constituents | DRIFT | ATR–FTIR | FTIR–PAS |
|---|---|---|---|---|---|---|
| 7400 | (?) Water vapor | 1st overtone C–H stretch + C–H deformation (in hemicelluloses and lignin [96] | medium | n/a | n/a | |
| 7100 | OH stretch, the first overtone [97] | (2ν + δ) CH2 [28] | strong | n/a | n/a | |
| 6000 | — | CH3 stretch, the first overtone [28] or combination band, the first overtone Aryl–H stretch [96] | weak | n/a | absent | |
| 5800–5750 | — | CH2 stretch, the first overtone [98] | weak | n/a | absent | |
| 5250 | Water combination band v2 + v3 | — | strong | n/a | weak | |
| 4900 | The first overtone CO2 | — | weak | n/a | absent | |
| 4740 | — | CH + OH, cellulose | weak | n/a | absent | |
| 4630 | The first overtone CO2 | CH + OH, cellulose | weak, shoulder | n/a | absent | |
| 4530 | Water combination band OH ν + δ [28] | — | strong | n/a | very weak, noisy | |
| 4440 | — | CH combination (ν + δ) [28] | medium | n/a | absent | |
| 4330 | — | CH combination (ν + δ)as [28] or C–O stretch + O–H stretch or C–H2 bend. + C–H2 stretch Cellulose [96] | medium | n/a | absent | |
| 4260 | — | CH combination (ν + δ)s [28], cellulose [96] | medium | n/a | absent | |
| 4180 | — | CH combination, lignin [96] | weak | n/a | absent | |
| 4010–3970 | Hydrogen-bonded SiOH…HOSi SiO–H stretch (kaolinite, clay) O–H stretch isolated (?) | CH, a combination or overtone band [99] C–O stretch + C–H and C–H2 stretch (cellulose) [96] | strong, broad | absent | very weak | |
| 3740–3730 | Hydrogen-bonded SiOH…HOSi SiO–H stretch (kaolinite, clay) O–H stretch isolated CO2 | — | absent | absent | medium to weak | |
| 3700 | Unbonded SiO–H stretch, tilted (kaolinite, clay) [100] | — | weak, shoulder, unresolved | absent | weak, shoulder, unresolved | |
| 3690–3680 | Hydrogen-bonded SiO–H…H2O stretch (amorphous) [100] | — | strong | weak | medium | |
| 3670–3650 | OH stretching of inner-surface hydroxyl groups, anti-phase vibration with transition moment lying in the (001) plane of kaolinite [101,102] | — | weak | absent | medium | |
| 3640–3630 | Isolated SiO–H OH stretch (α-quartz) [100] | — | weak | absent | medium | |
| 3620 | Isolated (inner) SiO–H [101,102] OH stretch (α-quartz) [100] Al(Mg)SiO–H stretch, straight | — | strong | weak | strong | |
| 3540–3500 | Hydrogen-bonded SiO–H…H2O SiO–H stretch (amorphous) [100] | — | absent | absent | weak | |
| 3490 | Liquid water: antisynchronous stretch v3 | O–H, phenolic, alcohol, carboxylic | strong, broad, unresolved | strong unresolved | strong, broad | |
| 3270 | Liquid water: synchronous stretch, v1 | O–H, phenolic, alcohol, carboxylic C = O overtone | strong, broad | |||
| 3220 | N–H stretch | — | absent | absent | weak | |
| 3180 | OH stretch intramolecular [103] | — | absent | absent | weak | |
| 3130–3110 | — | C–H aromatic chains stretch | absent | absent | weak | |
| 3070–3065 | — | C–H aromatic chains stretch | very weak, shoulder | absent | weak | |
| 3030–3035 | — | C–H aromatic chains stretch C–H alkene chains stretch | very weak | absent | weak | |
| 3000–2995 | — | C–H aromatic chains stretch C–H alkene chains stretch | absent | absent | weak | |
| 2970–2960 | (?) SiO2 overtone, complex overtone-combination bands [104,105,106] | C–H, CH3 antisymmetric stretch [28] | weak | absent | medium to weak | |
| 2930–2910 | (?) SiO2 overtone, complex overtone-combination bands [104,105,106] | C–H, CH2 antisymmetric stretch [35,70,107,108] | strong | medium to weak, broad | strong | |
| 2880 | — | C–H, CH3 symmetric stretch [28] | weak | absent | weak | |
| 2860–2850 | — | C–H, CH2 symmetric stretch [35,70,107,108] | strong | medium to weak, broad | medium | |
| 2360, 2340 | CO2 [109] | — | very weak to absent | absent | medium | |
| 2260–2220 | SiO2 overtone ≅2×1095 | — | medium to weak | negative, artifact | medium to weak | |
| 2140 | SiO2 overtone ≅2 × 1070 Water: combination of v2 + libration | — | weak | negative, artifact | weak | |
| 2030 | SiO2 combination band ≅1000 + 1037 | Overtone, C–H aromatic bend (?) | medium | absent | medium, shoulder | |
| 2000–1990 | SiO2 overtone ≅2 × 1000 | C=O stretch | medium, unresolved | negative, artifact | medium | |
| 1975 | SiO2 combination band ≅920 + 1037 or 970 + 1000 [104] | C=O stretch | negative, artifact | medium | ||
| 1950–1945 | (?) SiO2 combination band ≅960 + 1000 | C=O stretch | medium | absent | medium | |
| 1885 | (?) SiO2 overtone ≅2 × 975 | C=O stretch | strong, shoulder | weak | strong, shoulder | |
| 1865 | (?) SiO2 combination band ≅697 + 1163 | C=O stretch | strong | weak | strong | |
| 1820 | — | C=O stretch, the anhydride of carboxyl groups | very weak, shoulder | absent | weak, shoulder | |
| 1790–1783 | (?) SiO2 Combination band ≅800 + 1000 | C=O stretch | strong | weak | strong | |
| 1775 | — | C=O stretch | shoulder | absent | medium | |
| 1730–1720 | — | C=O stretch | weak | medium | medium | |
| 1710–1680 | (?) SiO2 combination band ≅697 + 1000 | N–H bend, amine Alkene –C=C– stretch, substituted aromatics | strong shoulder unresolved | medium to weak shoulder | strong shoulder unresolved | |
| 1650–1640 | Absorbed liquid water bend v2, [110] | Amide I, aromatic –C=C– stretch [26,78] | strong, unresolved | |||
| 1620–1610 | HO–H stretch [100] Liquid: bend (v2) of the covalent bonds Hydrogen-bonded SiOH…H2O | N–H bend, C=O stretch | strong | strong | ||
| 1600–1598 | (?) SiO2 overtone ≅2 × 796 Vapor: bend (v2) of the covalent bonds | C–C stretch, aromatic rings | strong shoulder | strong, unresolved | strong shoulder | |
| 1580 | — | Antisymmetric stretch carboxylate NH2 [28] | medium shoulder | medium shoulder | medium shoulder | |
| 1570–1560 | — | (?) C–C stretch Aromatic rings | weak shoulder (x) | very weak | medium, artefact (carbon black) | |
| 1540–1520 | SiO2 combination band 450 + 1070 [111] | Amide II, aromatic rings, carboxyl C | medium to strong | weak shoulder | medium | |
| 1460 | (?) Amorphous SiO2 combination band ≅350 + 1153 Carbonate [47] | O–H, C–H scissoring [29] | weak shoulder, unresolved | weak | medium | |
| 1440 | — | Carboxyl C–O–H in-plane bend [112] | absent | weak, shoulder | medium to weak | |
| 1420 | Mg–OH stretch [104] | C–O stretch | weak, shoulder, unresolved | medium, broad | medium to weak | |
| 1390–1380 | SiO2 Amorphous or SiO2 overtone ≅2 × 697 Combination band ≅350 + 1000 [104] O–H (coordinated bonded water) | Symmetric stretch carboxylate a combination band of phenolic or COO stretch vibrations with CH2 and CH3 bands Non-carboxyl C–O–H in-plane bend [113] | strong, unresolved | absent | strong | |
| 1340 | — | CH2 wagging | strong, unresolved | absent | weak | |
| 1320–1310 | — | In-phase CH2 twisting [28] | strong, unresolved | weak shoulder | weak shoulder | |
| 1285–1280 | SiO2 Combination band ≅450 + 795 | Amide III, C–O stretch of aromatic rings and carboxylic acids [108], C–O stretch CH2 rocking C–N stretch | strong to medium, shoulder, unresolved | medium shoulder | medium shoulder | |
| 1235 | Silicates Combination band SiO2 ≅470 + 760; Lattice [106] | Amide III, C–O stretch of aromatic rings and carboxylic acids | strong to medium, shoulder, unresolved | absent | medium, shoulder | |
| 1185 | Amorphous silica [114]Combination band SiO2 [104] | CH2 wagging | weak, shoulder | absent | medium, shoulder | |
| 1165–1153 | SiO2 lattice [106] | C–OH stretching of aliphatic O–H [115] | strong | medium | weak shoulder | |
| 1115–1105 | Amorphous silica [116] | Mon-carboxyl C–O stretch | weak | broad medium unresolved | broad medium, unresolved | |
| 1095 | SiO2 silicate Si–O stretch [114] P–O [117] | In-plane C–H bend (non-aromatic) and cellulose (?) | weak | |||
| 1080–1075 | O–Si–O lattice stretch [106] | C–N [28] | absent | very weak | weak | |
| 1037 | Silicate (kaolinite, illite) Si–O tetrahedra stretch Asymmetrical stretch Al–O stretch [26,47] P–O [117] | In-plane C–H bend (non-aromatic) and (?) carbohydrates | strong, shoulder | strong, shoulder | strong, shoulder | |
| 1010–995 | SiO2 Si–O stretch lattice | — | weak broad | strong | strong, shoulder | |
| 975 | SiO2 silicate (kaolinite, illite) Si–O stretch [114] Ti–O (Noda) | — | strong broad | strong shoulder | weak, shoulder | |
| 930–910 | Silicate, aluminosilicate [28], OH deformation of inner hydroxyl groups [102] Overtone ≅2 × 450 [114] | Carboxyl out-of-plane C–O–H bend | medium to weak, shoulder | strong, shoulder | strong, shoulder | |
| 875 | Si–O–or Si–O–Si bridge [118] carbonate, calcite [101,118,119,120,121] | Aromatic bend, polyaromatic [26,122] | weak to absent | weak, shoulder | weak shoulder | |
| 860 | Al–OH (clay minerals) | — | very weak to absent | weak, shoulder | medium, shoulder | |
| 840–830 | Al–OH (clay minerals), smectite, and illite [123], AlMgOH [28] | Cellulose | medium shoulder (820) | absent | weak shoulder | |
| 813 | Amorphous silica [116] Ti–O [124] | — | strong | absent | medium shoulder | |
| 796 | SiO2 silicate Lattice symmetrical Si–O–Si stretch [106,114] (?) Overtone 2 × 395 | Out-of-plane (oop) C–H bend (non-aromatic) | strong | strong | Strong, unresolved | |
| 774 | α-quartz Si–O–Si [106,116] Mg–OH, Al–OH (clay minerals) | — | strong | strong | ||
| 750 | Si–O, perpendicular [102] Mg–OH, Al–OH (clay minerals) | Polyaromatic compounds [122] | weak | weak | weak shoulder | |
| 715 | Water librations | Out of plane (oop) C–H bend (aromatic) In-phase rock vibrations of C4 + alkanes [28,125] | absent | weak | medium | |
| 697–696 | SiO2 Si–O–Si bend [106] | — | strong | strong | strong | |
| 675–670 | CO2 [126] | Out of plane (oop) C–H bend (aromatic) | medium to weak, shoulder | medium, shoulder | medium to weak, shoulder | |
| 655–650 | Silicate Si–O–Si bend, amorphous iron oxide | — | medium | weak shoulder | very weak | |
| 645–640 | Water librations Si–O [102] Sulfate [124] | Bentonite [35] | absent | weak | medium | |
| 630–620 | Ca3-OH, hydroxyapatite [117] | C–S stretch [127] | medium | weak shoulder | weak shoulder | |
| 620–610 | CO2 | Non-carboxyl out-of-plane C–O–H bend | artifact | negative, artifact | weak shoulder | |
| 565 | PO4 tetrahedra [117] | — | medium | absent | weak to absent | |
| 535–525 | α-quartz (?)* [106] Si–O–A1 deformation in kaolinite [102,128] Iron oxide [129] | — | absent | weak | medium | |
| 517–513 | Silicate O–Si–O bend [106] | — | medium | weak unresolved | medium | |
| 505 | (?) α-quartz [130] | — | absent | weak to absent | ||
| 490 | SiO2 O–Si–O bend [106] | — | absent | strong shoulder | medium | |
| 470 | SiO2 O–Si–O bend [114] O–Al–O [47]Iron oxide [129] | — | absent | strong | strong | |
| 450 | SiO2 O–Si–O bend lattice [106,114] | — | weak shoulder unresolved | strong unresolved | medium to weak | |
| 430–420 | Si–O deformation of kaolinite [102] Mg-OH, Al–OH (clay minerals) | C–C in-phase vibrations [131] | medium | |||
| 402–392 | SiO2 O–Si–O bend lattice [106] water librations | — | strong | strong | strong | |
| 375–370 | R(SiO4) [104]; Amorphous silica [114] | — | absent | medium. shoulder | medium, shoulder | |
| 360–355 | SiO2 Lattice | — | Strong | strong | medium | |
| 350 | (?) SiO2 Lattice | absent | weak shoulder | weak shoulder | ||
| 330 | (?) Mg–O stretch [104] Iron oxide [129] | — | very weak, shoulder | strong | medium | |
| 275 | Chlorides Ti-O [124] | weak shoulder | medium to weak | n/a | ||
| 263–260 | α-Quartz [116] | — | strong | strong | n/a | |
| 190–185 | (?) α-Quartz | weak | weak | n/a | ||
| 130 | α-Quartz, silica chlorides | — | medium | weak | n/a | |
| 116–110 | α-Quartz, silica | — | weak to absent | medium, noisy | n/a |
Publisher’s Note: MDPI stays neutral with regard to jurisdictional claims in published maps and institutional affiliations. |
© 2021 by the authors. Licensee MDPI, Basel, Switzerland. This article is an open access article distributed under the terms and conditions of the Creative Commons Attribution (CC BY) license (https://creativecommons.org/licenses/by/4.0/).
Share and Cite
Volkov, D.S.; Rogova, O.B.; Proskurnin, M.A. Organic Matter and Mineral Composition of Silicate Soils: FTIR Comparison Study by Photoacoustic, Diffuse Reflectance, and Attenuated Total Reflection Modalities. Agronomy 2021, 11, 1879. https://doi.org/10.3390/agronomy11091879
Volkov DS, Rogova OB, Proskurnin MA. Organic Matter and Mineral Composition of Silicate Soils: FTIR Comparison Study by Photoacoustic, Diffuse Reflectance, and Attenuated Total Reflection Modalities. Agronomy. 2021; 11(9):1879. https://doi.org/10.3390/agronomy11091879
Chicago/Turabian StyleVolkov, Dmitry S., Olga B. Rogova, and Mikhail A. Proskurnin. 2021. "Organic Matter and Mineral Composition of Silicate Soils: FTIR Comparison Study by Photoacoustic, Diffuse Reflectance, and Attenuated Total Reflection Modalities" Agronomy 11, no. 9: 1879. https://doi.org/10.3390/agronomy11091879
APA StyleVolkov, D. S., Rogova, O. B., & Proskurnin, M. A. (2021). Organic Matter and Mineral Composition of Silicate Soils: FTIR Comparison Study by Photoacoustic, Diffuse Reflectance, and Attenuated Total Reflection Modalities. Agronomy, 11(9), 1879. https://doi.org/10.3390/agronomy11091879