
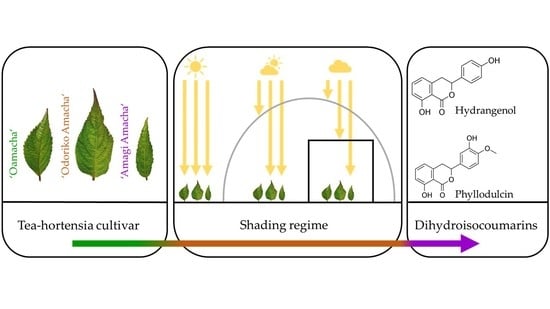
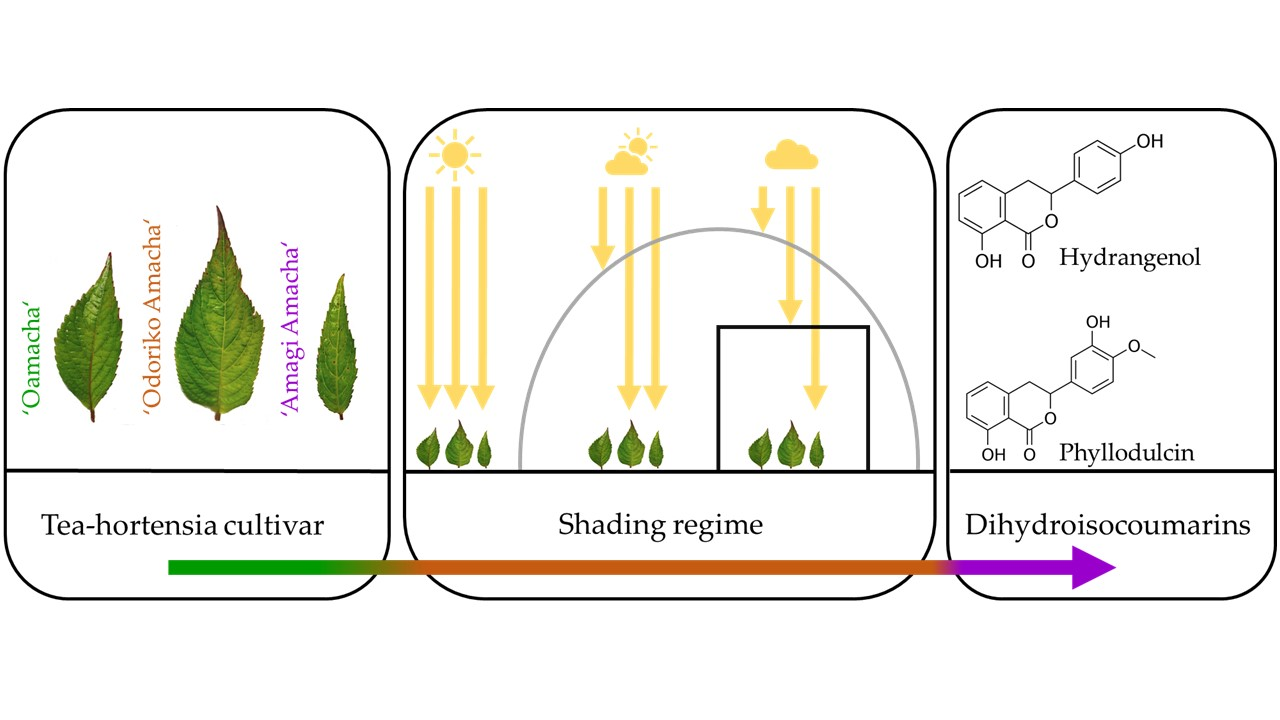
Dihydroisocoumarin Content and Phenotyping of Hydrangea macrophylla subsp. serrata Cultivars under Different Shading Regimes

 ,
,  and
and
Abstract
1. Introduction
2. Materials and Methods
2.1. Plant Material/Cultivation
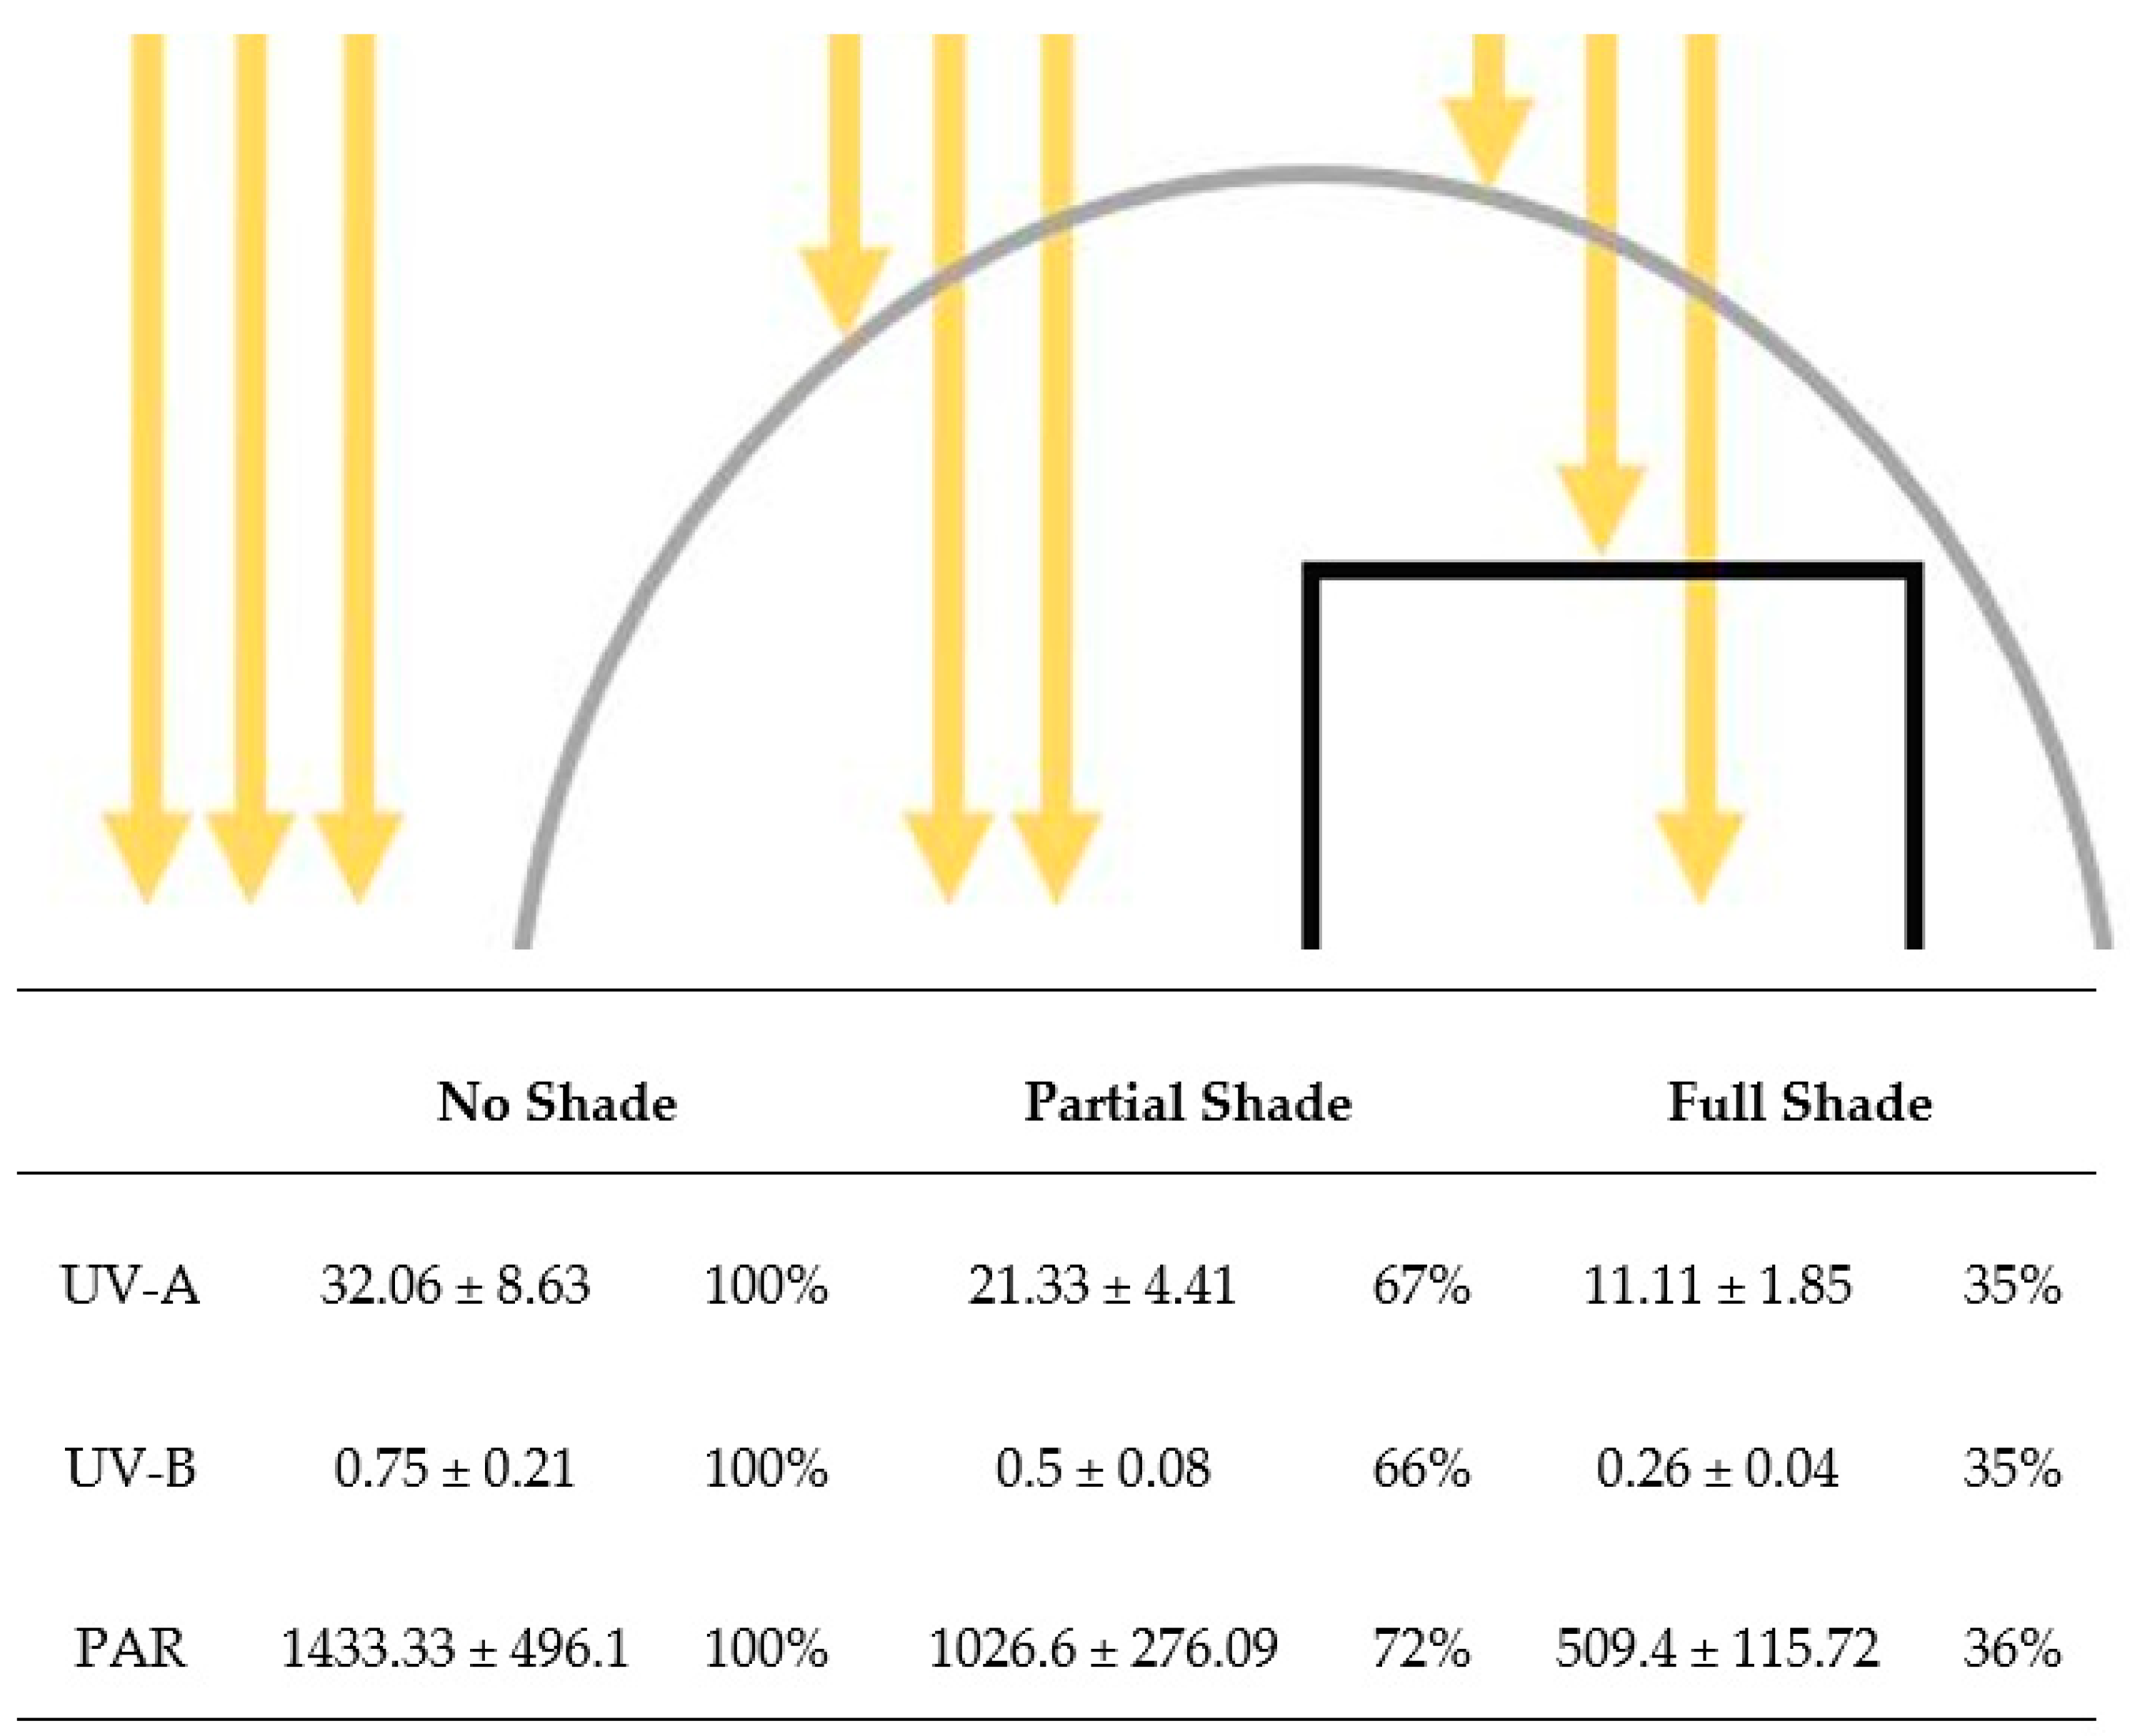
2.2. Experimental Setup
2.3. Plant Phenotyping
2.4. DHC Quantification
2.5. Statistical Analysis
3. Results and Discussion
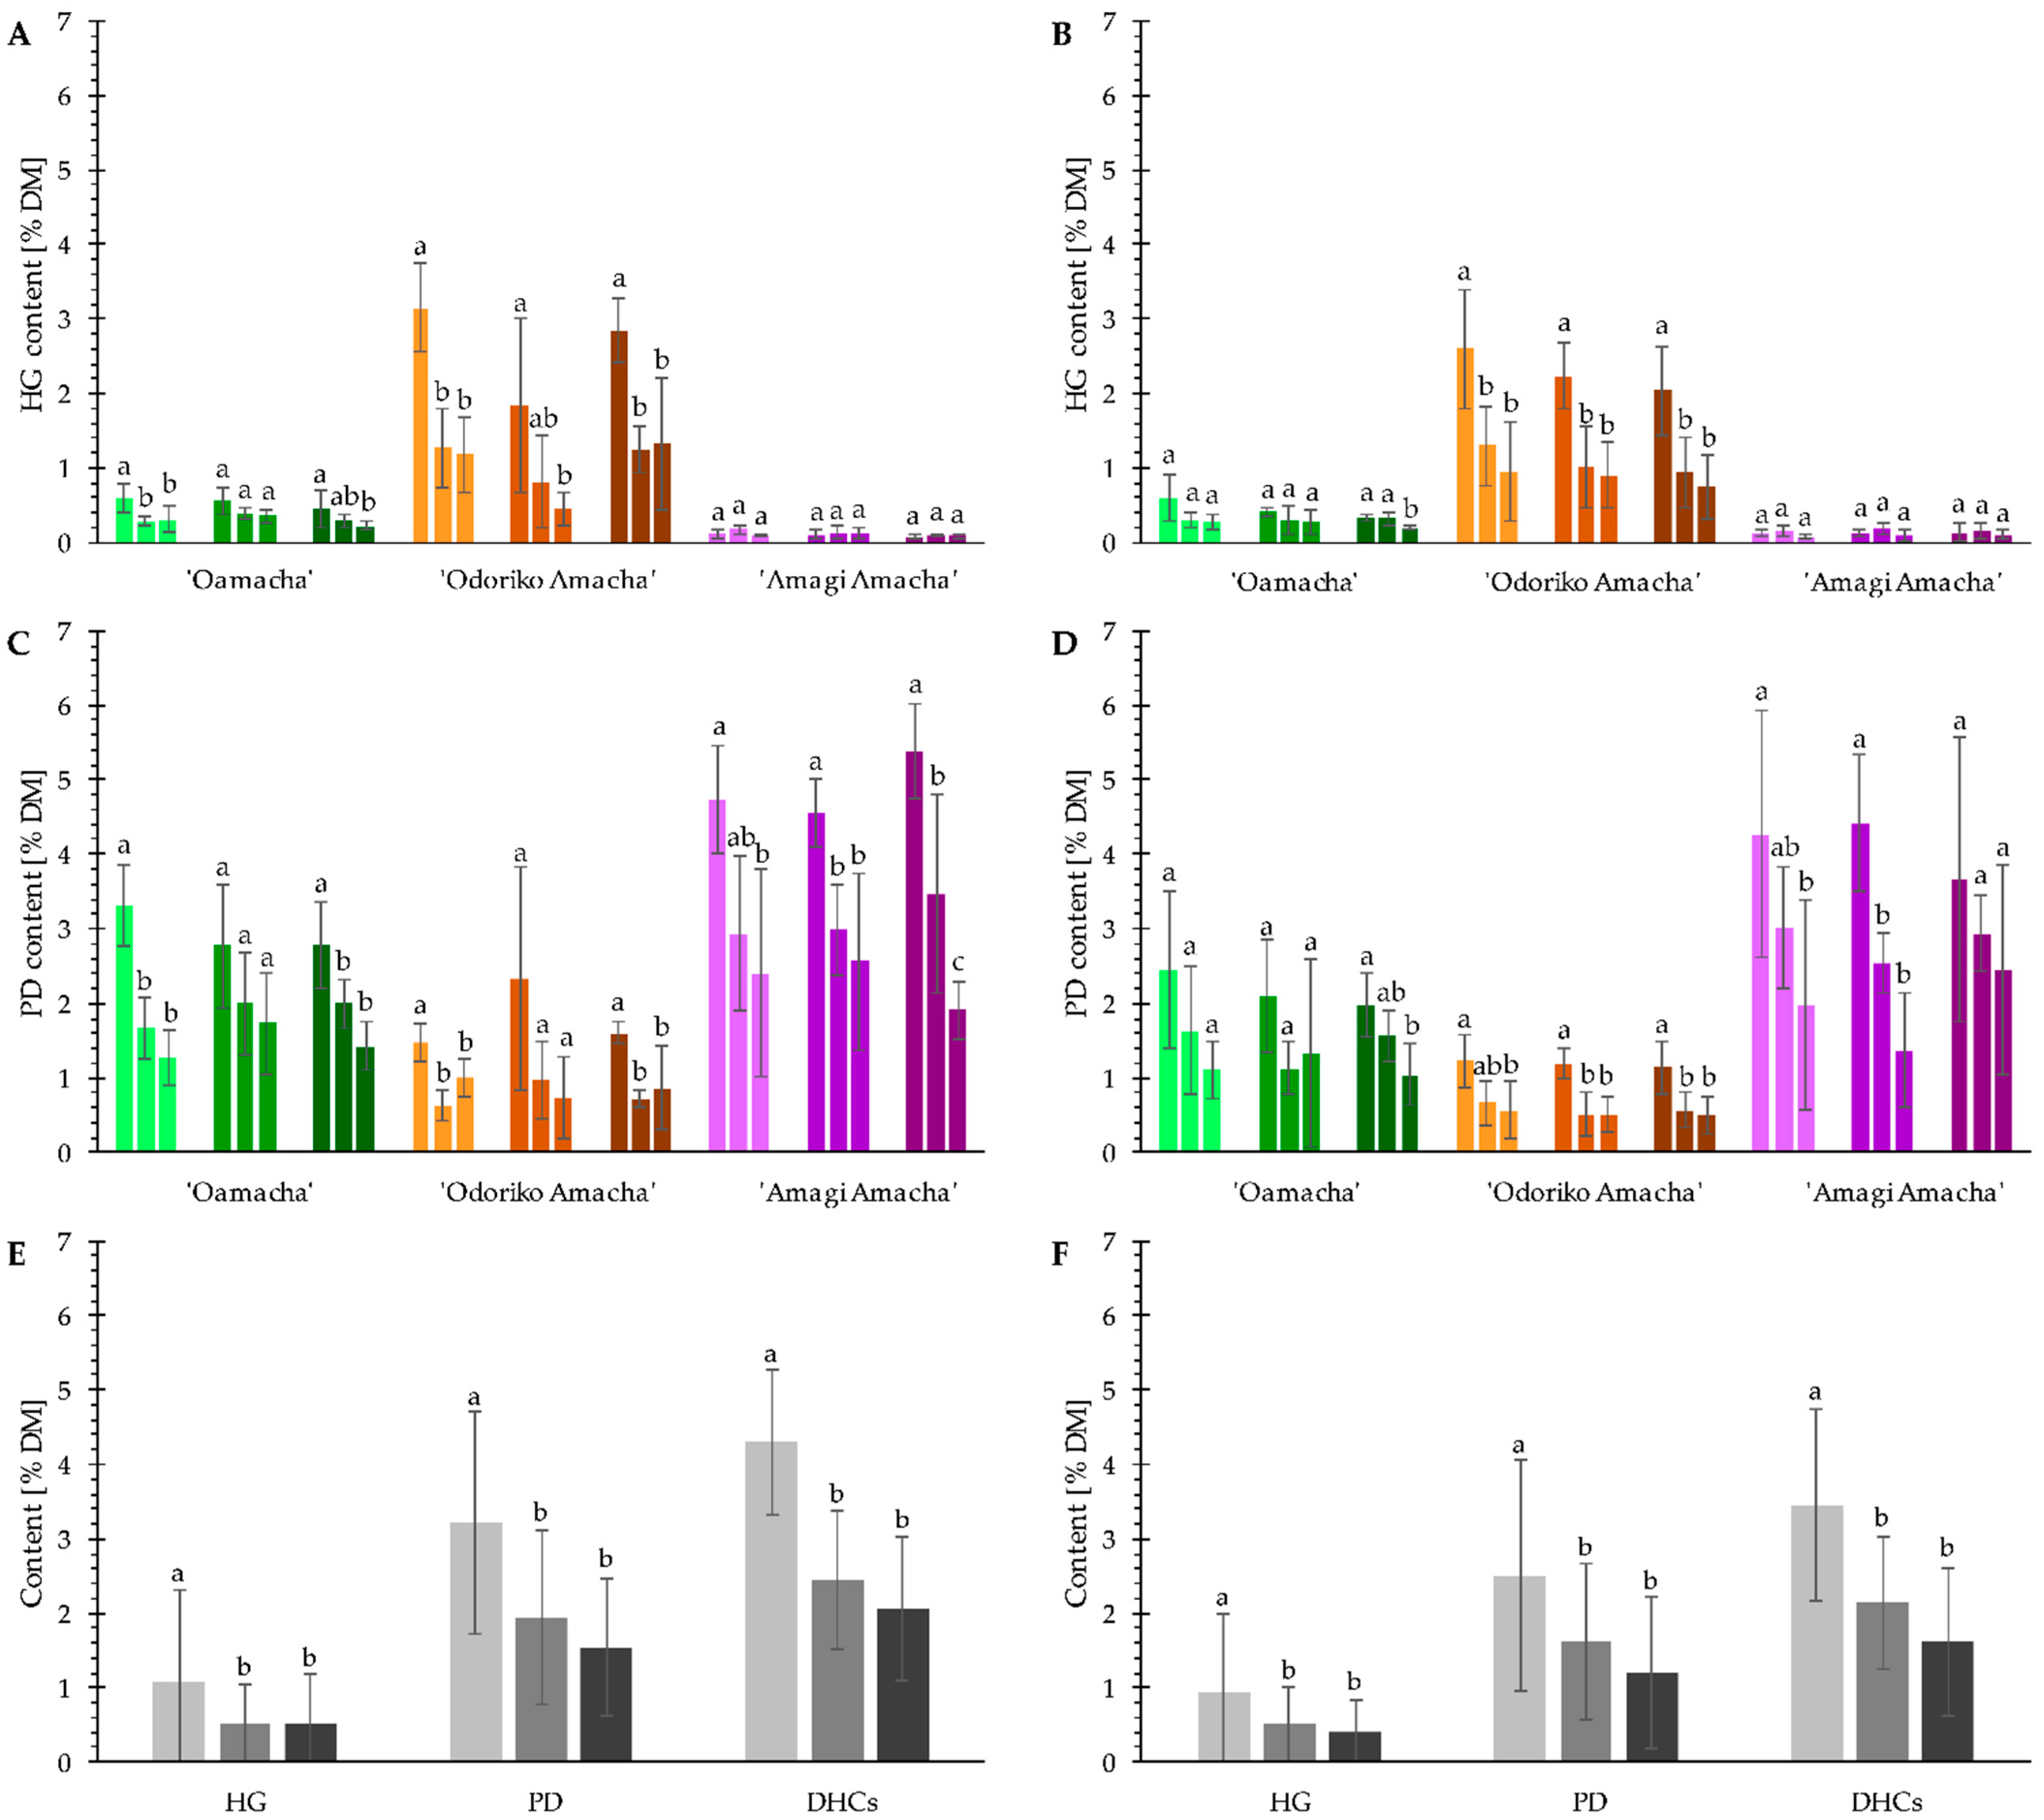
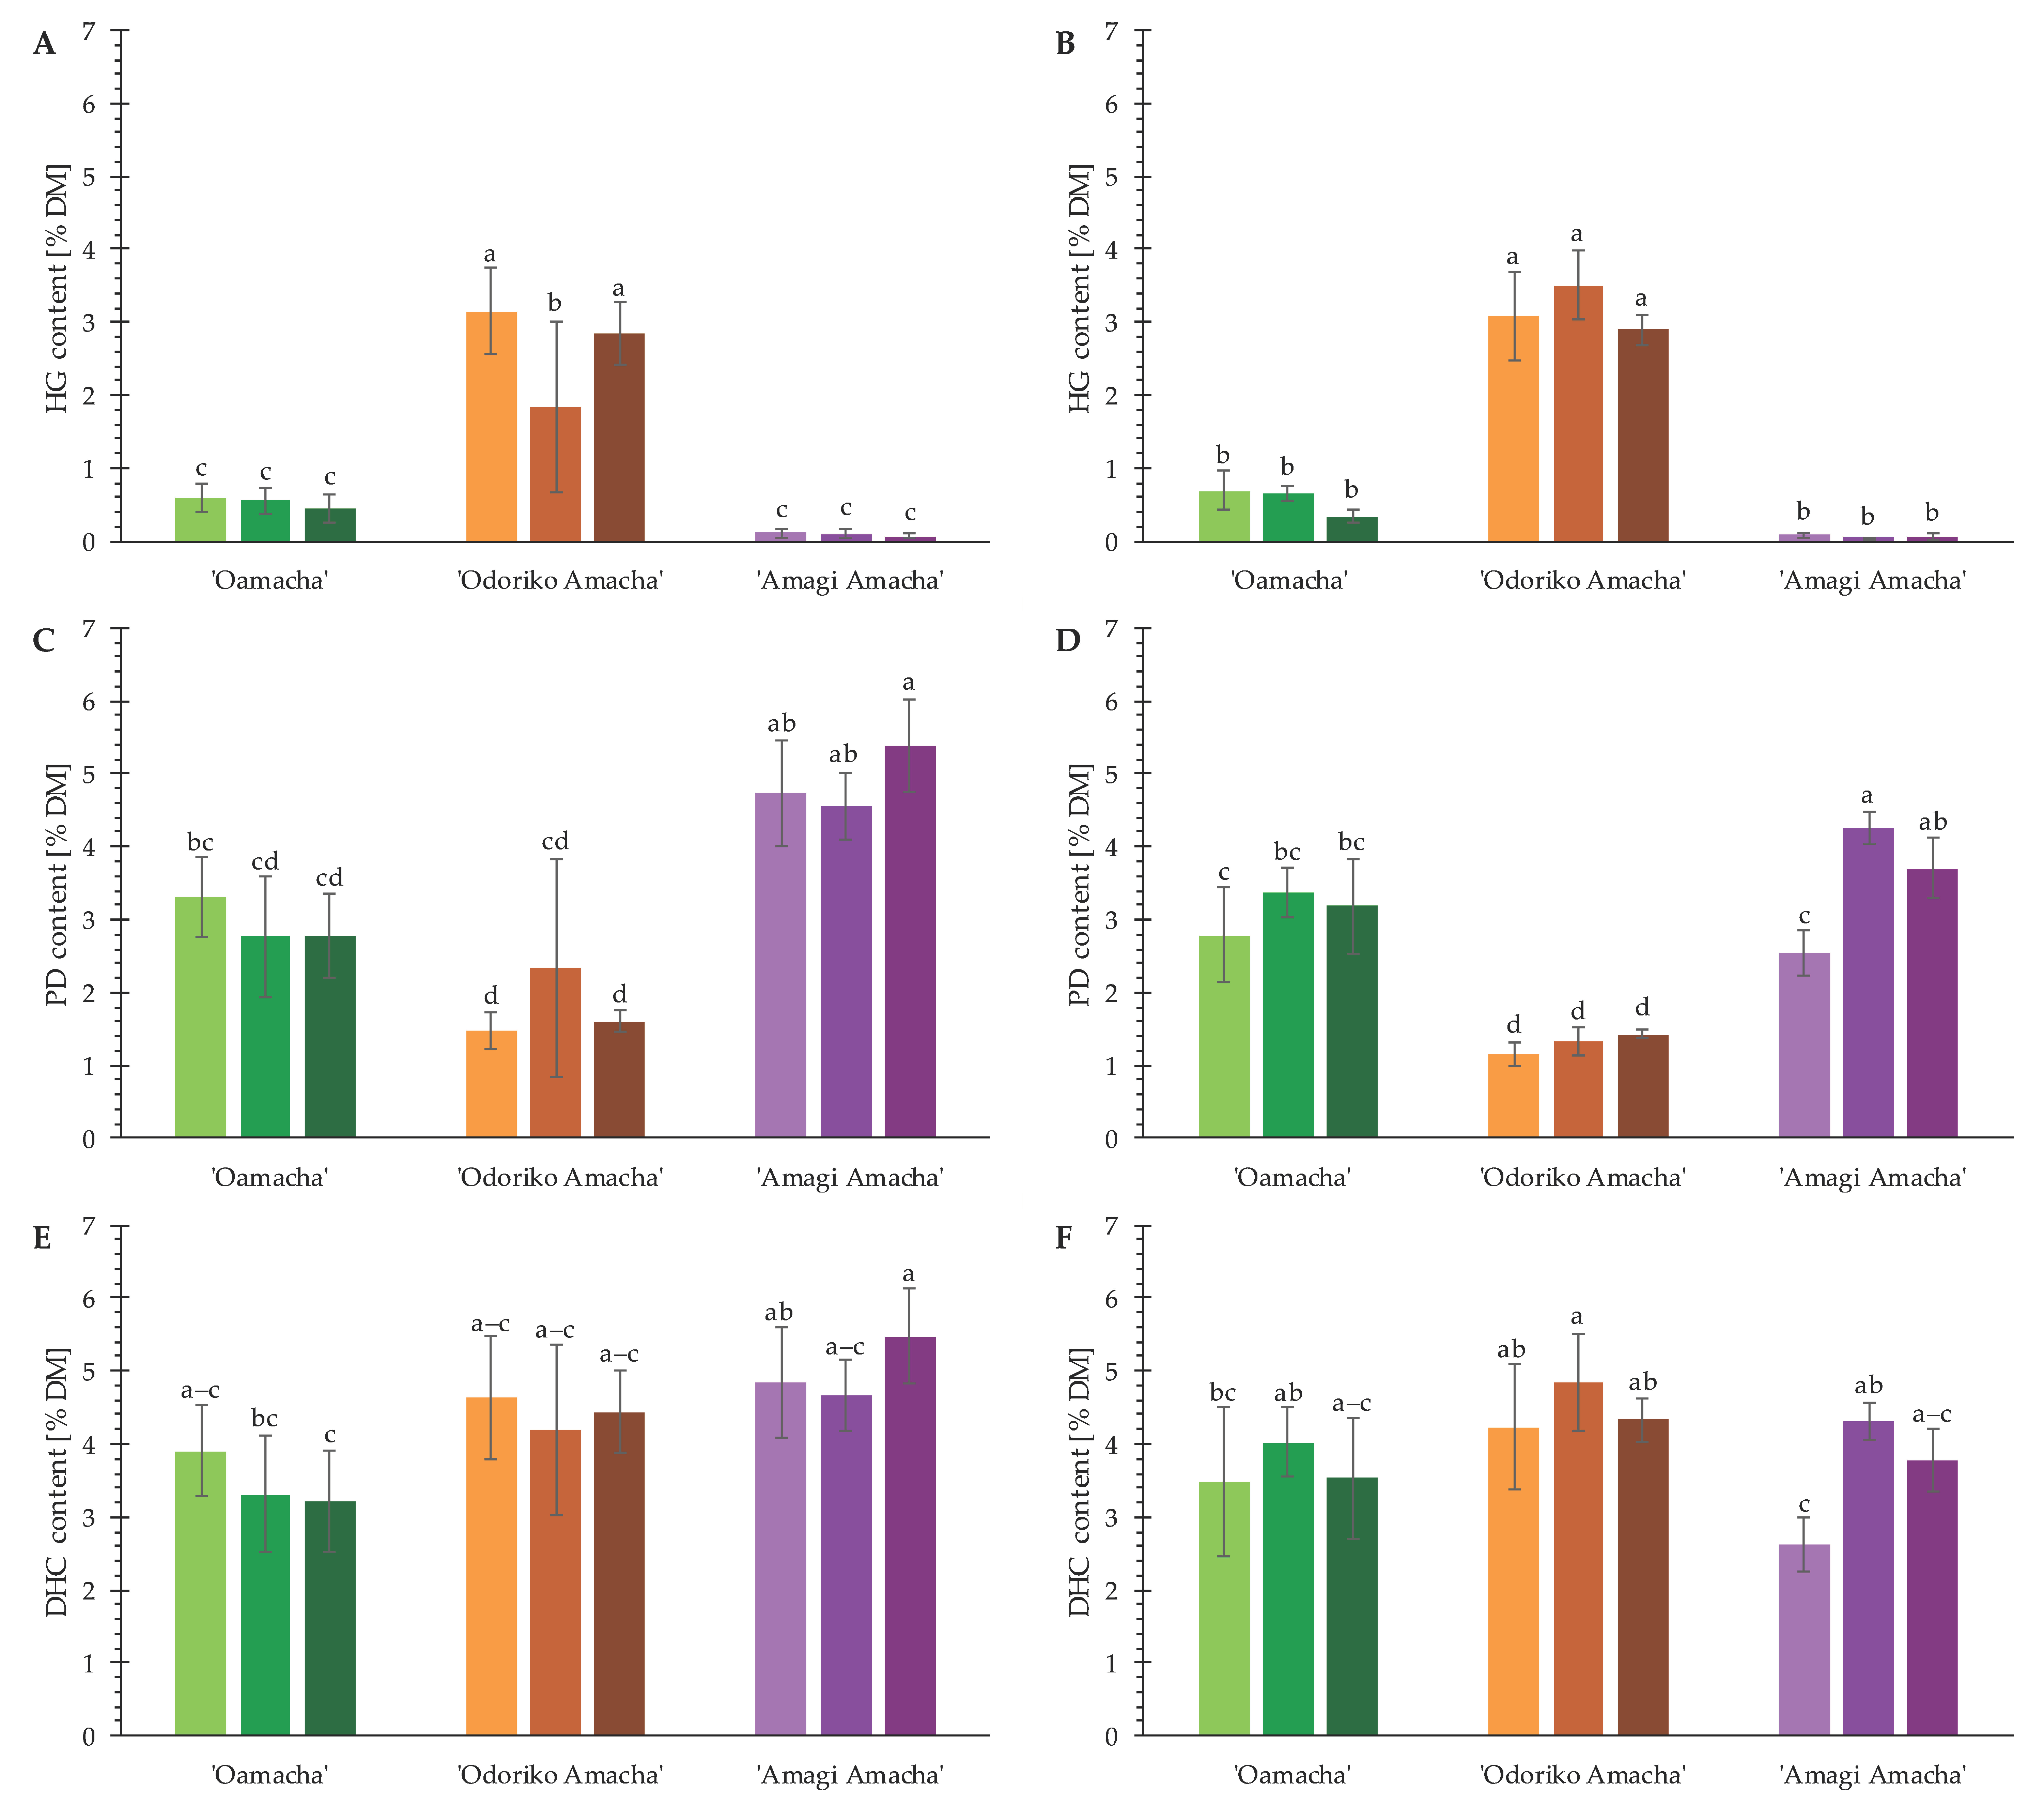
3.1. DHC Content
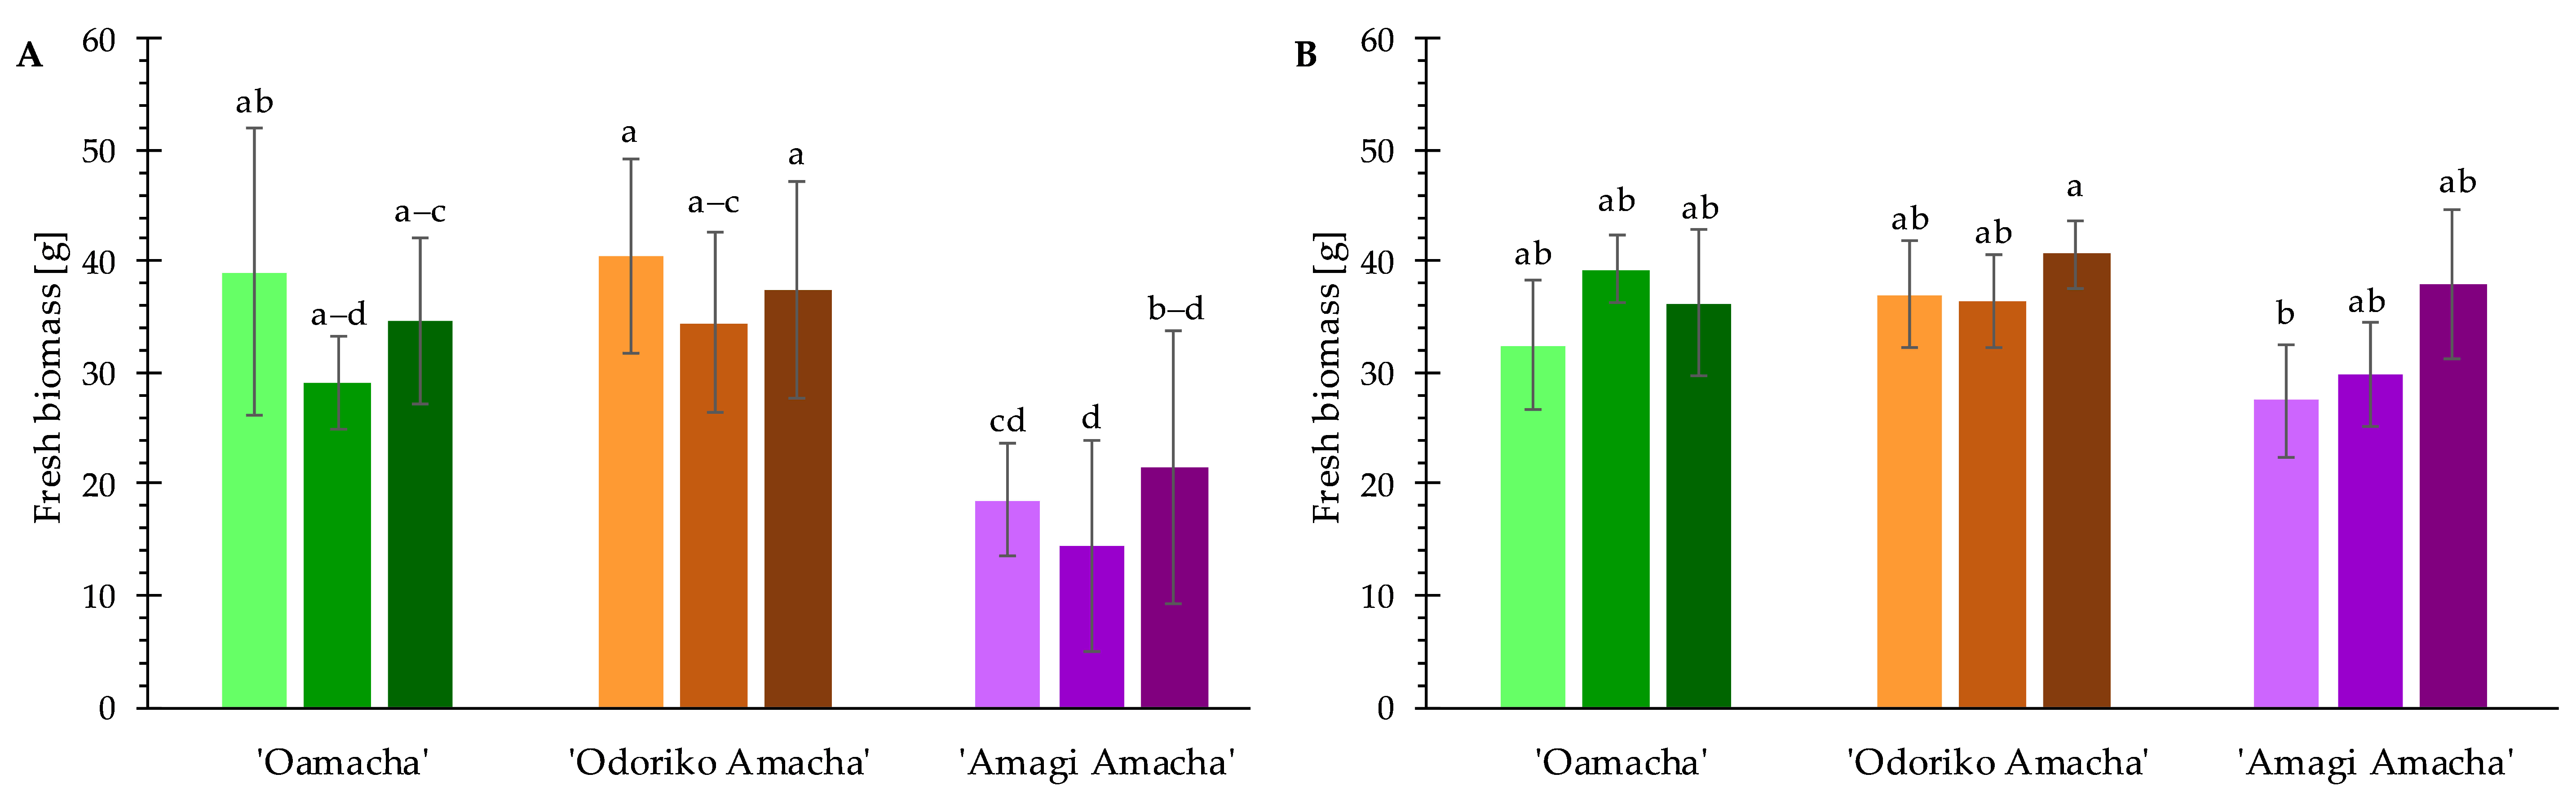
3.2. Fresh Biomass
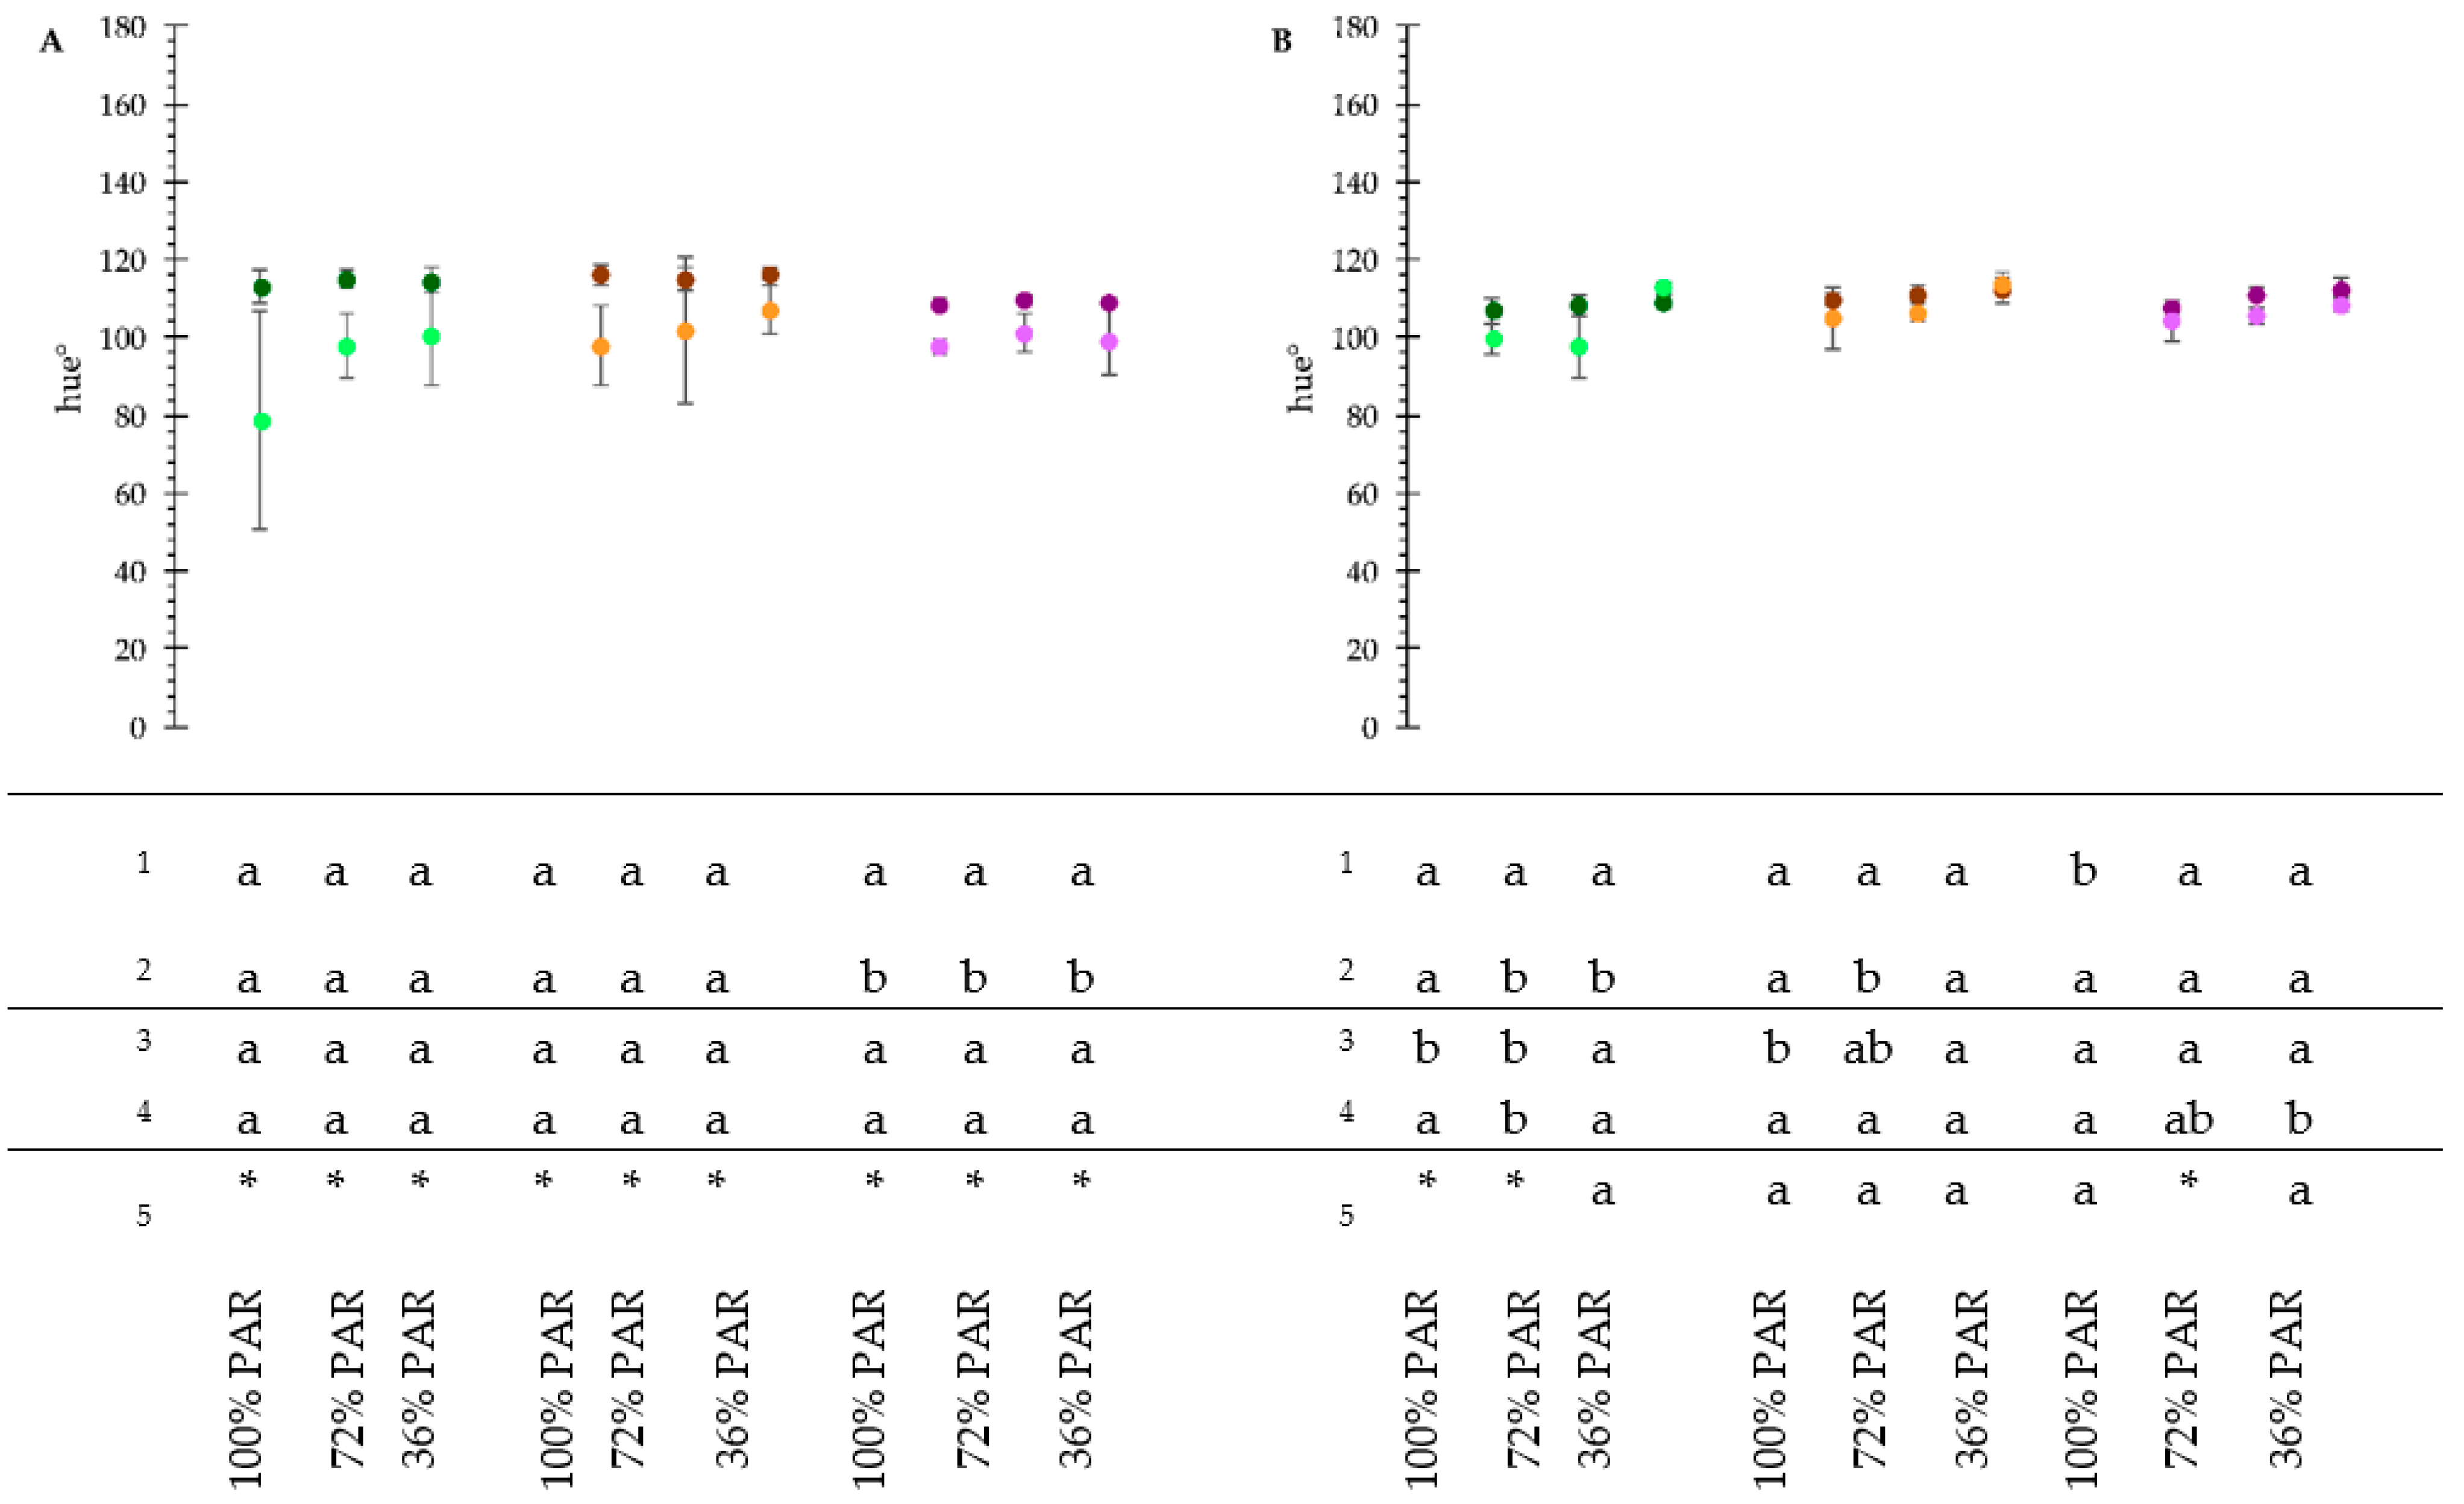
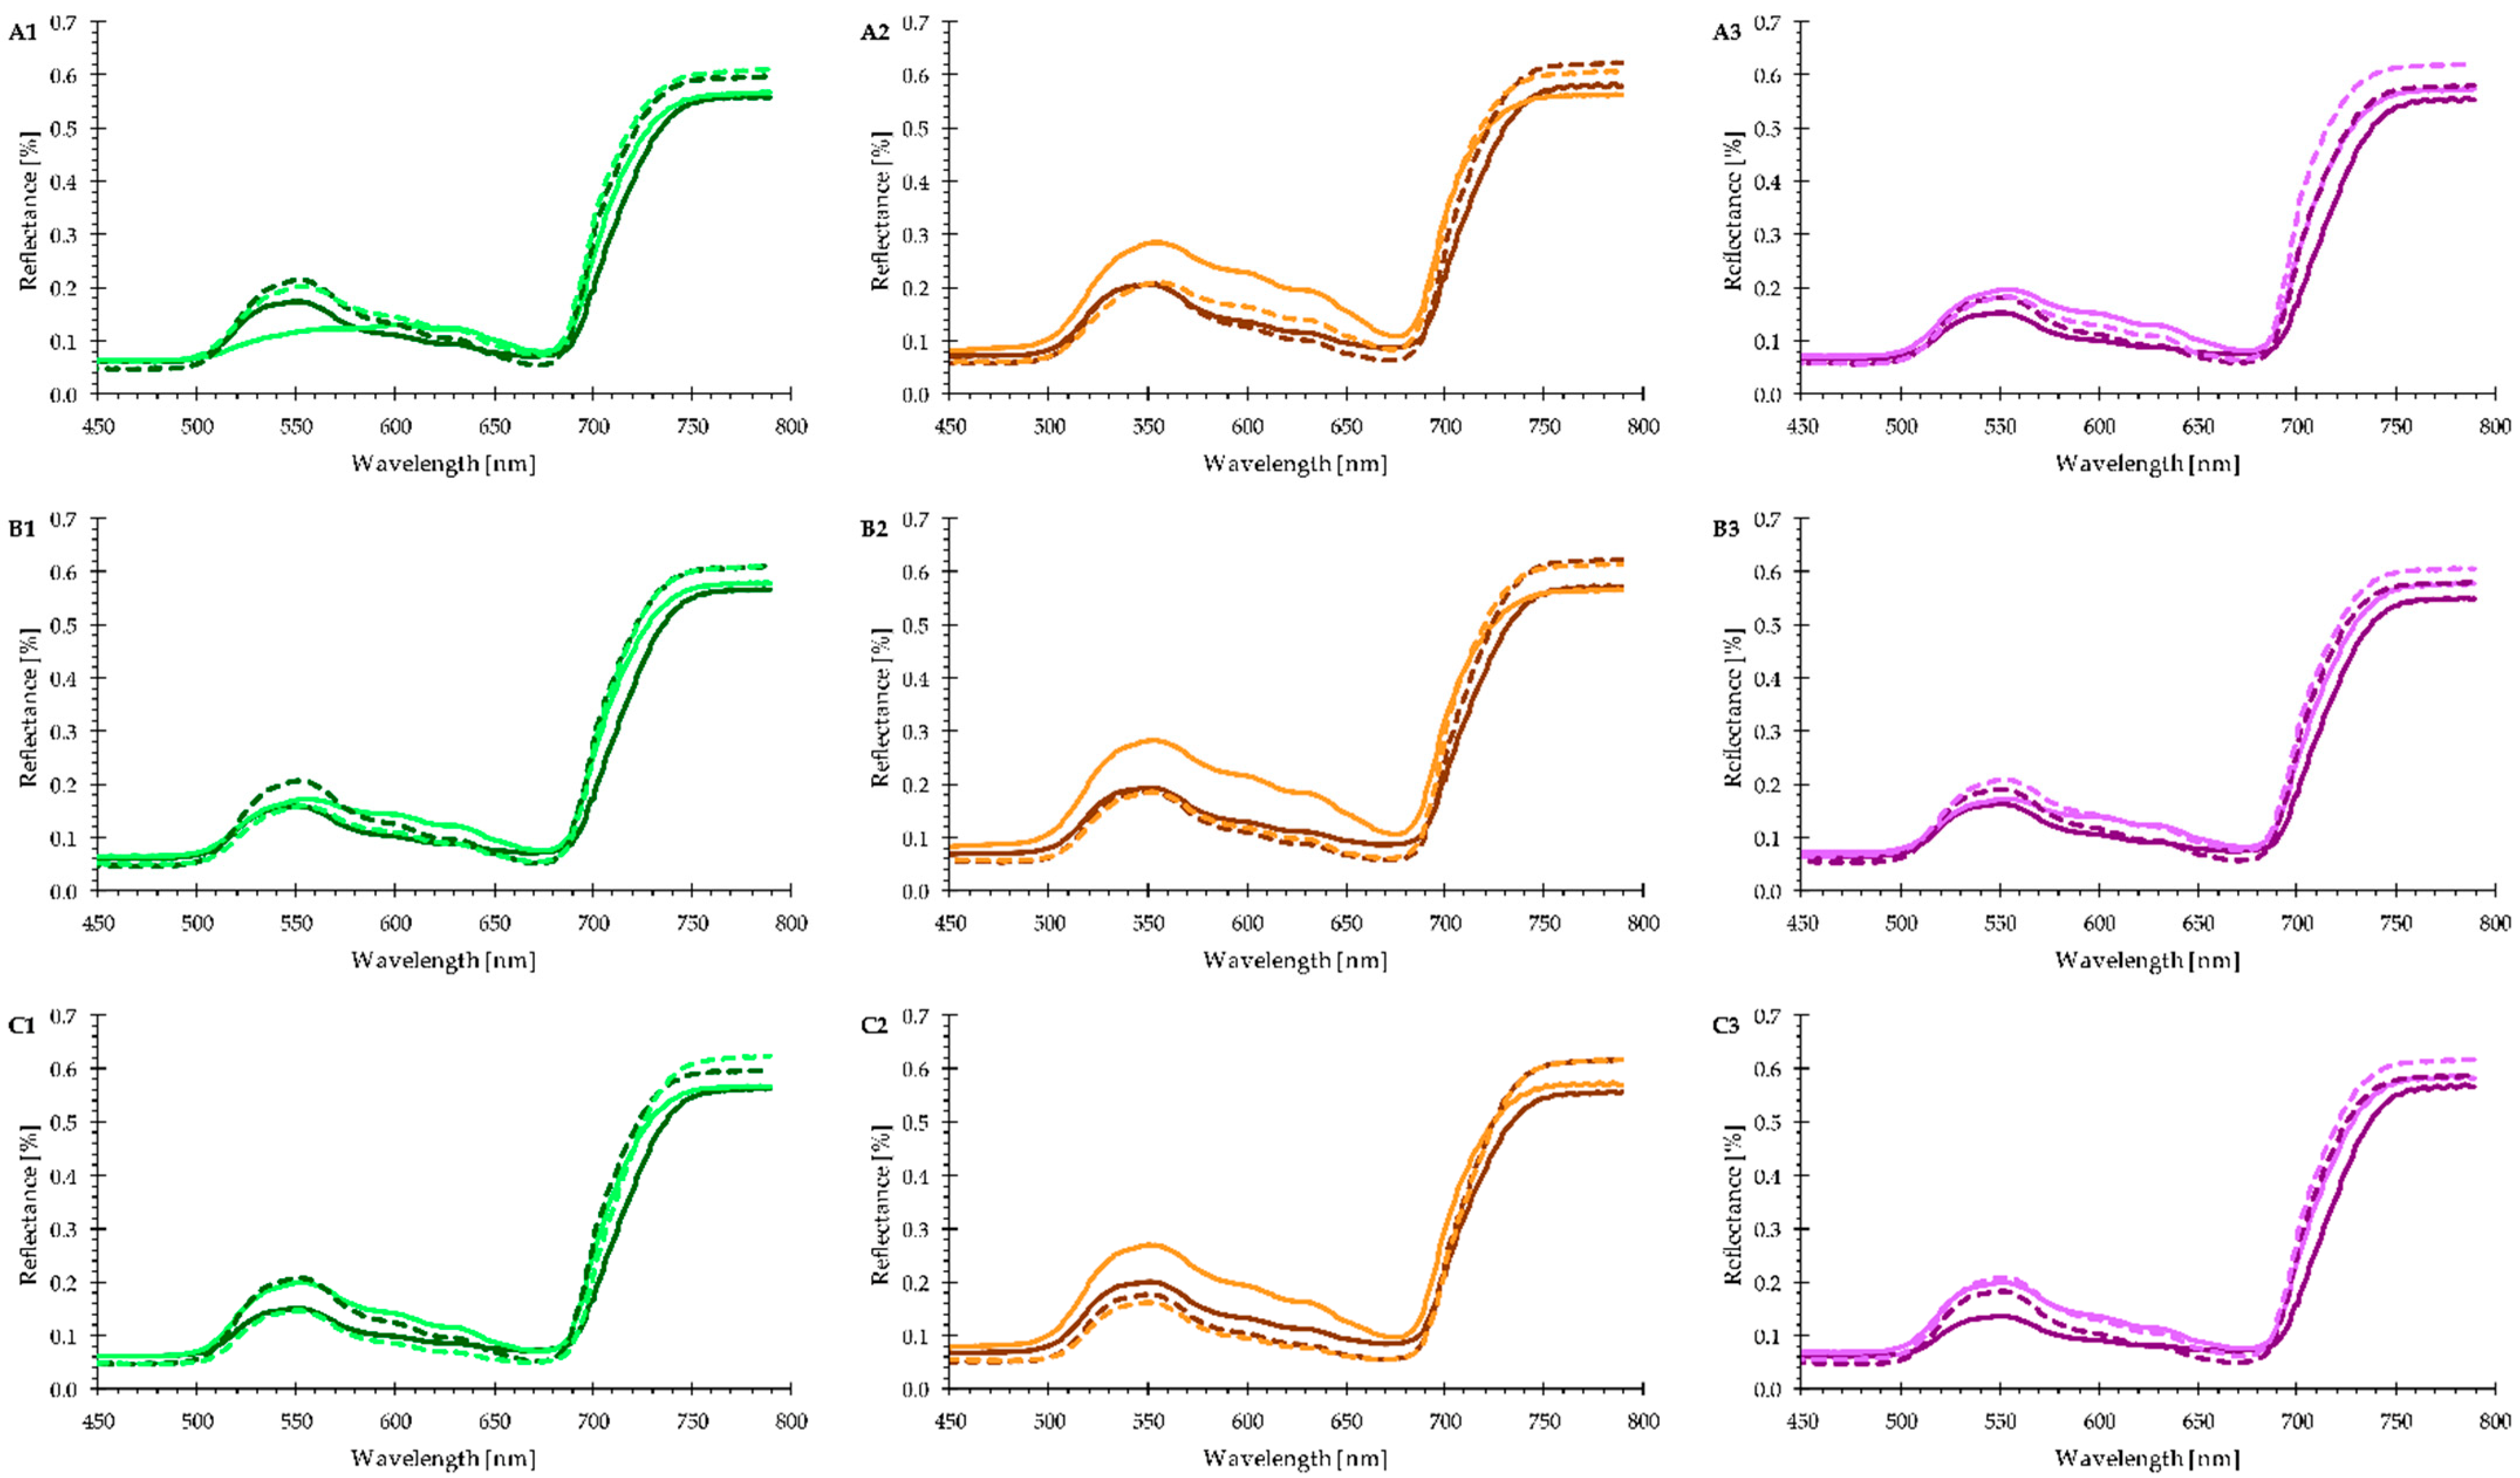
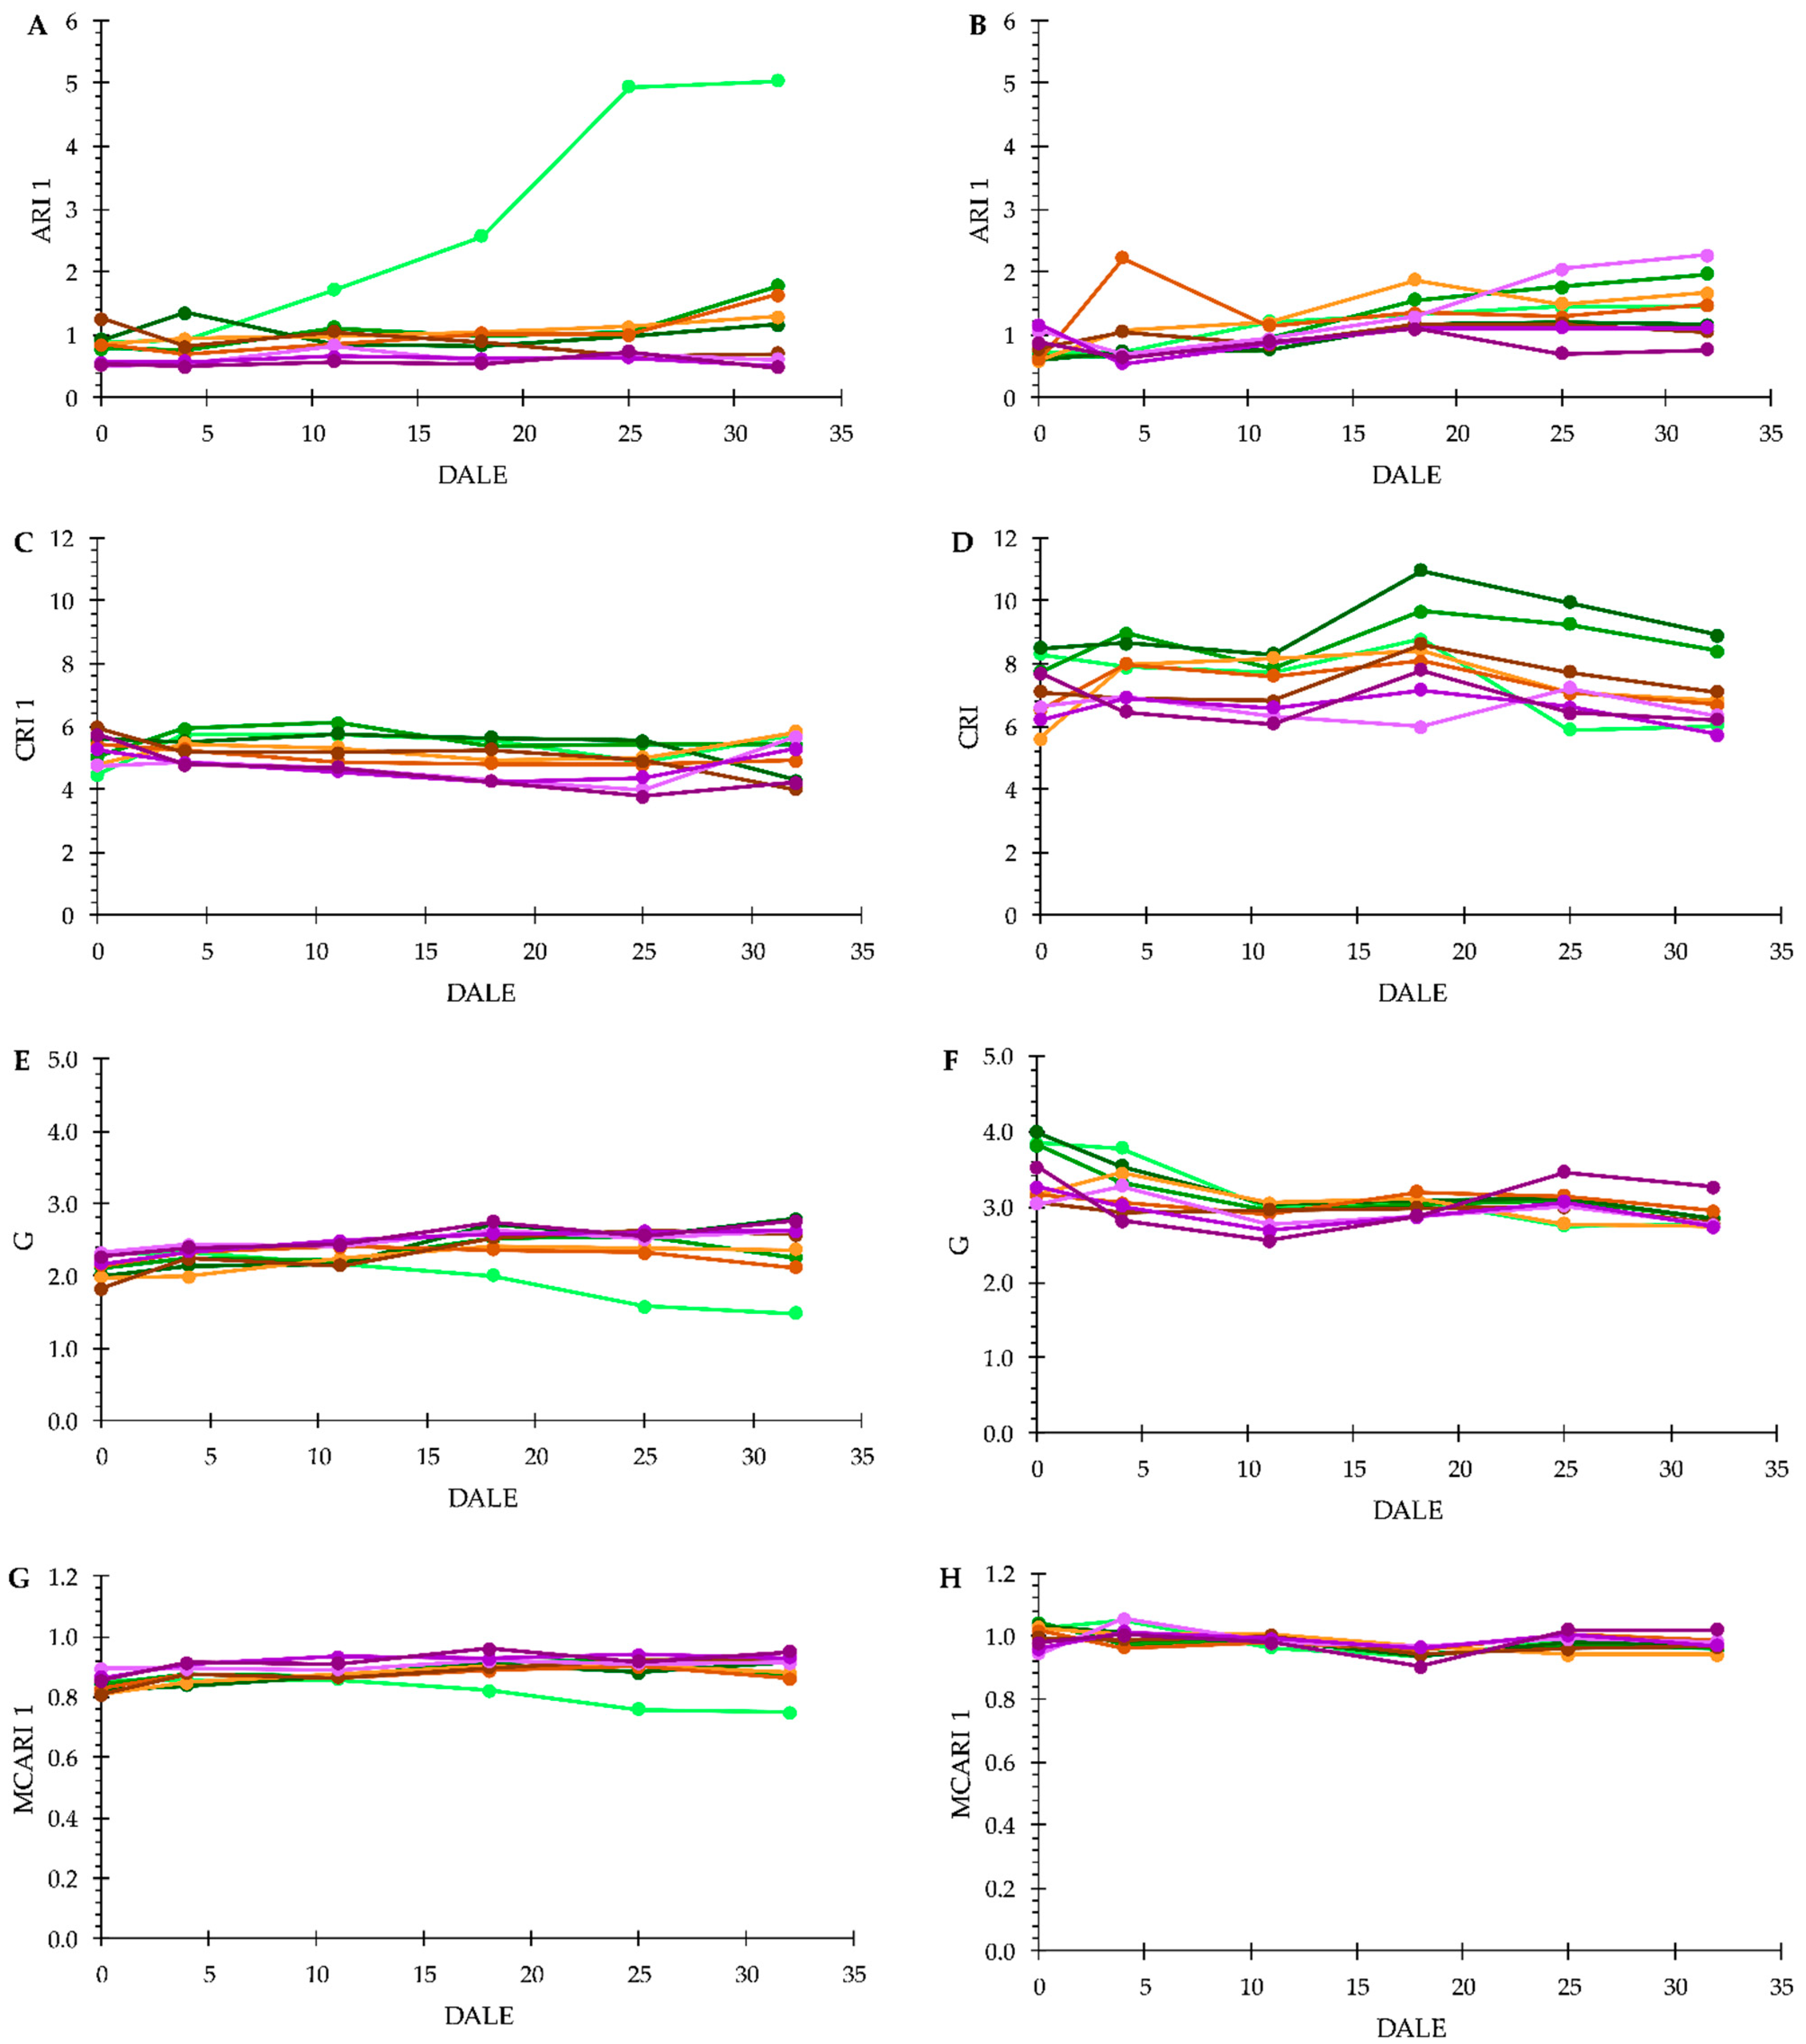
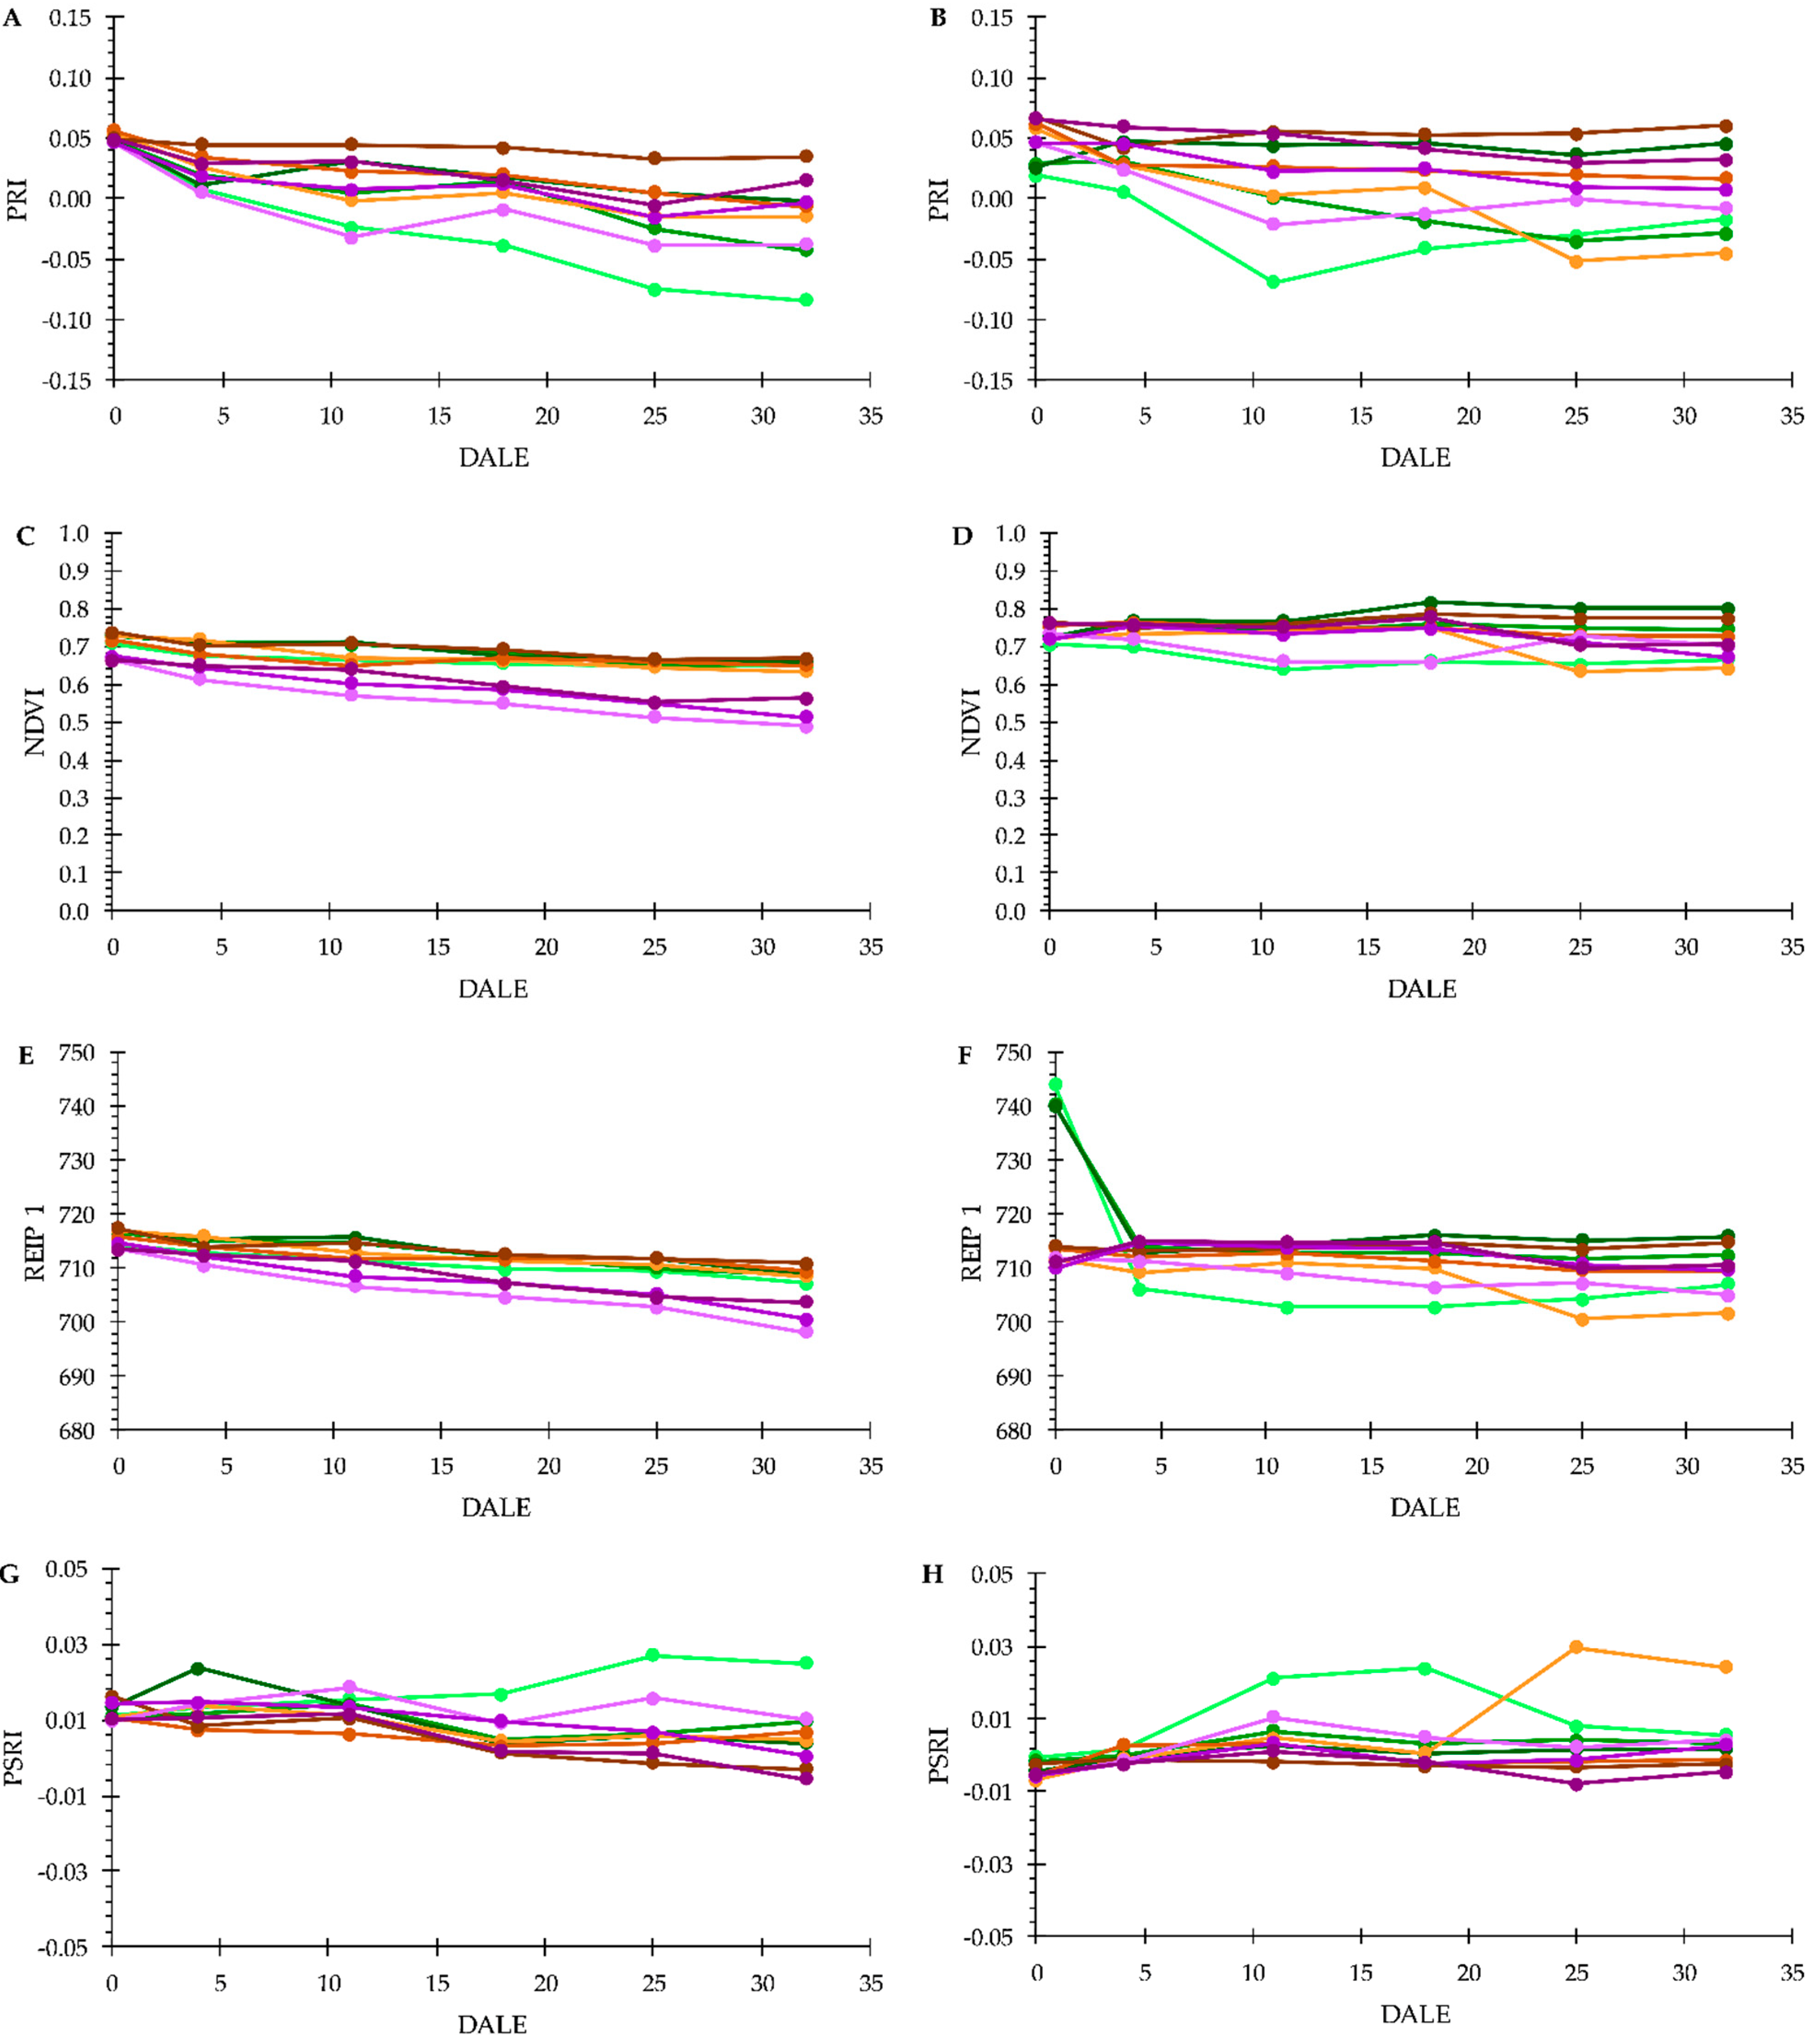
3.3. Plant Phenotyping
4. Conclusions
Supplementary Materials
Author Contributions
Funding
Data Availability Statement
Acknowledgments
Conflicts of Interest
References
- Yasuda, T.; Kayaba, S.; Takahashi, K.; Nakazawa, T.; Ohsawa, K. Metabolic fate of orally administered phyllodulcin in rats. J. Nat. Prod. 2004, 67, 1604–1607. [Google Scholar] [CrossRef]
- Ujihara, M.; Shinozaki, M.; Kato, M. Accumulation of Phyllodulcin in Sweet-Leaf Plants of Hydrangea serrata and Its Neutrality in the Defence Against a Specialist Leafmining Herbivore. Res. Popul. Ecol. 1995, 37, 249–257. [Google Scholar] [CrossRef]
- Shin, J.-S.; Han, H.-S.; Lee, S.-B.; Myung, D.-B.; Lee, K.; Lee, S.H.; Kim, H.J.; Lee, K.-T. Chemical Constituents from Leaves of Hydrangea serrata and Their Anti-photoaging Effects on UVB-Irradiated Human Fibroblasts. Biol. Pharm. Bull. 2019, 42, 424–431. [Google Scholar] [CrossRef] [PubMed]
- Kawamura, M.; Kagata, M.; Masaki, E.; Nishi, H. Phyllodulcin, a constituent of “Amacha”, inhibits phosphodiesterase in bovine adrenocortical cells. Pharmacol. Toxicol. 2002, 90, 106–108. [Google Scholar] [CrossRef] [PubMed]
- McClintock, E. A Monograph of the Genus Hydrangea. In Proceedings of the California Academy of Sciences, 4th ed.; California Academy of Sciences: San Francisco, CA, USA, 1957; Volume 29, pp. 147–256. [Google Scholar]
- van Gelderen, C.J.; van Gelderen, D.M. Encyclopedia of Hydrangeas; Timber Press: Portland, OR, USA, 2004. [Google Scholar]
- Ohba, H.; Akiyama, S. A Revision of the Species of Hydrangea (Hydrangeaceae) described by Siebold and Zuccarini, Part 1. Bull. Natl. Mus. Nat. Sci. Ser. B 2013, 39, 173–194. [Google Scholar]
- Ohba, H.; Akiyama, S. A Revision of the Species of Hydrangea (Hydrangeaceae) described by Siebold and Zuccarini, Part 2. Bull. Natl. Mus. Nat. Sci. Ser. B 2014, 40, 29–45. [Google Scholar]
- Reed, S.M.; Rinehart, T.A. Hydrangea macrophylla and serrata—Should we Lump’em or Split’em. In SNA Research Conference; Southern Nursery Association: Atlanta, GA, USA, 2006; Volume 51. [Google Scholar]
- Matsuno, T.; Kunikate, T.; Tanigawa, T.; Suyama, T.; Yamada, A. Establishment of Cultivation System Based on Flowering Characteristics in Hydrangea serrata (Thunb.) Ser. Hortic. Res. 2008, 7, 189–195. [Google Scholar] [CrossRef][Green Version]
- Ryu, M.-J.; Park, B.-M.; Bae, J.H. Effects of IBA, and NAA on the Rooting of Wild Hydrangea serrata for. acuminata. Prot. Hortic. Plant Fact. 2010, 19, 397–402. [Google Scholar]
- Yin, L.Q.; Hu, Y.H.; Tang, G.; Huang, W.C.; Li, S.Z.; Wang, X.Q. In vitro culture and rapid propagation of Hydrangea serrata ‘Preziosa’. Acta Agric. Shanghai 2010, 26, 38–41. [Google Scholar]
- Meeboon, J.; Takamatsu, S. Notes on powdery mildews (Erysiphales) in Japan: II. Erysiphe sect. Microsphaera. Mycoscience 2015, 56, 230–236. [Google Scholar] [CrossRef]
- Suyama, T.; Tanigawa, T.; Yamada, A.; Matsuno, T.; Kunitake, T.; Saeki, K.; Nakamura, C. Inheritance of the Double-flowered Trait in Decorative Hydrangea Flowers. Hortic. J. 2015, 84, 253–260. [Google Scholar] [CrossRef]
- Owen, J.S.; Fulcher, A.; LeBude, A.; Chappell, M. Hydrangea Production: Cultivar Selection and General Practices to Consider When Propagating and Growing Hydrangea. UT Ext. PB 1840-A 2016, 1–12. [Google Scholar] [CrossRef]
- Kindl, H. Formation of a Stilbene in Isolated Chloroplasts. Hoppe-Seyler’s Z. fur Physiol. Chem. 1971, 325, 767–768. [Google Scholar]
- Yagi, A.; Ogata, Y.; Yamauchi, T.; Nishoka, I. Metabolism of Phenylpropanoids in Hydrangea serrata var. thunbergii and the Biosynthesis of Phyllodulcin. Phytochemistry 1977, 16, 1098–1100. [Google Scholar] [CrossRef]
- Asen, S.; Cathey, H.M.; Stuart, N.W. Enhancement of Gibberellin growth-promotiong Activity by Hydrangenol Isolated From Leaves of Hydrangea macrophylla. Plant Physiol. 1960, 35, 816–819. [Google Scholar] [CrossRef] [PubMed]
- Loconsole, D.; Santamaria, P. UV Lighting in Horticulture: A Sustainable Tool for Improving Production Quality and Food Safety. Horticulturae 2021, 7, 9. [Google Scholar] [CrossRef]
- Ferrante, A.; Mariani, L. Agronomic Management for Enhancing Plant Tolerance to Abiotic Stresses: High and Low Values of Temperature, Light Intensity, and Relative Humidity. Horticulturae 2018, 4, 21. [Google Scholar] [CrossRef]
- Yeary, W.M.; Fulcher, A. A Tennessee Landscape Contractors Guide to Hydrangeas. UT Ext. 2013, W304, 1–10. [Google Scholar]
- Kesumawati, E.; Hosokawa, M.; Kimata, T.; Uemachi, T.; Yazawa, S. Flower greening in phytoplasma-infected Hydrangea macrophylla grown under different shading conditions. Sci. Hortic. 2009, 121, 199–205. [Google Scholar] [CrossRef]
- de Castro, E.M.; Pinto, J.E.B.P.; Bertolucci, S.K.; Malta, M.R.; Cardoso, M.D.G.; de Silva, F.A. Coumarin Contents in Young Mikania glomerata Plants (Guaco) under Different Radiation Levels and Photoperiod. Acta Farm. Donaerense 2006, 25, 387–392. [Google Scholar]
- Surjadinata, B.B.; Jacobo-Velázquez, D.A.; Cisneros-Zevallos, L. UVA, UVB and UVC Light Enhances the Biosynthesis of Phenolic Antioxidants in Fresh-Cut Carrot through a Synergistic Effect with Wounding. Molecules 2017, 22, 668. [Google Scholar] [CrossRef]
- Rouphael, Y.; Kyriacou, M.C.; Petropoulos, S.A.; Pascale, S.d.; Colla, G. Improving vegetable quality in controlled environments. Sci. Hortic. 2018, 234, 275–289. [Google Scholar] [CrossRef]
- Castellano, S.; Scarascia Mugnozza, G.; Russo, G.; Briassoulis, D.; Mistriotis, A.; Hemming, S.; Waaijenberg, D. Plastic Nets in Agriculture: A General Review of Types and Applications. Appl. Eng. Agric. 2008, 24, 799–808. [Google Scholar] [CrossRef]
- Müller-Xing, R.; Xing, Q.; Goodrich, J. Footprints of the sun: Memory of UV and light stress in plants. Front. Plant Sci. 2014, 5, 474. [Google Scholar] [CrossRef] [PubMed]
- Stigter, C.J. Shading: A traditional method of microclimate manipulation. Neth. J. Agri. Sci. 1984, 32, 81–86. [Google Scholar] [CrossRef]
- Nissim-Levi, A.; Farkash, L.; Hamburger, D.; Ovadia, R.; Forrer, I.; Kagan, S.; Oren-Shamir, M. Light-scattering shade net increases branching and flowering in ornamental pot plants. J. Hortic. Sci. Biotechnol. 2008, 83, 9–14. [Google Scholar] [CrossRef]
- Scharr, H.; Minervini, M.; French, A.P.; Klukas, C.; Kramer, D.M.; Liu, X.; Luengo, I.; Pape, J.-M.; Polder, G.; Vukadinovic, D.; et al. Leaf segmentation in plant phenotyping: A collation study. Mach. Vis. Appl. 2015, 27, 585–606. [Google Scholar] [CrossRef]
- Jansen, M.; Gilmer, F.; Biskup, B.; Nagel, K.A.; Rascher, U.; Fischbach, A.; Briem, S.; Dreissen, G.; Tittmann, S.; Braun, S.; et al. Simultaneous phenotyping of leaf growth and chlorophyll fluorescence via GROWSCREEN FLUORO allows detection of stress tolerance in Arabidopsis thaliana and other rosette plants. Funct. Plant Biol. 2009, 36, 902–914. [Google Scholar] [CrossRef]
- Masuka, B.; Araus, J.L.; Das, B.; Sonder, K.; Cairns, J.E. Phenotyping for abiotic stress tolerance in maize. J. Integr. Plant Biol. 2012, 54, 238–249. [Google Scholar] [CrossRef]
- Bannari, A.; Morin, D.; Bonn, F.; Huete, A.R. A review of vegetation indices. Remote Sens. Rev. 1995, 13, 95–120. [Google Scholar] [CrossRef]
- Gamon, J.; Field, C.B.; Goulden, M.L.; Griffin, K.L.; Hartley, A.E.; Joel, G.; Peñuelas, J.; Valentini, R. Relationships Between NDVI, Canopy Structure, and Photosynthesis in Three Californian Vegetation Types. Ecol. Appl. 1995, 5, 28–41. [Google Scholar] [CrossRef]
- Hatfield, J.L.; Prueger, J.H. Value of Using Different Vegetative Indices to Quantify Agricultural Crop Characteristics at Different Growth Stages under Varying Management Practices. Remote. Sens. 2010, 2, 562–578. [Google Scholar] [CrossRef]
- Garbulsky, M.F.; Peñuelas, J.; Gamon, J.; Inoue, Y.; Filella, I. The photochemical reflectance index (PRI) and the remote sensing of leaf, canopy and ecosystem radiation use efficienciesA review and meta-analysis. Remote Sens. Environ. 2011, 115, 281–297. [Google Scholar] [CrossRef]
- Roberts, D.A.; Roth, K.L.; Perroy, R.L. Hyperspectral Vegetation Indices. In Hyperspectral Remote Sensing of Vegetation; Thenkabail, A., Lyon, P., Huete, J., Eds.; CRC Press: Boca Raton, FL, USA, 2011; pp. 309–328. ISBN 978-1-4398-4537-0. [Google Scholar]
- Horler, D.; Dockray, M.; Barber, J. The red edge of plant leaf reflectance. Int. J. Remote Sens. 1983, 4, 273–288. [Google Scholar] [CrossRef]
- Boochs, F.; Kupfer, G.; Dockter, K.; Kühbauch, W. Shape of the red edge as vitality indicator for plants. Int. J. Remote Sens. 1990, 11, 1741–1753. [Google Scholar] [CrossRef]
- Greer, D.H. Non-destructive chlorophyll fluorescence and colour measurements of ‘Braeburn’ and ‘Royal Gala’ apple (Malus domestica) fruit development throughout the growing season. N. Z. J. Crop. Hortic. Sci. 2005, 33, 413–421. [Google Scholar] [CrossRef]
- McGuire, R.G. Reporting of Objective Color Measurements. Hort. Sci. 1992, 27, 1254–1255. [Google Scholar] [CrossRef]
- Rouse, J.W.; Haas, R.H.; Schell, J.A.; Deering, D.W.; Harlan, J.C. Monitoring the Vernal Advancement and Retrogradation (Greenwave Effect) of Natural Vegetation; NASA/GSFCT Type III final Report: Greenbelt, MD, USA, 1974. [Google Scholar]
- Haboudane, D.; Miller, J.R.; Pattey, E.; Zarco-Tejada, P.J.; Strachan, I.B. Hyperspectral vegetation indices and novel algorithms for predicting green LAI of crop canopies: Modeling and validation in the context of precision agriculture. Remote Sens. Environ. 2004, 90, 337–352. [Google Scholar] [CrossRef]
- Zarco-Tejada, P.J.; Berjón, A.; López-Lozano, R.; Miller, J.R.; Martín, P.; Cachorro, V.; González, M.R.; Frutos, A.D. Assessing vineyard condition with hyperspectral indices: Leaf and canopy reflectance simulation in a row-structured discontinuous canopy. Remote Sens. Environ. 2005, 99, 271–287. [Google Scholar] [CrossRef]
- Gitelson, A.A.; Merzlyak, M.N.; Chivkunova, O.B. Optical Properties and Nondestructive Estimation of Anthocyanin Content in Plant Leaves. Photochem. Photobiol. 2001, 74, 38–45. [Google Scholar] [CrossRef]
- Gitelson, A.A.; Zur, Y.; Chivkunova, O.B.; Merzlyak, M.N. Assessing Carotenoid Content in Plant Leaves with Reflectance Spectroscopy. Photochem. Photobiol. 2002, 75, 272–281. [Google Scholar] [CrossRef]
- Gamon, J.A.; Peñuelas, J.; Field, C.B. A narrow-waveband spectral index that tracks diurnal changes in photosynthetic efficiency. Remote Sens. Environ. 1992, 41, 35–44. [Google Scholar] [CrossRef]
- Merzlyak, M.N.; Gitelson, A.A.; Chivkumova, O.B.; Rakitin, V.Y. Non-destructive optical detection of pigment changes during leaf senescence and fruit ripening. Physiol. Plant. 1999, 106, 135–141. [Google Scholar] [CrossRef]
- Clevers, J.; Jong, S.M.d.; Epema, G.F.; van der Meer, F.D.; Bakker, W.H.; Skidmore, A.K.; Scholte, K.H. Derivation of the red edge index using the MERIS standard band setting. Int. J. Remote Sens. 2002, 23, 3169–3184. [Google Scholar] [CrossRef]
- Dietrich, S.; Valio, I. Effect of coumarin and its derivatives on the growth of Pythium and other fungi. Trans. Br. Mycol. Soc. 1973, 61, 461–469. [Google Scholar] [CrossRef]
- Nesi, B.; Lazzareschi, S.; Pecchioli, S.; Grassotti, A.; Salazar-Orozco, G. Effects of Colored Shade Netting on the Vegetative Development and on the Photosynthetic Activity in Several Hydrangea Genotypes. Acta Hort. 2013, 1000, 345–352. [Google Scholar] [CrossRef]
- Cochran, D.R.; Fulcher, A. Type and Rate of Plant Growth Regulator Influence Vegetative, Floral Growth, and Quality of Little Lime™ Hydrangea. Hortte 2013, 23, 306–311. [Google Scholar] [CrossRef]
- Sun, Y.; Bi, G.; Niu, G.; Perez, C. Foliar Application of Dikegulac Sodium Increases Branching of ‘Merritt’s Supreme’ Bigleaf Hydrangea. Hortte 2015, 25, 306–312. [Google Scholar] [CrossRef]
- Hester, K.A.; Bi, G.; Czarnota, M.A.; Fulcher, A.; Keever, G.J.; Lieth, J.H.; Orsi, J.D.; Whipker, B.E.; Sullivan, K.; Palmer, C.L. Impact of Augeo, Configure and Florel on Hydrangea Branching. J. Environ. Hortic. 2013, 31, 27–29. [Google Scholar] [CrossRef]
- Condon, M. Evaluating hydrangea performance©. In Proceedings of the 2016 Annual Meeting of the International Plant Propagators’ Society 1174; International Society for Horticultural Science (ISHS): Leuven, Belgium, 2017; pp. 241–248. [Google Scholar] [CrossRef]
- Steyn, W.J.; Wand, S.; Holcroft, D.M.; Jacobs, G. Anthocyanins in vegetative tissues: A proposed unified function in photoprotection. New Phytol. 2002, 155, 349–361. [Google Scholar] [CrossRef]
- Chalker-Scott, L. Environmental Significance of Anthocyanins in Plant Stress Responses. Photochem. Photobiol. 1999, 70, 1–9. [Google Scholar] [CrossRef]
- Sarijeva, G.; Knapp, M.; Lichtenthaler, H.K. Differences in photosynthetic activity, chlorophyll and carotenoid levels, and in chlorophyll fluorescence parameters in green sun and shade leaves of Ginkgo and Fagus. J. Plant Physiol. 2007, 164, 950–955. [Google Scholar] [CrossRef]
- Strid, A.; Porra, R.J. Alterations in Pigment Content in Leaves of Pisum sativum After Exposure to Supplementary UV-B. Plant Cell Physiol. 1992, 33, 1015–1023. [Google Scholar] [CrossRef]
- Marwood, C.A.; Greenberg, B.M. Effect of Supplementary UVB Radiation on Chlorophyll Synthesis and Accumulation of Photosystems during Chloroplast Development in Spirodela oligorrhiza. Photochem. Photobiol. 1996, 64, 664–670. [Google Scholar] [CrossRef]
- Mahdavian, K.; Ghorbanli, M.; Kalantari, K. The Effects of Ultraviolet Radiation on the Contents of Chlorophyll, Flavonoid, Anthocyanin and Proline in Capsicum annuum L. Turk. J. Bot. 2008, 32, 25–33. [Google Scholar]
- Thenot, F.; Méthy, M.; Winkel, T. The Photochemical Reflectance Index (PRI) as a water-stress index. Int. J. Remote Sens. 2002, 23, 5135–5139. [Google Scholar] [CrossRef]
- Angert, A.; Biraud, S.; Bonfils, C.; Henning, C.; Buermann, W.; Pinzon, J.; Tucker, C.J.; Fung, I. Drier summers cancel out the CO2 uptake enhancement induced by warmer springs. Proc. Natl. Acad. Sci. USA 2005, 102, 10823–10827. [Google Scholar] [CrossRef] [PubMed]
- Soheila, A.H. Plant responses to ultraviolet-B (UV-B: 280–320 nm) stress: What are the key regulators? Plant Growth Regul. 2000, 32, 27–39. [Google Scholar] [CrossRef]
- Kakani, V.G.; Reddy, K.R.; Zhao, D.; Gao, W. Senescence and hyperspectral reflectance of cotton leaves exposed to ultraviolet-B radiation and carbon dioxide. Physiol. Plant. 2004, 121, 250–257. [Google Scholar] [CrossRef]
- Collins, W. Remote Sensing of Crop Type and Maturity. Photogramm. Eng. Remote Sens. 1978, 44, 43–55. [Google Scholar]
- Filella, I.; Peñuelas, J. The red edge position and shape as indicators of plant chlorophyll content, biomass and hydric status. Int. J. Remote Sens. 1994, 15, 1459–1470. [Google Scholar] [CrossRef]
- Noodén, L.D.; Guiamét, J.J.; John, I. 15—Whole Plant Senescence; Noodén, L.D., Ed.; Plant Cell Death Process. Academic Press: Cambridge, MA, USA, 2004; pp. 227–244. [Google Scholar] [CrossRef]


| Category 1 | Vegetation Index | Abbreviation and Equation 2 | Reference |
|---|---|---|---|
| Structure | Normalized Difference Vegetation Index | [42] | |
| Chlorophyll | Modified Chlorophyll Absorption in Reflectance Index 1 | [43] | |
| Chlorophyll | Greenness Index | [44] | |
| Anthocyanins | Anthocyanin Reflectance Index 1 | [45] | |
| Carotenoids | Carotenoid Reflectance Index 1 | [46] | |
| Light use | Photochemical Reflectance Index | [47] | |
| Stress | Plant Senescence Reflectance Index | [48] | |
| Stress | Red Edge Inflection Point 1 | ) | [49] |
| Time | Flow (mL/min) | %A | %B |
|---|---|---|---|
| 0.00 | 0.8 | 70% | 30% |
| 2.00 | 0.8 | 66% | 34% |
| 2.01 | 0.8 | 05% | 95% |
| 3.01 | 0.8 | 05% | 95% |
| 3.02 | 0.8 | 70% | 30% |
| 4.00 | 0.8 | 70% | 30% |
Publisher’s Note: MDPI stays neutral with regard to jurisdictional claims in published maps and institutional affiliations. |
© 2021 by the authors. Licensee MDPI, Basel, Switzerland. This article is an open access article distributed under the terms and conditions of the Creative Commons Attribution (CC BY) license (https://creativecommons.org/licenses/by/4.0/).
Share and Cite
Moll, M.D.; Vieregge, A.S.; Wiesbaum, C.; Blings, M.; Vana, F.; Hillebrand, S.; Ley, J.; Kraska, T.; Pude, R. Dihydroisocoumarin Content and Phenotyping of Hydrangea macrophylla subsp. serrata Cultivars under Different Shading Regimes. Agronomy 2021, 11, 1743. https://doi.org/10.3390/agronomy11091743
Moll MD, Vieregge AS, Wiesbaum C, Blings M, Vana F, Hillebrand S, Ley J, Kraska T, Pude R. Dihydroisocoumarin Content and Phenotyping of Hydrangea macrophylla subsp. serrata Cultivars under Different Shading Regimes. Agronomy. 2021; 11(9):1743. https://doi.org/10.3390/agronomy11091743
Chicago/Turabian StyleMoll, Marcel Dieter, Alena Sophia Vieregge, Charis Wiesbaum, Maria Blings, Frederik Vana, Silke Hillebrand, Jakob Ley, Thorsten Kraska, and Ralf Pude. 2021. "Dihydroisocoumarin Content and Phenotyping of Hydrangea macrophylla subsp. serrata Cultivars under Different Shading Regimes" Agronomy 11, no. 9: 1743. https://doi.org/10.3390/agronomy11091743
APA StyleMoll, M. D., Vieregge, A. S., Wiesbaum, C., Blings, M., Vana, F., Hillebrand, S., Ley, J., Kraska, T., & Pude, R. (2021). Dihydroisocoumarin Content and Phenotyping of Hydrangea macrophylla subsp. serrata Cultivars under Different Shading Regimes. Agronomy, 11(9), 1743. https://doi.org/10.3390/agronomy11091743