Article

A Sustainable Reversed-Phase HPTLC Method for the Quantitative Estimation of Hesperidin in Traditional and Ultrasound-Assisted Extracts of Different Varieties of Citrus Fruit Peels and Commercial Tablets

1
Department of Pharmacognosy, College of Pharmacy, Prince Sattam Bin Abdulaziz University, P.O. Box 173, Al-Kharj 11942, Saudi Arabia
2
Department of Pharmaceutics, College of Pharmacy, King Saud University, P.O. Box 2457, Riyadh 11451, Saudi Arabia
3
Department of Pharmacognosy, Faculty of Pharmacy, Alexandria University, Alexandria 21215, Egypt
*
Author to whom correspondence should be addressed.
Agronomy 2021, 11(9), 1744; https://doi.org/10.3390/agronomy11091744
Submission received: 9 August 2021 / Revised: 23 August 2021 / Accepted: 28 August 2021 / Published: 30 August 2021
(This article belongs to the Special Issue Extraction and Analysis of Bioactive Compounds in Crops)

Abstract

:
Hesperidin (HSP) is a bioactive flavanone glycoside, present abundantly in the variety of citrus fruits. The environmental safety and sustainability of the reported analytical assays of HSP analysis have not been considered in the literature. Hence, a sensitive and sustainable “reversed-phase high-performance thin-layer chromatography (RP-HPTLC)” method has been developed and validated for HSP analysis in traditional (TE) and ultrasound-based (UBE) extracts of four different varieties of citrus fruit peels and its commercial tablet dosage forms. The binary combination of green solvents such as ethanol-water (50:50, v v−1) was used as the mobile phase. The detection of HSP was performed at 287 nm. The sustainable RP-HPTLC method was linear in 20–2000 ng band−1 range. The studied validation parameters, including accuracy, precision, robustness, sensitivity were acceptable for HSP analysis. The content of HSP in TE of four different varieties of citrus fruits including grapefruit peels (Citrus paradisi), mosambi peels (Citrus limetta), lemon peels (Citrus lemon), and orange peels (Citrus sinensis) was detected as 8.26, 6.94, 5.90, and 6.81% w w−1, respectively. The content of HSP in TE of commercial formulations A and B was detected as 5.31 and 5.55% w w−1, respectively. However, the content of HSP in UBE of grapefruit peels, mosambi peels, lemon peels, and orange peels was detected as 11.41, 8.86, 7.98, and 8.64% w w−1, respectively. The content of HSP in UBE of commercial formulations A and B was detected as 6.72 and 6.92% w w−1, respectively. The greenness score of the sustainable RP-HPTLC method was predicted as 0.83 using analytical GREEnness (AGREE) metric approach, indicated the excellent greenness profile of the RP-HPTLC method. UBE procedure for HSP was superior over its TE procedure. These observations and results suggested that the present RP-HPTLC method can be successfully used for the quantitative estimation of HSP in the variety of citrus fruit peels and its commercial formulations. In addition, this method is simple, rapid, precise, accurate, and economical compared to the reported analytical methods of HSP analysis. It is also safe and sustainable method due to the use of ethanol-water solvents systems, as both the solvents are green solvents compared to the solvents used in reported analytical methods of HSP analysis.

1. Introduction

Citrus fruits are important crops, which produced worldwide [1,2]. Traditionally, the by-products of citrus fruits such as pulps, seeds, and peels represent a problem in their disposal because these wastes were burned, which produced carbon dioxide and other harmful gases [1]. However, new ecofriendly approcahes have been developed now to obtain new high-value products [2]. Interestingly, citrus peels have natural bioactive compounds such as flavonoids, which have several therapeutic effects [2,3]. Hesperidin (HSP) is a flavanone glycoside, which is present in large amounts in the peels of various citrus fruits [4,5]. It possesses various therapeutic activities such as antioxidant [4,5], analgesic [6], anti-inflammatory [6,7,8], antiallergic [9], cardioprotective [10], and anticancer activities [11] in literature.
Various analytical techniques have been reported for the quantitative estimation of HSP either alone or in combination with other bioflavonoids in various food products, commercial formulations, and plant-based materials. An ultra-violet (UV) spectrometry method was applied for the simultaneous analysis of HSP and diosmin in tablet dosage form [12]. UV-spectrometry-based assay has also been reported for the quantitative estimation of HSP in dry matter of citrus tissues [13]. The main disadvantage of UV-spectrometry methods is their sensitivity [12,13]. The variety of “high-performance liquid chromatography (HPLC)” assays have been established for the quantitative estimation of HSP either alone or in combination with other bioflavonoids in commercial formulations, citus fruit peels, and citrus juices [14,15,16,17,18,19]. In most of the reported HPLC methods of HSP analysis, the mobile phase used was the binary combination of methanol and water (W). Methanol is a toxic solvent and hence these methods are not safe and sustainable for HSP analysis [14,15,16,17,18,19]. “Liquid chromatography tandem mass spectrometry (LC-MS)” assay has also been established for the determination of HSP in combination with other bioflavonoids in its plant-based materials [20]. Various LC-MS-based assays were also applied for the determination of HSP in combination with other bioflavonoids in the biological fluids of rats and humans [21,22,23,24,25]. An “ultra-performance liquid chromatography tandem mass spectrometry (UPLC-MS)” method has also been established for the simultaneous analysis of HSP, neo-HSP, naringin, naringenin, meranzin hydrate, and hesperitin in rat plasma samples and plant extract [26]. In reported LC-MS and UPLC-MS methods of HSP analysis, the mobile phase used was the binary combination of acetonitrile-W or acetonitrile-buffers. Acetonitrile is a highly toxic solvent and hence reported LC-MS and UPLC-MS methods are not safe and sustainable for HSP analysis [20,21,22,23,24,25,26]. A fluorimetry method has also been established for the simultaneous estimation of HSP and diosmin in combined dosage form and human plasma samples via complex formation using terbium [27]. Reported fluorimetry method was not sensitive enough for HSP analysis in human plasma samples [27]. A single normal-phase “high-performance thin-layer chromatography (HPTLC)” assay is available for the quantitative estimation of HSP in four different varieties of citrus fruit peels [28]. The ternary combination of ethyl acetate-methanol-W was used as the mobile phase for HSP analysis using reported HPTLC method. Although, ethyl acetate and W are green solvents, but methanol is a toxic solvent and hence this method was not completely safe and sustainable for HSP analysis [28]. After detailed evaluation of published reports on quantitative estimation of HSP in dosage forms, plant extracts, and biological fluids, we have found that the safety and sustainability of reported analytical assays were not assessed. Recently, a sustainable reversed-phase HPTLC (RP-HPTLC) assay has been reported for the determination of pterostilbene in comparison to the normal-phase HPTLC in its capsule dosage form. The combination of ethanol (EtOH)-W was used as the mobile phase in reported RP-HPTLC method of pterostilbene [29]. However, the composition of mobile phase and the nature of analytes of present study were different from reported method of pterostilbene analysis. In addition, the sustainable RP-HPTLC assay has not yet utilized for the quantitative analysis of HSP in its different varieties of citrus fruit peels and its commercial formulations. Sustainable HPTLC assays offer various advantages over HPLC and other analytical assays [30,31,32,33]. Therefore, the sustainable RP-HPTLC assay for the quantitative analysis of HSP was chosen in this research. Various metric approaches have been documented for the greenness assessment of the analytical methods [32,33,34,35,36,37]. However, only “analytical GREEnness (AGREE)” metric approach utilizes all 12 different principles of the “green analytical chemistry (GAC)” for this purpose [36]. Hence, the AGREE metric approach was used for the greenness evaluation of the sustainable RP-HPTLC assay [36]. Based on all these assumptions, the present research was aimed to establish a sensitive and sustainable RP-HPTLC assay for the quantitative analysis of HSP in four different varieties of citrus fruit peels including grapefruit peels (Citrus paradisi), mosambi peels (Citrus limetta), lemon peels (Citrus lemon), and orange peels (Citrus sinensis) and two different commercial formulations. The sustainable RP-HPTLC assay for the quantitative analysis of HSP was validated using “International Council for Harmonization (ICH)” Q2 (R1) recommendations [38].

2. Materials and Methods

2.1. Plant Materials

Four different variety of citrus fruits including, grape fruits, mosambi fruits, lemon fruits, and orange fruits were purchased from the hyper market of Al-Kharj, Saudi Arabia. All four plant materials were authenticated by a taxonomist at “Medicinal, Aromatic and Poisonous Plants Research Center (MAPPRC), College of Pharmacy, King Saud University, Riyadh, Saudi Arabia”. A voucher specimen (number 13998) was deposited in the “Herbarium of College of Pharmacy, King Saud University, Riyadh, Saudi Arabia”.

2.2. Chemicals and Reagents

The reference standard of HSP (purity: 99%) was procured from “Sigma Aldrich (St. Louis, MO, USA)”. HPLC-grade EtOH was procured from “E-Merck (Darmstadt, Germany)”. Deionized/HPLC-grade W was obtained from a “Milli-Q water purifier unit (E-Merck, Darmstadt, Germany)”. Other solvents/reagents were of analytical grades. The commercial tablet formulations of HSP i.e., formulation A and formulation B were procured from a pharmaceutical market in “Alexandria, Egypt”.

2.3. Chromatography

The quantitative analysis of HSP in its working standard, four different varieties of citrus fruit peels, and commercial tablet dosage forms was performed by “HPTLC CAMAG TLC system (CAMAG, Muttenz, Switzerland)”. The RP-HPTLC estimation of HSP was carried out via “10 × 20 cm2 aluminum plates pre-coated with RP silica gel 60 F254S plates (E-Merck, Darmstadt, Germany)”. The samples were spotted as the 6 mm bands with the help of a “CAMAG Automatic TLC Sampler 4 (ATS4) Sample Applicator (CAMAG, Geneva, Switzerland)”. The applicator for sampling was connected to the “CAMAG microliter Syringe (Hamilton, Bonaduz, Switzerland)”. The rate of applicationfor the quantification of HSP was fixed constant at 150 nL s1. The RP silica gel TLC plates were developed in a “CAMAG automatic developing chamber 2 (ADC2) (CAMAG, Muttenz, Switzerland)” with a distance of 80 mm under linear ascending mode. The mobile phase was the binary combination green solvents such as EtOH-W (50:50, v v1). The chamber for the development was saturated previously with the vapors of EtOH-W for 30 min at 22 °C. The detection of HSP was carried out at 287 nm. The slit dimensions (band length × width) and scanning rate were fixed at 4 × 0.45 mm2 and 20 mm s1, respectively. Each analysis was performed in triplicates. The software utilized for the data processing and analysis was “WinCAT’s (version 1.4.3.6336, CAMAG, Muttenz, Switzerland)”.

2.4. HSP Calibration Plot and Quality Control (QC) Samples

The weighed amount of HSP (10 mg) was dissolved in 100 mL of EtOH-W (50:50, v v1) binary solvent mixtures in order to obtain the stock solution of 100 μg mL1. The variable volumes of this stock solution were diluted again with EtOH-W (50:50, v v1) binary solvent mixtures to obtain the HSP concentrations in 20–2000 ng band1 range. The prepared solutions of HSP with variable concentrations were applied to the RP silica gel TLC plates. The chromatographic response for HSP was recorded for each HSP concentration using the sustainable RP-HPTLC method. The HSP calibration plot was constructed by plotting the HSP concentrations against its recorded TLC response. Additionally, three different QC samples, including low QC (LQC; 60 ng band1), middle QC (MQC; 800 ng band1), and high QC (HQC; 2000 ng band1) samples were prepared separately for validation studies of the sustainable RP-HPTLC method.

2.5. Sample Preparation for the Quantitative Analysis of HSP in TE of Citrus Fruit Peels

The air-dried peels (5 g) of four different varieties of citrus fruits including grapefruits (Citrus paradisi), mosambi fruits (Citrus limetta), lemon fruits (Citrus lemon), and orange fruits (Citrus sinensis) were coarsely powdered, defatted with petroleum ether and then exhaustively extracted a Soxhlet apparatus with hot methanol for 72 h. The solvent was evaporated and the residue was separately dissolved in methanol in 50 mL volumetric flask. The obtained samples were used for the quantitative analysis of HSP in TE of citrus fruit peels using the sustainable RP-HPTLC assay at 287 nm.

2.6. Sample Preparation for the Quantitative Analysis of HSP in UBE of Citrus Fruit Peels

The UBE of the air-dried peels (5 g) of four different varieties of citrus fruits was performed using ultrasonic vibrations using the “Bransonic series (Model CPX5800H-E; Princeton, NJ, USA)”. The methanol was evaporated using a rotary vacuum evaporator and the residue was dissolved in 50 mL of methanol in a volumetric flask. It was ultrasonicated at 50 °C for 1 h. The obtained samples were used for the quantitative analysis of HSP in UBE of four different varieties of citrus fruit peels using the sustainable RP-HPTLC assay at 287 nm.

2.7. Sample Processing for the Quantitative Analysis of HSP in TE of Commercial Tablet Dosage Forms

Two different tablet dosage forms (one brand containing 500 mg of HSP and another brand containing 50 mg of HSP) were weighed and an average weight for each brand was recorded. The tablets were crushed to obtain uniform powder. A powder containing 50 mg of HSP was extracted using hot methanol. The obtained mixture was filtered to remove any insoluble materials of the tablet and sonicated for 30 min. Approximately 1.0 mL of this stock was diluted again with methanol to obtain 50 mL solution. The obtained sample was used for the quantitative estimation of HSP in TE of tablet dosage forms using the sustainable RP-HPTLC assay at 287 nm.

2.8. Sample Preparation for the Quantitative Analysis of HSP in UBE of Commercial Tablet Dosage Forms

The UBE extraction of the HSP from commercial tablets was performed by ultrasonic vibrations using the “Bransonic series (Model CPX5800H-E; Princeton, NJ, USA)”. Both brands of HSP containing tablet dosage forms were crushed to obtain fine powder. A powder containing 50 mg of HSP was dissolved in hot methanol. The solvent was evaporated using a rotary vacuum evaporator and the residue was dissolved in 50 mL of methanol. The obtained solution was ultrasonicated at 70 °C for 1 h. The obtained samples were used for the quantitative estimation of HSP in UBE of tablet dosage forms using the sustainable RP-HPTLC assay at 287 nm.

2.9. Validation Studies

The sustainable RP-HPTLC assay for the quantitative estimation of HSP was validated for various validation parameters according to the ICH-Q2 (R1) recommendations [38]. The HSP linearity was evaluated by plotting HSP concentrations against its measured HPTLC area. The HSP linearity was determined in 20–2000 ng band1 range for the sustainable RP-HPTLC method. The system suitability parameters for the sustainable RP-HPTLC assay were determined in terms of “retardation factor (Rf), asymmetry factor (As), and number of theoretical plates per meter (N m1)”. The “Rf, As, and N m1” values were determined, by adopting their formulae reported in literature [39].
The accuracy for the sustainable RP-HPTLC assay was evaluated as the % recovery, which was obtained at LQC (60 ng band−1), MQC (800 ng band−1), and HQC (2000 ng band−1) for the sustainable RP-HPTLC assay.
The precision for the sustainable RP-HPTLC assay was measured as intra/interday precision. Intraday precision was evaluated by the determination of HSP at LQC, MQC, and HQC on the same day. Interday precision was evaluated by the determination of HSP at LQC, MQC and HQC on three different days [38]. Each precision was evaluated in six different replicates (n = 6).
The robustness was estimated by making some minor modifications in the mobile phase for the sustainable RP-HPTLC assay. For this, the original EtOH-W (50:50, v v−1) mobile phase was modified to EtOH-W (52:48, v v−1) and EtOH-W (48:52, v v−1) mobile phases, and the required analytical responses were noted [38].
The sensitivity for the sustainable RP-HPTLC assay was determined as “detection (LOD) and quantification (LOQ) limits” by standard deviation technique. The “LOD and LOQ” of HSP for the sustainable RP-HPTLC assay was calculated by adopting their standard formulae reported in literature [38,39].
The peak purity/specificity for the sustainable RP-HPTLC assay was determined by comparing the Rf values and spectrodensitograms of HSP in four different varieties of citrus fruits and tablet dosage forms with those of pure HSP.

2.10. Quantitative Estimation of HSP in TE and UBE of Citrus Fruits and Commercial Formulations

The processed samples of TE and UBE of four different varieties of citrus fruit peels and commercial formulations were spotted to the RP silica gel TLC plates and their HPTLC responses were recorded. The HSP contents in all processed samples were determined from the calibration plot of HSP for the sustainable RP-HPTLC assay.

2.11. Greenness Evaluation

The greenness profile for the sustainable RP-HPTLC assay was assessed using “AGREE metric approach” [36]. The AGREE scores (0.0–1.0) of the sustainable RP-HPTLC assay were predicted using the “AGREE: The Analytical Greenness Calculator (version 0.5, Gdansk University of Technology, Gdansk, Poland, 2020)”.

3. Results and Discussion

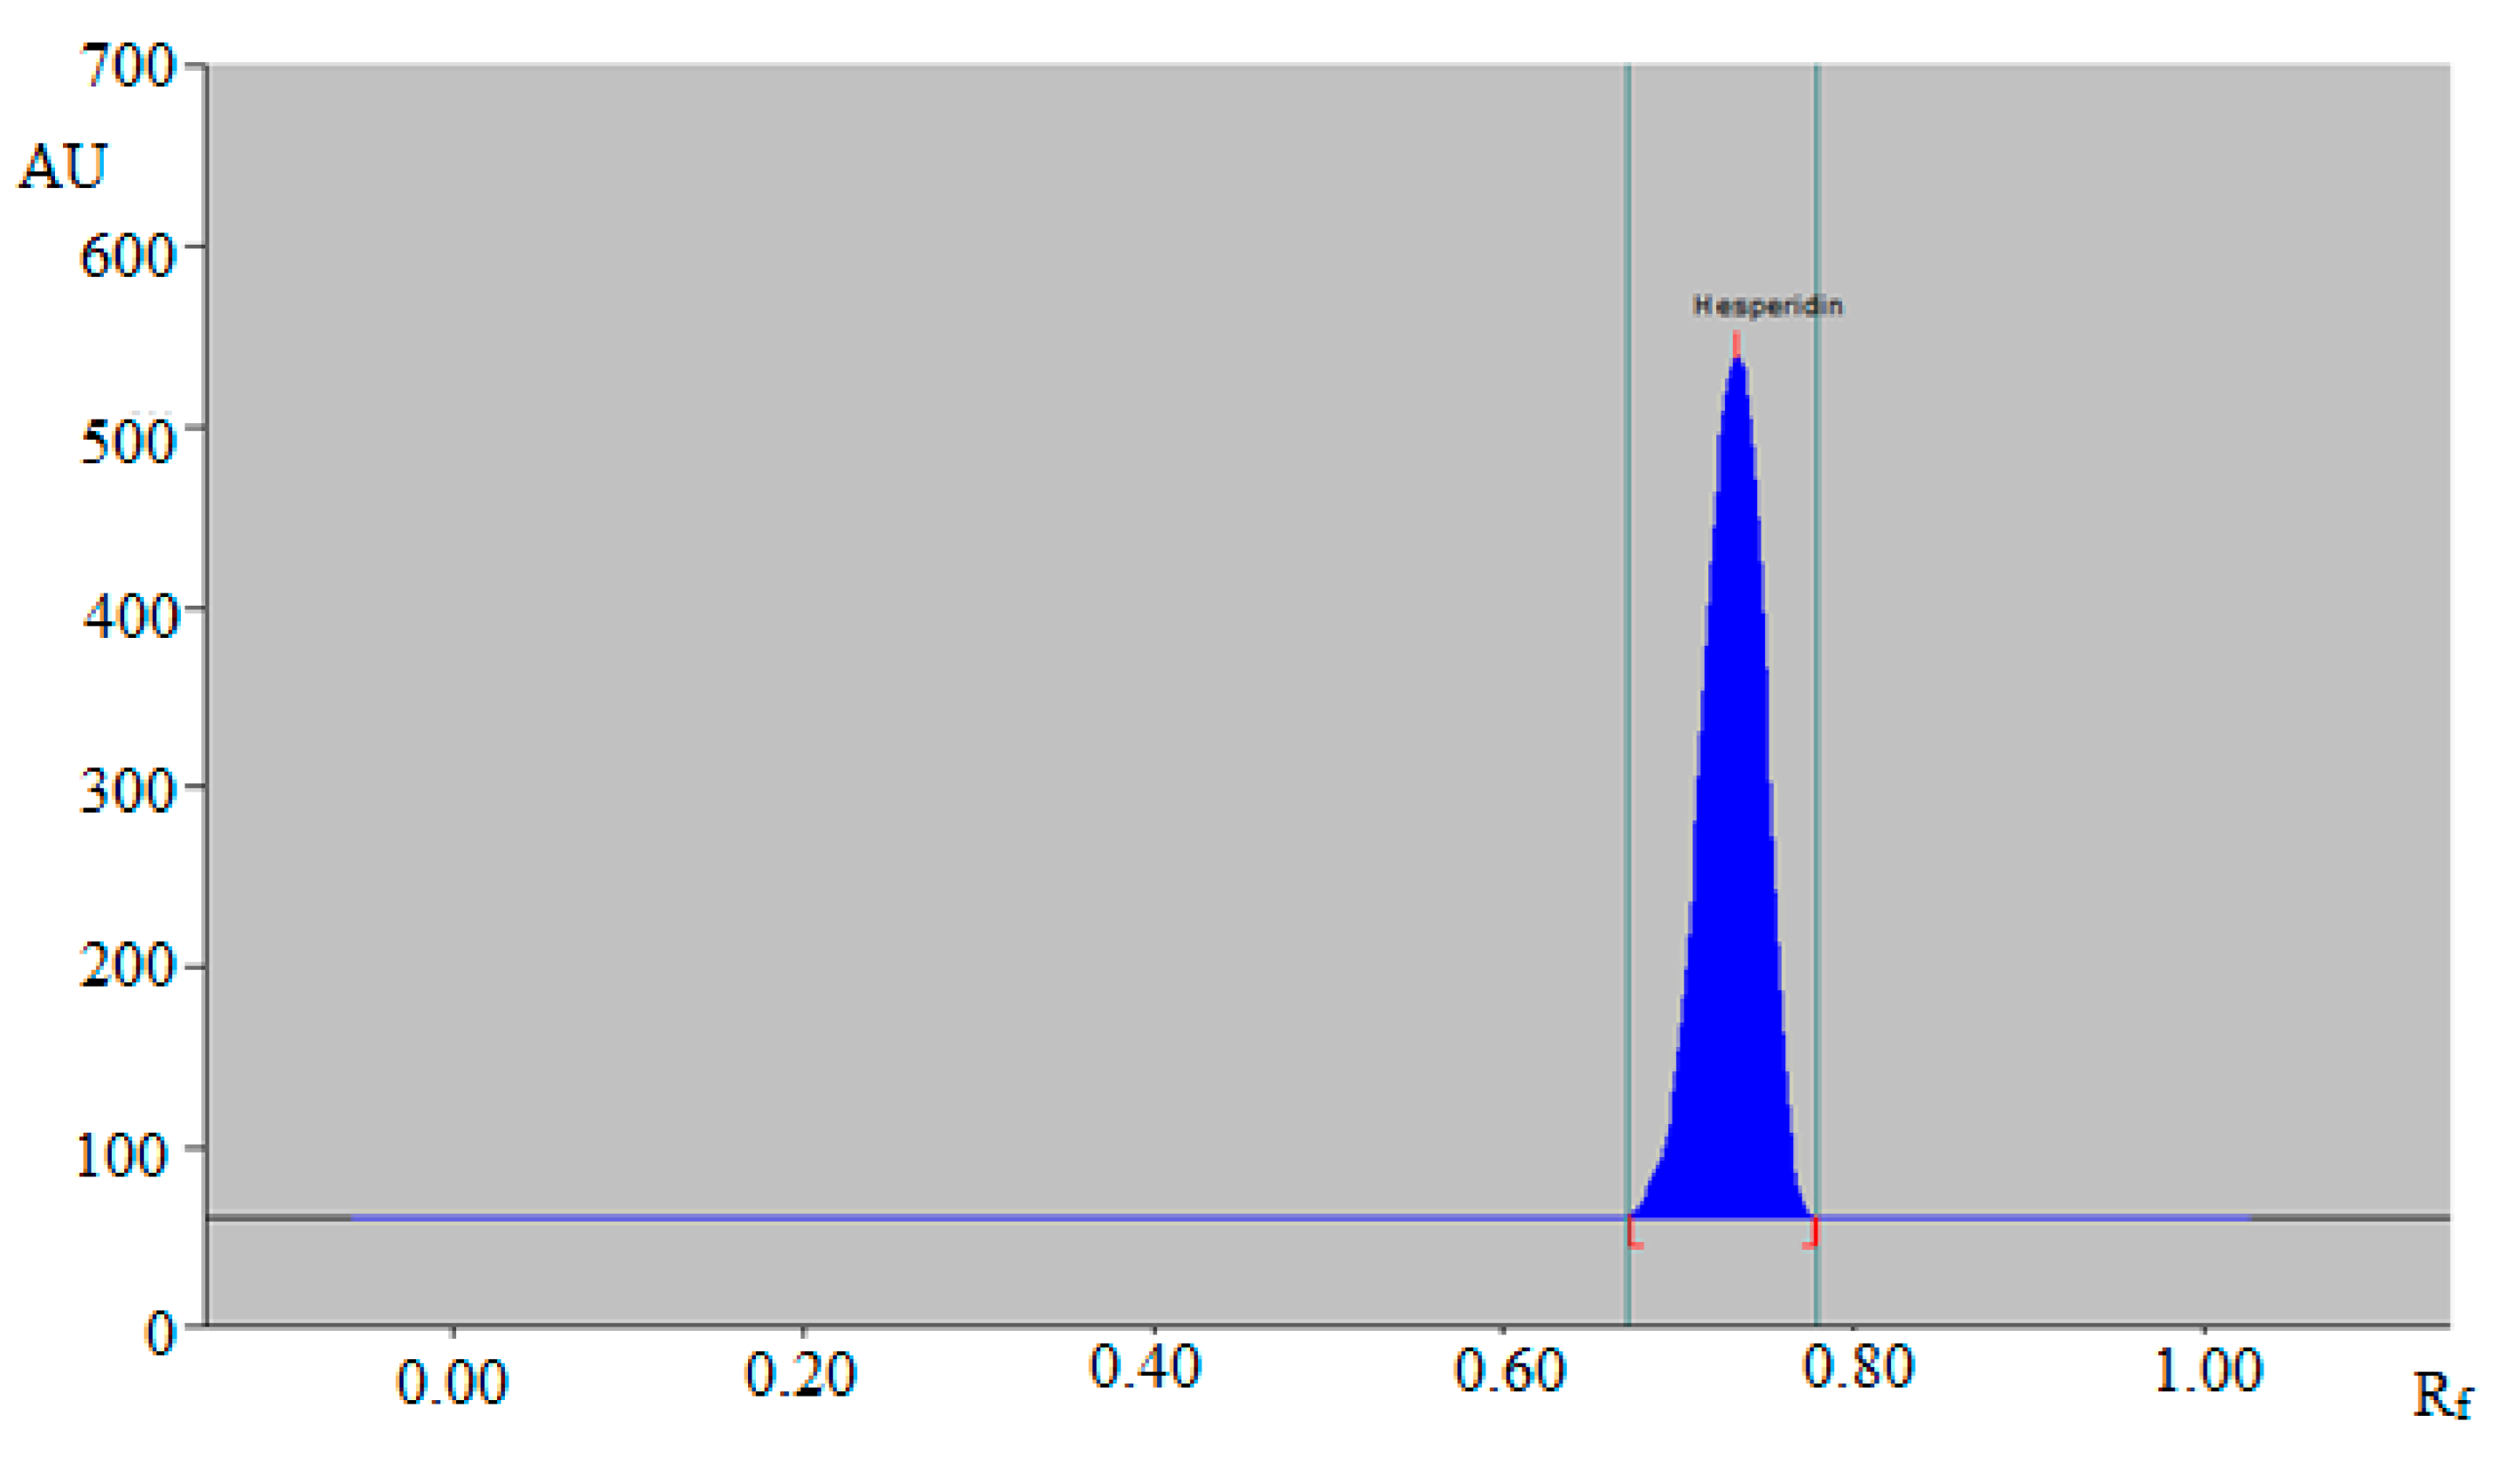
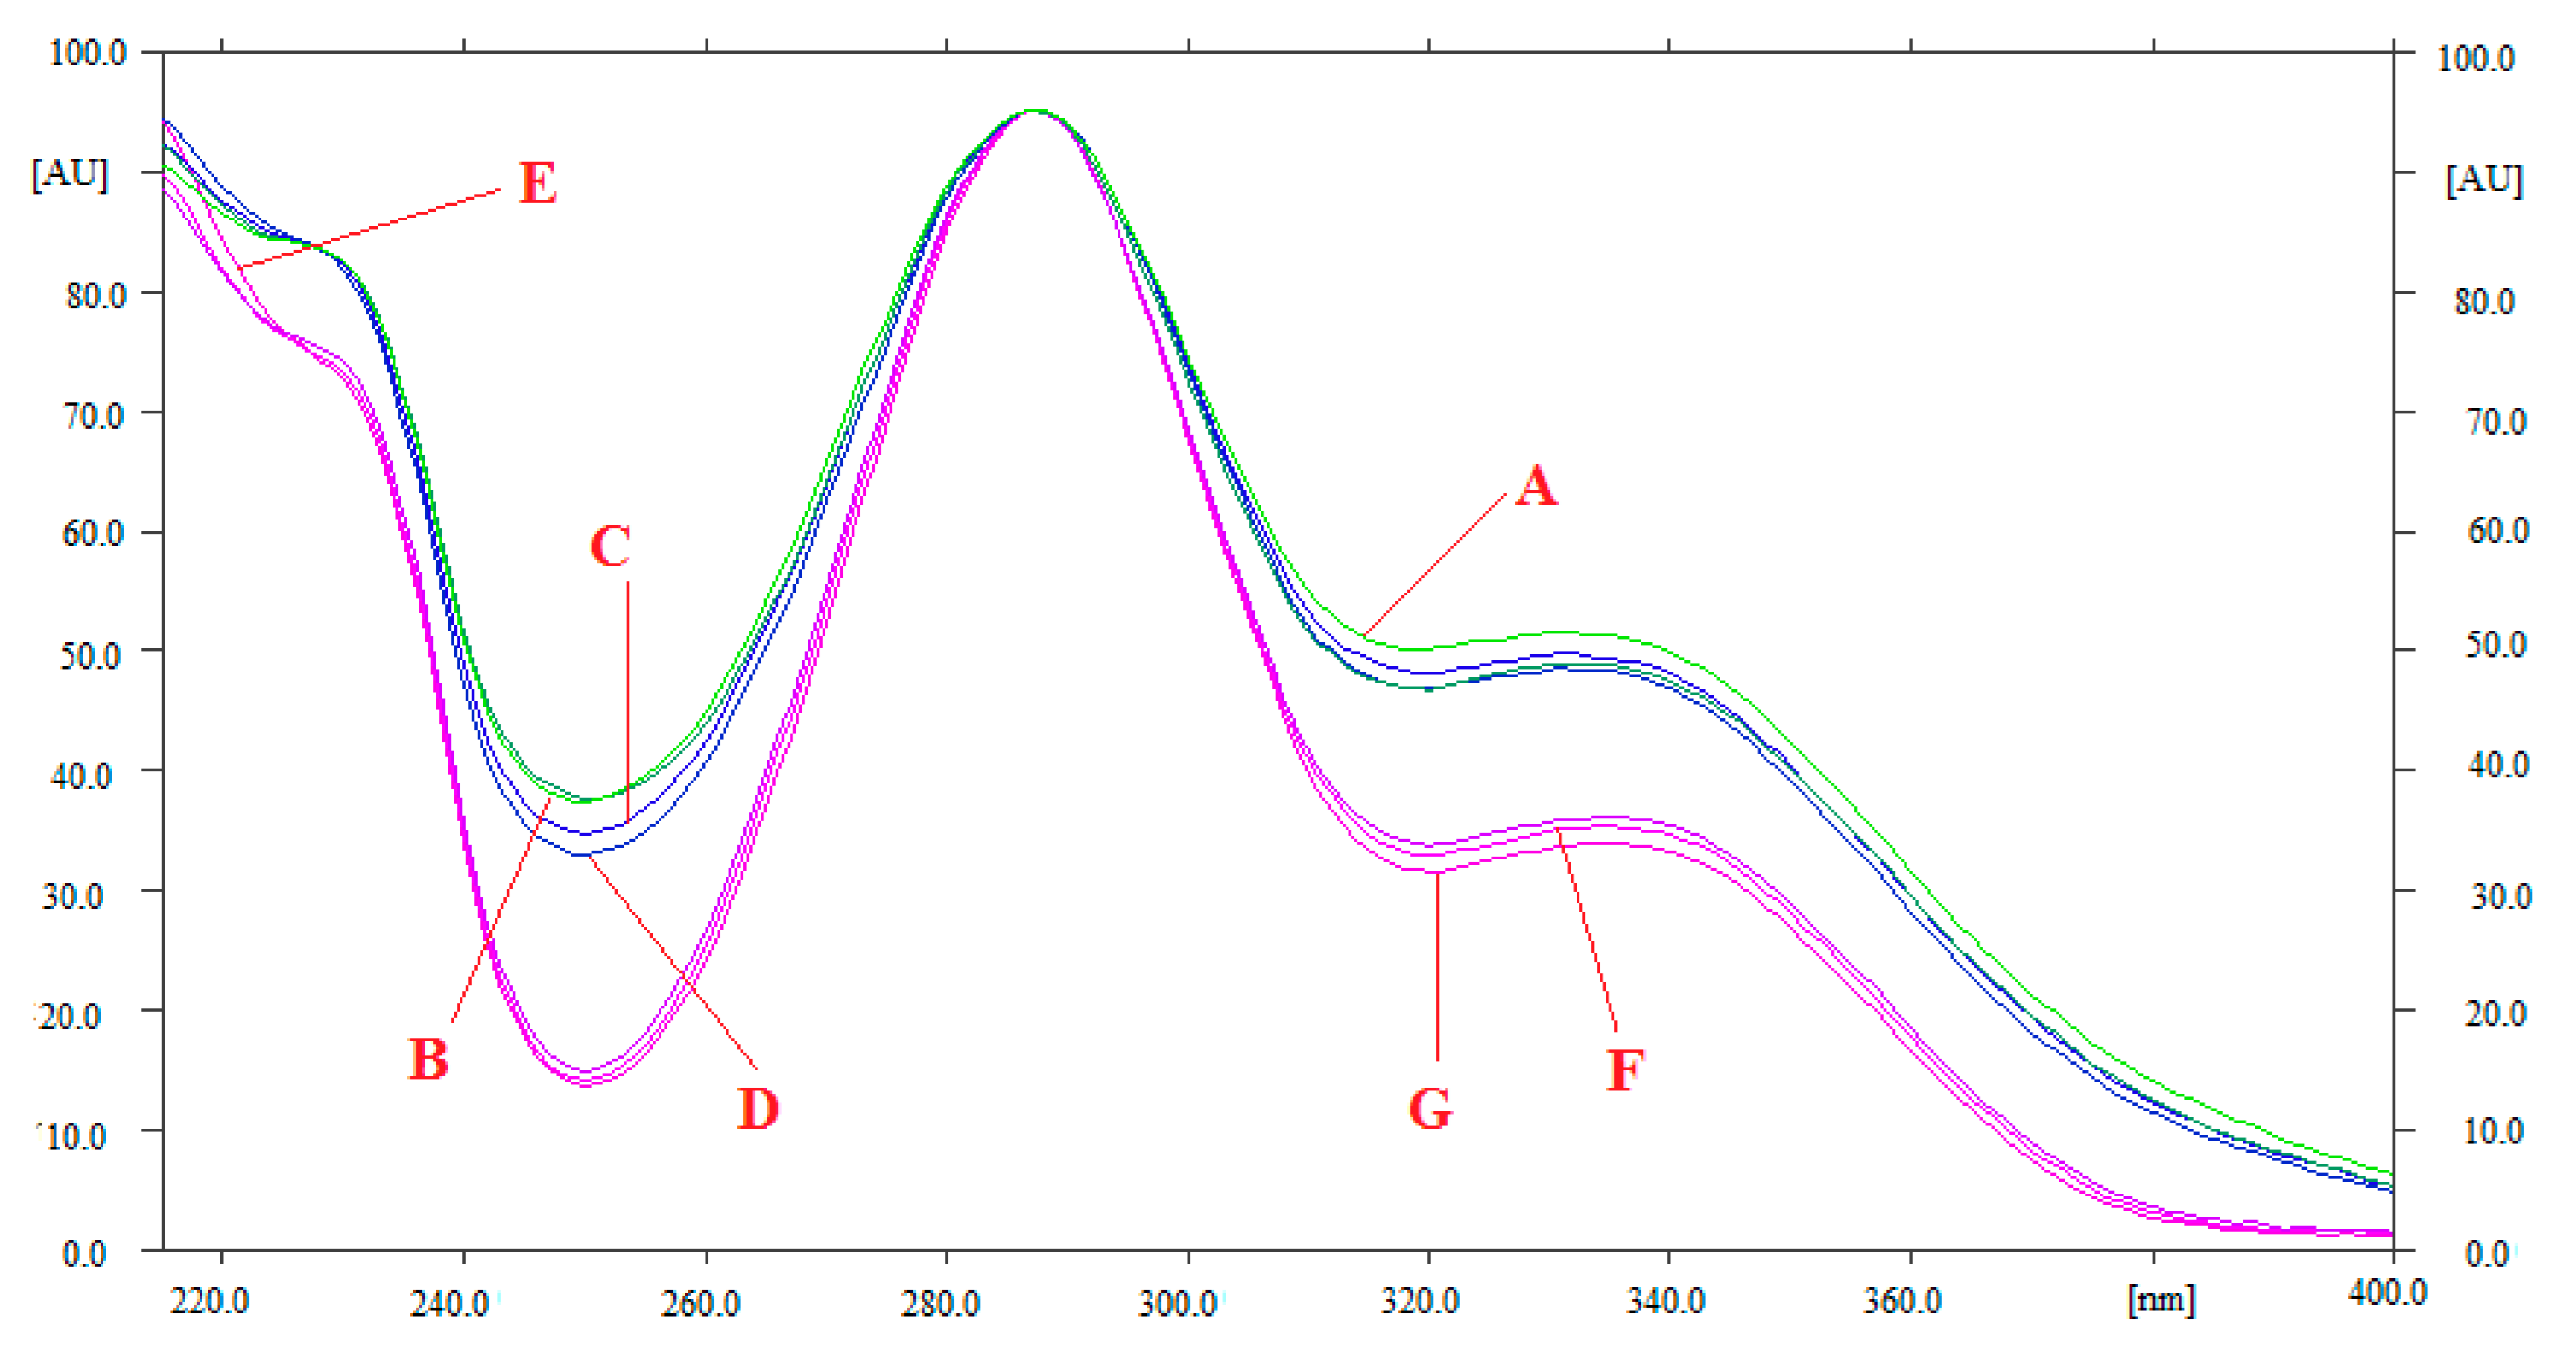
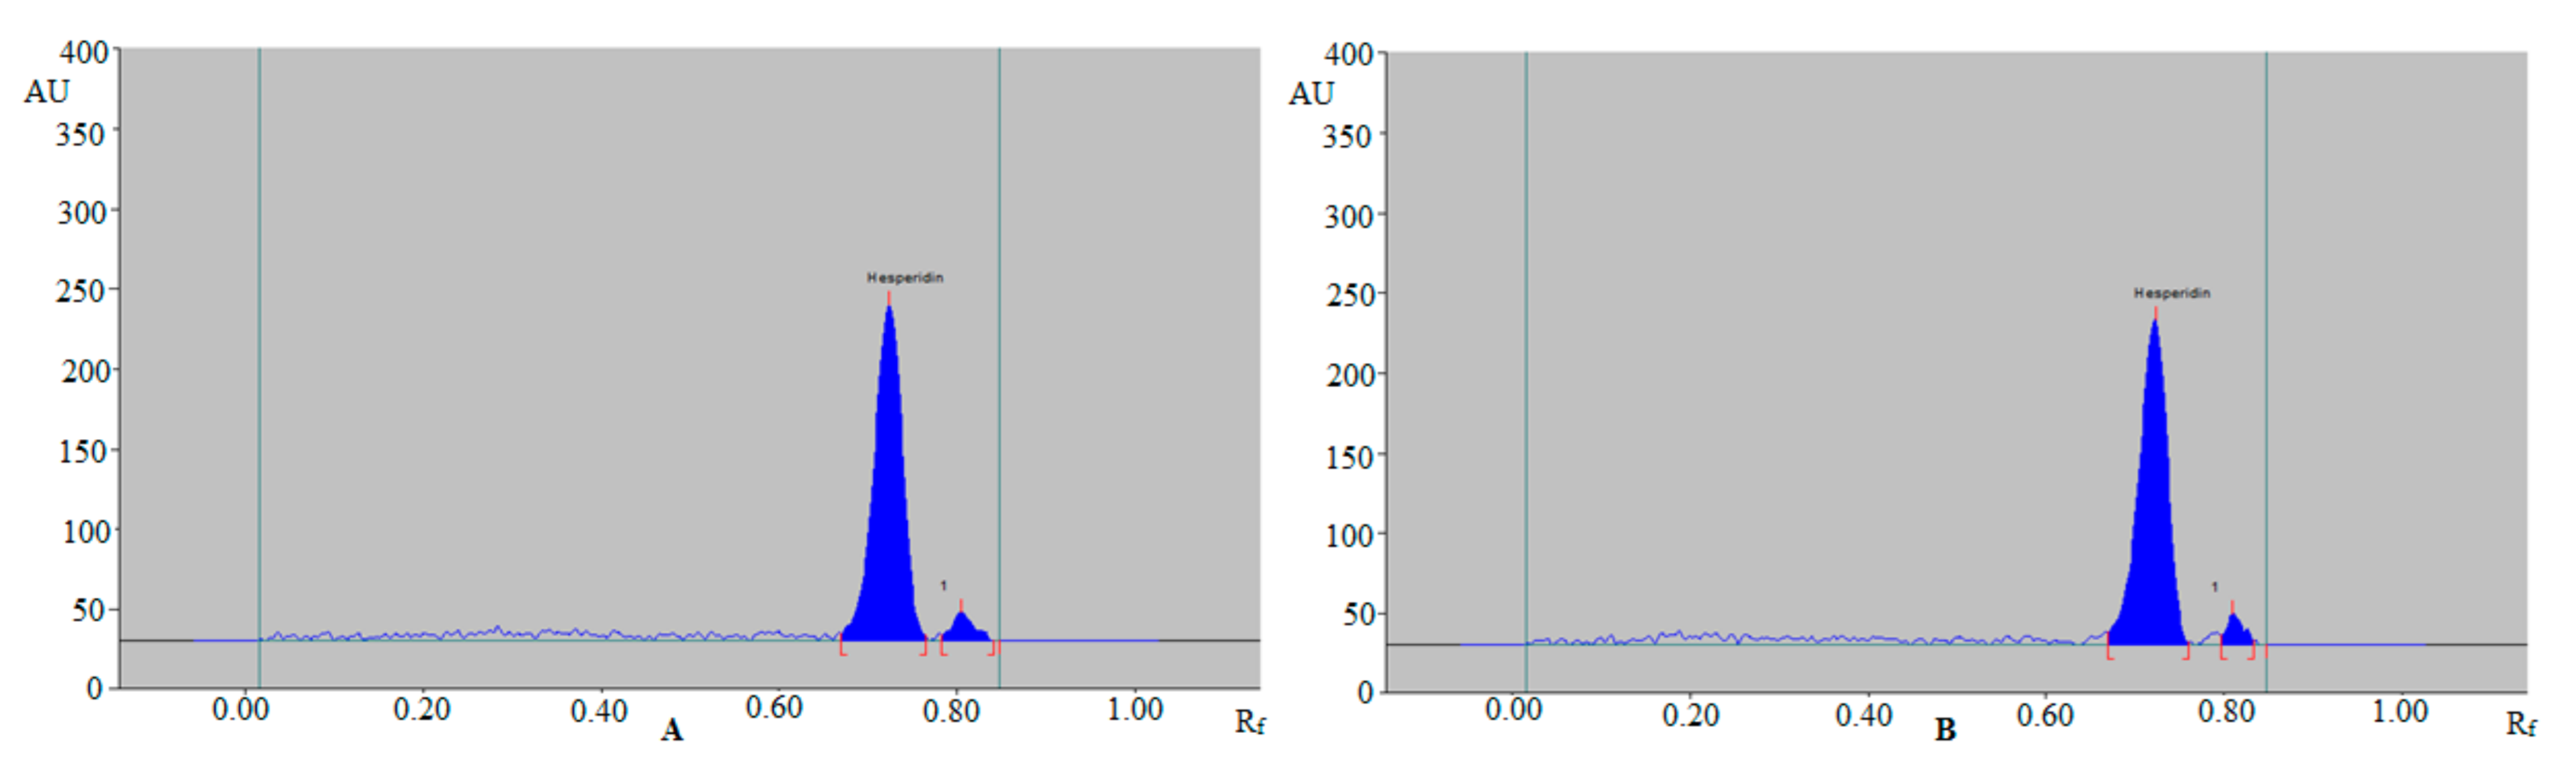
3.1. Method Development

Upon exhaustive analysis of reported analytical methods of HSP quantification, we found that the environmental safety and sustainability/greenness of the reported analytical methods have not been taken into consideration. Accordingly, the current study was performed to establish a rapid, sensitive, and sustainable RP-HPTLC assay for the quantitative estimation of HSP in TE and UBE of four different varieties of citrus fruit peels and two different tablet dosage forms.
For the determination of HSP using the sustainable RP-HPTLC assay, different amounts of EtOH and W such as EtOH-W (50:50, v v−1), EtOH-W (60:40, v v−1), EtOH-W (70:30, v v−1), EtOH-W (80:20, v v−1), and EtOH-W (90:10, v v−1) were studied as the green solvent mixtures/mobile phases for the development of an acceptable band for the quantitative analysis of HSP in TE and UBE of four different varieties of citrus fruit peels and two different commercial formulations. The green solvent system was developed under chamber saturation conditions and its pictogram is summarized in Figure 1.
From the results, it was observed that EtOH-W (60:40, v v−1), EtOH-W (70:30, v v−1), EtOH-W (80:20, v v−1), and EtOH-W (90:10, v v−1) green solvent mixtures presented a poor spectrodensitogram of HSP with a high As value (As = 1.19). While, the EtOH-W (50:50, v v−1) green solvent mixtures had shown to present a well-separated spectrodensitogram of HSP at Rf = 0.73 ± 0.03 with an acceptable As value (As = 1.05) as shown in Figure 2.
Accordingly, the EtOH-W (50:50, v v−1) combination was chosen as the final mobile phase for the quantitative estimation of HSP in TE and UBE of four different varieties of citrus fruit peels and two different commercial formulations. The spectrodensitograms for the sustainable RP-HPTLC assay were recorded densitometrically and the maximum chromatography response was recorded at 287 nm for the sustainable RP-HPTLC assay. Accordingly, the entire analyses of HSP were carried out at 287 nm.

3.2. Validation Studies

The sustainable RP-HPTLC assay for the quantitative estimation of HSP was validated for “linearity range, system suitability parameters, accuracy, precision, robustness, sensitivity, and peak purity/specificity” according to the ICH guidelines [38]. The results for the linear regression analysis of the calibration plot of HSP for the sustainable RP-HPTLC assay are listed in Table 1. The HSP calibration plot was linear in 20–2000 ng band−1 range for the sustainable RP-HPTLC assay. The value of “determination coefficient (R2)” for HSP was determined as 0.9997 for the sustainable RP-HPTLC assay. These results indicated good linearity between the HSP concentration and its HPTLC area.
The parameters for the system suitability of the sustainable RP-HPTLC assay were studied and results are listed in Table 2. The “Rf, As, and N m−1” for the sustainable RP-HPTLC assay were determined as 0.73 ± 0.03, 1.05 ± 0.04, and 5154 ± 3.11, respectively. These data suggested that the sustainable RP-HPTLC assay was suitable for the quantitative estimation of HSP in TE and UBE of four different varieties of citrus fruit peels and two different commercial formulations.
The results for the accuracy determination for the sustainable RP-HPTLC assay are shown in Table 3. The % recovery of HSP for the sustainable RP-HPTLC assay was determined as 101.73%, 101.30%, and 99.21% at LQC, MQC, and HQC, respectively. The high values of % recoveries suggested the accuracy of the sustainable RP-HPTLC assay for the quantitative estimation of HSP in TE and UBE of four different varieties of citrus fruit peels and two different commercial formulations.
The precision for the sustainable RP-HPTLC assay was evaluated in terms of the percent of the coefficient of variation (% CV) and results listed in Table 4. The % CVs of HSP for the sustainable RP-HPTLC assay were determined as 0.73%, 0.47%, and 0.32% at LQC, MQC, and HQC, respectively for the intraday precision. The % CVs of HSP for the sustainable RP-HPTLC assay were estimated as 0.80%, 0.49%, and 0.36% at LQC, MQC and HQC, respectively for the interday precision. The low values of % CV suggested the precision of the sustainable RP-HPTLC assay for the quantitative estimation of HSP in TE and UBE of four different varieties of citrus fruit peels and two different commercial formulations.
The resulting data of the robustness evaluation for the sustainable RP-HPTLC assay are listed in Table 5. The % CVs for the robustness evaluation were recorded as 0.57–0.62% for the sustainable RP-HPTLC assay. The Rf values of HSP were recorded in 0.72–0.74 range for the sustainable RP-HPTLC assay. The narrow variations in the Rf values of HSP and low % CVs suggested the robustness of the sustainable RP-HPTLC assay for the quantitative analysis of HSP in TE and UBE of four different varieties of citrus fruit peels and two different commercial formulations.
The sensitivity for the sustainable RP-HPTLC assay was determined as “LOD and LOQ” and their data are listed in Table 1. The “LOD and LOQ” for the sustainable RP-HPTLC assay were estimated as 7.02 ± 0.28 and 21.06 ± 0.84 ng band−1, respectively for the quantitative analysis of HSP. These data of “LOD and LOQ” for the sustainable RP-HPTLC assay suggested the sensitivity of the sustainable RP-HPTLC assay for the quantitative analysis of HSP in TE and UBE of four different varieties of citrus fruit peels and two different commercial formulations.
The peak purity/specificity for the sustainable RP-HPTLC assay was determined by comparing the overlaid spectrodensitograms of HSP in four different varieties of citrus fruits and two different commercial formulations with those of pure HSP. The overlaid spectrodensitograms of pure HSP and HSP in four different varieties of citrus fruits and two different commercial formulations are summarized in Figure 3. The maximum chromatography response for HSP in pure HSP and four different varieties of citrus fruits and two different commercial formulations was recorded at 287 nm for the sustainable RP-HPTLC assay. The identical spectrodensitograms, Rf values, and wavelength of HSP in pure HSP, four different varieties of citrus fruits and two different commercial formulations indicated the peak purity/specificity for the sustainable RP-HPTLC assay.

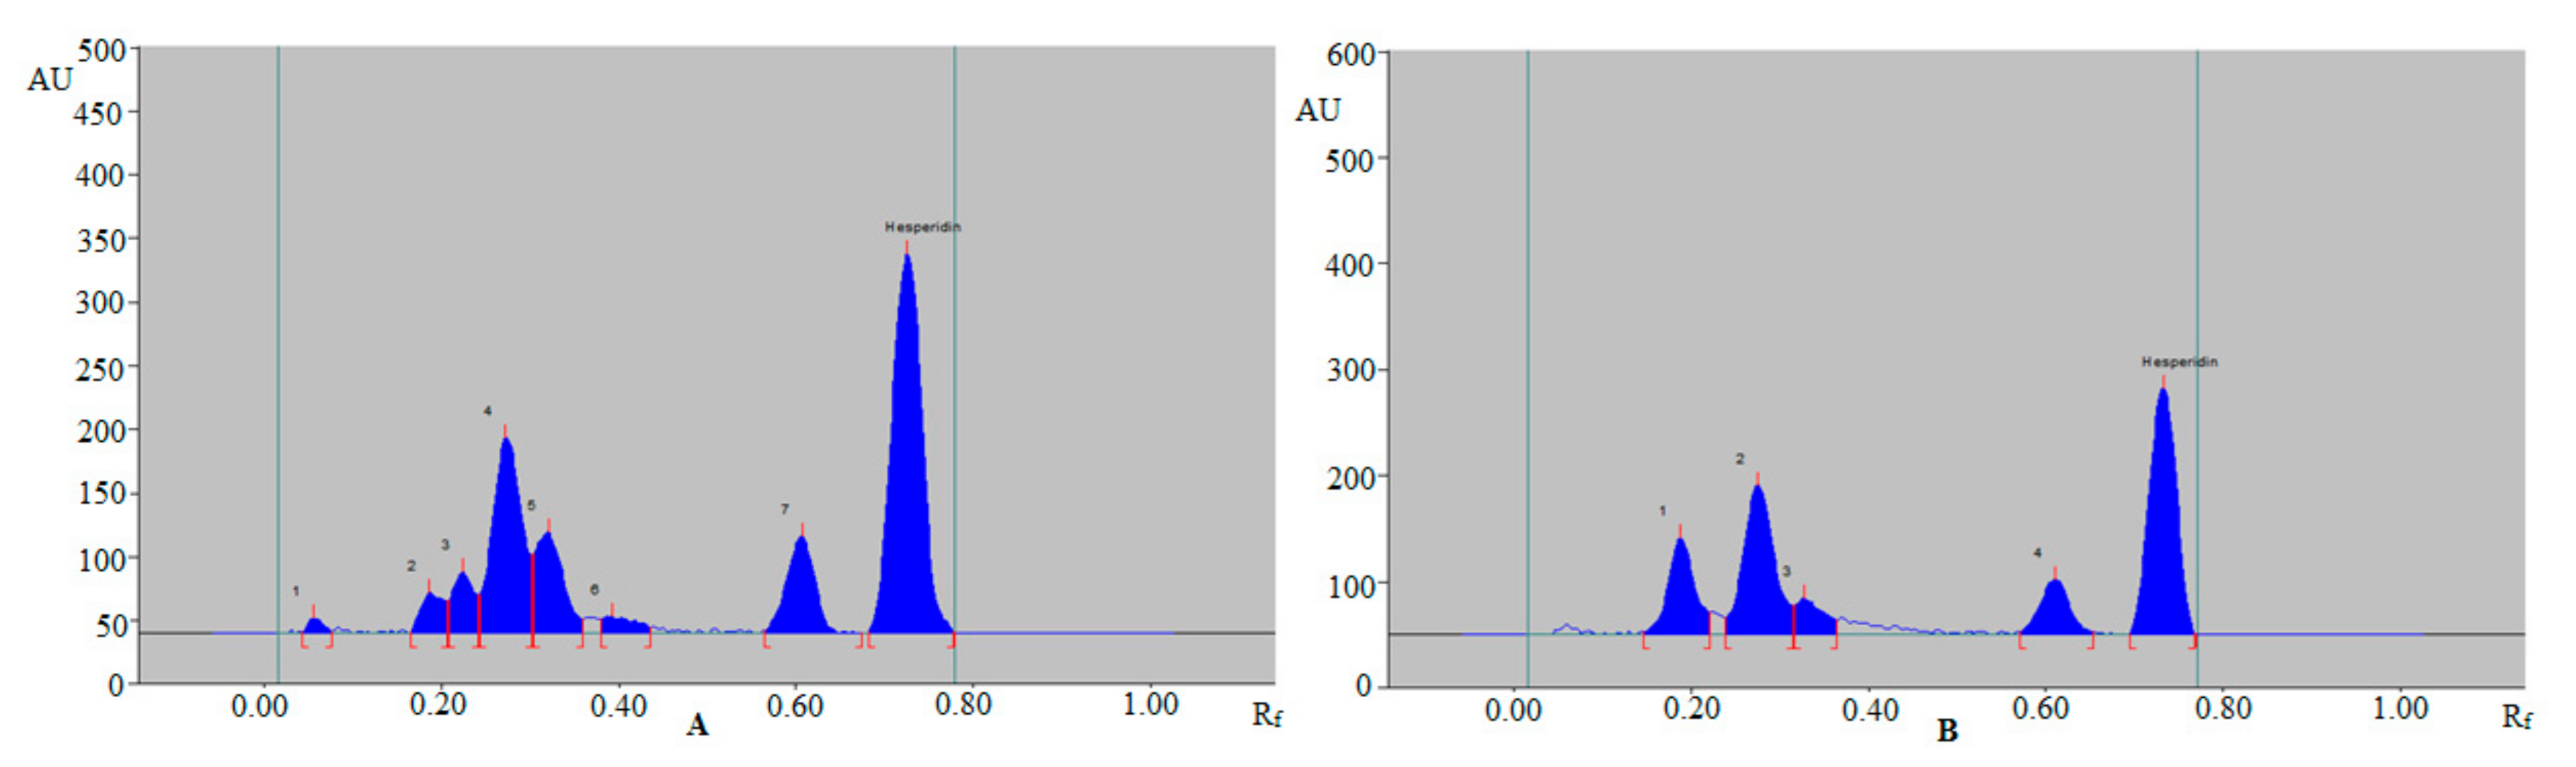
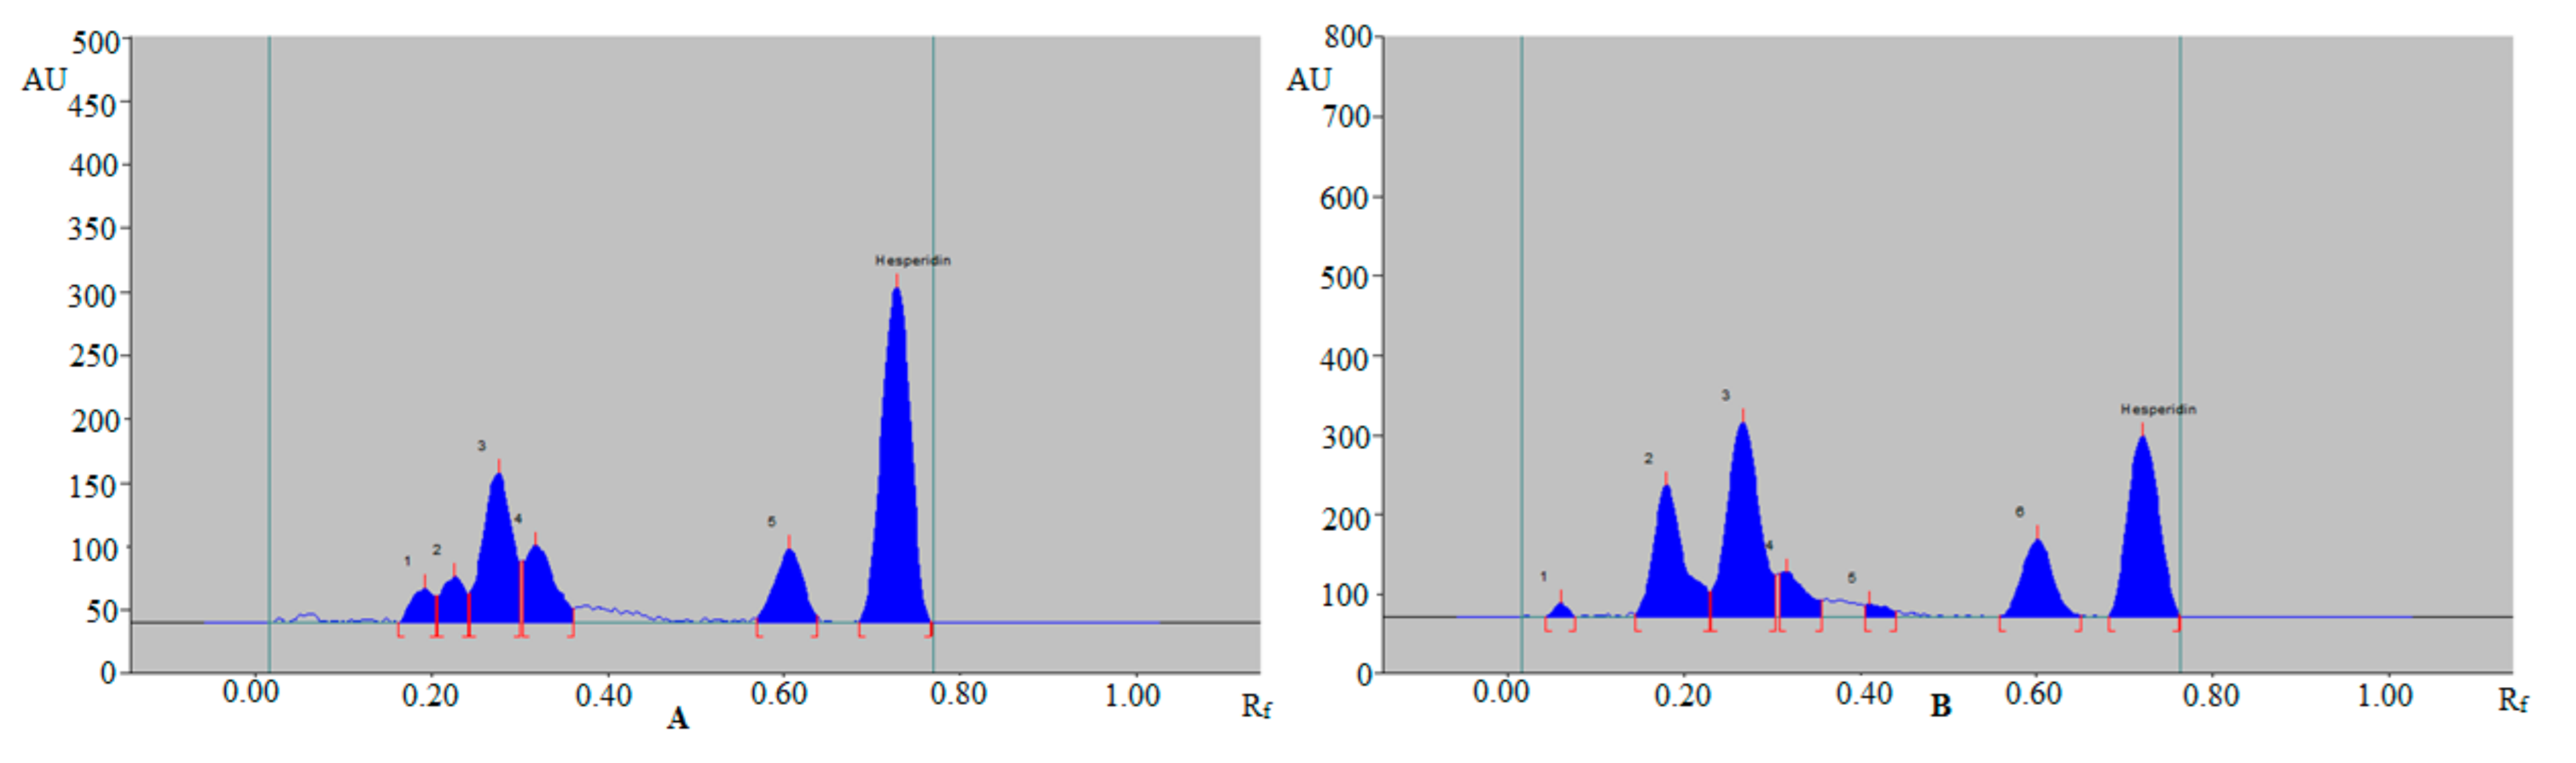
3.3. Application of Sustainable RP-HPTLC Assay for Quantitative Estimation of HSP in Various TE and UBE of Different Varieties of Citrus Fruit Peels and Commercial Formulations

The sustainable RP-HPTLC assay could be an alternative of conventional analytical methods for the quantitative analysis of HSP in TE and UBE of four different varieties of citrus fruit peels and two different commercial formulations. The spectrodensitometry peaks of HSP from TE and UBE of four different varieties of citrus fruit peels and two different commercial formulations were identified by comparing their single TLC spot at Rf = 0.73 ± 0.03 with those of a pure HSP for the sustainable RP-HPTLC assay. The representative spectrodensitogram of HSP in TE of grapefruit peels and lemon peels is presented in Figure 4. The spectrodensitogram for HSP in grapefruit peels (Figure 4A) and lemon peels (Figure 4B) presented the identical peaks of HSP with those of pure HSP for the sustainable RP-HPTLC assay.
The representative spectrodensitogram of HSP in TE of mosambi peels and orange peels is presented in Figure 5. The spectrodensitogram for HSP in mosambi peels (Figure 5A) and orange peels (Figure 5B) also presented the identical peaks of HSP with those of pure HSP for the sustainable RP-HPTLC assay.
The representative spectrodensitogram of HSP in TE of commercial formulation A and commercial formulation B is presented in Figure 6. The spectrodensitogram for HSP in commercial formulation A (Figure 6A) and commercial formulation B (Figure 6B) also showed the identical peaks of HSP with those of pure HSP for the sustainable RP-HPTLC assay. In addition, some additional peaks were also recorded in spectrodensitograms of TE of four different varieties of citrus fruit peels and two different commercial formulations, suggesting the specificity of the sustainable RP-HPTLC assay for the quantitative estimation of HSP in the presence of excipients/impurities. Due to this observation, it is expected that the sustainable RP-HPTLC assay could be able to separate the potential degradation products of HSP.
The content (% w w−1) of HSP in TE and UBE of four different varieties of citrus fruit peels and two different tablet dosage forms was obtained from the calibration plot of HSP and resulting data are shown in Table 6. The content of HSP in TE of grapefruit peels, mosambi peels, lemon peels, and orange peels was detected as 8.26 ± 0.42, 6.94 ± 0.33, 5.90 ± 0.31, and 6.81 ± 0.28% w w−1, respectively. The content of HSP in TE of commercial formulations A and B was detected as 5.31 ± 0.25 and 5.55 ± 0.27% w w−1, respectively. However, the content of HSP in UBE of grapefruit peels, mosambi peels, lemon peels, and orange peels was detected as 11.41 ± 0.51, 8.86 ± 0.48, 7.98 ± 0.45, and 8.64 ± 0.50% w w−1, respectively. The content of HSP in UBE of commercial formulations A and B was detected as 6.72 ± 0.35 and 6.92 ± 0.38% w w−1, respectively. The content of HSP was recorded maximum in TE and UBE of grapefruit peels compared to the other citrus fruit peels and commercial formulations. Generally, the content of HSP was significantly higher in UBE of all four different varieties of citrus fruit peels and two different commercial formulations compared to their TE (p < 0.05). Based on these data and results, the UBE procedure for the extraction of HSP in four different varieties of citrus fruit peels and two different commercial formulations has been proposed as superior over its TE procedure.
Overall, these results suggested that the sustainable RP-HPTLC assay can be efficiently used for the quantitative estimation of HSP in the wide variety of food and pharmaceutical products having HSP as one of the phytoconstituents.

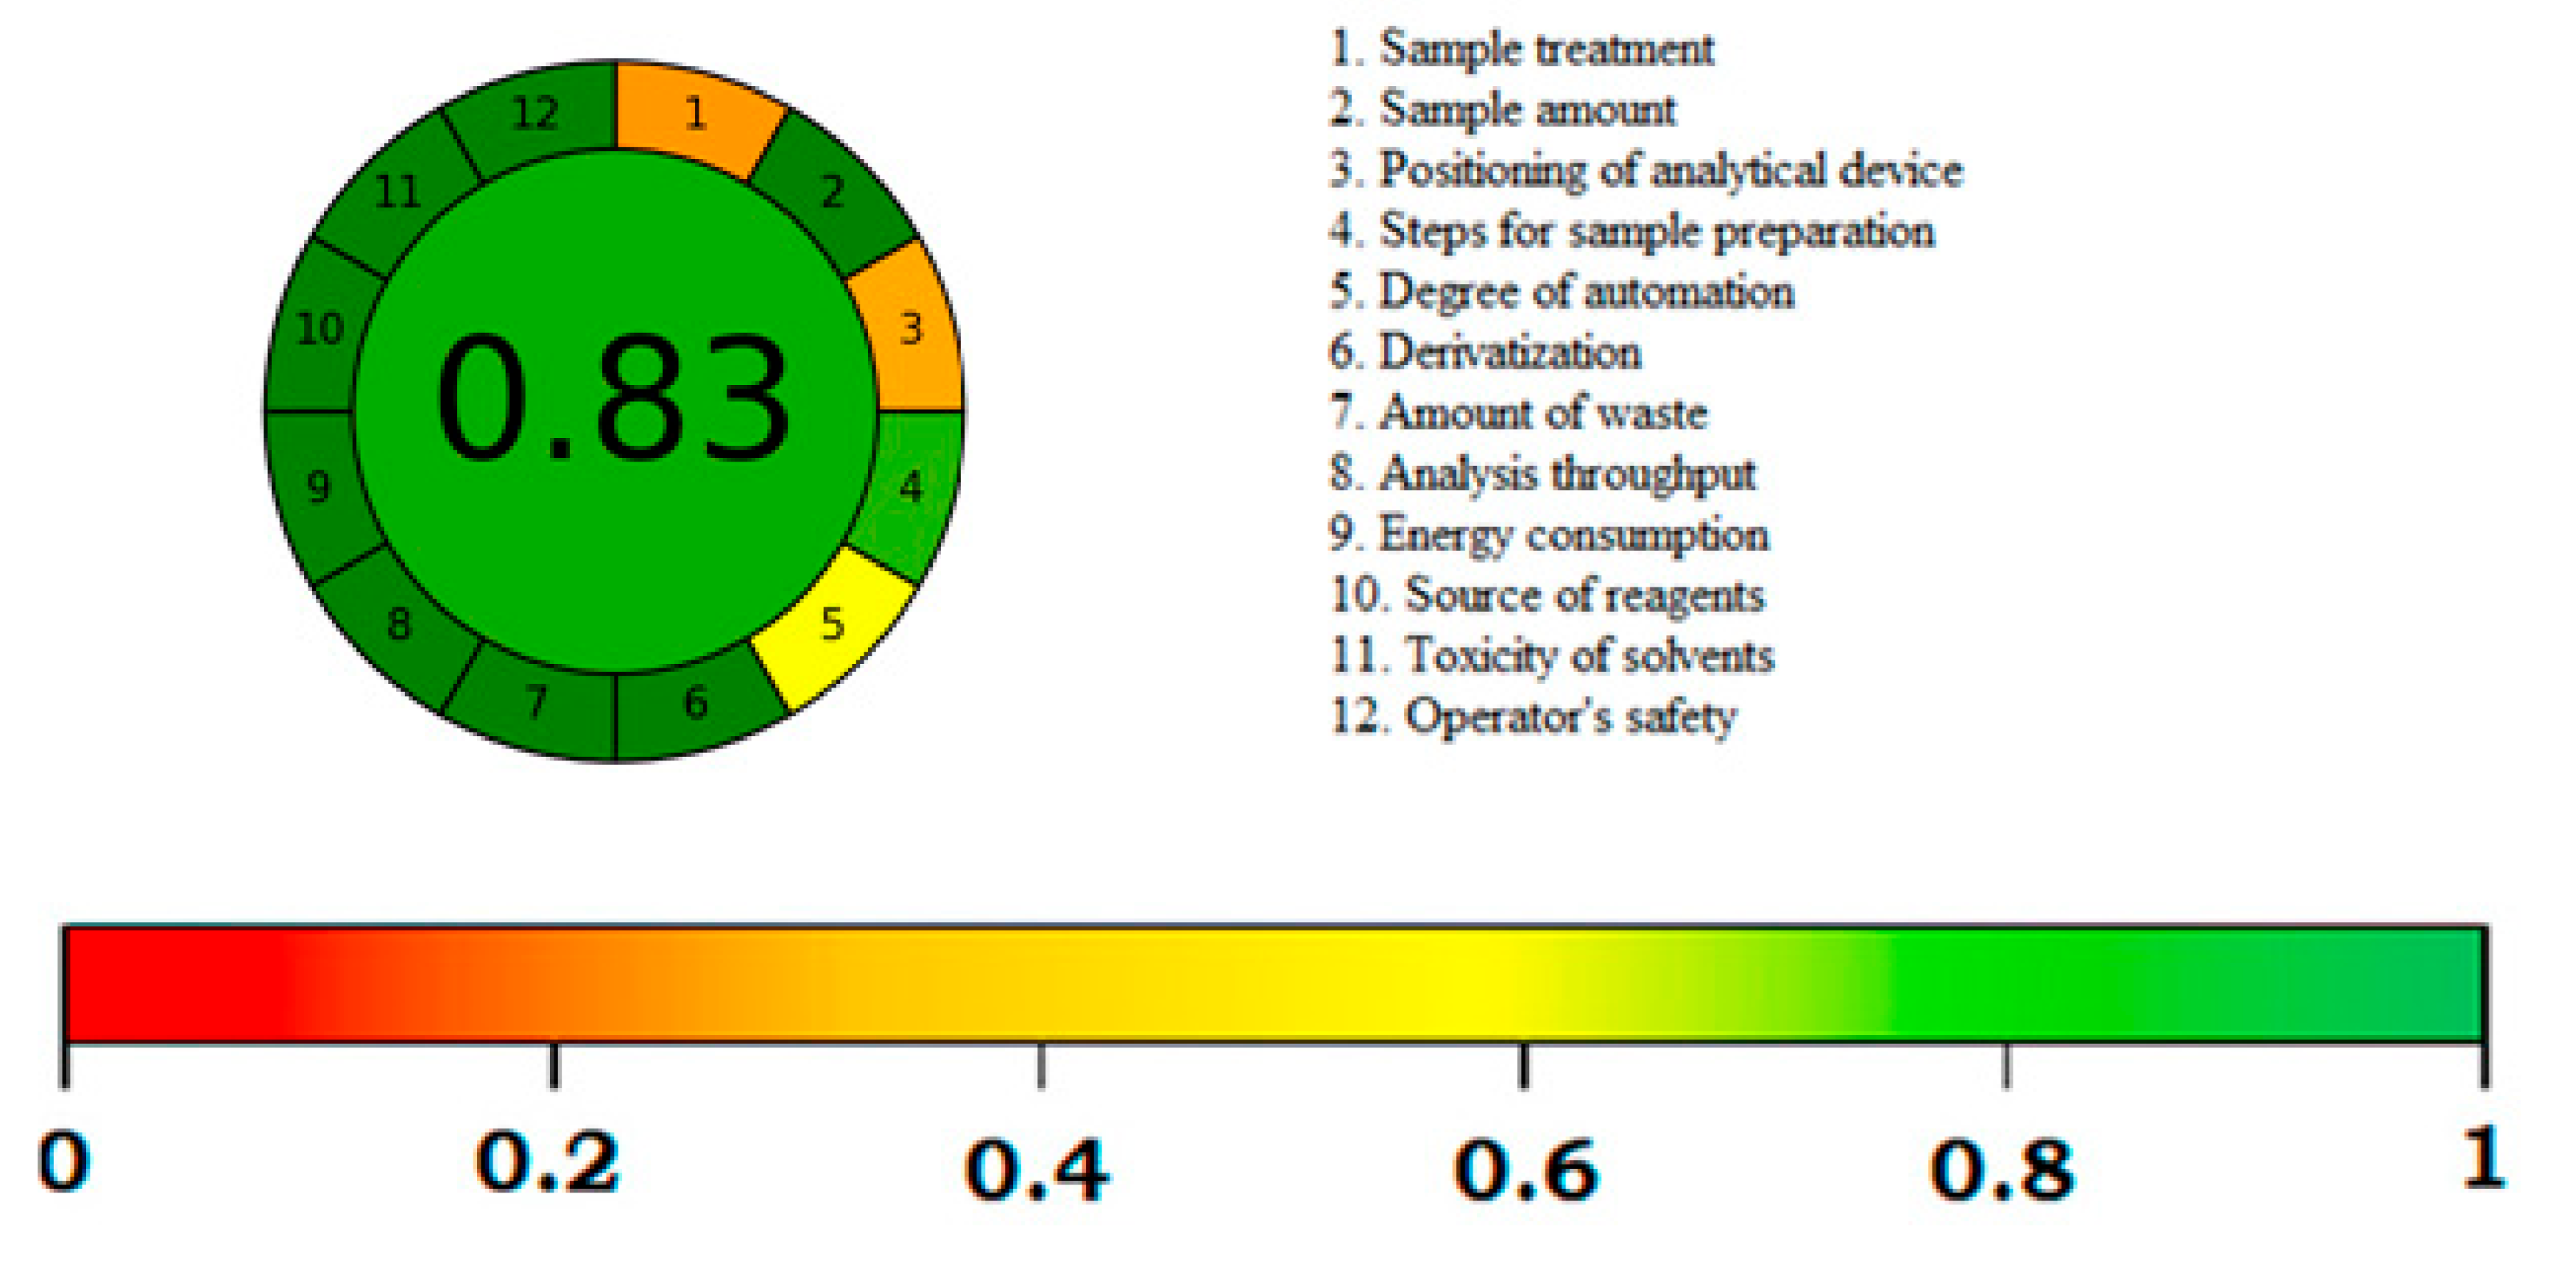
3.4. Greenness Assessment

Various metric approaches are used for the greenness assessment of the analytical techniques [32,33,34,35,36,37]. Nevertheless, only AGREE metric approach uses all 12 principles of GAC for this purpose [36]. Accordingly, the greenness profile of the sustainable RP-HPTLC assay was assessed using “AGREE: The Analytical Greenness Calculator (version 0.5, Gdansk University of Technology, Gdansk, Poland, 2020)”. The predicted AGREE score with respect to 12 different principles of GAC for the sustainable RP-HPTLC assay is summarized in Figure 7. The AGREE score for the sustainable RP-HPTLC assay was predicted as 0.83, suggesting the excellent green analytical assay for the quantitative analysis of HSP.

3.5. Comparison with Reported Analytical Methods

The sustainable RP-HPTLC assay for the quantitative estimation of HSP was compared with reported analytical assays. The results for comparison are listed in Table 7. Various parameters like as “linearity, accuracy, and precision” of the sustainable RP-HPTLC assay were compared with reported analytical assays. The linearity range and accuracy of a literature HPLC assay have been reported as 20–100 µg mL−1 and 89.70–107.00%, respectively, which were much inferior to sustainable RP-HPTLC assay (linearity range = 20–2000 ng band−1 and accuracy = 99.21–101.73%) [16]. However, the precision of reported HPLC assay was comparable to the sustainable RP-HPTLC assay [16].
The linearity range, accuracy, and precision of a literature LC-MS assay have been reported as 0.25–2.50 µg mL−1, 89.10–114.90%, and 4.40–8.70%, respectively, which were also much inferior to sustainable RP-HPTLC assay [20]. The linearity range of a reported spectrophotometry method has been reported as 5.00–50.00 µg mL−1, which was inferior to the sustainable RP-HPTLC assay [12]. However, the accuracy and precision of this method were within the limit of ICH guidelines and hence similar to the sustainable RP-HPTLC method [12]. The linearity range and accuracy of a reported fluorimetry method were also inferior to the sustainable RP-HPTLC assay, but its precision was within the limit of ICH guidelines [27]. The linearity range of a reported normal-phase HPTLC assay has been reported as 100–800 ng band−1, which was also inferior to the sustainable RP-HPTLC assay [28]. However, the accuracy and precision of this method were within the limit of ICH guidelines [28]. Overall, the sustainable RP-HPTLC assay for HSP analysis was found to be superior over all reported analytical assays.

4. Conclusions

The sustainable RP-HPTLC assay has been established for the quantitative estimation of HSP in TE and UBE of four different varieties of citrus fruit peels and two different tablet dosage forms. The sustainable RP-HPTLC assay was found to be highly-sensitive, rapid, accurate, precise, robust, and sustainable for the quantification of HSP. The contents of HSP were found significantly higher in UBE of four different varieties of citrus fruit peels and two different commercial formulations compared to their TE. Therefore, UBE-based procedure has been considered as the preferred procedure for the extraction of HSP from citrus fruit peels and commercial formulations. The sustainable RP-HPTLC assay was found to be superior over all reported analytical assays for the quantitative analysis of HSP. The recorded AGREE score for the sustainable RP- HPTLC assay indicated the excellent greenness profile for pharmaceutical analysis of HSP. These observation and results suggested that the sustainable RP-HPTLC assay can be used for the quantitative estimation of HSP in the wide range of food, pharmaceutical, and plant-based products.

Author Contributions

Conceptualization, A.I.F. and S.A.; methodology, P.A., M.H.A., A.I.F. and F.S.; software, F.S.; validation, S.A. and M.S.A.-K.; formal analysis, M.H.A.; investigation, P.A. and A.I.F.; resources, S.A.; data curation, M.H.A.; writing—original draft preparation, F.S.; writing—review and editing, S.A., P.A. and A.I.F.; visualization, M.S.A.-K.; supervision, S.A. and A.I.F.; project administration, S.A.; funding acquisition, S.A. All authors have read and agreed to the published version of the manuscript.

Funding

This research was funded by the Researchers Supporting Project (number RSP-2021/146) at King Saud University, Riyadh, Saudi Arabia. The APC was funded by RSP.

Data Availability Statement

This study did not report any data.

Acknowledgments

Authors are thankful to Researchers Supporting Project (number RSP-2021/146) at King Saud University, Riyadh, Saudi Arabia.

Conflicts of Interest

The authors declare no conflict of interest.

References

  1. Zhang, J. Flavonoids in grape fruit and commercial grape fruit juices: Concentration, distribution, and potential health benefits. Proc. Fla. State Hort. Soc. 2007, 120, 288–294. [Google Scholar]
  2. Jokic, S.; Safranko, S.; Jakovljevic, M.; Cikos, A.M.; Kajic, N.; Kolarevic, F.; Babic, J.; Molnar, M. Sustainable green procedure for extraction of hesperidin from selected Croatian mandarin peels. Processes 2019, 7, 469. [Google Scholar] [CrossRef] [Green Version]
  3. Moulehi, I.; Bourgou, S.; Ourghemmi, I.; Saidani Tounsi, M. Variety and ripening impact on phenolic composition and antioxidant activity of mandarin (Citrus reticulate Blanco) and bitter orange (Citrus aurantium L.) seeds extracts. Ind. Crop. Prod. 2012, 39, 74–80. [Google Scholar] [CrossRef]
  4. Hirata, A.; Murakami, Y.; Shoji, M.; Kadoma, Y.; Fujisawa, S. Kinetics of radical-scavenging activity of hesperetin and hesperidin and their inhibitory activity on COX-2 expression. Anticancer Res. 2005, 25, 3367–3374. [Google Scholar]
  5. Wilmsen, P.K.; Spada, D.S.; Salvador, M. Antioxidant activity of the flavonoid hesperidin in chemical and biological systems. J. Agric Food Chem. 2005, 15, 4757–4761. [Google Scholar] [CrossRef] [PubMed]
  6. Galati, E.M.; Monforte, M.T.; Kirjavainen, S.; Forestieri, A.M.; Trovato, A.; Tripodo, M.M. Biological effects of hesperidin, a citrus flavonoid. (Note I): Anti-inflammatory and analgesic activity. Farmaco 1994, 40, 709–712. [Google Scholar] [PubMed]
  7. Crespo, M.E.; Gálvez, J.; Cruz, T.; Ocete, M.A.; Zarzuelo, A. Anti-inflammatory activity of diosmin and hesperidin in rat colitis induced by TNBS. Planta Med. 1999, 65, 651–653. [Google Scholar] [CrossRef] [PubMed]
  8. Emim, J.A.; Oliveira, A.B.; Lapa, A.J. Pharmacological evaluation of the anti-inflammatory activity of a citrus bioflavonoid, hesperidin, and the isoflavonoids, duartin and claussesquinone, in rats and mice. J. Pharm. Pharmacol. 1994, 46, 118–122. [Google Scholar] [CrossRef]
  9. Lee, N.K.; Choi, S.H.; Park, S.H.; Park, E.K.; Kim, D.H. Antiallergic activity of hesperidin is activated by intestinal microflora. Pharmacology 2004, 71, 174–180. [Google Scholar] [CrossRef] [PubMed]
  10. Garg, A.; Garg, S.; Zaneveld, L.J.; Singla, A.K. Chemistry and pharmacology of the citrus bioflavonoid hesperidin. Phytother. Res. 2001, 15, 655–669. [Google Scholar] [CrossRef] [PubMed]
  11. Al-Ashaal, H.A.; El-Sheltawy, S.T. Antioxidant capacity of hesperidin from citrus peel using electron spin resonance and cytotoxic activity against human carcinoma cell lines. Pharm. Biol. 2011, 49, 276–282. [Google Scholar] [CrossRef]
  12. Srilatha, D.; Nasare, M.; Nagasandhya, B.; Prasad, V.; Diwan, P. Development and validation of spectrophotometric method for simultaneous estimation of hesperidin and diosmin in the pharmaceutical dosage form. ISRN Spectroscop. 2013, 2013, E534830. [Google Scholar] [CrossRef] [Green Version]
  13. Goren, R.; Monselise, S.P. Determination of hesperidin in dry matter of citrus tissues by ultra-violet spectrophotometry method. J. Assoc. Off. Agric. Chem. 1964, 47, 677–681. [Google Scholar]
  14. El-Shafae, A.M.; El-Domiaty, M.M. Improved LC methods for the determination of diosmin and/ or hesperidin in plant extracts and pharmaceutical formulations. J. Pharm. Biomed. Anal. 2001, 26, 539–545. [Google Scholar] [CrossRef]
  15. Ma, Y.; Ye, X.; Hao, Y.; Xu, G.; Xu, G.; Liu, D. Ultrasound-assisted extraction of hesperidin from penggan (Citrus reticuleta) peel. Ultrason. Sonochem. 2008, 15, 227–232. [Google Scholar] [CrossRef] [PubMed]
  16. Adham, A.N. Qualitative and quantitative estimation of hesperidin in peel and juice of citrus fruits by RP-HPLC method growing in Kurdistan region/Iraq. Int. J. Pharm. Sci. Rev. Res. 2015, 33, 220–224. [Google Scholar]
  17. Pereira, R.M.S.; Lopez, B.G.C.; Diniz, S.N.; Antunes, A.A.; Garcia, D.M.; Oliveira, C.R.; Marcucci, M.C. Quantification of flavonoids Brazilian orange peels and industrial orange juice processing wastes. Agric. Sci. 2017, 8, 631–644. [Google Scholar] [CrossRef] [Green Version]
  18. Mehmood, T.; Khan, M.R.; Shabbir, M.A.; Zia, M.A. Phytochemical profiling and HPLC quantification of citrus peel from different varieties. Prog. Nutr. 2017, 20, S279–S288. [Google Scholar]
  19. Al-Jaber, H.I.; Shakya, A.K.; Elagbar, Z.A. Phytochemical profiling of selected phenolic acids and flavonoids in Salvia eigii, Salvia heirosolymitana and Salvia viridis growing wild in Jordan and their in vitro antioxidant activity. PeerJ 2020, 8, E9769. [Google Scholar] [CrossRef]
  20. Tine, Y.; Yang, Y.; Renucci, F.; Costa, J.; Wele, A.; Paolini, J. LC-MS/MS analysis of flavonoid compounds from Zanthoxylum zanthoxyloids extracts and their antioxidant activities. Nat. Prod. Comm. 2017, 12, 1865–1868. [Google Scholar]
  21. Lee, J.T.; Pao, L.H.; Hsieh, C.D.; Huang, P.W.; Hu, H.Y.P. Development and validation of an LC-MS/MS method for simultaneous quantification of hesperidin and hesperetin in rat plasma for pharmacokinetic studies. Anal. Methods 2017, 9, 3329–3337. [Google Scholar] [CrossRef]
  22. Mandal, P.; Dan, S.; Chakraborty, S.; Ghosh, B.; Saha, C.; Khanam, J.; Pal, T.K. Simultaneous determination and quantitation of diosmetin and hesperetin in human plasma by liquid chromatographic mass spectrometry with an application to pharmacokinetic studies. J. Chromatogr. Sci. 2019, 57, 451–461. [Google Scholar] [CrossRef]
  23. Takiyama, M.; Matsumoto, T.; Watanabe, J. LC-MS/MS detection of citrus unshiu peel-derived flavonoids in the plasma and brain after oral administration of yokukansankachimpihange in rats. Xenobiotica 2019, 49, 1494–1503. [Google Scholar] [CrossRef]
  24. Araujo-Leon, J.A.; Ortiz-Andrade, R.; Vera-Sanchez, R.A.; Oney-Montalvo, J.E.; Coral-Martinez, T.I.; Cantillo-Ciau, Z. Development and optimization of a high sensitivity LC-MS/MS method for the determination of hesperidin and naringenin in rat plasma: Pharmacokinetic approach. Molecules 2020, 25, 4241. [Google Scholar] [CrossRef] [PubMed]
  25. Liu, S.; Jiang, Y.; Shan, M.; Yu, S.; Cheng, F.; Chen, P.; Bao, B.; Cao, Y.; Zhang, L.; Wu, Q. Simultaneous determination of three active flavonoids in rat plasma by HPLC-MS/MS: Application to a comparative pharmacokinetic investigation after oral administration Schizonepeta tenuifolia aqueous extract with and without its volatile oil. Acta Chroomatogr 2020. [CrossRef]
  26. Wang, W.; Zhao, L.; Huang, H.; Yao, J.; Zhou, L.; Wang, D.; Qiu, X. Development of an ultra-high performance liquid chromatography method for simultaneous determination of six active compounds in Fructus aurantii and rat plasma and its application to a comparative pharmacokinetic study in rats administered with different doses. J. Anal. Methods Chem. 2018, 2018, E7579136. [Google Scholar]
  27. Mohamed, D.; Tawakkol, S.M. Fluorimetric determination of diosmin and hesperidin in combined dosage forms and in plasma through complex formation with terbium. Bull. Fac. Pharm. Cairo Univ. 2013, 51, 81–88. [Google Scholar] [CrossRef] [Green Version]
  28. Alam, P.; Alam, A.; Anwer, M.K.; Alqasoumi, S.I. Quantitative estimation of hesperidin in different varieties of citrus peels. Asian Pac. J. Trop. Biomed. 2014, 4, 262–266. [Google Scholar] [CrossRef] [PubMed] [Green Version]
  29. Alam, P.; Shakeel, F.; Alqarni, M.H.; Foudah, A.I.; Faiyazuddin, M.; Alshehri, S. Rapid, sensitive, and sustainable reversed-phase HPTLC method in comparison to the normal-phase HPTLC for the determination of pterostilbene in capsule dosage form. Processes 2021, 9, 1305. [Google Scholar] [CrossRef]
  30. Alam, P.; Ezzeldin, E.; Iqbal, M.; Anwer, M.K.; Mostafa, G.A.E.; Alqarni, M.H.; Foudah, A.I.; Shakeel, F. Ecofriendly densitometric RP-HPTLC method for determination of rivaroxaban in nanoparticle formulations using green solvents. RSC Adv. 2020, 10, 2133–2140. [Google Scholar] [CrossRef] [Green Version]
  31. Alam, P.; Iqbal, M.; Ezzeldin, E.; Khalil, N.Y.; Foudah, A.I.; Alqarni, M.H.; Shakeel, F. Simple and accurate HPTLC-densitometry method for quantification of delafloxacin (a novel fluoroquinolone antibiotic) in plasma samples: Application to pharmacokinetic study in rats. Antibiotics 2020, 9, 134. [Google Scholar] [CrossRef] [Green Version]
  32. Ibrahim, F.A.; Elmansi, H.; Fathy, M.E. Green RP-HPLC method for simultaneous determination of moxifloxacin combinations: Investigation of the greenness for the proposed method. Microchem. J. 2019, 148, 151–161. [Google Scholar] [CrossRef]
  33. Abou-Taleb, N.H.; Al-Enany, N.M.; El-Sherbiny, D.T.; El-Subbagh, H.I. Digitally enhanced thin layer chromatography for simultaneous determination of norfloxacin tinidazole with the aid of Taguchi orthogonal array and desirability function approach: Greenness assessment by analytical eco-scale. J. Sep. Sci. 2020, 43, 1195–1202. [Google Scholar] [CrossRef]
  34. Abdelrahman, M.M.; Abdelwahab, N.S.; Hegazy, M.A.; Fares, M.Y.; El-Sayed, G.M. Determination of the abused intravenously administered madness drops (tropicamide) by liquid chromatography in rat plasma; an application to pharmacokinetic study and greenness profile assessment. Microchem. J. 2020, 159, E105582. [Google Scholar] [CrossRef]
  35. Duan, X.; Liu, X.; Dong, Y.; Yang, J.; Zhang, J.; He, S.; Yang, F.; Wang, Z.; Dong, Y. A green HPLC method for determination of nine sulfonamides in milk and beef, and its greenness assessment with analytical eco-scale and greenness profile. J. AOAC Int. 2020, 103, 1181–1189. [Google Scholar] [CrossRef] [PubMed]
  36. Pena-Pereira, F.; Wojnowski, W.; Tobiszewski, M. AGREE-Analytical GREEnness metric approach and software. Anal. Chem. 2020, 92, 10076–10082. [Google Scholar] [CrossRef] [PubMed]
  37. Nowak, P.M.; Koscielniak, P. What color is your method? Adaptation of the RGB additive color model to analytical method evaluation. Anal. Chem. 2019, 91, 10343–10352. [Google Scholar] [CrossRef]
  38. Guideline, I.H.T. Validation of Analytical Procedures–Text and Methodology. In Proceedings of the International Conference on Harmonization (ICH), Q2 (R1), Geneva, Switzerland, 11–13 October 2005. [Google Scholar]
  39. Foudah, A.I.; Shakeel, F.; Alqarni, M.H.; Alam, P. A rapid and sensitive stability-indicating RP-HPTLC method for the quantitation of flibanserin compared to green NP-HPTLC method: Validation studies and greenness assessment. Microchem. J. 2021, 164, E105960. [Google Scholar] [CrossRef]
Figure 1. Thin-layer chromatography (TLC)-chromoplate of standard hesperidin (HSP), citrus peel extracts, and commercial tablets developed using EtOH-W (50:50, v v−1) as the mobile phase for a sustainable “reversed-phase high-performance thin-layer chromatography (RP-HPTLC)” assay.
Agronomy 11 01744 g001
Figure 2. Representative spectrodensitogram of standard HSP for the sustainable RP-HPTLC method.
Agronomy 11 01744 g002
Figure 3. Overlaid spectrodensitograms of (A) standard HSP, (B) grapefruit peels, (C) lemon peels, (D) mosambi peels, (E) orange peels, (F) commercial formulations A, and (G) commercial formulations B.
Agronomy 11 01744 g003
Figure 4. Spectrodensitograms of HSP in methanolic extract of (A) grapefruit peels and (B) lemon feels obtained using RP-HPTLC method.
Agronomy 11 01744 g004
Figure 5. Spectrodensitograms of HSP in methanolic extract of (A) mosambi peels and (B) orange peels obtained using RP-HPTLC method.
Agronomy 11 01744 g005
Figure 6. Spectrodensitograms of HSP in methanolic extract of (A) commercial formulation A and (B) commercial formulation B obtained using RP-HPTLC method.
Agronomy 11 01744 g006
Figure 7. Analytical GREEnness (AGREE) score for the sustainable RP-HPTLC method.
Agronomy 11 01744 g007
Table 1. Results for the regression analysis for the quantitative analysis of hesperidin (HSP) using a sustainable “reversed-phase high-performance thin-layer chromatography (RP-HPTLC)” method (mean ± SD; n = 6).
ParametersValues
Linearity range (ng band−1)20–2000
Regression equationy = 34.463x − 112.940
R20.9995
Slope ± SD34.463 ± 1.870
Intercept ± SD112.940 ± 4.420
Standard error of slope0.76
Standard error of intercept1.80
95% confidence interval of slope31.17–37.74
95% confidence interval of intercept105.17–120.70
LOD ± SD (ng band−1)7.02 ± 0.28
LOQ ± SD (ng band−1)21.06 ± 0.84
Table 2. System suitability parameters, including retardation factor (Rf), asymmetry factor (As), and number of theoretical plates per meter (N m−1) of HSP for a sustainable RP-HPTLC method (mean ± SD; n = 3).
ParametersValue
Rf0.73 ± 0.03
As1.05 ± 0.04
N m−15154 ± 3.11
Table 3. Evaluation of accuracy of HSP for a sustainable RP-HPTLC method (mean ± SD; n = 6).
Conc. (ng band−1)Conc. Found (ng band−1) ± SDRecovery (%)CV (%)
6061.04 ± 0.51101.730.83
800810.42 ± 4.13101.300.50
20001984.31 ± 6.6299.210.33
Table 4. Evaluation of intra/inter-day precision of HSP for a sustainable RP-HPTLC assay (mean ± SD; n = 6).
Conc.
(ng band−1)
Intraday PrecisionInterday Precision
Conc. (ng band−1) ± SDStandard ErrorCV (%)Conc. (ng band−1) ± SDStandard ErrorCV (%)
6058.84 ± 0.430.170.7359.54 ± 0.480.190.80
800794.81 ± 3.811.550.47812.41 ± 4.021.640.49
20002016.15 ± 6.612.690.321983.54 ± 7.172.920.36
Table 5. Results of robustness evaluation for HSP for a sustainable RP-HPTLC assay (mean ± SD; n = 6).
Conc.
(ng band−1)
Mobile Phase Composition (Ethanol/Water)Results
OriginalUsedLevelConc. (ng band−1) ± SD% CVRf
52:48+2.0784.18 ± 4.510.570.72
80050:5050:500.0804.54 ± 4.730.580.73
48:52−2.0821.34 ± 5.100.620.74
Table 6. Application of a sustainable RP-HPTLC method for the quantitative estimation of HSP in TE and UBE of four different varieties of citrus fruit peels and commercial formulations (mean ± SD; n = 3).
SamplesTraditional ExtractionUltrasound-Based Extraction
Amount of HSP (% w w−1)
Grapefruit peels (Citrus paradise)8.26 ± 0.4211.41 ± 0.51
Mosambi peels (Citrus limetta)6.94 ± 0.338.86 ± 0.48
Lemon peels (Citrus lemon)5.90 ± 0.317.98 ± 0.45
Orange peels (Citrus sinensis)6.81 ± 0.288.64 ± 0.50
Formulation A5.31 ± 0.256.72 ± 0.35
Formulation A5.55 ± 0.276.92 ± 0.38
Table 7. Comparative evaluation of the present RP-HPTLC assay with reported analytical assays for the quantitative analysis of HSP.
Analytical MethodLinearity RangeAccuracy (% Recovery)Precision (% CV)Ref.
HPLC20–100 (µg mL−1)89.70–107.000.44–1.80 [16]
LC-MS0.25–2.50 (µg mL−1)89.10–114.904.40–8.70 [20]
Spectrophotometry5.00–50.00 (µg mL−1)98.66–101.000.05–0.21[12]
Fluorimetry3.86 × 10−6–1.64 × 10⁻⁵ (mol)97.04–98.340.48–0.71[27]
Normal-phase HPTLC100–800 (ng band−1)98.55–99.380.76–1.20 [28]
RP-HPTLC20–2000 (ng band−1)99.21–101.730.32–0.80Present work
Publisher’s Note: MDPI stays neutral with regard to jurisdictional claims in published maps and institutional affiliations.

