
Modeling Natural Light Availability in Skyscraper Farms


Abstract
:1. Introduction and Literature Review
2. Materials and Methods
2.1. Overview
2.2. Model Descriptions
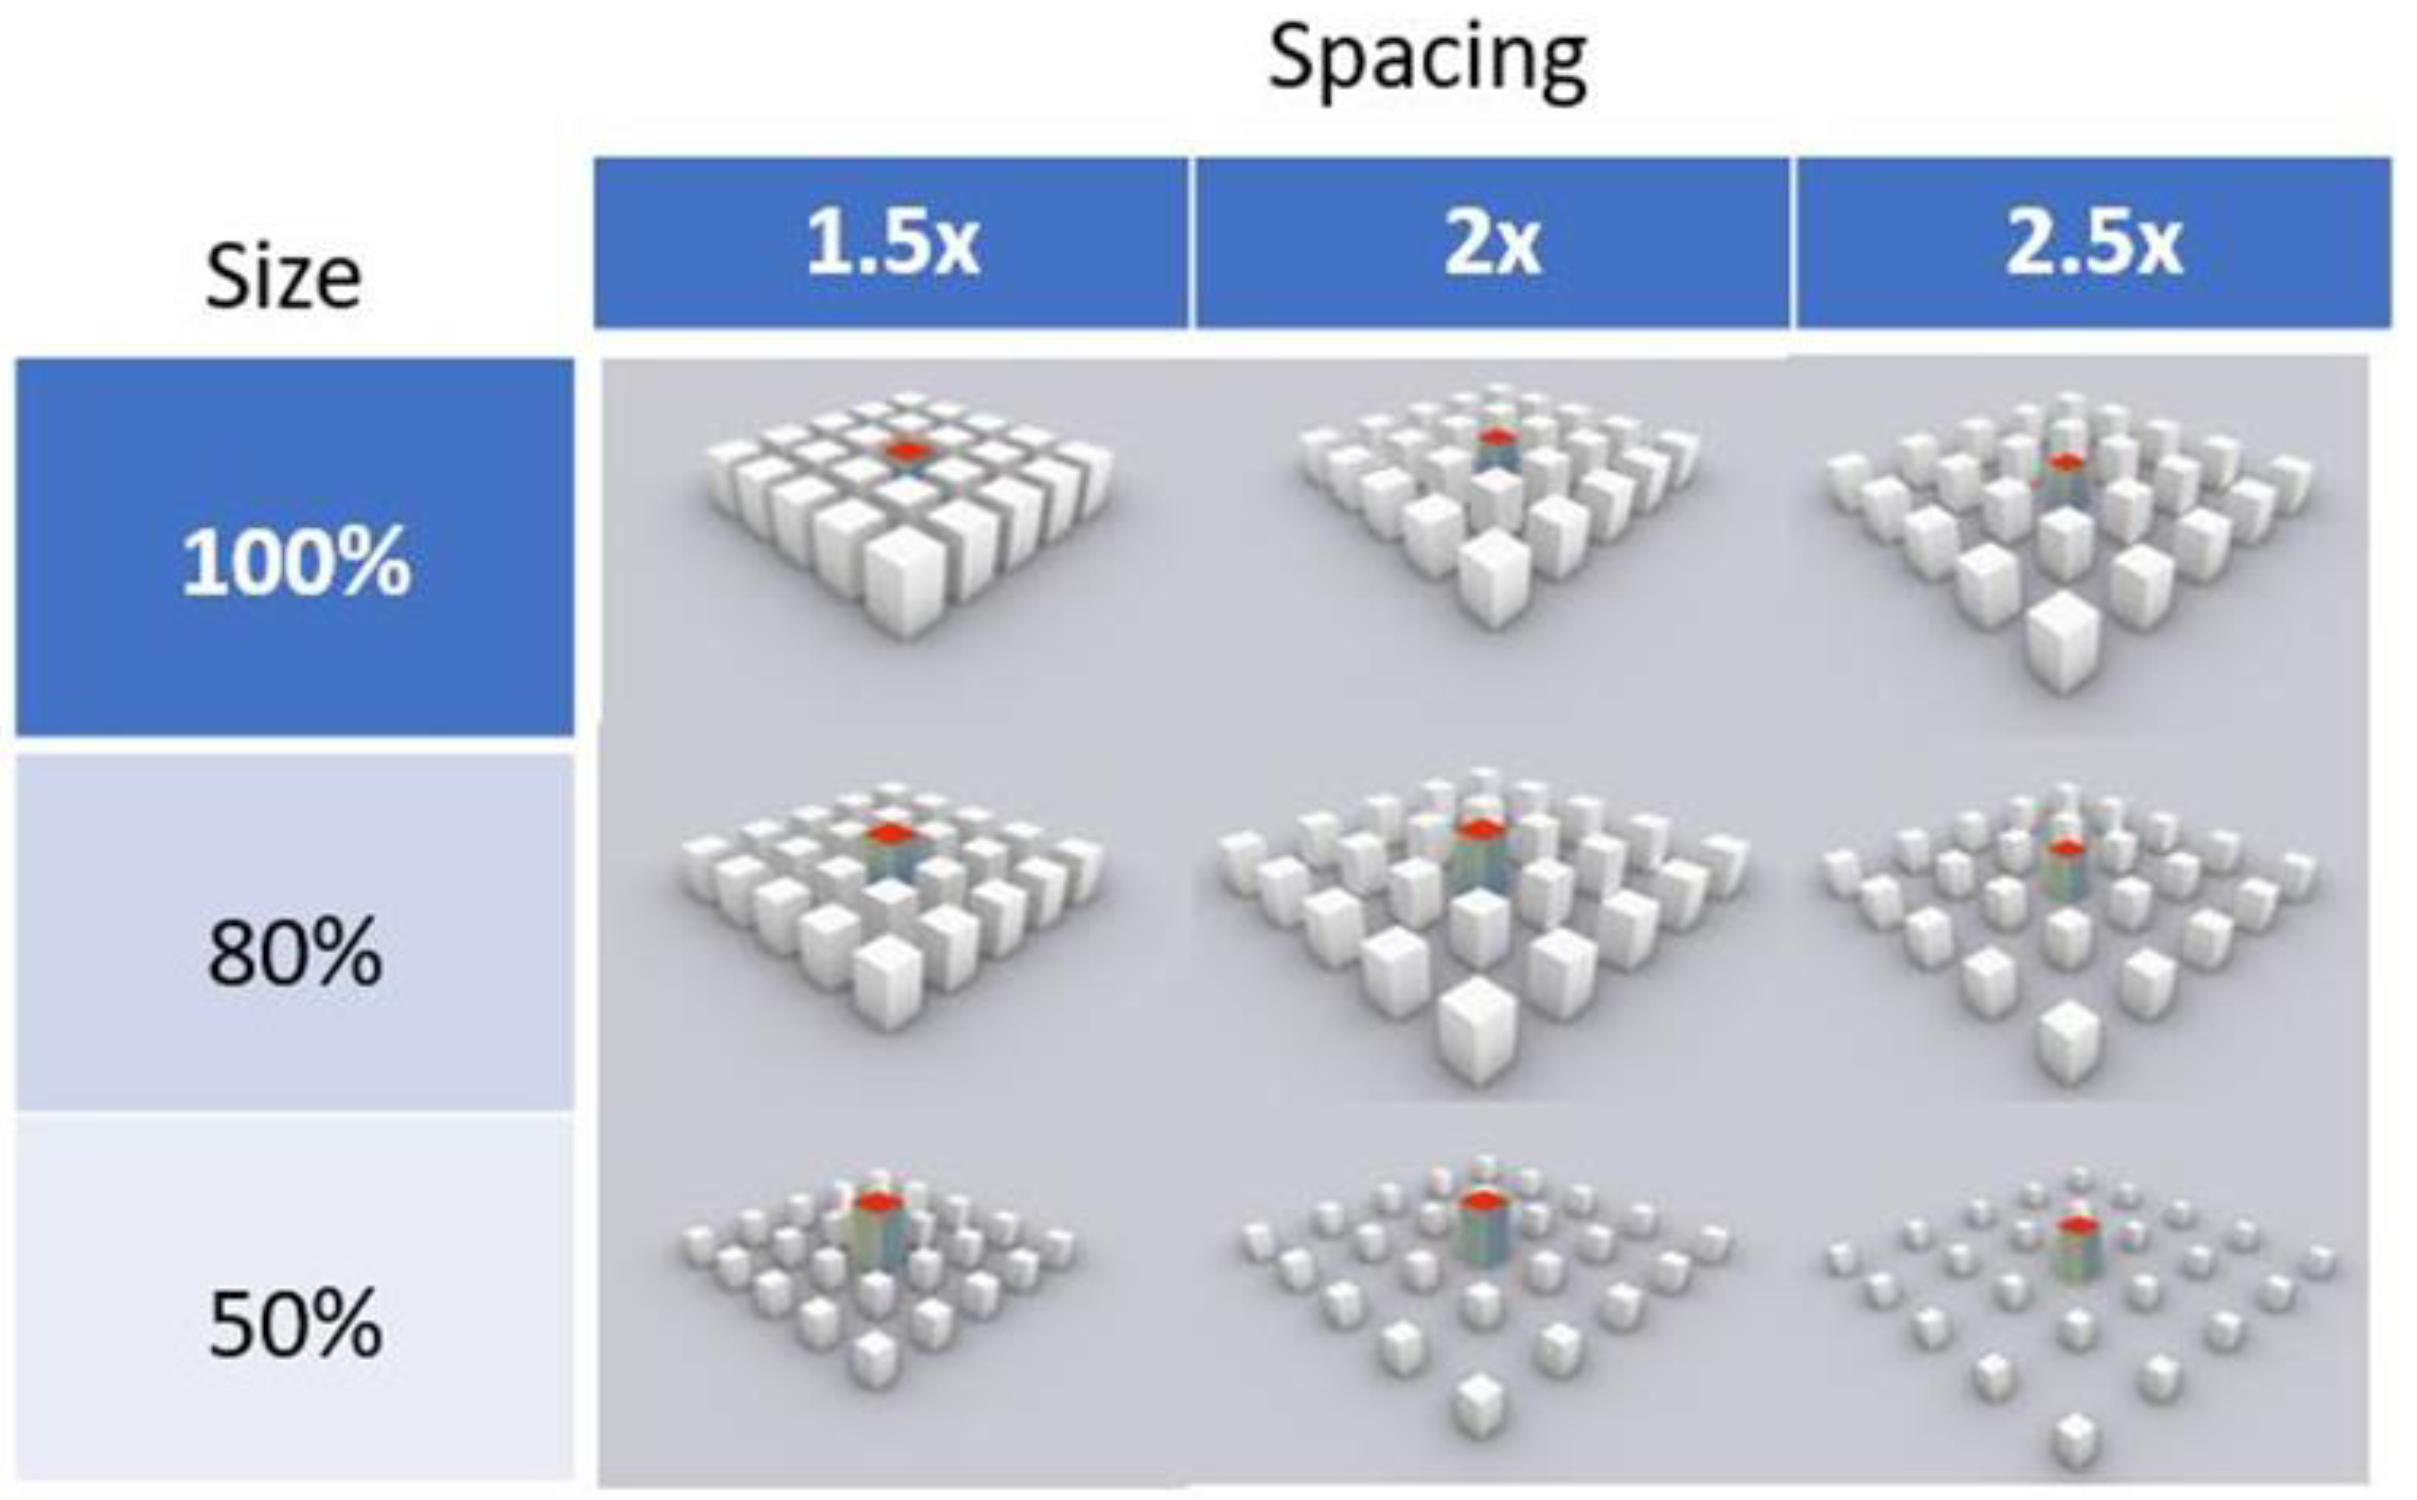
2.2.1. Skyscraper Farm in a Field
2.2.2. Skyscraper Farm in a City
2.3. Calculation of Natural Light Availability
2.4. Calculation of Energy Consumption
3. Results and Discussion
3.1. Skyscraper Farm in a Field
3.2. Skyscraper Farm in a City
4. Conclusions
Author Contributions
Funding
Institutional Review Board Statement
Informed Consent Statement
Data Availability Statement
Conflicts of Interest
References
- UN. World Urbanization Prospects: The 2018 Revision; UN: New York, NY, USA, 2019; ISBN 978-92-1-148319-2. [Google Scholar]
- Gómez, C.; Currey, C.J.; Dickson, R.W.; Kim, H.-J.; Hernández, R.; Sabeh, N.C.; Raudales, R.E.; Brumfield, R.G.; Laury-Shaw, A.; Wilke, A.K.; et al. Controlled Environment Food Production for Urban Agriculture. HortScience 2019, 54, 1448–1458. [Google Scholar] [CrossRef]
- Kozai, T.; Niu, G. Plant Factory—An Indoor Vertical Farming System for Efficient Quality Food Production, 1st ed.; Academic Press: Cambridge, MA, USA, 2016; ISBN 978-0-12-801775-3. [Google Scholar]
- Zeidler, C.; Schubert, D.; Vrakking, V. Vertical Farm 2.0: Designing an Economically Feasible Vertical Farm—A Combined European Endeavor for Sustainable Urban Agriculture. Ph.D. Thesis, Association for Vertical Farming, Munich, Germany, 2017. [Google Scholar]
- Graamans, L.; Baeza, E.; van den Dobbelsteen, A.; Tsafaras, I.; Stanghellini, C. Plant Factories versus Greenhouses: Comparison of Resource Use Efficiency. Agric. Syst. 2018, 160, 31–43. [Google Scholar] [CrossRef]
- Harbick, K.; Albright, L.D. Comparison of Energy Consumption: Greenhouses and Plant Factories. Acta Hortic. 2016, 285–292. [Google Scholar] [CrossRef] [Green Version]
- Despommier, D. Farming up the City: The Rise of Urban Vertical Farms. Trends Biotechnol. 2013, 31, 388–389. [Google Scholar] [CrossRef]
- Despommier, D. The Vertical Farm: Controlled Environment Agriculture Carried out in Tall Buildings Would Create Greater Food Safety and Security for Large Urban Populations. J. Verbrauch. Lebensm. 2011, 6, 233–236. [Google Scholar] [CrossRef]
- NREL Lighting System Assessment Guidelines 2011. Available online: https://www.nrel.gov/docs/fy11osti/50125.pdf (accessed on 23 March 2021).
- Edmonds, I. Daylighting High-Density Residential Buildings with Light Redirecting Panels. Light. Res. Technol. 2005, 37, 73–84. [Google Scholar] [CrossRef]
- Dogan, T.; Park, Y. A Critical Review of Daylighting Metrics for Residential Architecture and a New Metric for Cold and Temperate Climates. Light. Res. Technol. 2019, 51, 206–230. [Google Scholar] [CrossRef]
- Dogan, T.; Reinhart, C.; Michalatos, P. Urban Daylight Simulation Calculating the Daylit Area of Urban Designs. Proc. SimBuild 2012, 5, 613–620. [Google Scholar]
- Brechner, M.; Both, A.J.; Staff, C.E.A. Hydroponic Lettuce Handbook. Cornell Control. Environ. Agric. 1996, 834, 504–509. [Google Scholar]
- Ohashi, Y.; Torii, T.; Ishigami, Y.; Goto, E. Estimation of the Light Interception of a Cultivated Tomato Crop Canopy under Different Furrow Distances in a Greenhouse Using the Ray Tracing. J. Agric. Meteorol. 2020, 76, 188–193. [Google Scholar] [CrossRef]
- Jung, D.; Lee, J.; Kang, W.; Hwang, I.; Son, J. Estimation of Whole Plant Photosynthetic Rate of Irwin Mango under Artificial and Natural Lights Using a Three-Dimensional Plant Model and Ray-Tracing. Int. J. Mol. Sci. 2018, 19, 152. [Google Scholar] [CrossRef] [Green Version]
- Saito, K.; Ishigami, Y.; Goto, E. Evaluation of the Light Environment of a Plant Factory with Artificial Light by Using an Optical Simulation. Agronomy 2020, 10, 1663. [Google Scholar] [CrossRef]
- Wang, C.; Du, J.; Liu, Y.; Chow, D. A Climate-Based Analysis of Photosynthetically Active Radiation Availability in Large-Scale Greenhouses across China. J. Clean. Prod. 2021, 127901. [Google Scholar] [CrossRef]
- Ashdown, I. Climate-Based Annual Daylight Modelling for Greenhouses with Supplemental Electric Lighting. In Proceedings of the International Symposium on Advanced Technologies and Management for Innovative Greenhouses: GreenSys2019, Angers, France, 16–21 June 2019. [Google Scholar]
- Buck-Sorlin, G.H.; Hemmerling, R.; Vos, J.; de Visser, P.H.B. Modelling of Spatial Light Distribution in the Greenhouse: Description of the Model. In Proceedings of the 2009 Third International Symposium on Plant Growth Modeling, Simulation, Visualization and Applications, Beijing, China, 9–13 November 2009; pp. 79–86. [Google Scholar]
- Benis, K.; Reinhart, C.; Ferrão, P. Development of a Simulation-Based Decision Support Workflow for the Implementation of Building-Integrated Agriculture (BIA) in Urban Contexts. J. Clean. Prod. 2017, 147, 589–602. [Google Scholar] [CrossRef]
- Avgoustaki, D.D.; Xydis, G. How Energy Innovation in Indoor Vertical Farming Can Improve Food Security, Sustainability, and Food Safety? Adv. Food Secur. Sustain. 2020, 5, 1–51. [Google Scholar] [CrossRef]
- Al-Kodmany, K. The Vertical Farm: A Review of Developments and Implications for the Vertical City. Buildings 2018, 8, 24. [Google Scholar] [CrossRef] [Green Version]
- Beacham, A.M.; Vickers, L.H.; Monaghan, J.M. Vertical Farming: A Summary of Approaches to Growing Skywards. J. Hortic. Sci. Biotechnol. 2019, 94, 277–283. [Google Scholar] [CrossRef]
- Palliwal, A.; Song, S.; Tan, H.T.W.; Biljecki, F. 3D City Models for Urban Farming Site Identification in Buildings. Comput. Environ. Urban Syst. 2021, 86, 101584. [Google Scholar] [CrossRef]
- Reinhart, C.F.; Walkenhorst, O. Validation of Dynamic RADIANCE-Based Daylight Simulations for a Test Office with External Blinds. Energy Build. 2001, 33, 683–697. [Google Scholar] [CrossRef]
- Ward Larson, G.; Shakespeare, R. Rendering with Radiance: The Art and Science of Lighting Visualization; Morgan Kaufman Publishers, Inc.: San Francisco, CA, USA, 1998. [Google Scholar]
- McNeel Rhinoceros 6.0. Available online: www.rhino3d.com (accessed on 16 December 2019).
- Jakubiec, J.A.; Reinhart, C.F. DIVA 2.0: Integrating Daylight and Thermal Simulations Using Rhinoceros 3D, Daysim and EnergyPlus. In Proceedings of the 12th Conference of International Building Performance Simulation Association, Sydney, Australia, 14–16 November 2011; Volume 20, pp. 2202–2209. [Google Scholar]
- Wilcox, S.; Marion, W. Users Manual for Tmy3 Data Sets (Revised); National Renewable Energy Lab (NREL): Golden, CO, USA, 2008. [Google Scholar]
- McCree, K.J. The Action Spectrum, Absorptance and Quantum Yield of Photosynthesis in Crop Plants. Agric. Meteorol. 1971, 9, 191–216. [Google Scholar] [CrossRef]
- Ting, K.C.; Giacomelli, G.A. Giacomelli Availability of Solar Photosynthetically Active Radiation. Trans. ASAE 1987, 30, 1453–1457. [Google Scholar] [CrossRef]
- Dorais, M. The Use of Supplemental Lighting for Vegetable Crop Production: Light Intensity, Crop Response, Nutrition, Crop Management, Cultural Practices. In Proceedings of the Canadian Greenhouse Conference, Jordan Station, ON, Canada, 9 October 2003. [Google Scholar]
- Both, A.-J. Dynamic Simulation of Supplemental Lightingfor Greenhouse Hydroponic Lettuce Production. Ph.D Thesis, Cornell University, Ithaca, NY, USA, 1995. [Google Scholar]
- Both, A.J.; Shelford, T. Plant Production in Controlled Environments; Virginia Tech Publishing: Blacksburg, VA, USA, 2020. [Google Scholar]
- Kusuma, P.; Pattison, P.M.; Bugbee, B. From Physics to Fixtures to Food: Current and Potential LED Efficacy. Hortic. Res. 2020, 7, 56. [Google Scholar] [CrossRef] [Green Version]
- Wallace, C.; Both, A.J. Evaluating Operating Characteristics of Light Sources for Horticultural Applications. Acta Hortic. 2016, 435–444. [Google Scholar] [CrossRef]
- DLC Horticultural Lighting Database. 2021. Available online: https://qpl.designlights.org/horticulture (accessed on 21 March 2021).
- Pattison, P.; Tsao, J.; Krames, M. Light-Emitting Diode Technology Status and Directions: Opportunities for Horticultural Lighting. Acta Hortic. 2016, 1134, 413–426. [Google Scholar] [CrossRef] [Green Version]
- Both, A.-J.; Bugbee, B.; Kubota, C.; Lopez, R.G.; Mitchell, C.; Runkle, E.S.; Wallace, C. Proposed Product Label for Electric Lamps Used in the Plant Sciences. HortTechnology 2017, 27, 544–549. [Google Scholar] [CrossRef] [Green Version]
- Li, D.H.W.; Tsang, E.K.W. An Analysis of Daylighting Performance for Office Buildings in Hong Kong. Build. Environ. 2008, 43, 1446–1458. [Google Scholar] [CrossRef]
- Dogan, T.; Stec, P. Prototyping a Façade-Mounted, Dynamic, Dual-Axis Daylight Redirection System. Light. Res. Technol. 2018, 50, 583–595. [Google Scholar] [CrossRef]
- Srisamranrungruang, T.; Hiyama, K. Possibilities of Using Light Pipes to Buildings. IOP Conf. Ser. Earth Environ. Sci. 2019, 294, 012064. [Google Scholar] [CrossRef]
- Li, D.H.W.; Wong, S.L. Daylighting and Energy Implications Due to Shading Effects from Nearby Buildings. Appl. Energy 2007, 84, 1199–1209. [Google Scholar] [CrossRef]
- Brebbia, C.A.; Zubir, S.S.; Hassan, A.S. Sustainable Development and Planning VIII; WIT Press: Billerica, MA, USA, 2017; ISBN 978-1-78466-153-3. [Google Scholar]


| Reference ID | Spacing | Size | Spacing (m) | Height (m) | Width (m) |
|---|---|---|---|---|---|
| 1A | 1.5× | 100% | 95.4 | 100 | 63.6 |
| 1B | 2.0× | 100% | 127.2 | 100 | 63.6 |
| 1C | 2.5× | 100% | 159 | 100 | 63.6 |
| 2A | 1.5× | 80% | 95.4 | 80 | 50.9 |
| 2B | 2.0× | 80% | 127.2 | 80 | 50.9 |
| 2C | 2.5× | 80% | 159 | 80 | 50.9 |
| 3A | 1.5× | 50% | 95.4 | 50 | 31.8 |
| 3B | 2.0× | 50% | 127.2 | 50 | 31.8 |
| 3C | 2.5× | 50% | 159 | 50 | 31.8 |
| Location | Building Geometry | Annual Lighting Energy Consumption (kWh Year−1) | Energy Use Intensity (kWh·m−2·year−1) | Mean Solar DLI (mol·m−2·day−1) | Supplemental Lighting (%) |
|---|---|---|---|---|---|
| NYC | G1-1:8 | 53,797,621 | 665 | 3.89 | 77 |
| NYC | G2-1:4 | 57,462,903 | 710 | 3.00 | 82 |
| NYC | G3-1:1 | 60,431,614 | 747 | 2.29 | 87 |
| NYC | G4-4:1 | 58,481,407 | 723 | 2.79 | 84 |
| NYC | G5-8:1 | 55,365,613 | 684 | 3.56 | 79 |
| NYC | GH | 14,403,760 | 178 | 18.45 | 21 |
| LA | G1-1:8 | 51,130,378 | 632 | 4.55 | 73 |
| LA | G2-1:4 | 55,507,203 | 686 | 3.49 | 80 |
| LA | G3-1:1 | 59,432,228 | 734 | 2.54 | 85 |
| LA | G4-4:1 | 57,530,131 | 711 | 3.05 | 82 |
| LA | G5-8:1 | 54,107,265 | 669 | 3.92 | 78 |
| LA | GH | 5,753,412 | 71 | 23.53 | 8 |
| LA/NYC | PF | 69,753,040 | 862 | 0 | 100% |
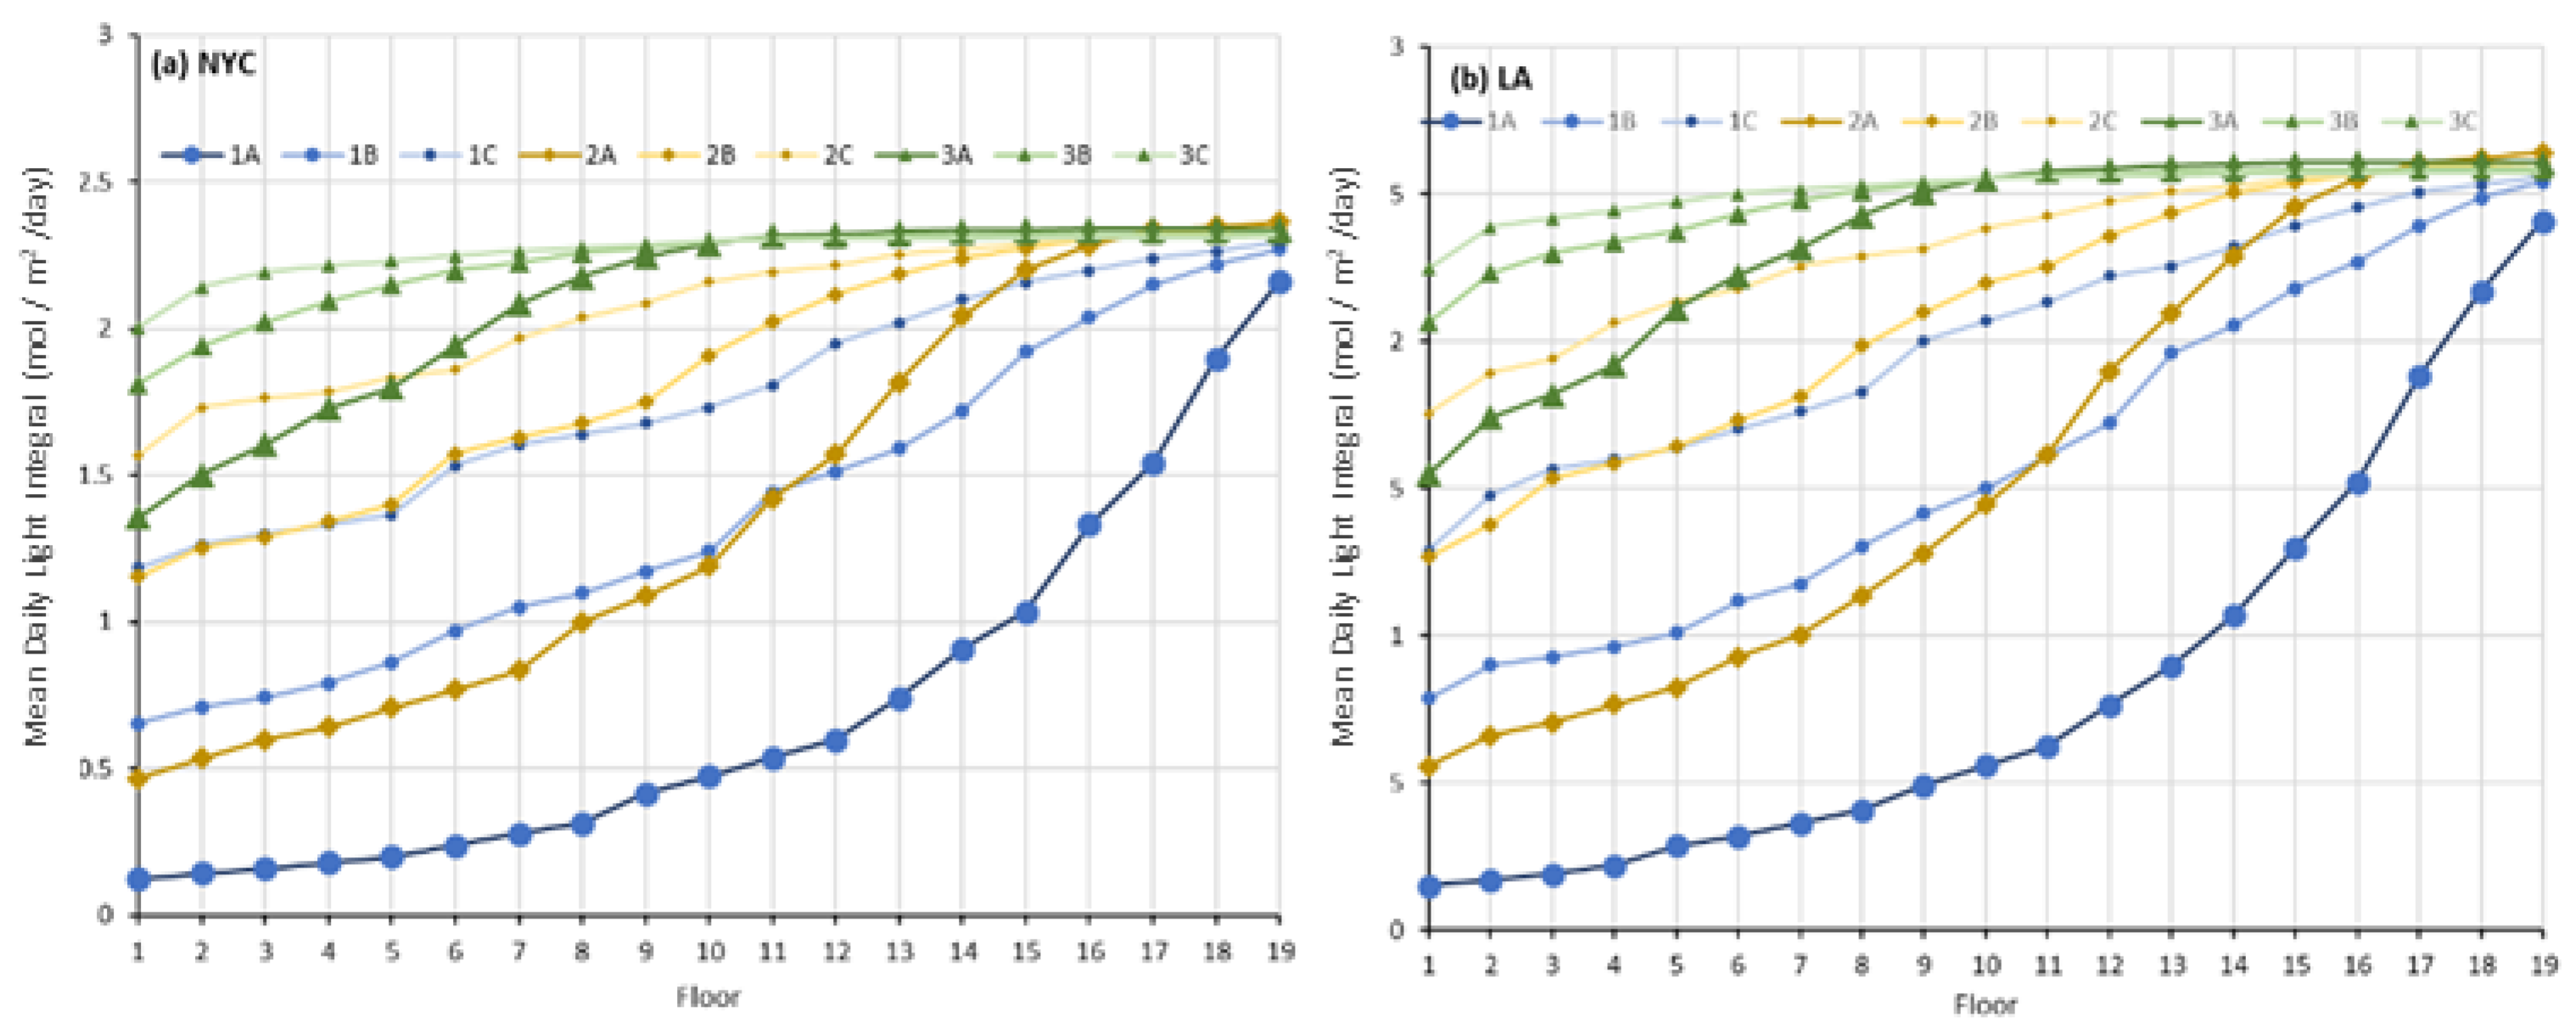
| Reference ID | Spacing | Size | NYC DLI (mol·m−2·day−1) | LA DLI (mol·m−2·day−1) |
|---|---|---|---|---|
| 1A | 1.5× | 100% | 0.70 | 0.83 |
| 1B | 2.0× | 100% | 1.38 | 1.60 |
| 1C | 2.5× | 100% | 1.77 | 2.02 |
| 2A | 1.5× | 80% | 1.39 | 1.58 |
| 2B | 2.0× | 80% | 1.85 | 2.09 |
| 2C | 2.5× | 80% | 2.07 | 2.32 |
| 3A | 1.5× | 50% | 2.09 | 2.35 |
| 3B | 2.0× | 50% | 2.22 | 2.48 |
| 3C | 2.5× | 50% | 2.26 | 2.51 |
Publisher’s Note: MDPI stays neutral with regard to jurisdictional claims in published maps and institutional affiliations. |
© 2021 by the authors. Licensee MDPI, Basel, Switzerland. This article is an open access article distributed under the terms and conditions of the Creative Commons Attribution (CC BY) license (https://creativecommons.org/licenses/by/4.0/).
Share and Cite
Eaton, M.; Harbick, K.; Shelford, T.; Mattson, N. Modeling Natural Light Availability in Skyscraper Farms. Agronomy 2021, 11, 1684. https://doi.org/10.3390/agronomy11091684
Eaton M, Harbick K, Shelford T, Mattson N. Modeling Natural Light Availability in Skyscraper Farms. Agronomy. 2021; 11(9):1684. https://doi.org/10.3390/agronomy11091684
Chicago/Turabian StyleEaton, Michael, Kale Harbick, Timothy Shelford, and Neil Mattson. 2021. "Modeling Natural Light Availability in Skyscraper Farms" Agronomy 11, no. 9: 1684. https://doi.org/10.3390/agronomy11091684
APA StyleEaton, M., Harbick, K., Shelford, T., & Mattson, N. (2021). Modeling Natural Light Availability in Skyscraper Farms. Agronomy, 11(9), 1684. https://doi.org/10.3390/agronomy11091684