Article

Seasonal Dynamics of Dry Matter Accumulation and Nutrients in a Mature Miscanthus × giganteus Stand in the Lower Silesia Region of Poland

1
Institute of Biological, Environmental and Rural Sciences, Aberystwyth University, Aberystwyth SY23 3EE, UK
2
Energene Seeds Ltd., Aberystwyth SY23 3EE, UK
3
Terravesta Ltd., Lincoln LN1 5AB, UK
4
School of Biological and Environmental Sciences, University of Aberdeen, Aberdeen AB24 3FX, UK
5
Institute of Agroecology and Plant Production, Wrocław University of Environmental and Life Sciences, Grunwaldzki Square 24A, 50-363 Wrocław, Poland
6
Institute of Agriculture and Horticulture, Siedlce University of Natural Sciences and Humanities, B. Prusa 14 Street, 2, 08-110 Siedlce, Poland
7
Institute of Landscape Architecture, Wrocław University of Environmental and Life Sciences, Grunwaldzka Street 55, 50-357 Wroclaw, Poland
*
Author to whom correspondence should be addressed.
Agronomy 2021, 11(8), 1679; https://doi.org/10.3390/agronomy11081679
Submission received: 17 July 2021 / Revised: 12 August 2021 / Accepted: 17 August 2021 / Published: 23 August 2021

Abstract

:
Biomass from M. × giganteus has great promise for use within the bioeconomy sectors, but to maximise environmental benefits, crops must produce high yields while minimising energetically costly inputs. Complex interactions between soil conditions, climatic variations, plant maturity and genotype influence yields and nutrient dynamics, which in turn impacts crop sustainability. To investigate the flux of growth and nutrients in response to a changing environment, M. × giganteus was grown in southwest Poland and sampled monthly (June–November) from 2010 to 2012. Measurements examined the interaction between plant growth and leaf development, and nutrient (N, P, K, Ca and Mg) concentrations of rhizomes, stems and leaves. The three growth years studied were markedly different for growth and meteorological conditions. Between 2010 and 2011, above ground biomass yield increased significantly from 16.5 ± 0.4 t ha−1 to 20.1 ± 0.5 t ha−1. The 2012 rhizome weights at the beginning of the growth season were halved due to extreme frost; however, resulting yield was similar (19.9 ± 0.6 5 t ha−1). Final yield from all three years were successfully predicted using MISCANFOR, and modelling indicated crop yield was water-limited. The seasonal flux of N and K from rhizome to stems and leaves then back to the rhizome at the onset of senescence was as expected in 2010 and 2011. In 2012, no such trend was evident especially for N suggesting different macronutrient sources from rhizome and soil improves the resilience of perennial crop yield across a range of diverse growth conditions.

1. Introduction

Dedicated biomass crops, such as M. × giganteus, should embody several characteristics including efficient use of available resources and a consequent requirement for few inputs [1]. It can produce high biomass yields and is well adapted to a wide range of marginal land types less suitable for food production [2]. Field studies of M. × giganteus have shown that the crop does not need regular fertiliser application [3]; this is due in part to the onset of senescence and mobilisation of nutrients from the stems and leaves to the rhizomes for use in subsequent growth [4,5]. Rhizomes facilitate rapid initial regrowth at the start of each growing season and allow the plant to regulate, to an extent, the availability of nutrients in the subsequent growth period [6]. Beyond storage in the rhizomes, nutrients utilised by the crop are derived from atmospheric deposition, mineralised nitrogen in the soil and the decomposition of leaf litter. M. × giganteus is highly efficient with regards to nitrogen (N) use [7]. In spring, N is transported to new shoots which is dependent on availability of N in the soil and rhizome [8,9,10]. At the end of the vegetative period, 21–46% of nitrogen, 36–50% of phosphorus, 14–30% of potassium, and 27% of magnesium accumulated in the aerial parts of the plants (stems and leaves) during the growing season is transported back to the rhizomes [11].
Nitrogen uptake experiments using isotopic 15N demonstrated that only 38% of 15NH4+ and 15NO3 provided by a dose of 60 kg N ha−1 was taken up by M. × giganteus plants, of which half of the amount was accumulated in rhizomes [9]. The majority of N in the plants did not come from fertilisers but from mineralization processes in the soil and N stored in rhizomes [9]. Where mineralization of the organic matter is sufficient, N fertilisation exerts no control on yields in the early years of growth but can significantly enhance yields in the later years of the M. × giganteus life cycle following a period without fertilisation [12]. This may be attributed to N stores in the rhizomes declining over successive growing seasons [9]. When grown on marginal land, the nitrogen requirements of M. × giganteus can be met with 50–70 kg N ha−1 year−1, applied in spring when the plants produce new shoots [10,11]. In studies of other nutrients, there was no increase in phosphorous (P) content of biomass with the use of organic and mineral fertilisation [8,11], and no significant correlation between fertilisation with NPK and P content in the biomass of different M. × giganteus clones [13].
Studies have shown that N content in above ground biomass tends to be highest in May and June and declines from October onwards following the onset of senescence [14]. Phosphorus (P) and magnesium (Mg) levels in above ground organs were highest in August and potassium (K) content was maximal in July; the concentrations of these nutrients in above ground biomass declined in the following months [11]. The content of P, K and Mg in rhizomes declined from the beginning of the vegetative period, then increased between August and November to a relatively stable level until February following a similar pattern to that of N [11].
Research conducted in Germany on 4–9-year-old M. × giganteus showed that N, K and Mg levels were greatest in pre-harvest losses (defined as fallen plant matter) [15]. The concentration of nutrients in harvested biomass (harvested in February or March) were 61% (N), 64% (P), 55% (K) and 50% (Mg) of the values recorded at the end of the vegetative period. These losses were due to fallen plant material and subsequent leaching but also by nutrient translocation at the end of the growth period. Wyżgolik et al. (2006) [16] suggest that the leaching of Ca is less significant than for other nutrients. Several studies confirmed that the lowest K content in different clones of M. × giganteus was at the end of the vegetative period [14,17,18,19]. NPK fertilisation affected K content in aerial parts of M. × giganteus [20], but this was not confirmed in subsequent studies [21].
It has been proposed that N, P, K and Mg concentrations and distributions depend mostly on the growth stage of M. × giganteus, and to a lesser degree on mineral fertilisation [21]. The growth and development of the plants led to a significant decrease in N content, which, compared to June, was lower by 37% in July and by 60% in August. From August onwards, there were small variations in N content, and in October, N content was 72% lower than in June. Based on the same study, it was found that N fertilisation of M. × giganteus at quantities of 100 to 200 kg N ha−1 did not significantly modify N content in the aerial parts. The decrease in N content between June and July was correlated with an intense period of dry matter accumulation. Potassium fertilisation, as well as the length of the growing season, significantly affected Mg content in the aerial parts, but contrary to the known phenomenon of ion antagonism between these elements, increasing K content correlated with an increase in Mg accumulation in the plants [21].
Maximum yields of above ground dry matter biomass are obtained towards the end of the growing season. Maximum yields of 25–30 t dry matter ha−1 from M. × giganteus were reached in September of each study year in a study in West Europe, and N fertilisation appeared to have no effect on yield [11]. Maximum above ground biomass accumulation in mid-September has been reported in other studies [8]. Both studies found that between September and February/March, above ground yields decreased due to the onset of senescence and subsequent shedding of leaves. Rhizome mass decreased between the start of the growing season and July/August [8,11], and it was suggested this was due to the rhizome acting as a source of nutrients at the start of the season [8]. Both studies report that maximal dry matter of rhizomes was reached in November, after which, rhizome mass started to decline.
Multiple field studies and yield modelling systems have shown that, across Europe, M. × giganteus has a large potential as a biomass crop within a wide range of climates and soils [22]. It has been estimated that by 2030, up to 900,000 km2 of land could be available for biomass production [23]. This total available land is considered surplus to arable needs, and therefore has no impact on the demand for food. It is therefore paramount that the potential of M. × giganteus across diverse European environments continues to undergo investigation.
In this study, the seasonal biomass accumulation and nutrient flux were investigated for M. × giganteus grown in Wrocław, Poland. This area has a unique climate that is characterised by a relatively warm growing season, but cold winters and limited annual precipitation. The MISCANFOR model was run using soil and climatic data obtained from the study site to assess a plant’s available water, wilt point, leaf area index and dry matter accumulation; this technique has been rarely used when studying the growth of M. × giganteus [24].
The complex interactions, detailed above, between seasonal biomass loss and accumulation, yield and the nutrient flux from soil, rhizome and aerial parts, are important criteria in determining the success of M. × giganteus as a sustainable low input biomass crop. As such, the aim of the study was to clarify the relationship between the seasonal flux of biomass accumulation and the changes in nutrient content in the above and below ground biomass of M. × giganteus planted in southwest Poland. The objectives were:
  • to determine height of plants and the accumulation of the dry matter for stems, leaves and rhizomes,
  • to measure variations in N, P, K, Ca and Mg concentrations, and differentiate accumulation of these elements in different parts of the plant; aerial parts (stems and leaves) and the underground rhizome,
  • to measure harvestable dry matter yield and composition, and, to determine how the flux of nutrients throughout seasonal growth impacts the quality of harvested biomass across three harvest years with differing meteorological conditions and accumulation of biomass,
  • to compare measured and modelled yield to examine how well standard model assumptions predict yield in diverse environments.

2. Materials and Methods

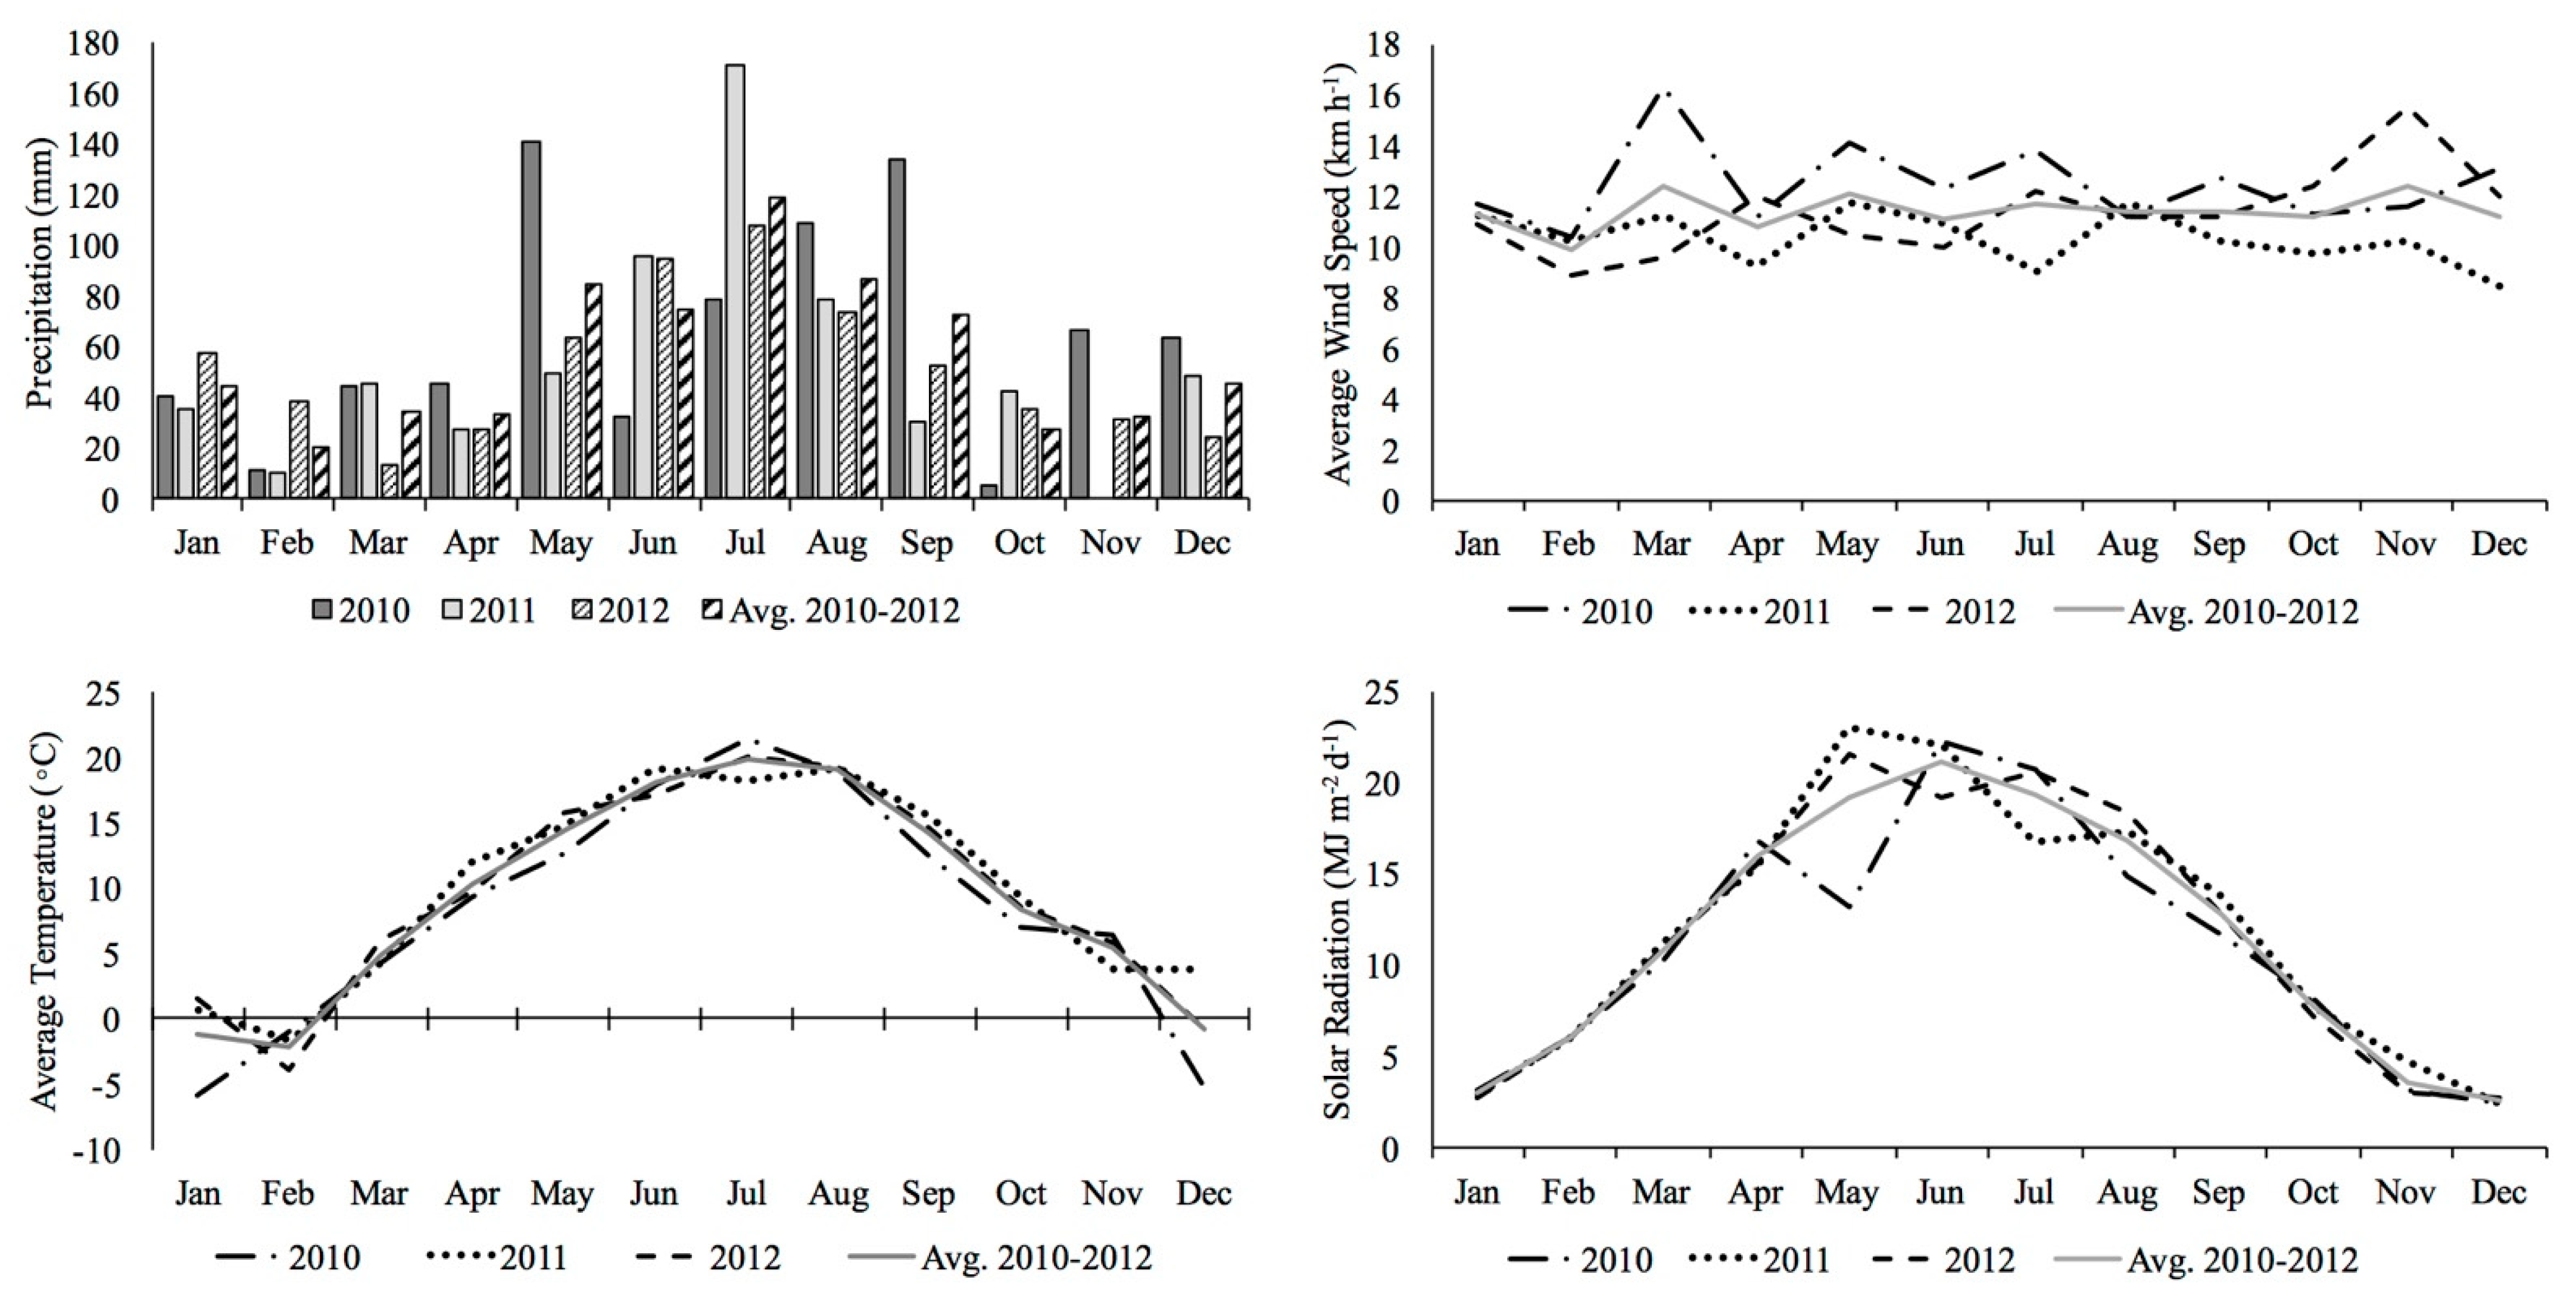
2.1. Experimental Site and Climatic Conditions

A field trial of M. × giganteus was grown at fields belonging to Wrocław University of Environmental and Life Sciences in Wrocław, Poland, which is in one of the warmest areas of the middle river Odra valley.
The area is characterized by a growing season (above 5 °C) lasting 223–230 days, an average temperature during the growing season of 14.5 °C, an annual precipitation sum varying from 500–600 mm and a rainfall sum of approximately 350 mm during the growing season (April–November). Meteorological data were obtained during the experimental period including average temperature, precipitation, solar radiation and average wind speed (Figure 1).

2.2. Agro-Technical and Soil Conditions

In 2007, the M. × giganteus plantation was established from plantlets grown via plugs produced by in vitro tillering. Four replicate plots of 15 × 18 m (270 m2) were planted at a row spacing of 70 cm and an inter-row distance between plants of 48 cm (around 3 plants m−2). The experiment was planted on light alluvial soil.
The soil profile description was as follows:
-
humus horizon 0–26 (30) cm deep: subangular blocky structures, consistence soft, firm; slightly loamy sand;
-
transitional soil horizon 30–38 (40) cm deep: subangular blocky structures, consistence soft, firm; slightly loamy sand;
-
parent material 40–66 (70) cm deep: subangular blocky structures, consistence soft, firm; loose sand;
-
parent material 70–88 cm deep: subangular blocky structures, consistence soft, firm; loose sand;
-
glial horizon +88 cm deep: single-grained structure, consistence loose; loose gravel sand.
The following concentrations of total nutrients were: P—very high (76.5–90.3 mg kg−1), K—medium to high (133–150 mg kg−1), Mg—very low (43.5–60.7 mg kg−1), the pH was acidic to slightly acidic. The assessment of the soil’s nutrient content was determined by limit numbers to assess the content of elements developed by the Polish Institute of Soil and Plant Cultivation in Puławy [25]. The experimental plots were not fertilised during the years of the experiment.

2.3. Research Methods

After three growing seasons (2007–2009), the plantation was considered fully established, signified by canopy height and the complete development of canopy closure. The plantation was analysed throughout the 3 subsequent growing seasons (2010–2012). The beginning of the growing season was assumed to be the time when shoots appeared at the soil surface which occurred between the second (2011) and third week of April (2010 and 2012). Plant height was measured from 10 randomly selected stems within a randomly chosen 0.25 m2. Harvested biomass was used to determine stem and leaf partitioning as well as above and below ground biomass yield and composition. Harvesting of samples began 45 days after the M. × giganteus growing season started and plants were harvested every 30 days until the end of the growing season. Above and below ground biomass was harvested from randomly chosen 0.25 m2 and to a depth of 0.5 m. The procedure was replicated four times at each time point. After removing all soil, the rhizomes with roots were separated from the stems and leaves. The separated components were weighed immediately to give fresh weight values per 0.25 m2. The water content of rhizomes was assessed from 300 g of fresh rhizome. After counting the number of stems in each 0.25 m2 sample, the weight of rhizome per stem was determined. From each quadrat within each replication, 10 randomly selected stems were used to determine plant height, number of leaves per plant, and weight of leaves and stems. Leaf samples were separated from the stem with full leaf sheath. If only the below ligule part of the sheath was present, that part was assumed as the full sheath and represented part of the leaf weight. The experiment was not continued through winter months because frozen soil rendered rhizome collection impossible.

2.4. Chemical Analysis

The dry matter and mineral content was determined separately in the stems, leaves and the rhizomes. Moisture content in each plant component was determined by the drying of samples to constant weight at 40 °C. Samples were analysed to investigate the seasonal flux of dry matter biomass, N, P, K, Ca and Mg concentrations. Biomass dry weight was determined by gravimetric method after drying at 105 ± 2 °C. Chemical analysis involved the determination of concentrations of the following:
-
total N (Nitrogen), using Kieldahl’s method [26]
-
K, Ca—by flame photometry using Flapho 4, (Carl Zeiss Jena);
-
Mg, P—colorimetric method, using Spekol 10 (Carl Zeiss Jena).
The accumulation of nutrients was expressed on a per hectare basis, assuming 30,000 plants per ha based on biomass yield and chemical content of the examined parts of plants. To determine the seasonal flux of nutrients within the plant, the chemical composition was expressed as the composition of the rhizome or of the combined above ground tissues.

2.5. Statistical Analysis

Differences were compared by analysis of variance for orthogonal systems at the significance level of 0.05 or 0.01. In the variance analysis, a randomized block set in four replications was used, repeated in each year of the study. The calculations were conducted with the Genstat software and Microsoft Excel 2010. The correlation coefficient (R) was determined with Microsoft Excel 2010. For the resulting data presented in the tables, standard errors (SE) were calculated. Correlations between examined features were calculated based on significance level of 0.05.

2.6. Analysis of the Impact of Environmental Conditions on Seasonal Growth

The plant’s available water in the soil profile was determined using the Campbell [27] method as modified by Hastings et al. (2009) [28]. This adopts a soil physics approach utilising the soil texture to determine the soil capillary pressure to porosity relationship, thus determining the soil water at field capacity and wilt point. These values were then used, together with the meteorological data, to run the MISCANFOR model [24] to compare to the modelled yield against observed yield data. The model calculates the soil water saturation during the growing season, considering rainfall interception and evapotranspiration, to determine if the crop was subject to water stress. Potential evapotranspiration was calculated using solar radiation and weather parameters (collected ~1 km from the study site) [29].
The rate of leaf development and photosynthesis rate of the plant predicted by the model is dependent upon the temperature, soil moisture availability and incident radiation. The information provided by the model helped to describe changes in yields and plant growth traits.

3. Results

3.1. Meteorological Data and Growing Season

In 2010 in January, minimal daily temperatures for several days gained −20 °C, but thick snow cover prevented freezing of rhizomes. The M. × giganteus growing season (defined by the time at which shoots were visible at the soil surface to the time at which the onset of senescence was evident) started on April 15th and ended on November 20th. Total precipitation in 2010 was about 46% higher than the long-term average. Particularly intense rainfall occurred in May and September. Winter 2011 was exceptionally mild. The vegetation period started on April 17th, and ended on November 9th. In January 2012, temperatures were above the long-term average, but in the first two weeks of February, minimal daily temperatures ranged from −14 to −20 °C, which in the absence of snow cover led to partial freezing of rhizomes. That year, the growing season started on April 20th and ended on November 12th. The mean precipitation sum in 2012 was 18% higher than the long-term average. Wind speeds between March and August were considerably higher than the average values in 2010. For the majority of 2011, wind speeds remained below the 2010–2012 average. Solar radiation was below average at the start and towards the end of the 2010 growing season; 2011 experienced particularly high solar radiation between April and June, but this dropped to below average in the middle of the growing season.

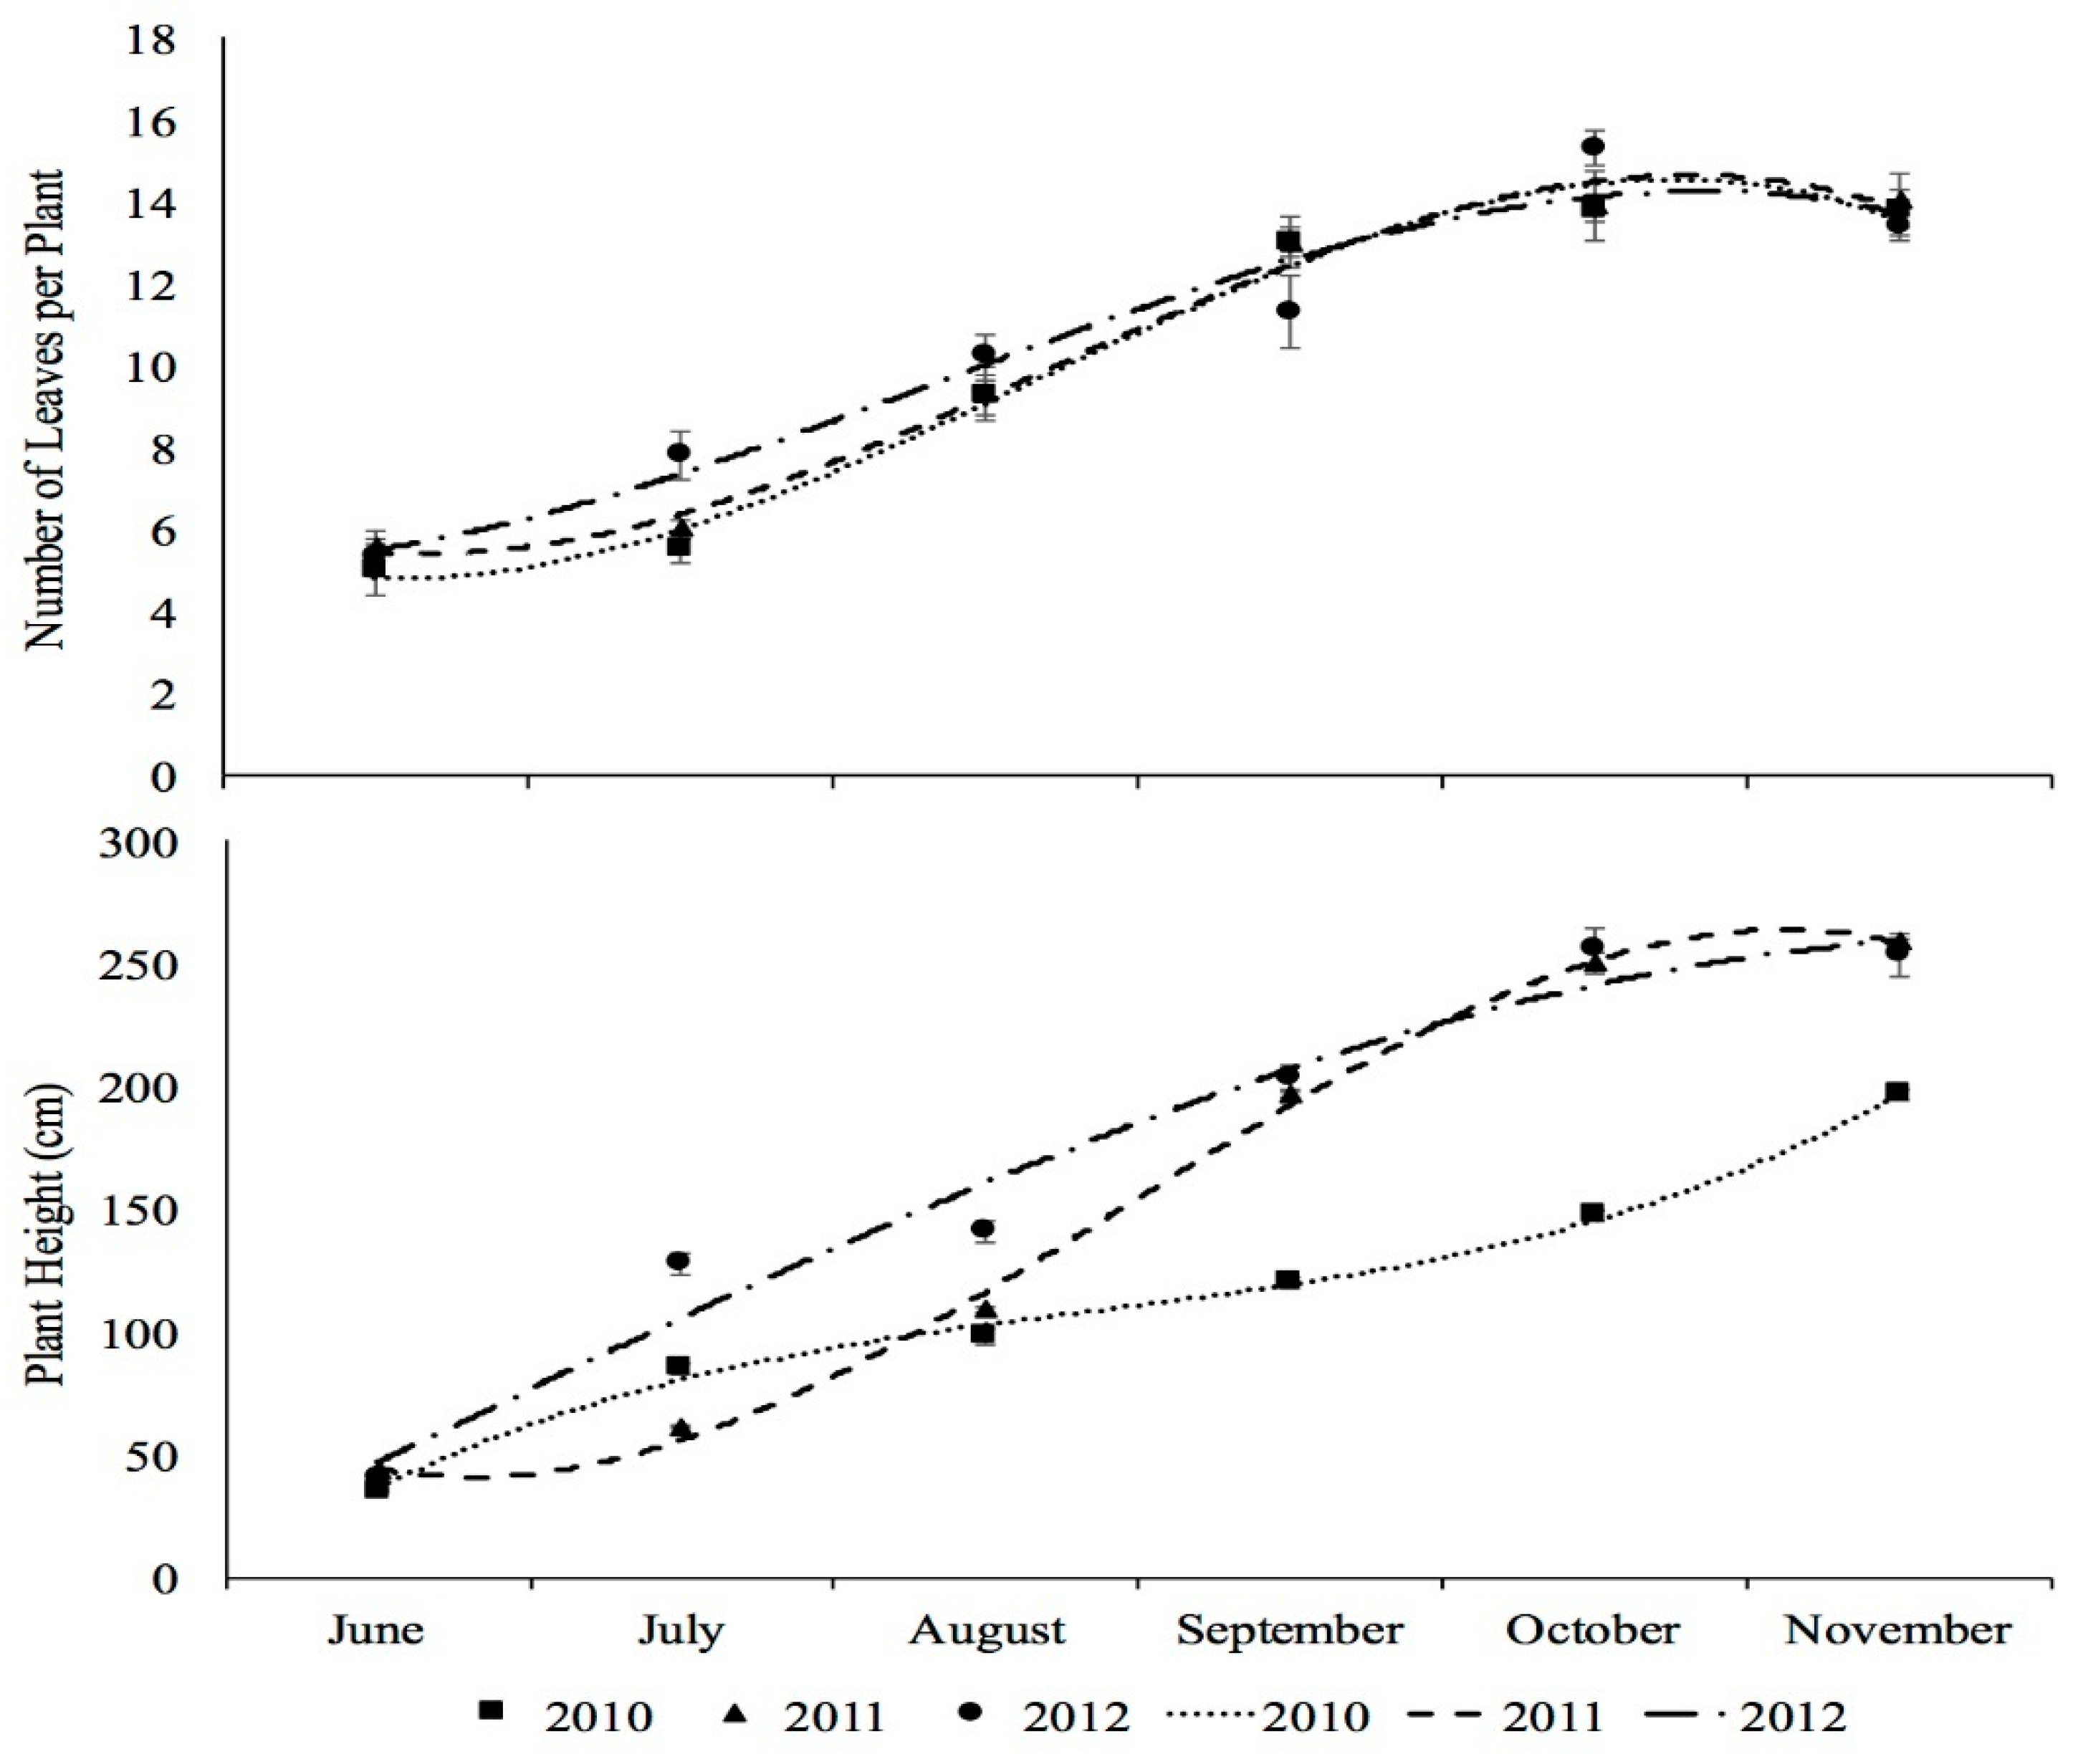
3.2. Plant Development

The number of leaves per plant was measured at monthly intervals for each study year. A third order polynomial function best described the change in number of leaves over time. A maximum of 15 leaves per plant was recorded in October 2012. Figure 2 shows that the increase in number of leaves per plant was relatively constant over the three years. The greatest rate of change was between July and October for all three years. In all years, between these months, plants gained on average two leaves per month.
Plant height was measured monthly during the growing season from June to November and showed very different growth profiles as illustrated by 3rd order polynomial functions fitted to each of the three study years (Figure 2). A maximum average plant height of 258.5 cm was recorded in November 2012. Throughout the study period, plant growth rate was variable. In 2010, the maximum growth rate was between June and July (50 cm month−1). In 2011, growth was relatively consistent between July and October, and on average plants grew at a rate of ~47 cm month−1. For 2012, growth rate remained constant between June and September with an average change of ~41 cm month−1; the maximum growth rate was evident between June and July (88 cm month−1).

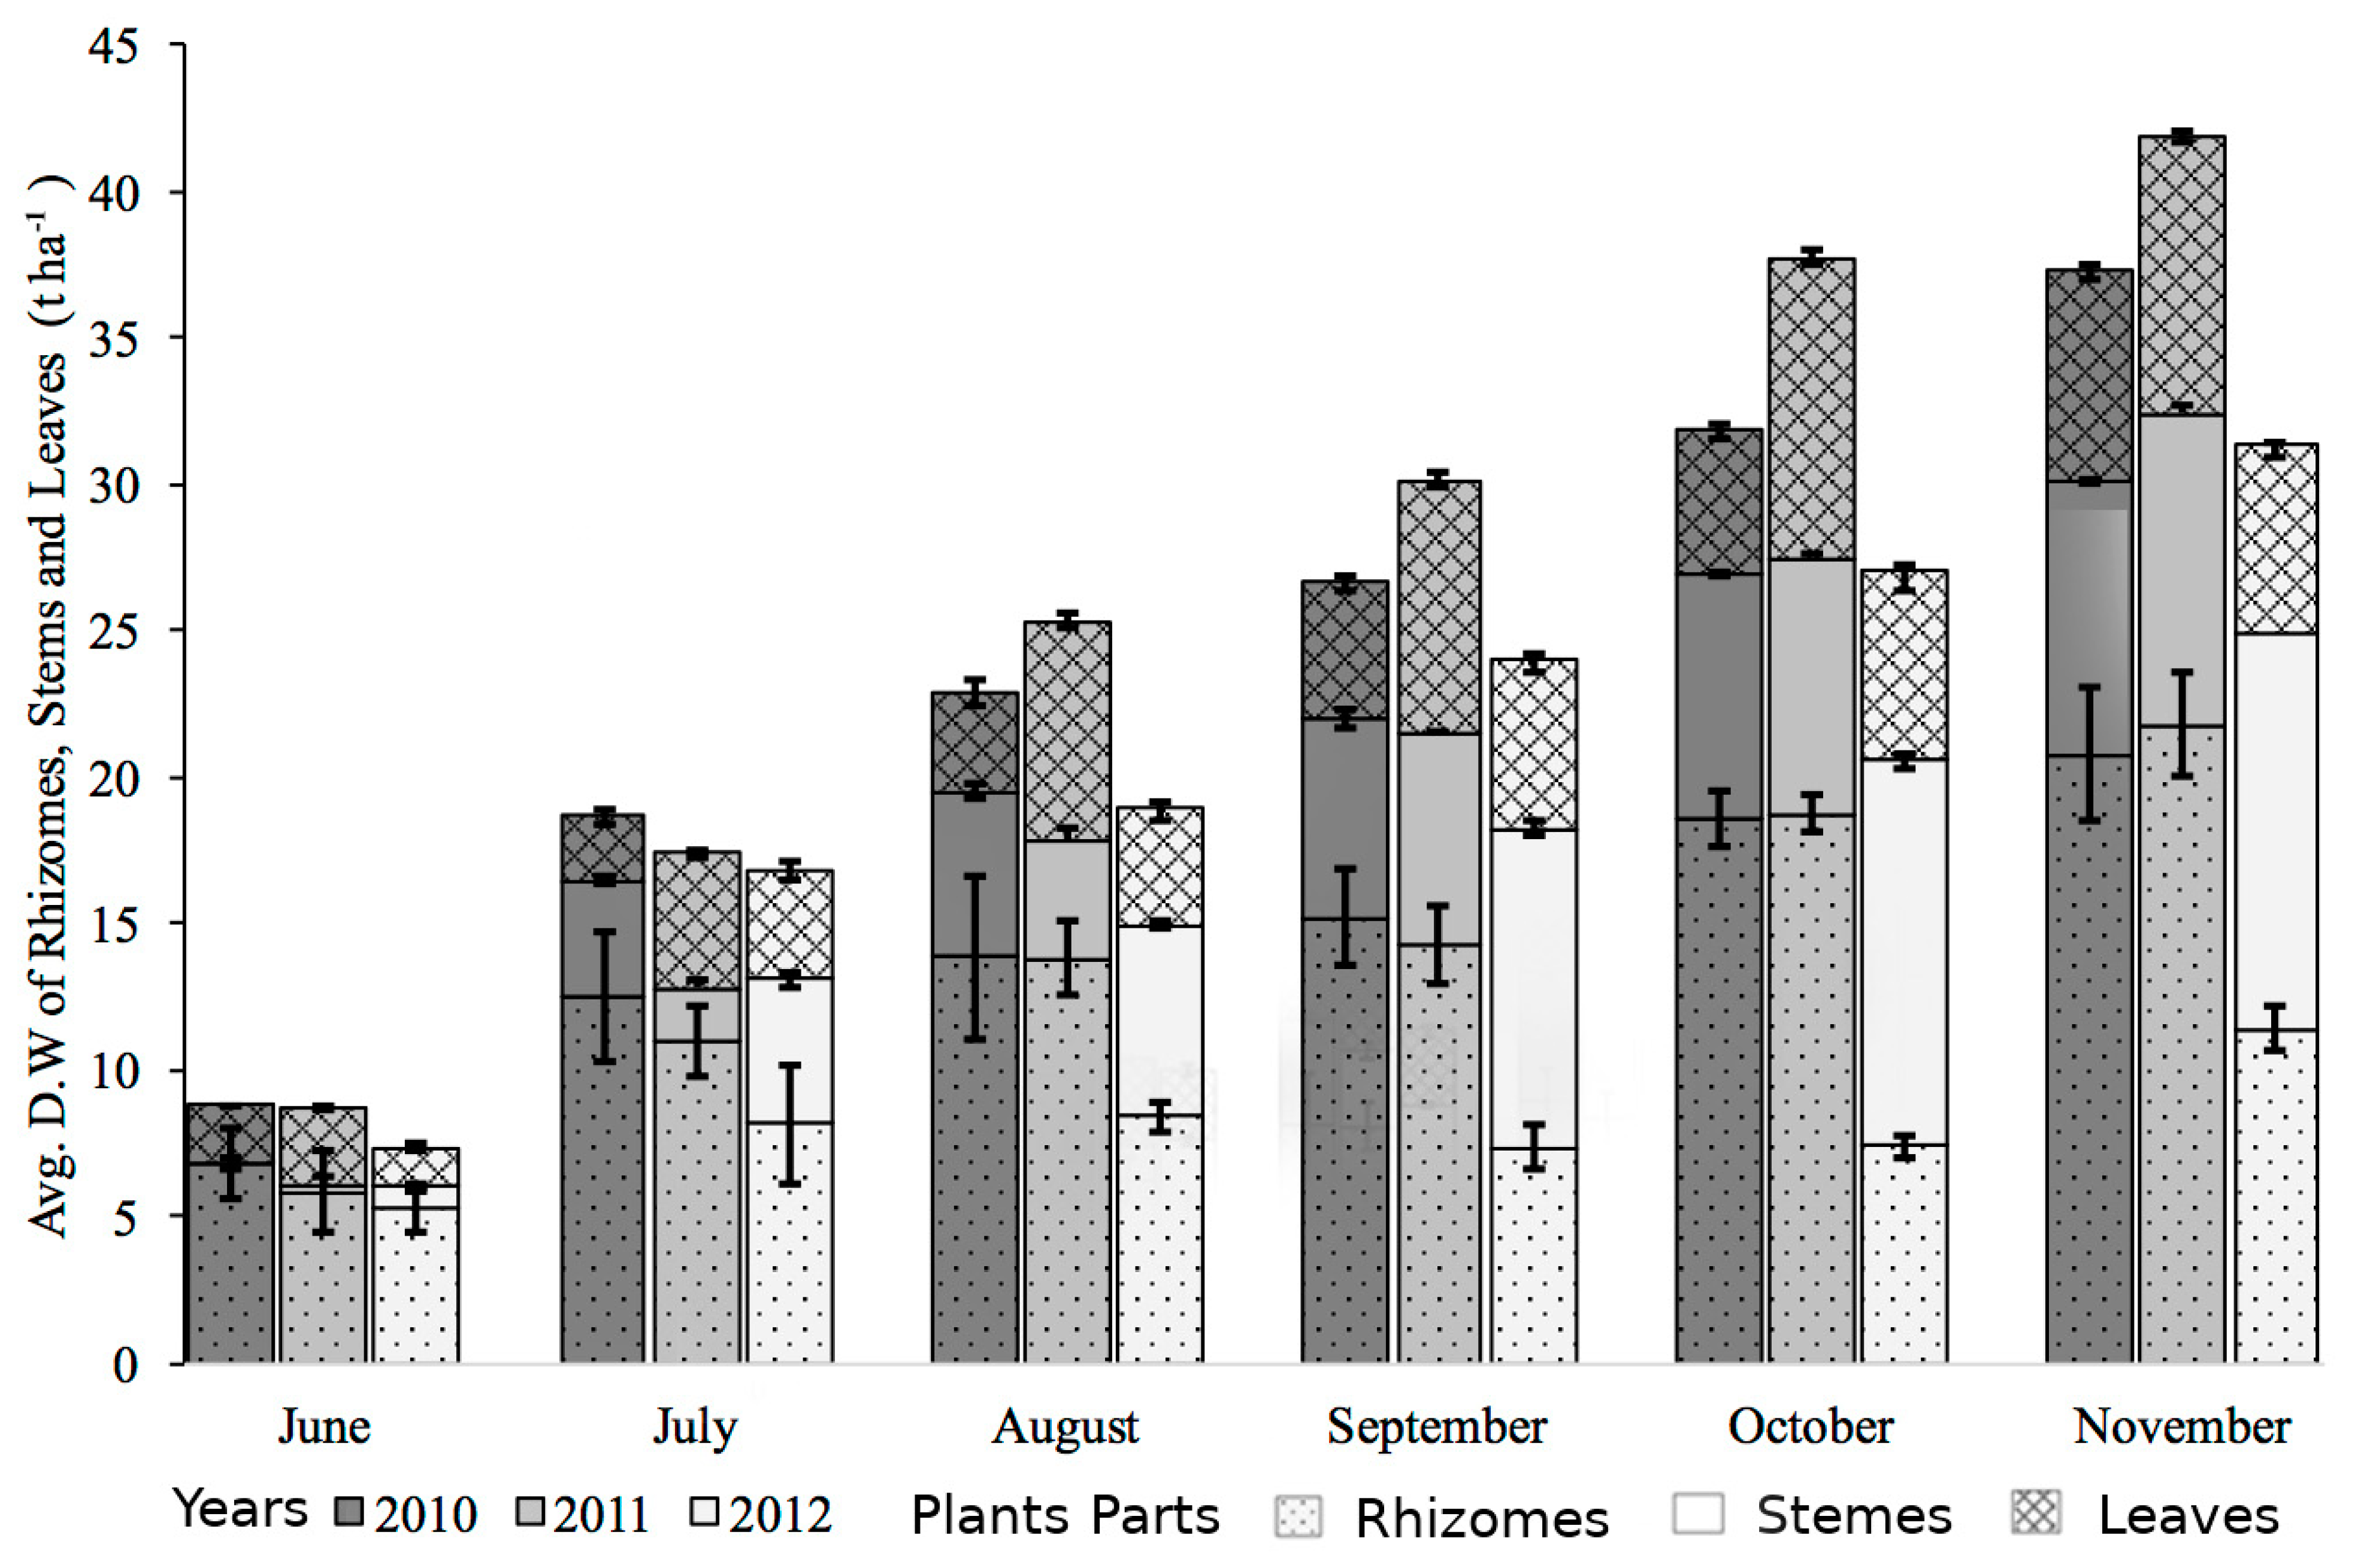
3.3. Biomass Accumulation

Fresh and dry weights of rhizomes, stems and leaves were monitored monthly throughout the growing season. Rhizomes accounted for between 47.3% and 80.1% of yield depending on sampling date, whilst stems and leaves accounted for 3.4–31.6% and 16.5–21.1% respectively.
At the end of the 2012 growing season, rhizome fresh weights were lower than in the previous years (821.3 g m−2) in November 2012 compared to 1904.8 and 1741.8/0.25 m2 in 2010 and 2011 respectively. Total rhizome dry weight per hectare was lower when measured throughout the 2012 growing season when compared to the 2010 and 2011 seasons (Figure 3). In February 2012, the minimal daily temperature dropped to a recorded minimum of −19.4 °C and the absence of any snow cover resulted in the freezing and subsequent rotting of some rhizomes. As a result, fresh weight yields of rhizome per 0.25 m2 were over 50% lower after the 2012 growth season than in 2010. The average number of stems per plant also decreased in 2012 (average of 9.8 ± 0.3 stems plant−1 in November 2012 compared to 14.8 ± 0.5 and 16.8 ± 0.5 for the same month in 2011 and 2010 respectively).
Between 2010 and 2011, significant increases (16.5 ± 0.33 t ha−1 in 2010 compared to 20.1 ± 0.52 t ha−1 in 2011) in above ground dry matter yield were evident. Although 67% of rhizome fresh weight was lost between 2011 and 2012, 2012 yields remained comparable to those in 2011 (19.5 ± 0.50 t ha−1). For most of 2012, above ground fresh weight and dry weight of stems and leaves were very similar to that of 2011. The month with the most significant difference was July, where in 2012, yields were considerably greater than in 2011. The low fresh weight yields of rhizome in 2012 and decreased stem numbers did not appear to decrease dry weight yields of leaves and stems; the greatest combined dry weight of stem and leaf per hectare were recorded in 2012 (Figure 3).
The harvest dates at which rhizome moisture content was lowest were October in 2010, September in 2011, and November in 2012 (Table 1). Maximum yield of total above ground biomass (dry weight) was achieved in November of each growing year (Figure 3). Yields were significantly different between 2010 and 2011 (p > 0.05 for June, p > 0.01 from August onwards) throughout all months, except for July. Above ground dry weight yields across all months were not significantly different between 2011 and 2012 excluding July, in which yields were significantly higher in 2012 (p > 0.01). The proportion of stems in the above ground biomass increased each year, reaching the highest values in 2012 (Figure 3). In November 2010, stems contributed 56.5% to the aerial biomass; by 2012, this figure had increased to 72.6%; however, the number of stems per plant was significantly lower in 2012 (Table 1). Rhizome dry weight yields were 48% lower in November 2012 than in November 2011 (Figure 3).

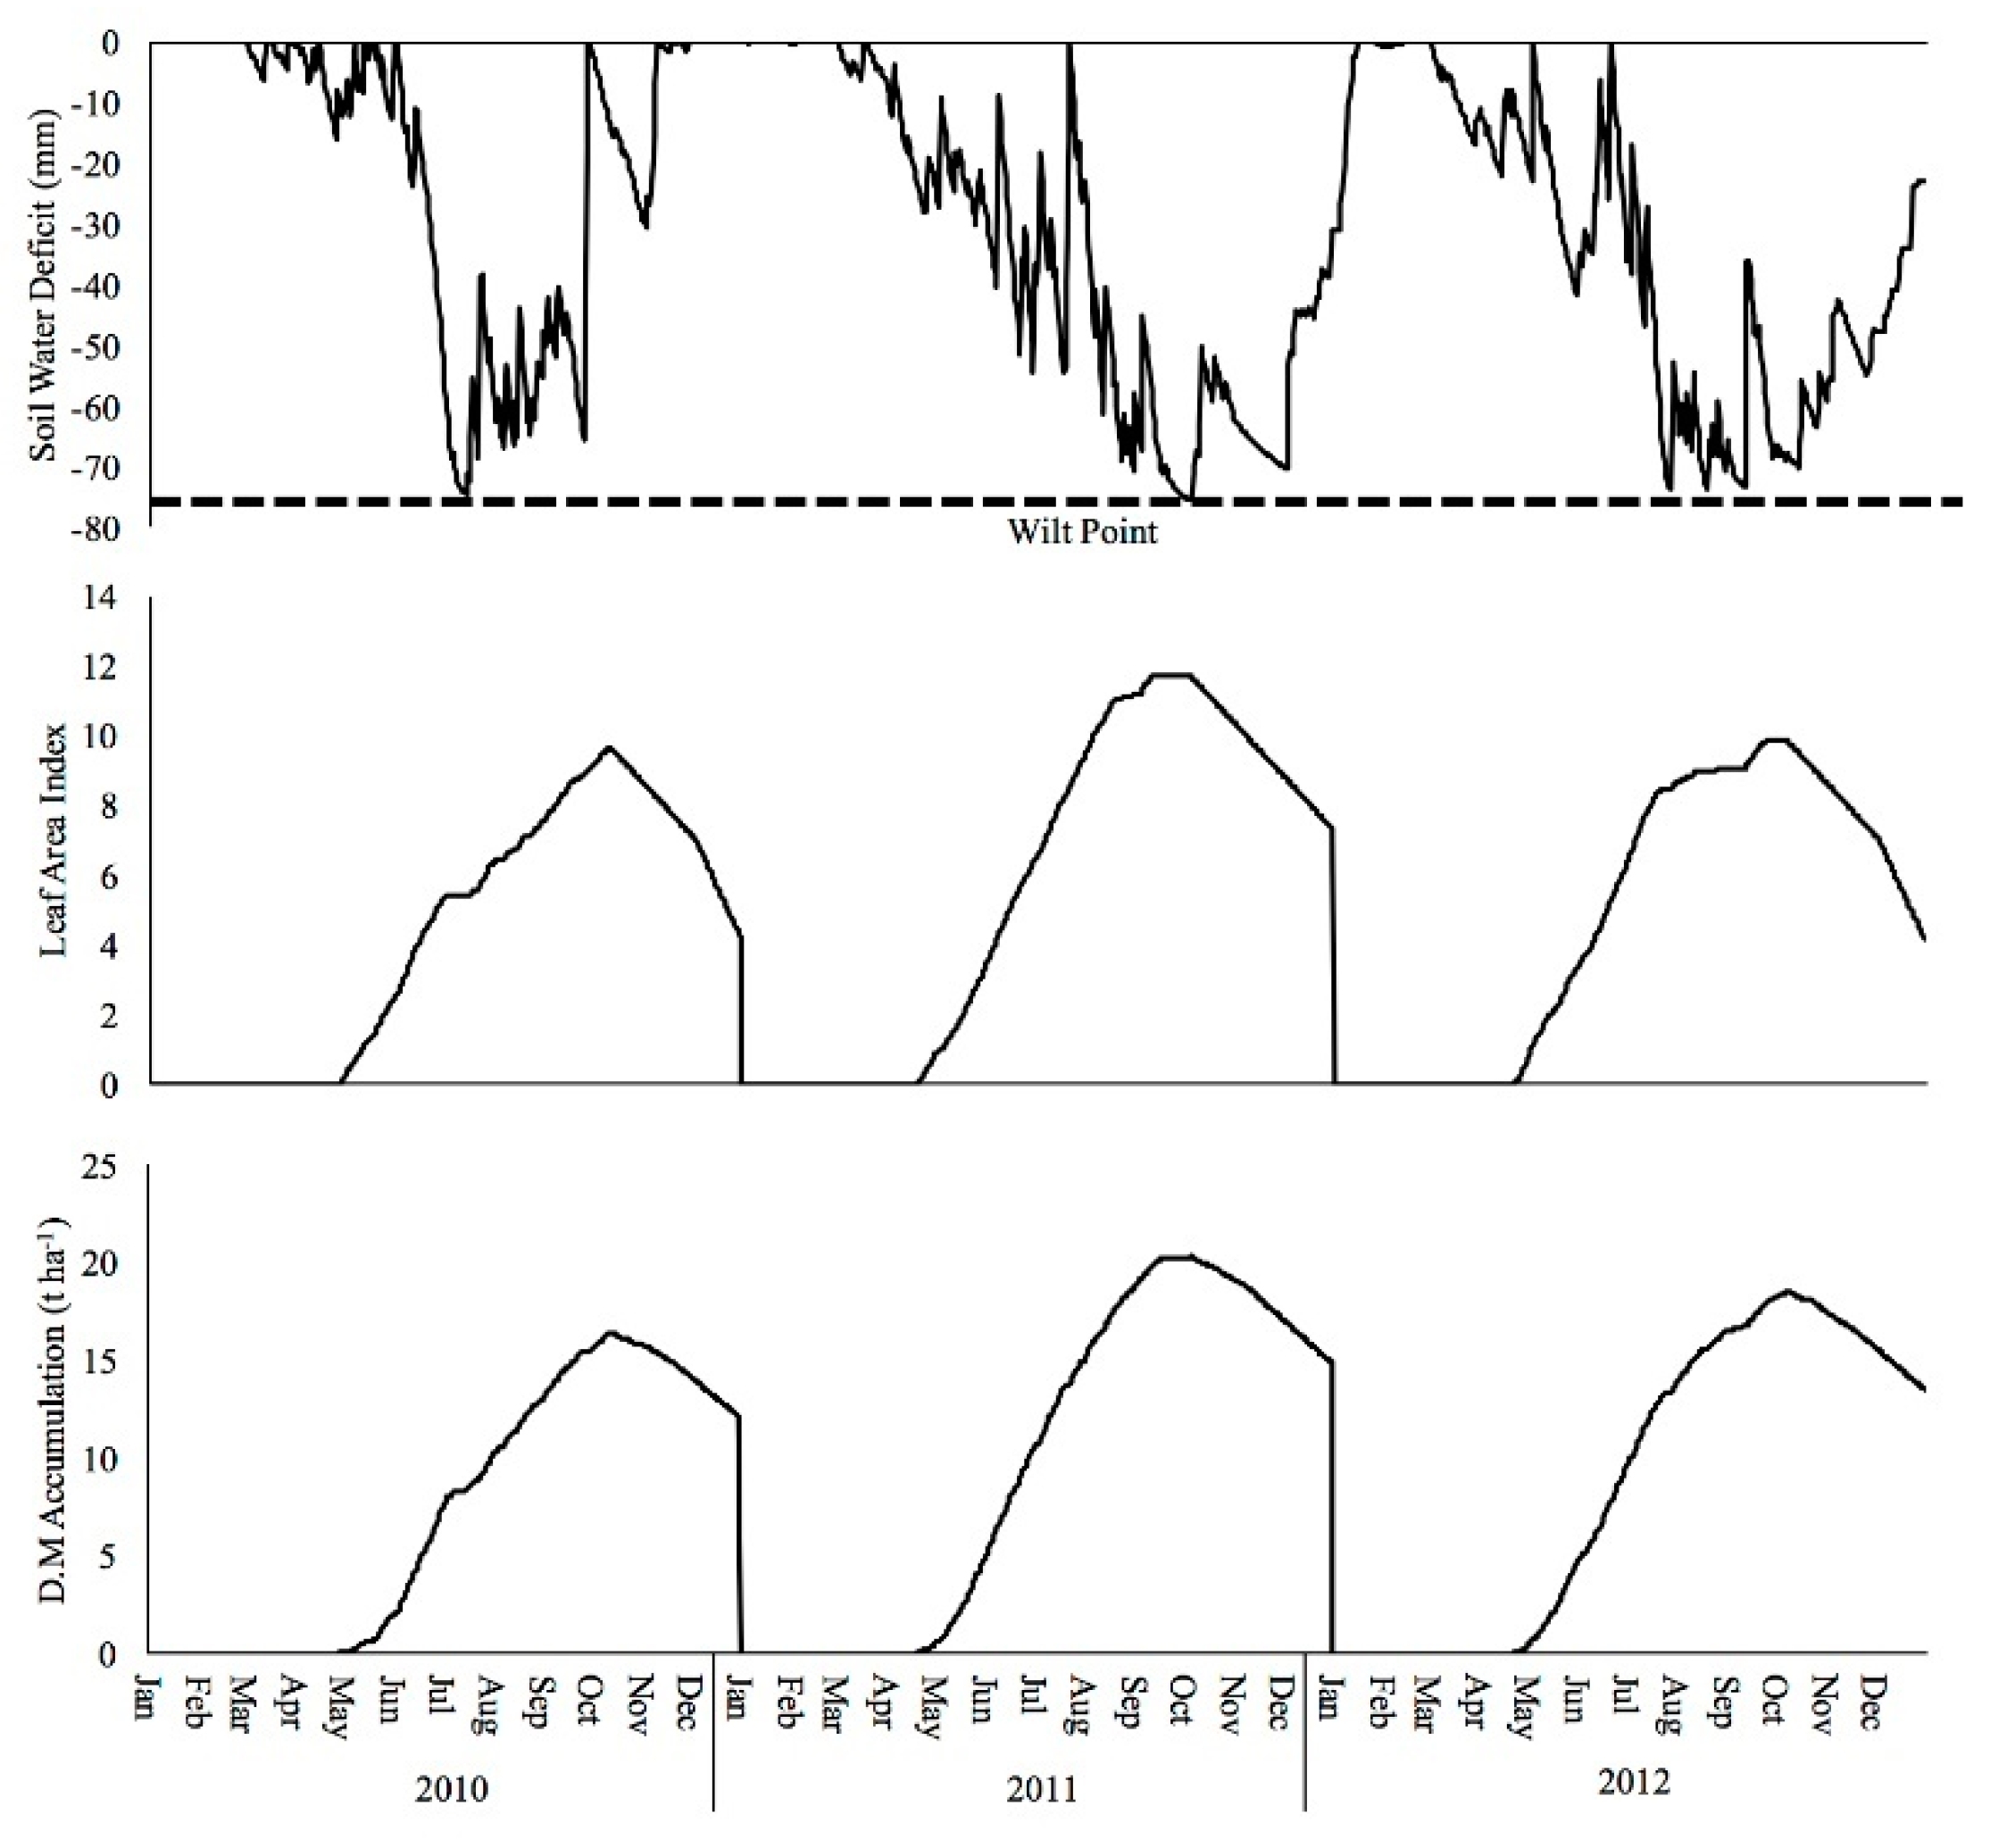
3.4. Soil Water, Drought Stress and Modelled Yields

The soil has a loamy top layer and a sand lower layer. Within the cumulative top 1 m profile, the field capacity was relatively low at 93 mm with a wilt point of 13 mm determined by the Campbell method [27]. The predicted peak yields (Figure 4) matched the measured yields (R2 = 0.86). The 2010 modelled yield was 16.9 t ha−1 compared to a measured yield of 16.5 ± 0.33 t ha−1; in 2011, these values were 20.9 t ha−1 compared to 20.1 ± 0.52 t ha−1 for the modelled and measured yields respectively, and in 2012, the modelled yield was 19.1 t ha−1 compared to a measured 19.5 ± 0.50 t ha−1.
The modelled time series indicated that drought stress early in the growing season reduced leaf formation in 2010 and late in the growing season in 2012; this reduced DM yields in those years compared to 2011 but the early water stress in 2010 had a larger impact (Figure 4). The model also indicated that the crop was water-limited and that with unlimited water peak yield would approach 30 t ha−1.

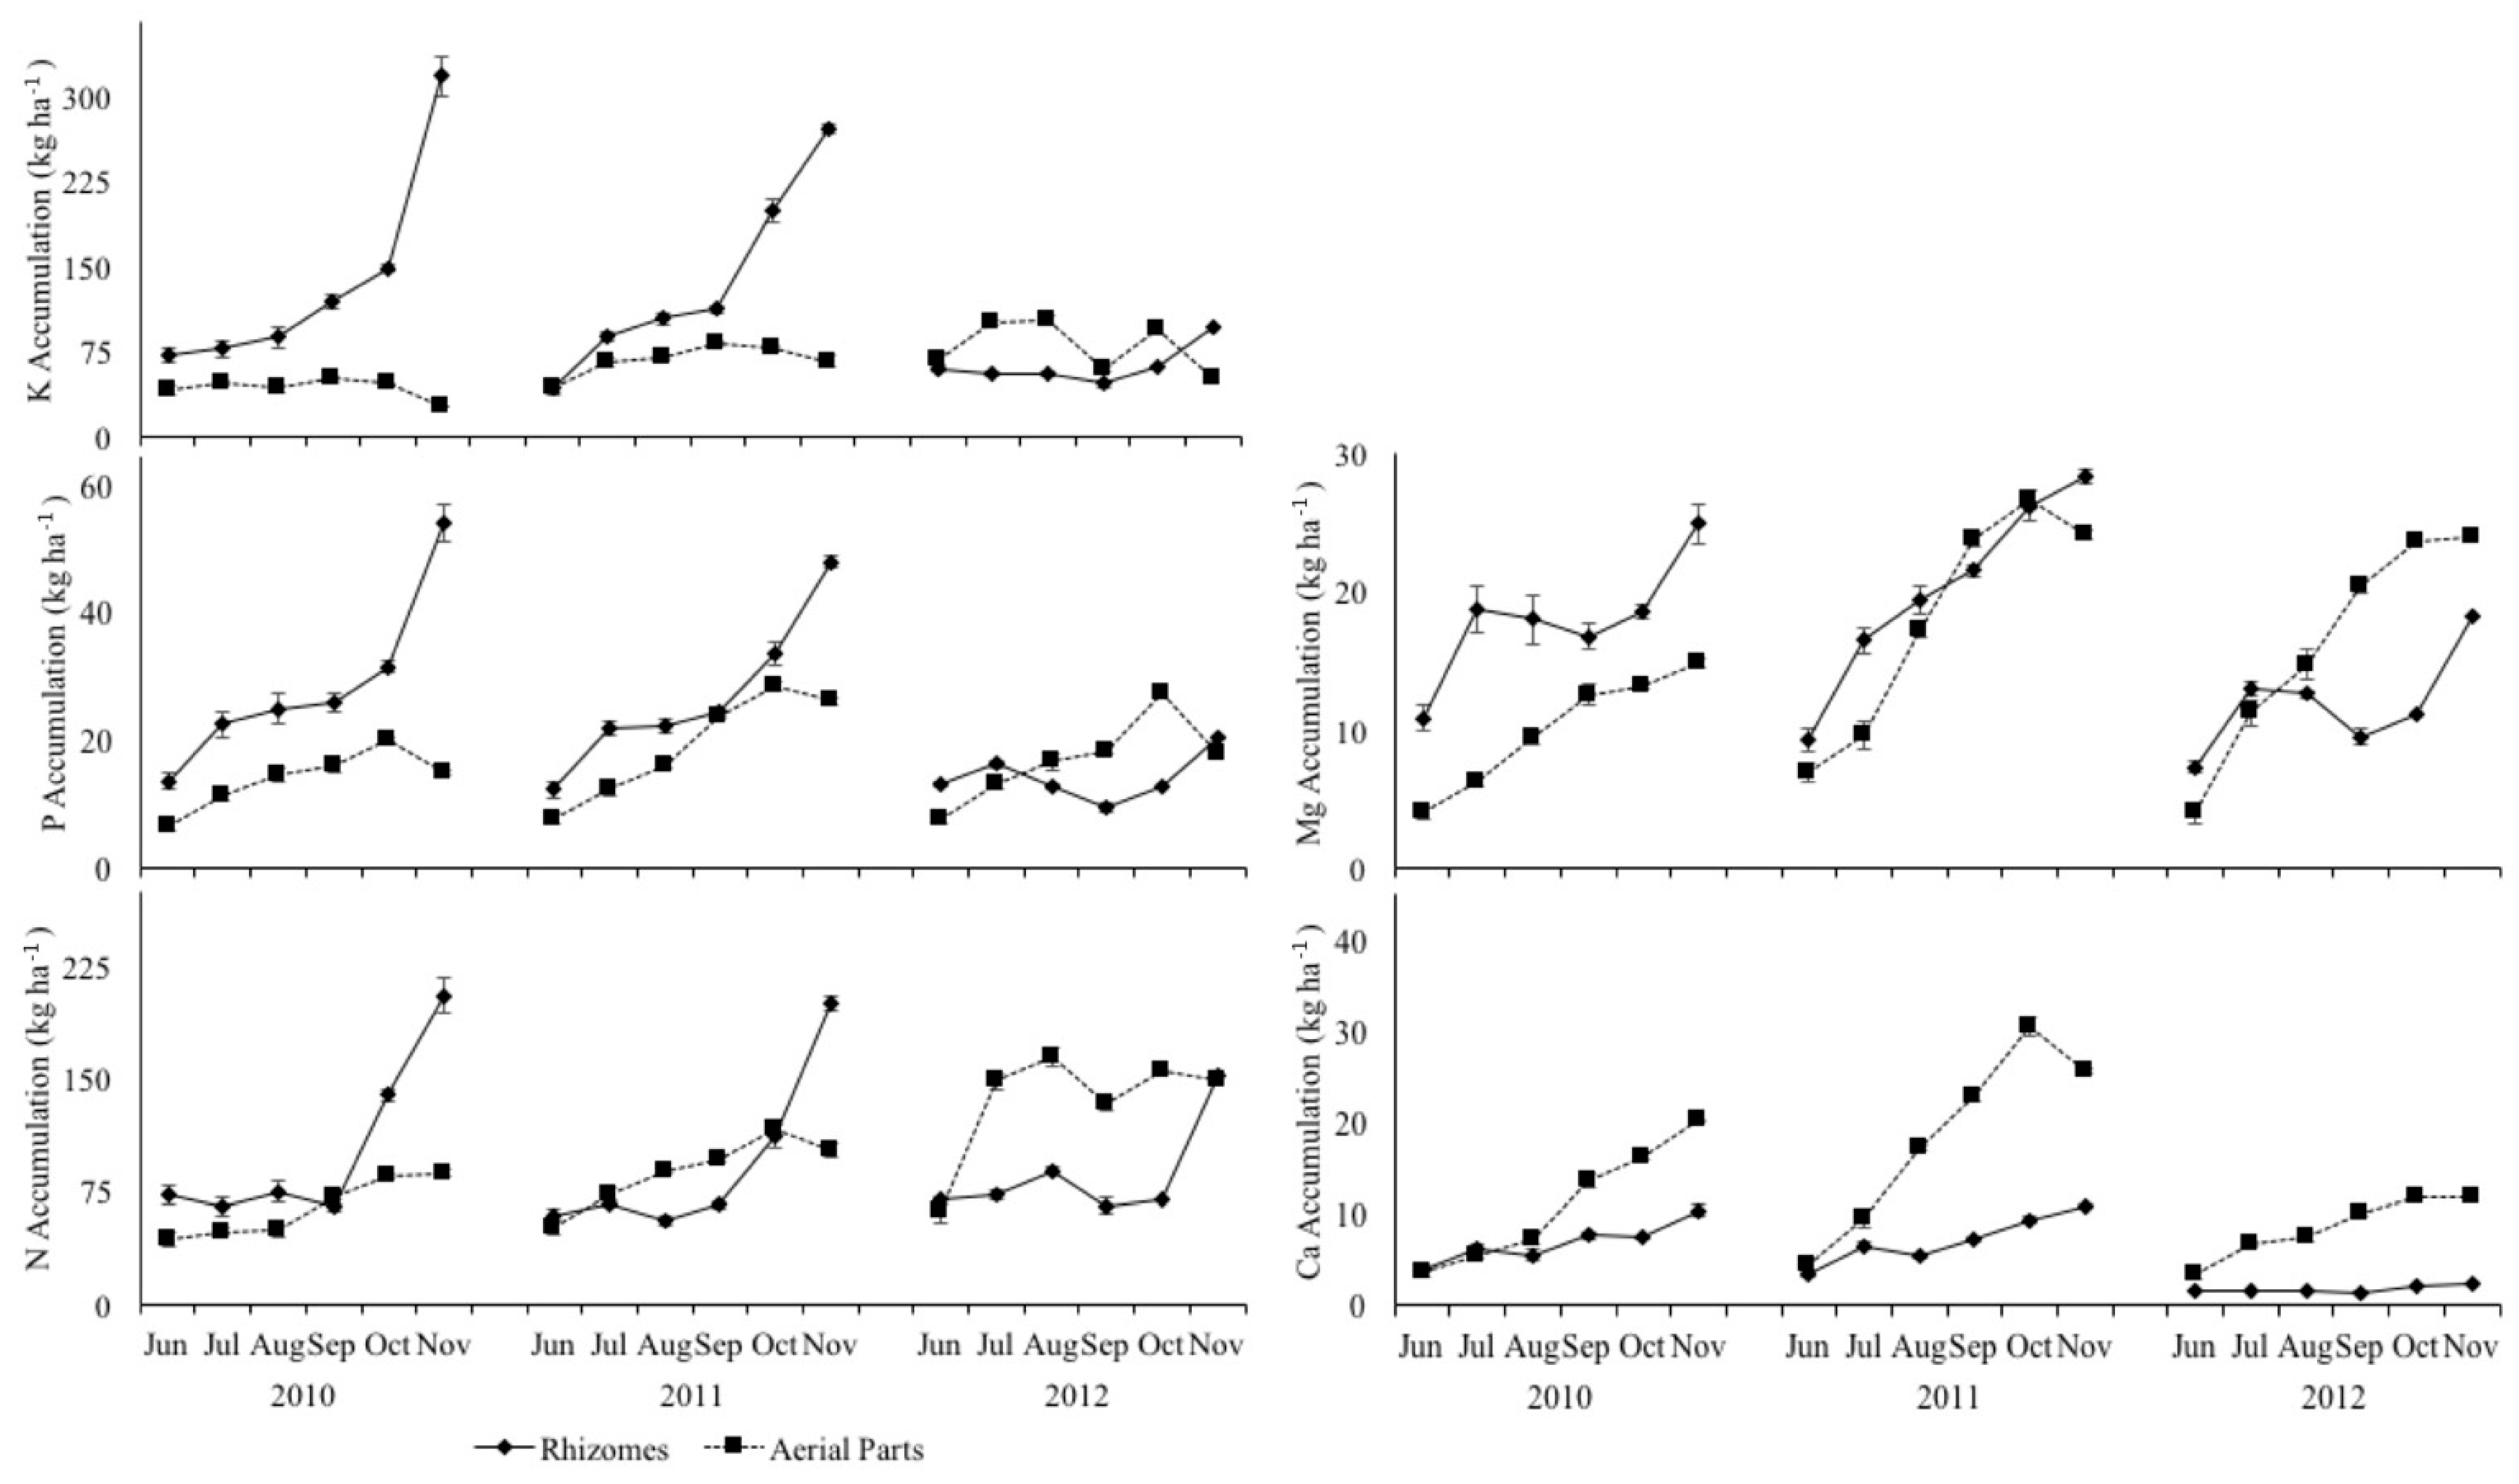
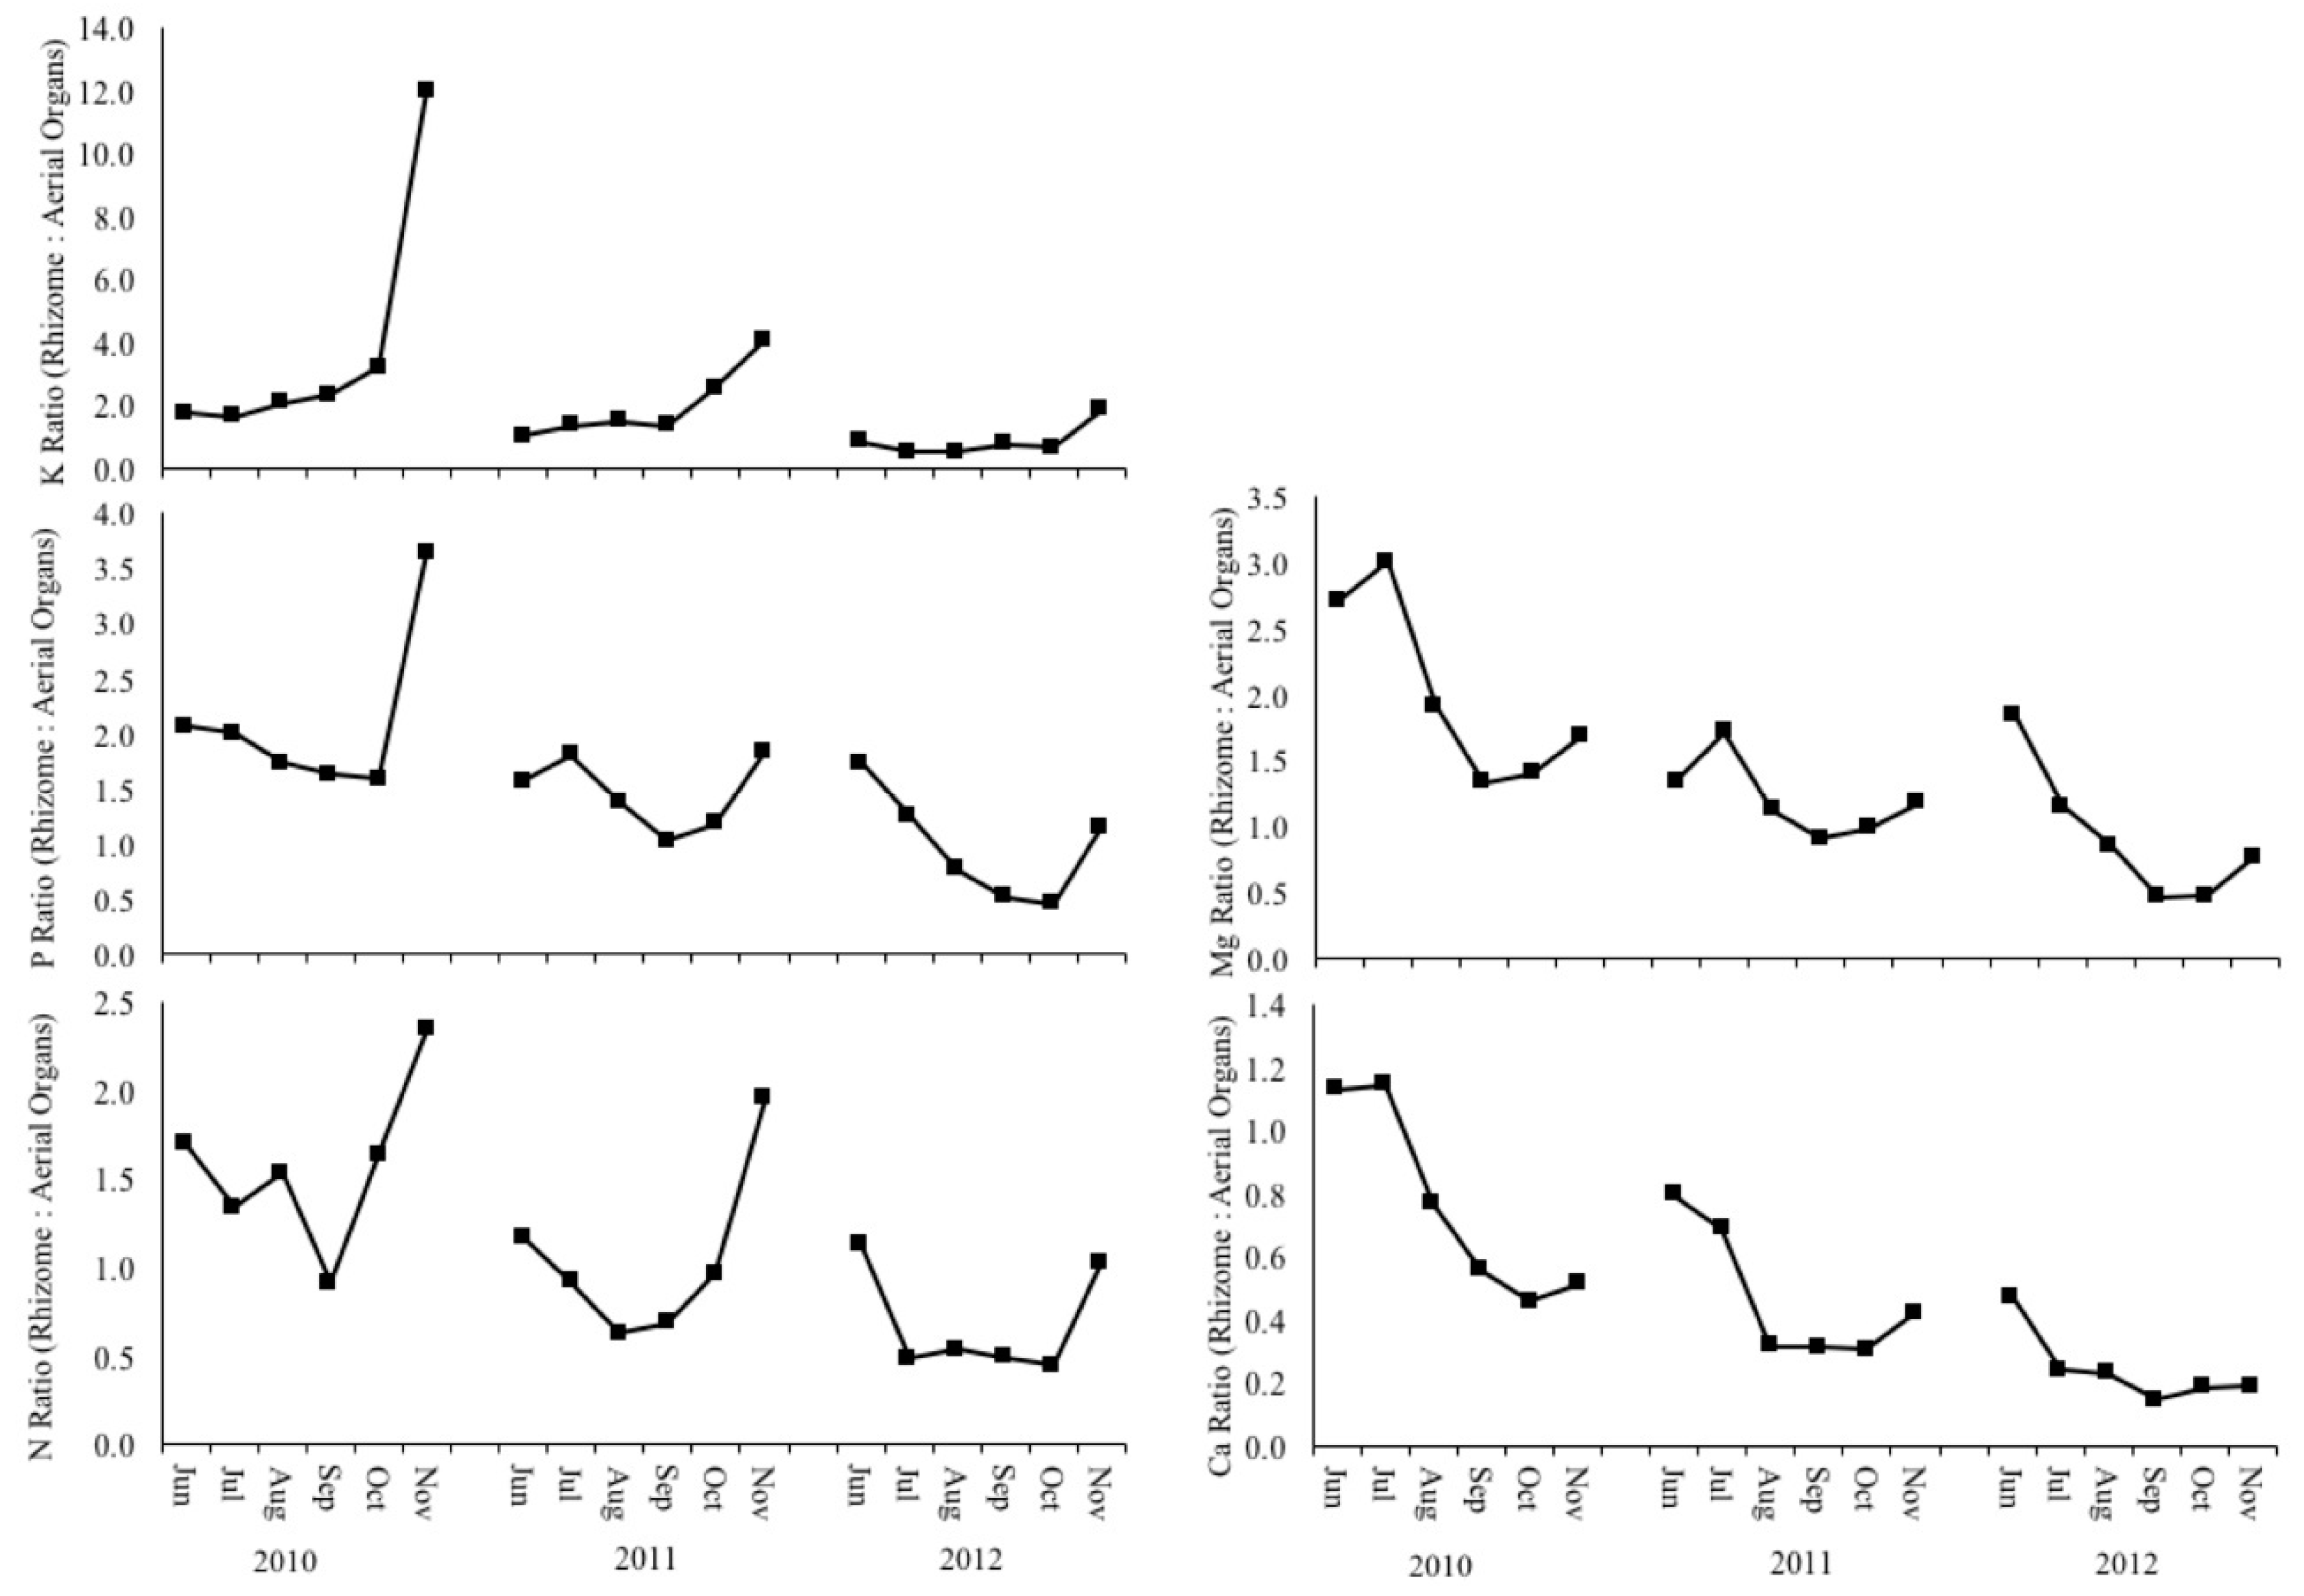
3.5. Biomass Quality and Macronutrient Management

The amount of rhizome was divided by the number of stems in each 0.25 m2 sample to estimate the weight of rhizome per stem. Except for K, most values of macronutrient concentrations per dry weight of rhizome associated with a single stem and macronutrient concentrations in the stem were highly correlated (Table 2). Correlations were higher for the years 2010 and 2011 than in 2012.
The amount of N, P and K in the aerial organs (stems and leaves) increased throughout the 2010 and 2011 seasons as might be expected due to increased biomass accumulation (Figure 5). In 2010 and 2011, the absolute amounts of N, P and K in rhizomes were higher than in aerial biomass with some exceptions. In each study year, for much of the growing season, nutrient concentrations within the rhizomes were analogous with those in the above ground biomass.
There was a large increase in the later months (October and November) of N, P and K content of rhizome. This increase was associated with an increase in the ratio of N, P and K in the rhizome compared with aerial biomass (Figure 6) but not a large decrease in absolute concentrations within aerial biomass (Figure 5). The trend was different in 2012; for example, N concentrations in the stems and leaves reached levels significantly higher (p > 0.01) than previous years. Despite the significantly higher level of N in above ground organs in 2012, the amount in the rhizomes did not decrease further than in 2010 and 2011, suggesting there was more N within the plant system. The ratio of nutrients in rhizome: aerial biomass showed a gradual decline across the three growing seasons (Figure 6) reflecting less nutrient in the rhizome and/or more contained in above ground biomass.
In 2012, the Ca content of rhizome and aerial biomass was significantly (p > 0.01) lower than in 2010 and 2011; however, Ca amounts were very different in both the rhizome and aerial biomass across the three studied years. Unlike N, P and K, Ca content was consistently higher in above ground biomass than in rhizome. For most months across the three-year study period, Ca in the above ground organs generally increased simultaneously with rhizome concentrations. There were some minor exceptions to this, such as November 2011, and the increase was less prominent in 2012. Magnesium amounts followed a similar trend to that of Ca; as accumulations in the rhizome increased, the above ground concentrations increased; however, the trends were less consistent throughout the season. In 2012, Mg levels in the rhizomes were significantly lower (p > 0.01) than in 2010 and 2011. Mg amounts in above ground biomass were significantly (p > 0.01) higher in 2011 and 2012 than in 2010, with no significant difference between 2011 and 2012. The trends evident for Ca and Mg may suggest that these elements are sourced from outside the plant, rather than translocating between the rhizomes and above ground organs.

4. Discussion

The dry matter yield was determined for the M. × giganteus in November of each year. To analyse how this yield was accumulated, the seasonal flux of fresh and dry matter in the rhizome and aerial parts of the plant was analysed by sequential harvests throughout the growing season. Finally, the flux of nutrients between rhizome and stem was analysed by apportioning biomass in the rhizome on a per stem basis and analysing the concentrations of nutrients in different parts of the plant.
Several studies conducted in Western Europe have determined the biomass yields of M. × giganteus at the end of the growing season, usually in late autumn, although the commercial harvest is mainly conducted in late winter/early spring in continental Europe [10,30,31,32]. Within the reported study, maximum yields were achieved in November of each growing season; later than previously reported by Beale and Long (1997) [8] and Himken et al. (1997) [11]. Based on the analyses conducted by Voća et al., it can be concluded that the biomass of Miscanthus (2021) [33] M. × giganteus is a good feedstock for the process of direct combustion. From a commercial perspective, it is favourable for biomass to contain less leaf matter if the feedstock is to be used for burning because this reduces the ash build-up and the risk of slagging within boilers [34]. Commercial harvests are made after the plants have usually undergone almost complete senescence [10], nutrients have been mobilised to the rhizome, most of the leaves have fallen, often plants have frozen, nutrients have leached from above ground biomass, and moisture content has decreased [14]. Such processes may affect several different macronutrient concentrations when plants reach physiological maturity [21]. For example, differences in yield and yield quality are present between M. × giganteus genotypes that differed developmentally [14]. Genotypes that senesce later have a longer growing season, often increasing the yield but at harvest, have greater nutrient concentrations in the above ground biomass as the translocation of the nutrients to rhizomes occurs later [10]. Less is known about the dynamics of biomass accumulation and macronutrient flux in M. × giganteus at different stages during the growing season [8,11,19,35]. The present study measured how the flux of biomass and macronutrient content changed in different plant organs throughout the season and how this was affected by meteorological conditions across three growing seasons in southwest Poland.
The study utilised a replicated trial that had been grown to maturity over three years from 2007 to 2009; rhizome fresh and dry weights in 2010 and 2011 were higher than in 2012 and this was attributed to harsh winter conditions and the freezing of some rhizomes. Rhizome fresh weight in a given year is considered to be closely related to the thermal conditions during winter dormancy; the rhizome is the overwintering component of M. × giganteus following the completion of senescence. It has been previously suggested that temperatures below −3 °C at a soil depth of 5 cm may be lethal to ~50% rhizomes of M. × giganteus [14]. In February 2012, temperatures dropped to −5.8 °C at a depth of 7 cm (data not shown) resulting in a ~67% decrease in rhizome fresh weight between November 2011 and November 2012 (Table 1).
Unexpectedly, the frost induced mortality of some rhizomes did not impact the 2012 dry matter yield. Air temperature is known to effect yields [36], and average temperatures in July and August were higher in 2012 than in 2011 (20.2 and 19.31 °C compared to 18.19 and 19.27 °C respectively). Increased seasonal interception of solar radiation increases productivity in M. × giganteus [37]. During July and August of 2012, solar radiation was significantly higher than the same months in 2010 and 2011 (average of 19.41 J m−2 over the two months in 2012, compared to 17.80 and 17.01 J m−2 in 2010 and 2011 respectively). Precipitation in July and August 2012 was close to the three-year average; however, in mid-July, the modelled soil water deficit reached the wilt point (Figure 4) suggesting that water availability does not explain the increased yields. The MISCANFOR model accurately predicted biomass yields throughout 2010 and 2011 but was unable to accurately predict the seasonal progression of yield in 2012. The MISCANFOR model was developed from the model MISCANMOD [24] which is used to describe the processes for light interception by the canopy and the effects of temperature and water stress on interception use efficiency. Although the final modelled yield was accurate (19.1 t ha−1 compared to a measured 19.5 ± 0.50 t ha−1), the higher yield evident during July was not predicted. The model uses several environmental parameters to predict yield and therefore it is likely that other factors were affecting yield. Stem number in 2012 was significantly less than in 2011 (Table 2) and the profile of stem elongation was sigmoid in 2011 and log linear in 2012 (Figure 2). A sigmoid profile may indicate a competitive canopy whereas the fewer stems present in 2012 may have produced a less competitive canopy that was able to more efficiently capture the high levels of solar radiation noted during summer of 2012. One could hypothesise that destruction of a proportion of the rhizome by freezing conditions may result in fewer active meristems [38], and that these meristems produced stems that experienced reduced intraspecific competition for light [39]. We predicted such stems would display lower canopy-induced senescence and this was confirmed by leaf nitrogen measurements which were higher in 2012 (Figure 6).
Nitrogen concentrations and fluxes followed similar general trends previously documented [8,10] with nitrogen concentrations in rhizomes decreasing throughout the growing season, up until September. This decrease in rhizome N is due to the spring mobilisation to above ground components of the plant [40]. During this time, it is expected that concentrations in the stems and leaves will increase, and this is evident in 2010 and 2011. It is of particular note that in 2012, the concentration of nitrogen in the aerial parts of the plants was significantly greater than in preceding years, reaching concentrations in June and July two times greater than in 2010 and 2011 (148 kg ha−1 in July 2012 compared to 72.7 and 48.4 kg ha−1 in July of 2011 and 2010 respectively). Levels of N in the rhizome in 2012 were not significantly lower than in 2010 and 2011; it is therefore unlikely that high N was due to significant remobilisation to the aerial parts from the rhizome but was largely from an increased uptake of nitrogen from soil. The N requirements of M. × giganteus are a subject of debate [40]; however, the transportation of N to aerial parts is partly dependant on the availability of N in the soil [8,9,10], and whilst N sourced from rhizome storage is significant, between 79% and 91% of N may originate from the soil [8,11]. In November 2011, the nitrogen level in the rhizomes was 200 kg ha−1. The rhizome was subsequently affected by freezing conditions in the winter of 2012, but it is likely some of the N released into the soil following the onset of decomposition of dead rhizome was translocated back into the crop in the 2012 growing season.
Few studies describe the P and K requirements of M. × giganteus and the impact of P and K fertilisation has not been definitively established [41]. P accumulation in above ground biomass reached maximum levels between May and June [8,11]. In the current study, maximum levels were reached in October of each year. Similarly, K concentrations reached maximum levels (September 2010 and 2011, August 2012) later than previously described (June [8] and May [11]). Overall P and K concentrations increased in both the rhizome and aerial parts during the growing season in 2010 and 2011. This simultaneous increase indicates that a large proportion of the nutrients are taken up from outside the plant system, rather than being remobilised between the rhizome and above ground biomass. P and K concentrations are known to be highly variable and dependant on soil conditions, and if K levels in the soil are high, then M. × giganteus may increase uptake [41]. In 2012, levels of P in the rhizomes dropped significantly and increased in above ground biomass. Previous studies suggested that between 18% and 36% of P is available for remobilisation [8,11]. The flux reported here suggests a larger portion of P was translocated between the rhizomes and above ground organs, and this may reflect the more active open canopy in 2012 as discussed above. K follows a similar trend to P in 2012. Mg and Ca concentrations in the plants showed little evidence of a flux between rhizomes and aerial parts. Concentrations of Mg and Ca in the rhizomes and above ground biomass mostly increased simultaneously throughout the growing season suggesting that they were predominantly sourced from the soil.

5. Conclusions

This study considers the seasonal accumulation of biomass accumulation and nutrient flux of the energy crop M. × giganteus. The growth, development and nutrient dynamics of a mature M. × giganteus varied across three growth seasons allowing the flux of nutrients to be studied across different growth dynamics. Rhizomes accounted for between 47.3% and 80.1% of yield depending on sampling date, whilst stems and leaves accounted for 3.4–31.6% and 16.5–21.1% respectively. During the growth season, rhizome dry weight increased from 6.8 ± 0.6 t ha−1–20.7 ± 1.1 t ha−1 in 2010, 5.8 ± 0.7 t ha−1–21.8 ± 0.9 t ha−1 in 2011 and 5.2 ± 0.8 t ha−1–11.4 ± 0.4 t ha−1 in 2012. Harsh winter conditions were found to significantly affect the biomass accumulation of rhizomes without having detrimental effects on above ground yields. Above ground biomass increased throughout each growth season, reaching maximum yields of 16.5 ± 0.4 t ha−1, 20.1 ± 0.5 t ha−1 and 19.9 ± 0.65 t ha−1 in November 2010, 2011 and 2012 respectively. Using meteorological data collected over the three study years, the MISCANFOR model was able to accurately predict the 2010 and 2011 yields and the development over the growth season. It is suggested that a less competitive canopy which was more efficient with regards to solar radiation energy conversion, and decreased meristem competition allowed the above ground yields in 2012 to remain unaffected by the overwintering loss of some rhizomes. The seasonal dynamics of the nutrients were mostly as previously documented in 2010 and 2011, especially for N, P and K. In 2012, the normal cycle changed and there was less evidence of nutrient translocation between the rhizomes and the stems and leaves. Instead, it appears that these nutrients were sourced from outside the plant system, and that the transportation of certain nutrients to the above ground organs was more dependent on availability within the soil. This variation in nutrient flux within and without the plant was different for each nutrient but illustrates the potential resilience of perennial M. × giganteus resulting from its ability to access nutrients from different sources. Such resilience permits yield to be sustained across a range of diverse environmental conditions without the need for additional agronomic inputs.

Author Contributions

Conceptualization, A.K. and M.K.; methodology, A.K. and M.K.; formal analysis, M.M., A.F.H., W.H, S.K. and D.K.; investigation, W.H. and K.C.; writing—original draft preparation, M.M. S.B., W.H., A.J.-R. and M.S.-A.; writing—review and editing, P.R.H.R., A.J.-R. and M.S.-A.; supervision, A.K. and J.C.-B. All authors have read and agreed to the published version of the manuscript.

Funding

J.C.B. and P.R.H.R. were funded by the Biotechnology and Biological Sciences Research Council strategic programme grant on Resilient Crops (BBS/E/W/10963A01).

Institutional Review Board Statement

Not applicable.

Informed Consent Statement

Not applicable.

Data Availability Statement

Not applicable.

Conflicts of Interest

The authors declare no conflict of interest.

References

  1. Heaton, E.A.; Long, S.P.; Voigt, T.P.; Jones, M.B.; Clifton-Brown, J. Miscanthus for Renewable Energy Generation European Union Experience and Projections for Illinois. Rev. Environ. Sci. Bio. Tech. 2004, 9, 433–451. [Google Scholar] [CrossRef]
  2. Magenau, E.; Kiesel, A.; Clifton-Brown, J.; Lewandowski, I. Influence of cutting height on biomass yield and quality of miscanthus genotypes. GCB Bioenergy 2021, 8, 187. [Google Scholar] [CrossRef]
  3. Nsanganwimana, F.; Al Souki, K.S.; Waterlot, C.; Douay, F.; Pelfrêne, A.; Ridošková, A.; Louvel, B.; Pourrut, B. Potentials of Miscanthus × giganteus for phytostabilization of trace element-contaminated soils: Ex situ experiment. Ecotoxicol. Environ. Saf. 2021, 214, 112125. [Google Scholar] [CrossRef]
  4. Parrish, D.J.; Fike, J.H. The Biology and Agronomy of Switchgrass for Biofuels. Crit. Rev. Plant. Sci. 2005, 24, 423–459. [Google Scholar] [CrossRef]
  5. Kiesel, A.; Lewandowski, I. Miscanthus as biogas substrate—cutting tolerance and potential for anaerobic digestion. GCB Bioenergy 2017, 9, 153–167. [Google Scholar] [CrossRef]
  6. Dohleman, F.G.; Heaton, E.A.; Arundale, R.A.; Long, S.P. Seasonal dynamics of above- and below-ground biomass and nitrogen partitioning in Miscanthus × gigante us and Panicum virgatum across three growing seasons. GCB Bioenergy 2012, 4, 534–544. [Google Scholar] [CrossRef] [Green Version]
  7. Ouattara, M.S.; Laurent, A.; Ferchaud, F.; Berthou, M.; Borujerdi, E.; Butier, A.; Malvoisin, P.; Romelot, D.; Loyce, C. Evolution of soil carbon stocks under Miscanthus × giganteus and Miscanthus sinensis across contrasting environmental conditions. GCB Bioenergy 2021, 13, 161–174. [Google Scholar] [CrossRef]
  8. Beale, C.V.; Long, S.P. Seasonal Dynamics of Nutrient Accumulation and Partitioning in the Perrenial C4-Grasses Miscanthus × giganteus and Spartina Cynosurodies. Biomass Bioenergy 1997, 12, 419–428. [Google Scholar] [CrossRef]
  9. Christian, D.G.; Poulton, P.R.; Riche, A.B.; Yates, N.E.; Todd, A.D. The recovery over several seasons of 15 N-labelled fertilizer applied to Miscanthus × giganteus ranging from 1 to 3 years old. Biomass Bioenergy 2006, 30, 125–133. [Google Scholar] [CrossRef]
  10. Lewandowski, I.; Clifton-Brown, J.C.; Scurlock, J.M.O.; Huisman, W. Miscanthus: European experience with a novel energy crop. Biomass Bioenergy 2000, 19, 209–227. [Google Scholar] [CrossRef]
  11. Himken, M.; Lammel, J.; Neukirchen, D.; Czypionka-Krause, U.; Olfs, H.W. Cultivation of Miscanthus under West European conditions: Seasonal changes in dry matter production, nutrient uptake and remobilization. Plant Soil 1997, 189, 117–126. [Google Scholar] [CrossRef]
  12. Clifton-Brown, J.C.; Breuer, J.; Jones, M.B. Carbon mitigation by the energy crop, Miscanthus. Glob. Chang. Biol. 2007, 13, 2296–2307. [Google Scholar] [CrossRef]
  13. Borkowska, H.; Lipiński, W. Content of selected elements in biomass of several species of energy plants. Acta Agrophys. 2007, 10, 287–292. [Google Scholar]
  14. Jørgensen, U. Genotypic variation in dry matter accumulation and content of N, K and Cl in Miscanthus in Denmark. Biomass Bioenergy 1997, 12, 155–169. [Google Scholar] [CrossRef]
  15. Kahle, P.; Beuch, S.; Boelcke, B.; Leinweber, P.; Schulten, H.R. Cropping of Miscanthus in Central Europe: Biomass production and influence on nutrients and soil organic matter. Eur. J. Agron. 2001, 15, 171–184. [Google Scholar] [CrossRef]
  16. Wyżgolik, B.; Surowiec, E.; Brzakalik, K. Mineral balance in Miscanthus × giganteus. In Alternative Plants for Sustainable Agriculture; PAS: Poznań, Poland, 2006; pp. 115–120. [Google Scholar]
  17. Clifton-Brown, J.C.; Lewandowski, I. Screening Miscanthus genotypes in field trials to optimize biomass yield and quality in Southern Germany. Eur. J. Agron. 2002, 16, 97–110. [Google Scholar] [CrossRef]
  18. Atienza, S.G.; Satovic, Z.; Petersen, K.K.; Dolstra, O.; Martín, A. Identification of QTLs influencing combustion quality in Miscanthus sinensis Anderss. II. Chlorine and potassium content. Theor. Appl. Genet. 2003, 107, 857–863. [Google Scholar] [CrossRef]
  19. Kalembasa, D.; Malinowska, E. Zawartość potasu w różnych klonach trawy Miscanthus w zależności od nawożenia mineralnego. Nawozy i Nawożenie. Nawozy Nawożenie 2005, 3, 359–364. [Google Scholar]
  20. Kalembasa, D.; Malinowska, E.; Jaremko, D.; Jezowski, S. Zawartość potasu w różnych klonach trawy Miscanthus w zależności od nawożenia mineralnego. Zesz. Probl. Postęp. Nauk Rol. 2001, 480, 77–84. [Google Scholar]
  21. Buzar, M.; Galek, R.; Góra, J.; Grzyś, E.; Hurej, M.; Kotecki, A.; Kozak, M.; Piszcz, U.; Pląskowska, E.; Pusz, W.; et al. Uprawa Miskanta Olbrzymiego: Energetyczne i Pozaenergetyczne Możliwości Wykorzystania Słomy; Kotecki, A., Ed.; Wydawnictwo Uniwersytetu Przyrodniczego We Wrocławiu: Wrocław, Poland, 2010; p. 186. (In Polish) [Google Scholar]
  22. Clifton-Brown, J.; Hastings, A.; Mos, M.; McCalmont, J.P.; Ashman, C.; Awty-Carroll, D.; Cerazy, J.; Chiang, Y.-C.; Cosentino, S.; Cracroft-Eley, W.; et al. Progress in upscaling Miscanthus biomass production for the European bio-economy with seed-based hybrids. GCB Bioenergy 2017, 9, 6–17. [Google Scholar] [CrossRef] [Green Version]
  23. De Wit, M.; Faaij, A. European biomass resource potential and costs. Biomass Bioenergy 2010, 34, 188–202. [Google Scholar] [CrossRef]
  24. Hastings, A.; Clifton-Brown, J.; Wattenbach, M.; Stampl, P.; Mitchell, C.P.; Smith, P. Potential of Miscanthus grasses to provide energy and hence reduce greenhouse gas emissions. Agron. Sustain. Dev. 2008, 28, 465–472. [Google Scholar] [CrossRef] [Green Version]
  25. IUNG-PIB. Available online: http://www.iung.pulawy.pl/ (accessed on 13 September 2020).
  26. Kjeldahl, J. Neue Methode zur Bestimmung des Stickstoffs in organischen Körpern. Z. Für Anal. Chemie. 1883, 22, 366–382. [Google Scholar] [CrossRef] [Green Version]
  27. Campbell, G.S. Soil physics with Basic: Transport models for soil-plant systems. Dev. Soil Sci. 1985, 14, 6–134. [Google Scholar]
  28. Hastings, A.; Clifton-Brown, J.; Wattenbach, M.; Mitchell, C.P.; Smith, P. The development of MISCANFOR, a new Miscanthus crop growth model: Towards more robust yield predictions under different climatic and soil conditions. GCB Bioenergy 2009, 1, 154–170. [Google Scholar] [CrossRef]
  29. Allen, R.G.; Pereira, L.S.; Raes, D.; Smith, M. Crop Evapotranspration-Guidelines for computing crop water requirements—FAO Irrigation and drainage paper 56. FAO Rome 1998, 300, D05109. [Google Scholar]
  30. Christian, D.G.; Riche, A.B.; Yates, N.E. Growth, yield and mineral content of Miscanthus × giganteus grown as a biofuel for 14 successive harvests. Ind. Crops Prod. 2008, 28, 320–327. [Google Scholar] [CrossRef]
  31. Lewandowski, I. Propagation method as an important factor in the growth and development of Miscanthus × giganteus. Ind. Crops Prod. 1998, 8, 229–245. [Google Scholar] [CrossRef]
  32. Yazaki, Y.; Mariko, S.; Koizumi, H. Carbon dynamics and budget in a Miscanthus sinensis grassland in Japan. Ecol. Res. 2004, 19, 511–520. [Google Scholar] [CrossRef]
  33. Voća, N.; Leto, J.; Karažija, T.; Bilandžija, N.; Peter, A.; Kutnjak, H.; Šurić, J.; Poljak, M. Energy Properties and Biomass Yield of Miscanthus × giganteus Fertilized by Municipal Sewage Sludge. Molecules 2021, 26, 4371. [Google Scholar] [CrossRef] [PubMed]
  34. Baxter, X.C.; Darvell, L.I.; Jones, J.M.; Barraclough, T.; Yates, N.E.; Shield, I. Miscanthus combustion properties and variations with Miscanthus agronomy. Fuel 2014, 117, 851–869. [Google Scholar] [CrossRef] [Green Version]
  35. Kalembasa, D.; Janinhoff, A.; Malinowska, E.; Jaremko, D.; Jezowski, S. Zawartość siarki w wybranych klonach trawy Miscanthus. J. Elem. 2005, 10, 309–314. [Google Scholar]
  36. Richter, G.M.; Riche, A.B.; Dailey, A.G.; Gezan, S.A.; Powlson, D.S. Is UK biofuel supply from Miscanthus water-limited? Soil Use Manag. 2008, 24, 235–245. [Google Scholar] [CrossRef]
  37. Dohleman, F.G.; Long, S.P. More productive than maize in the Midwest: How does Miscanthus do it? Plant Physiol. 2009, 150, 2104–2115. [Google Scholar] [CrossRef] [Green Version]
  38. Peixoto, M.d.M.; Friesen, P.C.; Sage, R.F. Winter cold-tolerance thresholds in field-grown Miscanthus hybrid rhizomes. J. Exp. Bot. 2015, 66, 4415–4425. [Google Scholar] [CrossRef] [Green Version]
  39. Collison, R.F.; Raven, E.C.; Pignon, C.P.; Long, S.P. Light, Not Age, Underlies the Maladaptation of Maize and Miscanthus Photosynthesis to Self-Shading. Front. Plant Sci. 2020, 11, 783. [Google Scholar] [CrossRef]
  40. Strullu, L.; Cadoux, S.; Preudhomme, M.; Jeuffroy, M.H.; Beaudoin, N. Biomass production and nitrogen accumulation and remobilization by Miscanthus × giganteus as influenced by nitrogen stocks in belowground organs. Field Crops Res. 2011, 121, 381–391. [Google Scholar] [CrossRef]
  41. Cadoux, S.; Riche, A.B.; Yates, N.E. Machet, J.-M. Nutrient requirements of Miscanthus × giganteus: Conclusions from a review of published studies. Biomass Bioenergy 2012, 38, 14–22. [Google Scholar] [CrossRef]
Figure 1. Precipitation, average wind speed, average temperature and solar radiation between January 2010 and December 2012 in Wroclaw, Poland (1 km from experimental plantation).
Agronomy 11 01679 g001
Figure 2. Change in leaf number (upper panel) and plant height (lower panel) across the three years 2010–2012 (growth years 4 to 6) of M. × giganteus growing in the Lower Silesia Region of Poland. Values were estimated from 10 randomly selected stems within a randomly chosen 0.25 m2 to produce a plot average which was then averaged across 4 replicated plots (legend indicates growth year; bar is standard error n = 4; lines represent fit of 3rd order polynomial).
Agronomy 11 01679 g002
Figure 3. Dry weight yield across three years 2010–2012 (growth years 4 to 6) of M. × giganteus growing in the Lower Silesia Region of Poland. Legends indicate growth year; bar, standard error n = 4.
Agronomy 11 01679 g003
Figure 4. Modelled time series of: soil water deficit (SWD) (upper panel), leaf area index (middle panel) and dry matter yields in Mg ha-1 (lower panel) during the growing seasons 2010, 2011 and 2012 plotted against journal day. The wilt point is shown on the SWD curve to indicate timing of drought stress.
Agronomy 11 01679 g004
Figure 5. Macronutrients (N, P, K, Ca and Mg) accumulation by rhizomes and aerial parts in years 2010–2012.
Agronomy 11 01679 g005
Figure 6. Rhizome: Aerial organ ratio of N, P, K, Ca and Mg in the M. × giganteus biomass in years 2010–2012.
Agronomy 11 01679 g006
Table 1. Fresh weight and water content of rhizomes, and average number of stems per plant across three years 2010–2012 (growth years 4 to 6) of M. × giganteus growing in the Lower Silesia Region of Poland.
Average Fresh Weight of Rhizomes from 0.25 m2 (g)Water Content of Rhizomes (g kg−1)Average Number of Stems Per Plant
201020112012201020112012201020112012
June692.5 ± 55.8522.5 ± 61.2603.5 ± 42.3755.8 ± 2.5722.5 ± 2.8748.2 ± 2.115.8 ± 1.711.3 ± 1.510.5 ± 1.0
July976.0 ± 83.5964.3 ± 60.0701.0 ± 81.7681.7 ± 2.2715.0 ± 2.2710.8 ± 4.219.0 ± 0.812.5 ± 1.011.3 ± 0.9
August950.5 ± 105.3990.0 ± 40.7801.5 ± 21.2634.2 ± 6.3651.7 ± 2.9738.3 ± 2.916.0 ± 1.012.3 ± 0.59.8 ± 0.5
September951.0 ± 37.8955.3 ± 38.9556.0 ± 25.1600.8 ± 8.2625.8 ± 2.1671.7 ± 2.915.8 ± 0.914.5 ± 0.69.3 ± 0.5
October1129.0 ± 40.01377.3 ± 41.0659.8 ± 25.9588.3 ± 4.0660.0 ± 7.1720.0 ± 4.116.0 ± 0.015.3 ± 0.69.8 ± 0.5
November1904.8 ± 112.21741.8 ± 59.7821.3 ± 34.3727.5 ± 1.6687.5 ± 4.8652.5 ± 2.816.8 ± 0.514.8 ± 0.59.8 ± 0.3
± Standard error.
Table 2. Correlation results of biomass of rhizome per stem and nutrient concentration in stem (** denotes that R is significant at p > 0.05).
201020112012
NPKCaMgNPKCaMgNPKCaMg
R0.890.800.260.860.910.860.880.890.900.820.590.40−0.330.000.66
**** ****************** **
Publisher’s Note: MDPI stays neutral with regard to jurisdictional claims in published maps and institutional affiliations.

