Article

Cropland Suitability Assessment Using Satellite-Based Biophysical Vegetation Properties and Machine Learning

1
Faculty of Agrobiotechnical Sciences Osijek, Josip Juraj Strossmayer University of Osijek, Vladimira Preloga 1, 31000 Osijek, Croatia
2
Faculty of Geodesy, University of Zagreb, Kačićeva 26, 10000 Zagreb, Croatia
3
Department of Biology, Josip Juraj Strossmayer University of Osijek, Cara Hadrijana 8/A, 31000 Osijek, Croatia
*
Author to whom correspondence should be addressed.
Agronomy 2021, 11(8), 1620; https://doi.org/10.3390/agronomy11081620
Submission received: 1 July 2021 / Revised: 6 August 2021 / Accepted: 13 August 2021 / Published: 16 August 2021
(This article belongs to the Special Issue Remote Sensing in Agriculture)

Abstract

:
The determination of cropland suitability is a major step for adapting to the increased food demands caused by population growth, climate change and environmental contamination. This study presents a novel cropland suitability assessment approach based on machine learning, which overcomes the limitations of the conventional GIS-based multicriteria analysis by increasing computational efficiency, accuracy and objectivity of the prediction. The suitability assessment method was developed and evaluated for soybean cultivation within two 50 × 50 km subsets located in the continental biogeoregion of Croatia, in the four-year period during 2017–2020. Two biophysical vegetation properties, leaf area index (LAI) and a fraction of absorbed photosynthetically active radiation (FAPAR), were utilized to train and test machine learning models. The data derived from a medium-resolution satellite mission PROBA-V were prime indicators of cropland suitability, having a high correlation to crop health, yield and biomass in previous studies. A variety of climate, soil, topography and vegetation covariates were used to establish a relationship with the training samples, with a total of 119 covariates being utilized per yearly suitability assessment. Random forest (RF) produced a superior prediction accuracy compared to support vector machine (SVM), having the mean overall accuracy of 76.6% to 68.1% for Subset A and 80.6% to 79.5% for Subset B. The 6.1% of the highly suitable FAO suitability class for soybean cultivation was determined on the sparsely utilized Subset A, while the intensively cultivated agricultural land produced only 1.5% of the same suitability class in Subset B. The applicability of the proposed method for other crop types adjusted by their respective vegetation periods, as well as the upgrade to high-resolution Sentinel-2 images, will be a subject of future research.

1. Introduction

The sustainability of present agricultural production faces severe global challenges in the form of rapid population growth [1], climate change [2] and increasing environmental contamination [3]. These factors are projected to cause serious global food nutrient deficiency by 2050 [4], thus urging for more efficient utilization of the current agricultural land. Current agricultural land management plans are frequently based on obsolete environmental conditions and monetary priorities [5], so their upgrade should be a first step in improving agricultural production systems. With the selection of suboptimal locations to cultivate crops, farmers often turn to using excessive mineral fertilizers and pesticides to achieve desired yields, damaging the ecosystem in the process [6]. Determining the cropland suitability for major crop types is the mandatory process for efficient agricultural land management planning [7]. This procedure is a key basis of globally sustainable agriculture and food security, meeting the Sustainability Development Goals of the United Nations [8]. Soybean has a particularly increasing importance within crop rotation systems on a global scale, with a constant increase of yield and harvested land in all world regions from 1979 to projections in 2030 [9]. According to the most recent World Agricultural Supply and Demand Estimates report, its use for food, oil and biofuel production is high and is further expected to grow in the forthcoming years [10]. This indicates a high priority for solving the problematics of cropland suitability determination limitations and more efficient soybean cultivation systems globally.
Present state-of-the-art methods of cropland suitability determination are most commonly based on the geographic information system (GIS)-based multicriteria analysis, combined with the advanced criteria weighing procedures, like the Analytic Hierarchy Process (AHP). Numerous cropland suitability determination studies based on the GIS-based multicriteria analysis of both various major [11,12] and obscure crop types [13] were successfully performed. Remote sensing data from global open data satellite missions were among the fundamental data sources in these analyses [14,15]. A high degree of flexibility in the suitability determination process is one of the main advantages of GIS-based multicriteria analysis being widely applied globally [16]. However, this method has some distinctive disadvantages, which were only partially solved so far. The most obvious one is the overreliance on the user’s subjective assessment of criteria selection and importance, especially within the AHP process. AHP is limited to five to nine criteria or criteria groups as per the recommendations of Saaty and Ozdemir [17], so the inclusion of additional important covariates results in more complex processing. The entire method is consequentially more susceptible to human-made blunders in pairwise comparison and criteria weight determination [18]. At the same time, the inclusion of a limited number of environmental factors results in the incomplete representation of cropland suitability. The accuracy assessment of the conventional GIS-based multicriteria analysis results is often non-existent, with some successfully performed approaches using ground truth yield data [12] or satellite-derived vegetation indices [11], which include only a segment of cropland suitability in the validation process. The possibility of an objective and easily accessible validation procedure for cropland suitability results would ensure a straightforward comparison between the prediction models and suitability results of multiple crop types [11]. This would also ensure the integration of various cropland suitability results into a unique agricultural land management foundation.
Machine learning algorithms present a possible solution to the abovementioned limitations of the GIS-based multicriteria analysis in cropland suitability assessment. They provided more efficient modelling of non-linear relationships of various environmental features and covariate data, compared to the parametric methods in recent studies [19]. Its efficiency is primarily caused due to the ability to integrate complex climate, soil and topography factors into a prediction model, unlike conventional statistical methods [20]. At the same time, the user is not expected to establish the relationships between these data. The user’s main task in the machine learning prediction is the determination of covariates that are relevant to the study aim to avoid redundancy and possible bias due to the inaccurate or irrelevant covariate selection. So far, machine learning has been widely utilized with satellite-derived vegetation indices for the detection of crop rotation systems [21], crop health status [22], crop type distribution [23] and yield prediction [24]. Over the past few years, some initiatives of the machine learning application for cropland suitability assessment have achieved promising but limited results. Taghizadeh-Mehrjardi et al. [25] proved the superiority of machine learning methods compared to traditional cropland suitability determination procedures. They determined cropland suitability using empirically calculated potential yield for wheat and barley, following the Food and Agriculture Organization of the United Nations (FAO) specifications. The application of FAO standardized suitability classes is widely recognized as a stable procedure of the cropland suitability assessment, regardless of the crop type and geographical location [26]. The implementation of standardized cropland suitability classes enables effective integration with existing agricultural land management plans [11]. It also has the advantage of the suitability comparison with other crop types to determine the best possible alternatives for the optimal agricultural subsiding and adjustment of crop rotations. Akpoti et al. [27] successfully determined cropland suitability for rice cultivation using niche ground truth data, which required a considerable time for the preparation of the machine learning prediction. However, the potential of machine learning predictions in cropland suitability determination is still largely unutilized. With the existence of reliable and globally available training data, machine learning could represent a novel and superior approach to conventional cropland suitability determination using GIS-based multicriteria analysis.
While machine learning allows higher computational efficiency and accuracy compared to the conventional methods, there is a challenge to provide indicators that reliably specify cropland suitability levels. Many researchers related the cropland suitability with the increased crop yield and biomass [28,29,30]. The majority of these studies also indicated the large potential of biophysical vegetation properties in cropland suitability assessment. Leaf area index (LAI) and the fraction of absorbed photosynthetically active radiation (FAPAR) are regarded as complementary biophysical properties for crop yield estimations, frequently used as the essential variables in crop productivity assessment [31,32,33]. Recent studies successfully integrated LAI and FAPAR with a conventional GIS-based multicriteria analysis, producing superior suitability and yield prediction accuracy of various crop types [28,34]. These biophysical vegetation properties also showed considerable potential when used individually in crop suitability studies. LAI derived from remote sensing products was highly correlated with the crop biomass, yield and overall crop status, especially in early growth stages [35]. FAPAR showed a strong correlation with the total crop biomass production [28], its predictive modelling [36], as well as with its temporal variation during the crop vegetative period [37]. Biophysical properties derived from satellite observations produced a very high correlation with the in-situ measurements, resulting in a coefficient of determination up to 0.96 for LAI and up to 0.98 for FAPAR [31]. These biophysical vegetation properties have a long-term availability at 300 m spatial resolution from the PROBA-V mission, seamlessly upgraded to the Sentinel-3 products for global and stable use in the future [38]. By implementing a cropland suitability indicator based on multitemporal LAI and FAPAR data in the machine learning algorithms, there is considerable potential in forming a computationally efficient and globally available cropland suitability assessment method.
The aim of this study was to propose a novel cropland suitability assessment and accuracy assessment approach based on machine learning. This approach is designed to simplify the calculation of cropland suitability on a global scale and to increase the objectivity of prediction compared to the conventional GIS-based multicriteria analysis approach. The method was evaluated for the soybean cropland suitability determination, with the potentially universal applicability for other crop types.

2. Materials and Methods

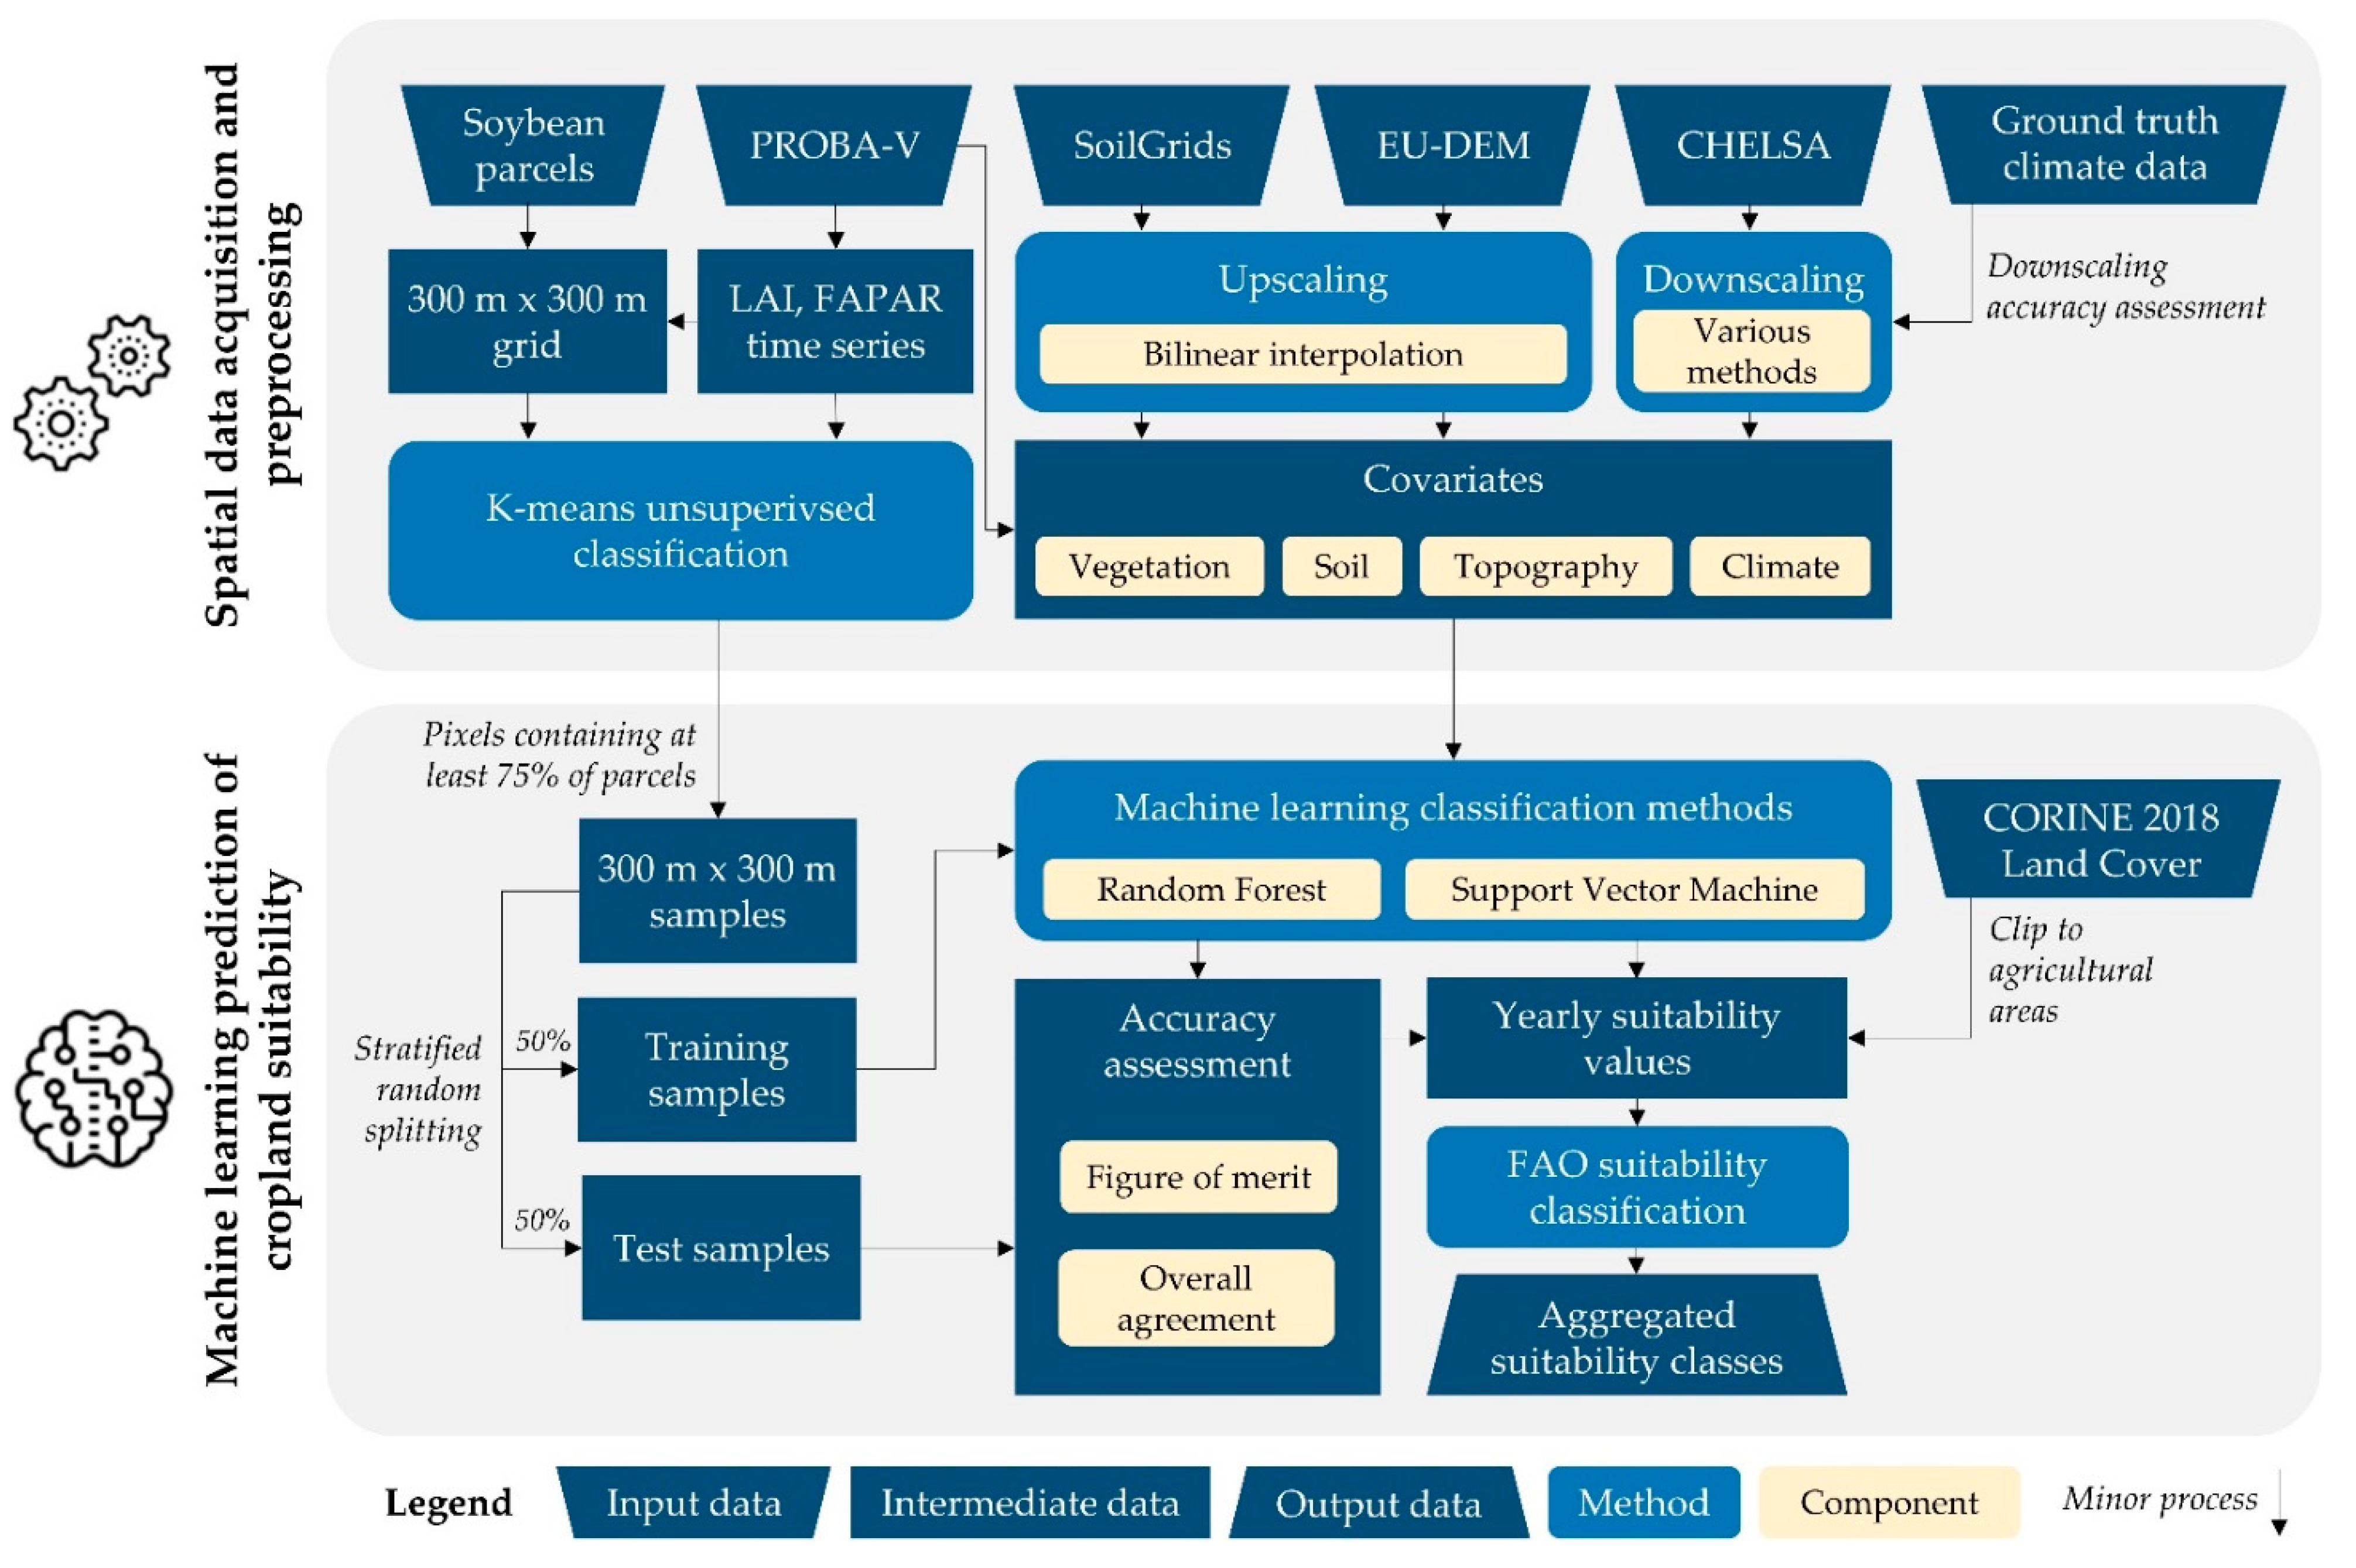
The generalized major components of the proposed approach of cropland suitability assessment are presented in Figure 1. The cropland suitability assessment was performed using solely open-source GIS software. SAGA-GIS v7.9.0 (Hamburg, Germany) was used for input data preprocessing, machine learning prediction and accuracy assessment, while QGIS v3.14 (Grüt, Switzerland) was used for map creation. All input spatial data and suitability assessments were georeferenced to the Croatian Terrestrial Reference System (HTRS96/TM). The complete computational process of the study was performed using a desktop personal computer, which is standard equipment for agricultural land management users in the majority of the world.
The workflow of the proposed cropland suitability assessment method contains two primary steps (Figure 2): (1) spatial data acquisition and preprocessing; and (2) machine learning prediction of cropland suitability. The cropland suitability classes were determined for soybean cultivation, while potentially supporting its universal applicability with the adjustments related to the vegetation period of the selected crop type.

2.1. Study Area

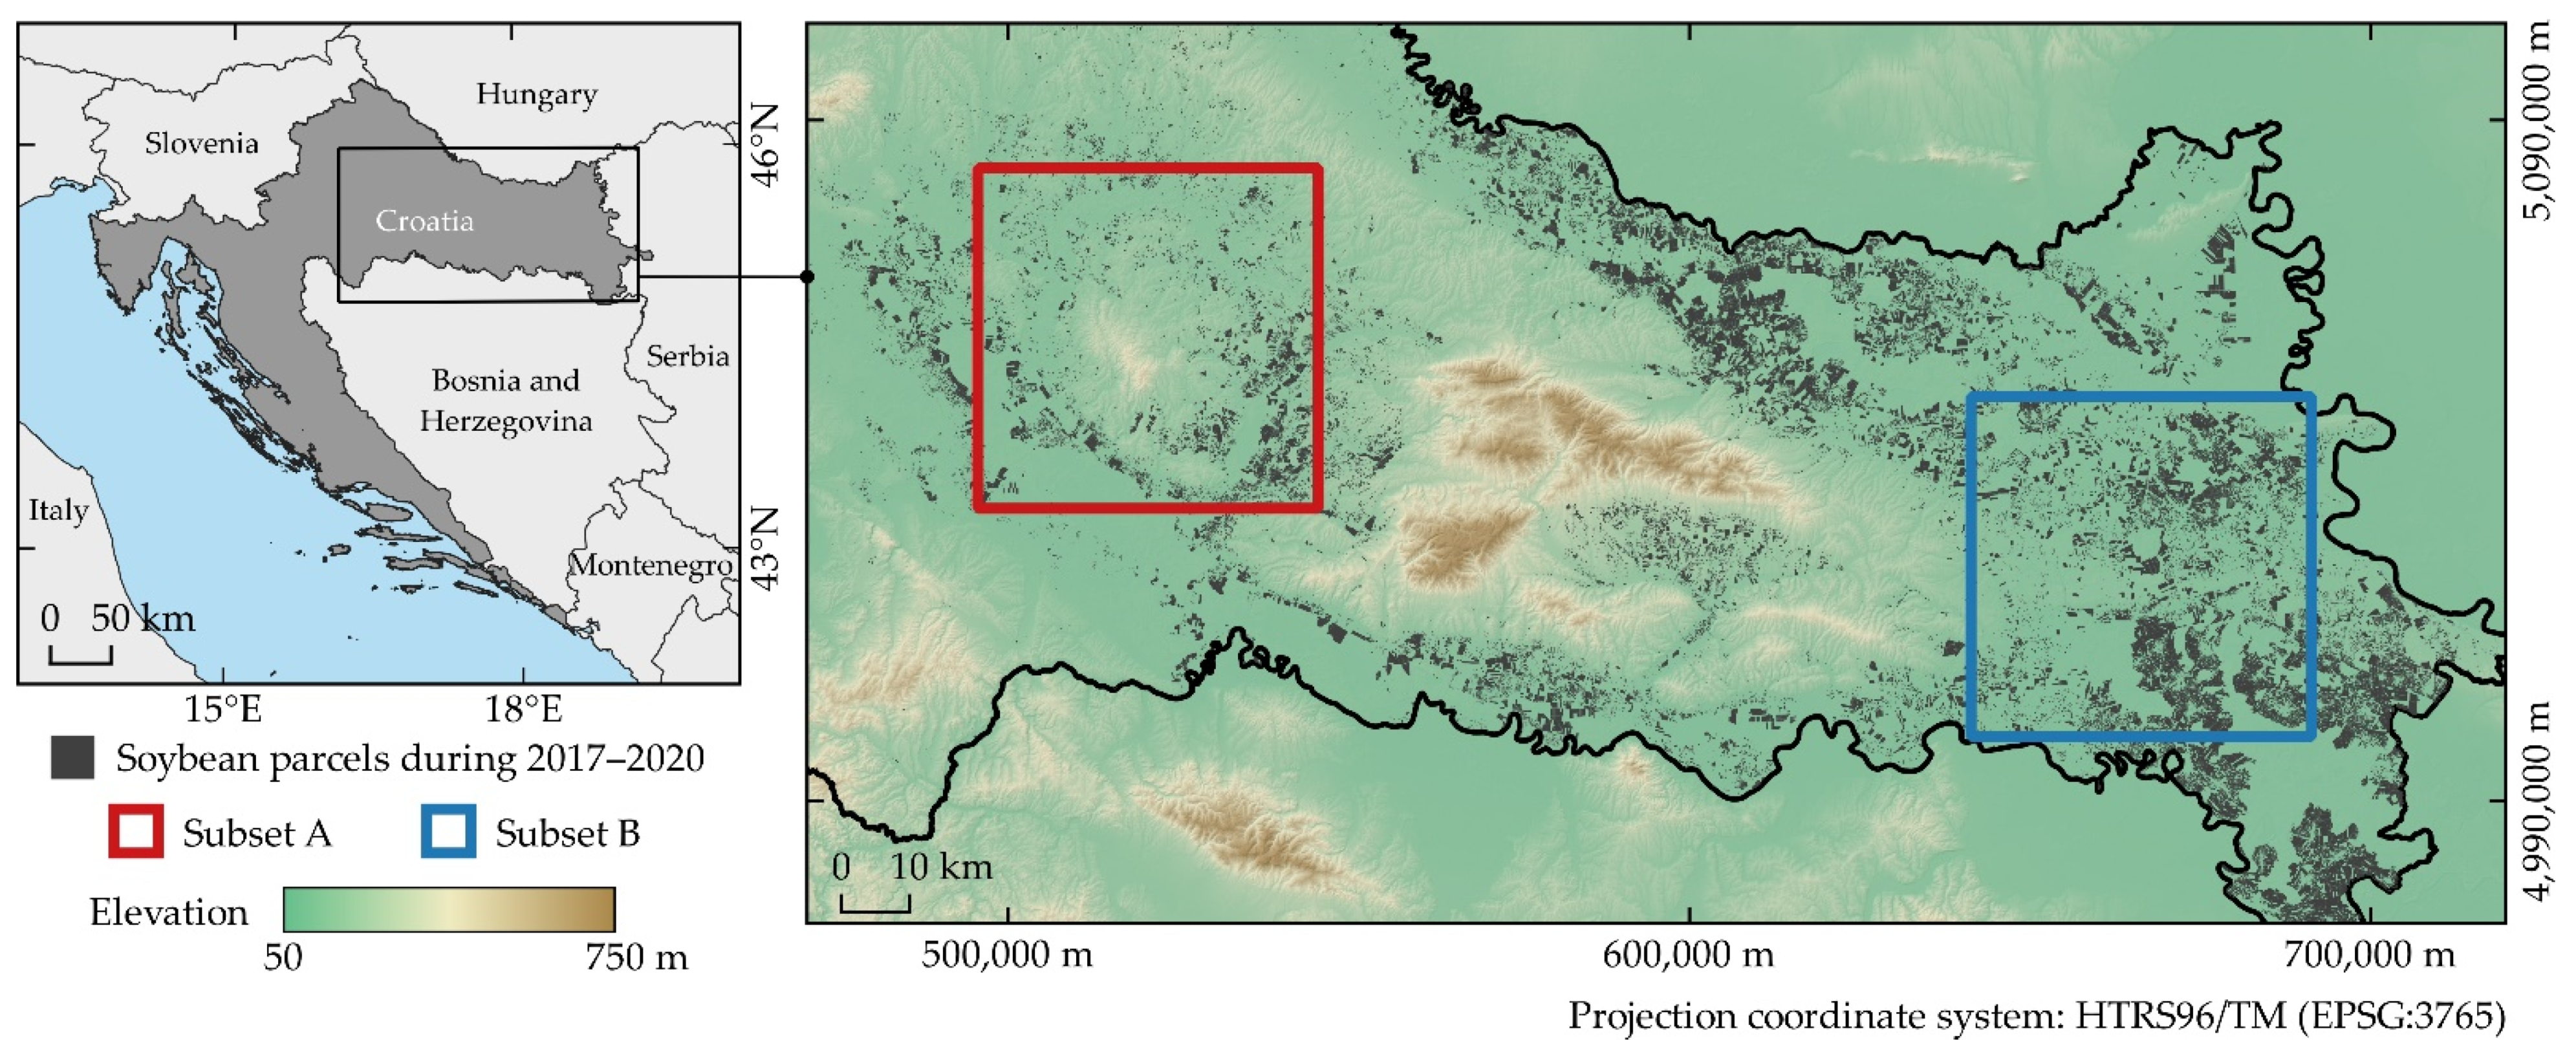
The study area covered two 50 × 50 km subsets located in the continental biogeoregion of Croatia (Figure 3). Agriculture is one of the major activities in Continental Croatia, with agricultural areas covering 52.9% of its total area per CORINE 2018 Land Cover data. Multiple recent studies noted the considerable variability of soybean cropland suitability in the study area, urging for more efficient agricultural land management planning [11,39,40,41]. Subset A is characterized by hilly terrain and sparsely located agricultural parcels, often in the proximity of forests. Subset B is situated in the lowland area in eastern Croatia, being traditionally used for intensive agricultural production. Soybean is cultivated conservatively by specific land owners in both subsets, with the union of soybean parcels during 2017–2020 covering only 11.9% and 19.0% of agricultural area in Subset A and B, respectively. The general properties of these subsets are presented in Table 1. The major deviation from mean climate data occurred in 2018, which was extremely hot and dry in the soybean vegetation period. The other notable deviation was a relatively high precipitation in 2019 for both study subsets. All yearly air temperature and precipitation data in study period during 2017–2020, between April and October, are shown in Appendix A, Table A1.
Soybean production has increasing importance in Croatia, ranking second in a cultivated agricultural area with 83 thousand ha, behind maize, with the average yield of 3.2 t ha−1 [42]. According to the same source, the overall production of soybean in Croatia increased by 14.0% in 2020 compared to the year prior, with the prospect of further growth. The most common soybean variety in the study area is the mid-early maturity group 0, with an average vegetative period of 115–125 days [43]. The early maturity group 00 in subset A and mid-late maturity group I in subset B are periodically cultivated. The usual vegetative period of these soybean maturity groups ranges from late April to mid-September, covering days of the year (DOY) from 120 to 245. The duration of vegetative growth stages is in the range of 35 to 45 days after sowing. Full bloom (R2), beginning seed (R5) and full seed (R6) are regarded as the most important soybean growth stages for stable yield [44]. These stages commonly cover DOY ranges of 170–180, 190–200 and 200–220 in the study area, respectively. According to the common annual anomalies of soybean growth, the study period was determined from 1 April to 31 October. This approach included vegetation periods of all soybean parcels in the study area, regardless of their maturity group and agrotechnical operations performed by farmers.

2.2. Spatial Data Acquisition and Preprocessing

The machine learning prediction and accuracy assessment of cropland suitability for soybean cultivation were performed using open remote sensing and GIS data. LAI and FAPAR biophysical properties were used for the training of supervised classification machine learning models, as complementary and reliable indicators of crop yield [31]. The 10-day LAI and FAPAR products from a PROBA-V satellite with 300 m spatial resolution were downloaded from the Copernicus Global Land Service website for the period between April and October in 2017–2020. PROBA-V enables highly accurate and consistent determination of biophysical vegetation properties, on par with similar missions and observations from the ground [38]. Training and test data for suitability assessment were created according to the 300 m × 300 m regular grid, which corresponds to LAI and FAPAR raster grids derived from PROBA-V. The spatial resolution of 300 m was determined as suitable for various monitoring, and land management uses in agriculture at the macro level, representing medium-sized and larger agricultural parcels [45]. The pixels from this grid were filtered based on the coverage of ground truth soybean parcels within the pixels, designated separately for each year during the 2017–2020 period.
Reference soybean parcels were obtained from the official Paying Agency for Agriculture, Fisheries and Rural Development (APPRRR) of Croatia, being applied and controlled for agricultural incentive distribution. These data were additionally visually inspected and verified using the 0.5 m spatial resolution digital orthophoto provided by the State Geodetic Administration of Croatia. At least 75% soybean parcel coverage was determined as a filtering threshold to reduce the spectral mixing near the boundary of neighboring land cover classes [46]. Training and test data were created separately for each individual year in the 2017–2020 period, using data sensed during a soybean vegetative period of major soybean varieties in the study area. This approach ensures the robustness of the prediction by considering the entire vegetation period of all soybean varieties present in the study area. This is reflected in the resistance in temporal variabilities of sowing periods and particular soybean growth stage duration. These components are commonly affected by the numerous abiotic factors and farmer decision making, including annual weather trends, land cultivation systems, fertilization and irrigation systems.
Various complementary covariates were used for the establishment of the relationship between the soybean cropland suitability represented by LAI and FAPAR with the environmental conditions in the study area. The three primary environmental factors that condition the cropland suitability are climate, soil and topography [20]. Raster covariates representing these environmental requirements of soybean cultivation and the auxiliary vegetation covariates are presented in Table 2. The selection of particular covariates was performed based on the various environmental effects on the quality and quantity of soybean production from previous studies [11,37,43,44,47,48]. A total of 119 covariates were used per the individual prediction of yearly cropland suitability classes for soybean cultivation, consisting of 47 climate, 24 soil, 6 topographic and 42 vegetation covariates.
Climate has the dominant effect on the duration of soybean vegetative and reproductive growth stages, emerging efficiency after sowing and its overall requirements of sunshine and water [53]. Climate data was represented using the CHELSA dataset [49], containing the most recent global climate data at the 1 km spatial resolution during 1979–2013. Air temperature and precipitation covariates were filtered from April to October. The 19 bioclimatic variables were derived from CHELSA historical monthly data, representing air temperature and precipitation quarterly extremes and their value ranges for ecological modelling [49]. Soil chemical and physical properties have a major impact on soybean protein and oil quantity, while their variability is associated with the anomalies in soybean yield [47]. Per European Soil Data Centre, Gleysol and Luvisol soils are dominant in both subset areas, with moderate variability of their subtypes. These soil properties were represented by SoilGrids data at 0–5 cm, 5–15 cm and 15–30 cm soil depths [50], which dominantly affect soybean growth and produced yield [48]. Topography has an important role in representing the interaction of the elevation and terrain configuration with climate and soil effects on soybean cultivation [54]. Various theoretical topography indicators were used to model the micro variations of climate and soil conditions, especially regarding solar, wind and water drainage effects. The topographic wetness index was determined using the Multiple Flow Direction procedure. Total potential solar radiation and the wind exposition index were calculated according to the topo-climatology models by Böhner and Antonić [55]. Vegetation covariates derived from PROBA-V products, which are not directly related to crop yield, were added as supplementary biophysical properties to LAI and FAPAR. Dry matter productivity (DMP) indirectly represented the efficiency of solar radiation and air temperature on the dry biomass increase, while the fraction of vegetation cover (FCOVER) assessed the percentage of ground coverage by vegetation, without dependency on the crop optical properties [33]. These data produced a low to moderate correlation with LAI and FAPAR, preventing the suitability assessment bias.
Resampling of covariate rasters was performed to match the spatial resolution of LAI and FAPAR rasters of 300 m. The upscaling allows a straightforward and accurate creation of lower spatial resolution data, while the downscaling represents a more limited and generally less accurate process [56]. Soil and topography covariates were upscaled to 300 m spatial resolution using a bilinear interpolation method, which achieved higher accuracy compared to similar resampling methods in a recent study by Liu and Weng [57]. Various downscaling methods of the CHELSA climate data with the 1 km native spatial resolution were evaluated to ensure optimal downscaling accuracy. Nearest neighbour (NN), bilinear interpolation (BI) and B-spline interpolation (BSI) were included in the process, producing high accuracy for the downscaling of similar spatial data [58]. Accuracy assessment of the downscaled rasters was performed according to the ground truth climate data from 34 stations in the spatial coverage of study area subsets or their close proximity. Mean air temperature and total monthly precipitation were obtained from the Croatian Meteorological and Hydrological Service (DHMZ), representing the most recent official climate data (1971–2000) in Croatia. The individual monthly data between April and October was used for the accuracy assessment for air temperature, while the sum of precipitation in the same period was used to reduce bias caused by its high inter-annual variability. The coefficient of determination (R2) and root mean square error (RMSE) were used for the downscaling accuracy assessment, which increased with higher R2 and lower RMSE.

2.3. Machine Learning Prediction of Cropland Suitability

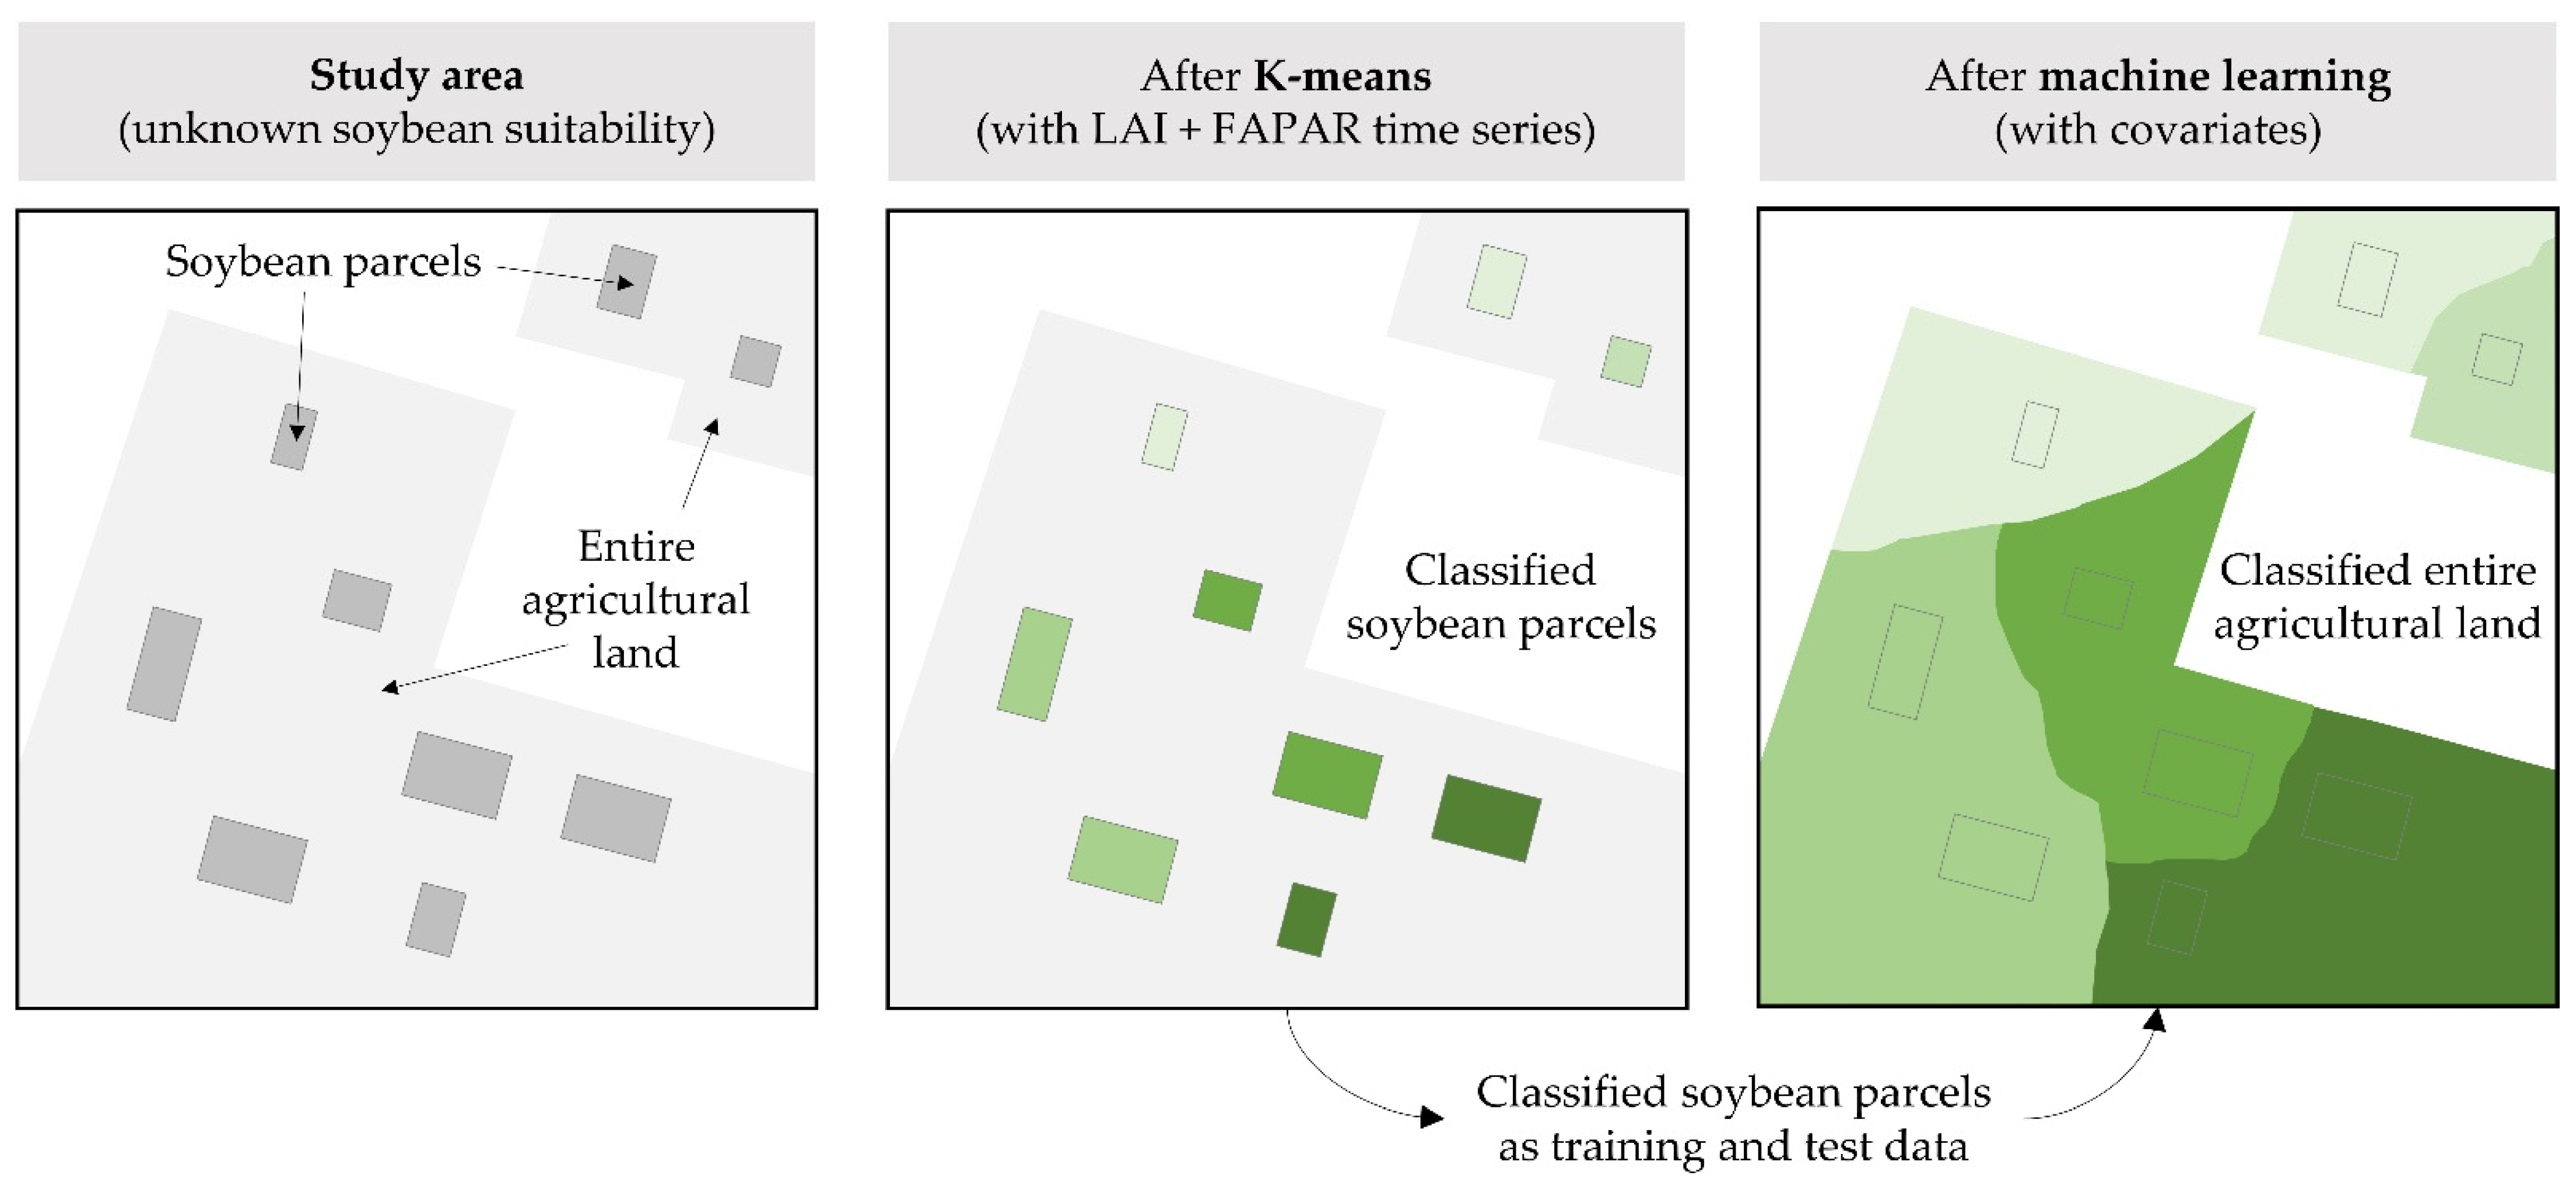
The cropland suitability for soybean cultivation was assessed following a two-step classification principle: (1) determination of suitability levels in reference soybean parcels based on K-means classification of multitemporal LAI and FAPAR; and (2) machine learning prediction of cropland suitability for soybean cultivation in the entire agricultural land in the study area, using covariates to establish a relationship between the suitability levels and environmental conditions (Figure 4). The cropland suitability prediction was performed individually for each year within the 2017–2020 period. The primary reason for that procedure was the presence of crop rotation systems, as soybean should not be cultivated in the same location in the two- or three-year consecutive span. This approach prevented interference with the spectral information of other crop types. Additionally, inter-annual weather conditions and diseases are highly variable, which significantly affect soybean biomass and yield [54]. The proposed method avoids the bias caused by integrating these conditions over multiple years by assessing cropland suitability individually for each year, preventing the impact of extremely beneficial or non-beneficial events for a particular year. The proposed method instead considers the relative suitability values in subset areas, which are almost equally affected by the weather events or diseases in the 50 × 50 km areas. Therefore, K-means classification evaluated the relative soybean cropland suitability levels per year, while machine learning models were used for the absolute cropland suitability assessment, expanding the evaluation on the entire agricultural area in subset areas besides reference soybean parcels. This approach ensured objective assessment of soybean cropland suitability in the 88.1% and 81.0% of the agricultural area which was not utilized for the soybean cultivation in the 2017–2020 period for Subset A and B, respectively. The suitability assessment over the entire available area enables expansion and regionalization of soybean cultivation in new locations, supporting the increasing need for high quality and quantity of produced soybean.
LAI and FAPAR annual biophysical properties in the 300 × 300 m grid were classified into five suitability values using the K-means unsupervised classification method for their determination prior to machine learning model training. The suitability values in the 1–5 range were ranked according to mean LAI and FAPAR, where higher LAI and FAPAR values indicate higher cropland suitability for soybean cultivation. A relative approach of training and test data creation using LAI and FAPAR using an unsupervised classification ensured the possibility of multi-year suitability comparison, despite annual weather variability and extremes.
Training and test data were separated from the unique classified dataset using the stratified random splitting in the 50:50 ratio. The same procedure was successfully applied with the machine learning supervised classification methods in a recent study [59]. This approach met the recommendations of Hengl et al. [50] and Colditz [60], who noted the importance of a sufficient amount of training data for machine learning prediction. Random forest (RF) and support vector machine (SVM) were applied for soybean cropland suitability assessment, being the most often applied machine learning methods due to their computational efficiency and straightforwardness [25]. They also achieved superior accuracy compared to other machine learning and conventional supervised classification algorithms in previous environmental studies [59,61]. Determining the parameters for RF and SVM prediction was based on the iterative procedure, using the parameters that ensured the highest prediction accuracy. Soybean cropland suitability assessment was performed individually for each year in the 2017–2020 period. Yearly suitability classes were assessed separately to reduce prediction bias caused by annual weather extreme events, which represent rare occurrences in the perspective of agricultural land management. These rasters were clipped to the agricultural areas land cover class from CORINE 2018, extracting the possible area for soybean cultivation. The relative importance of input covariates on the predicted soybean cropland suitability results using RF was performed by the Gini decrease measure, being a frequently used and stable measure of importance [61]. It proportionally quantifies the purity of model performance during node splits for a particular covariate, meaning that the higher Gini decrease indicates higher importance of a covariate in the prediction model.
Machine learning prediction accuracy was assessed using the figure of merit (F), which was developed by Pontius and Millones [62] as an upgrade to kappa coefficients in remote sensing studies. It is expressed per suitability value according to the formula:
F =   a o + a + c   ·   100 % ,
where a (agreement) represents correctly predicted suitability values, o (omission) represents falsely predicted suitability values in other suitability classes and c (commission) represents falsely predicted suitability values of the particular suitability class. The overall performance of soybean cropland suitability assessment was determined using an overall agreement (OA) value, calculated as the ratio of total agreements and total classified values.
Four yearly suitability rasters were averaged and aggregated based on the FAO methodology for land suitability assessment in five classes [63]. The ranking of soybean cropland suitability values was performed according to the FAO suitability classes, including highly suitable (S1), moderately suitable (S2), marginally suitable (S3), currently not suitable (N1) and permanently not suitable (N2) classes [26]. These classes were associated with the suitability values according to the percentage of maximum suitability, per previously referenced FAO specifications (Table 3). Permanently non suitable areas in the N2 class contained all non-agricultural areas from CORINE 2018 which did not support soybean cultivation without major ecosystem disturbance.

3. Results

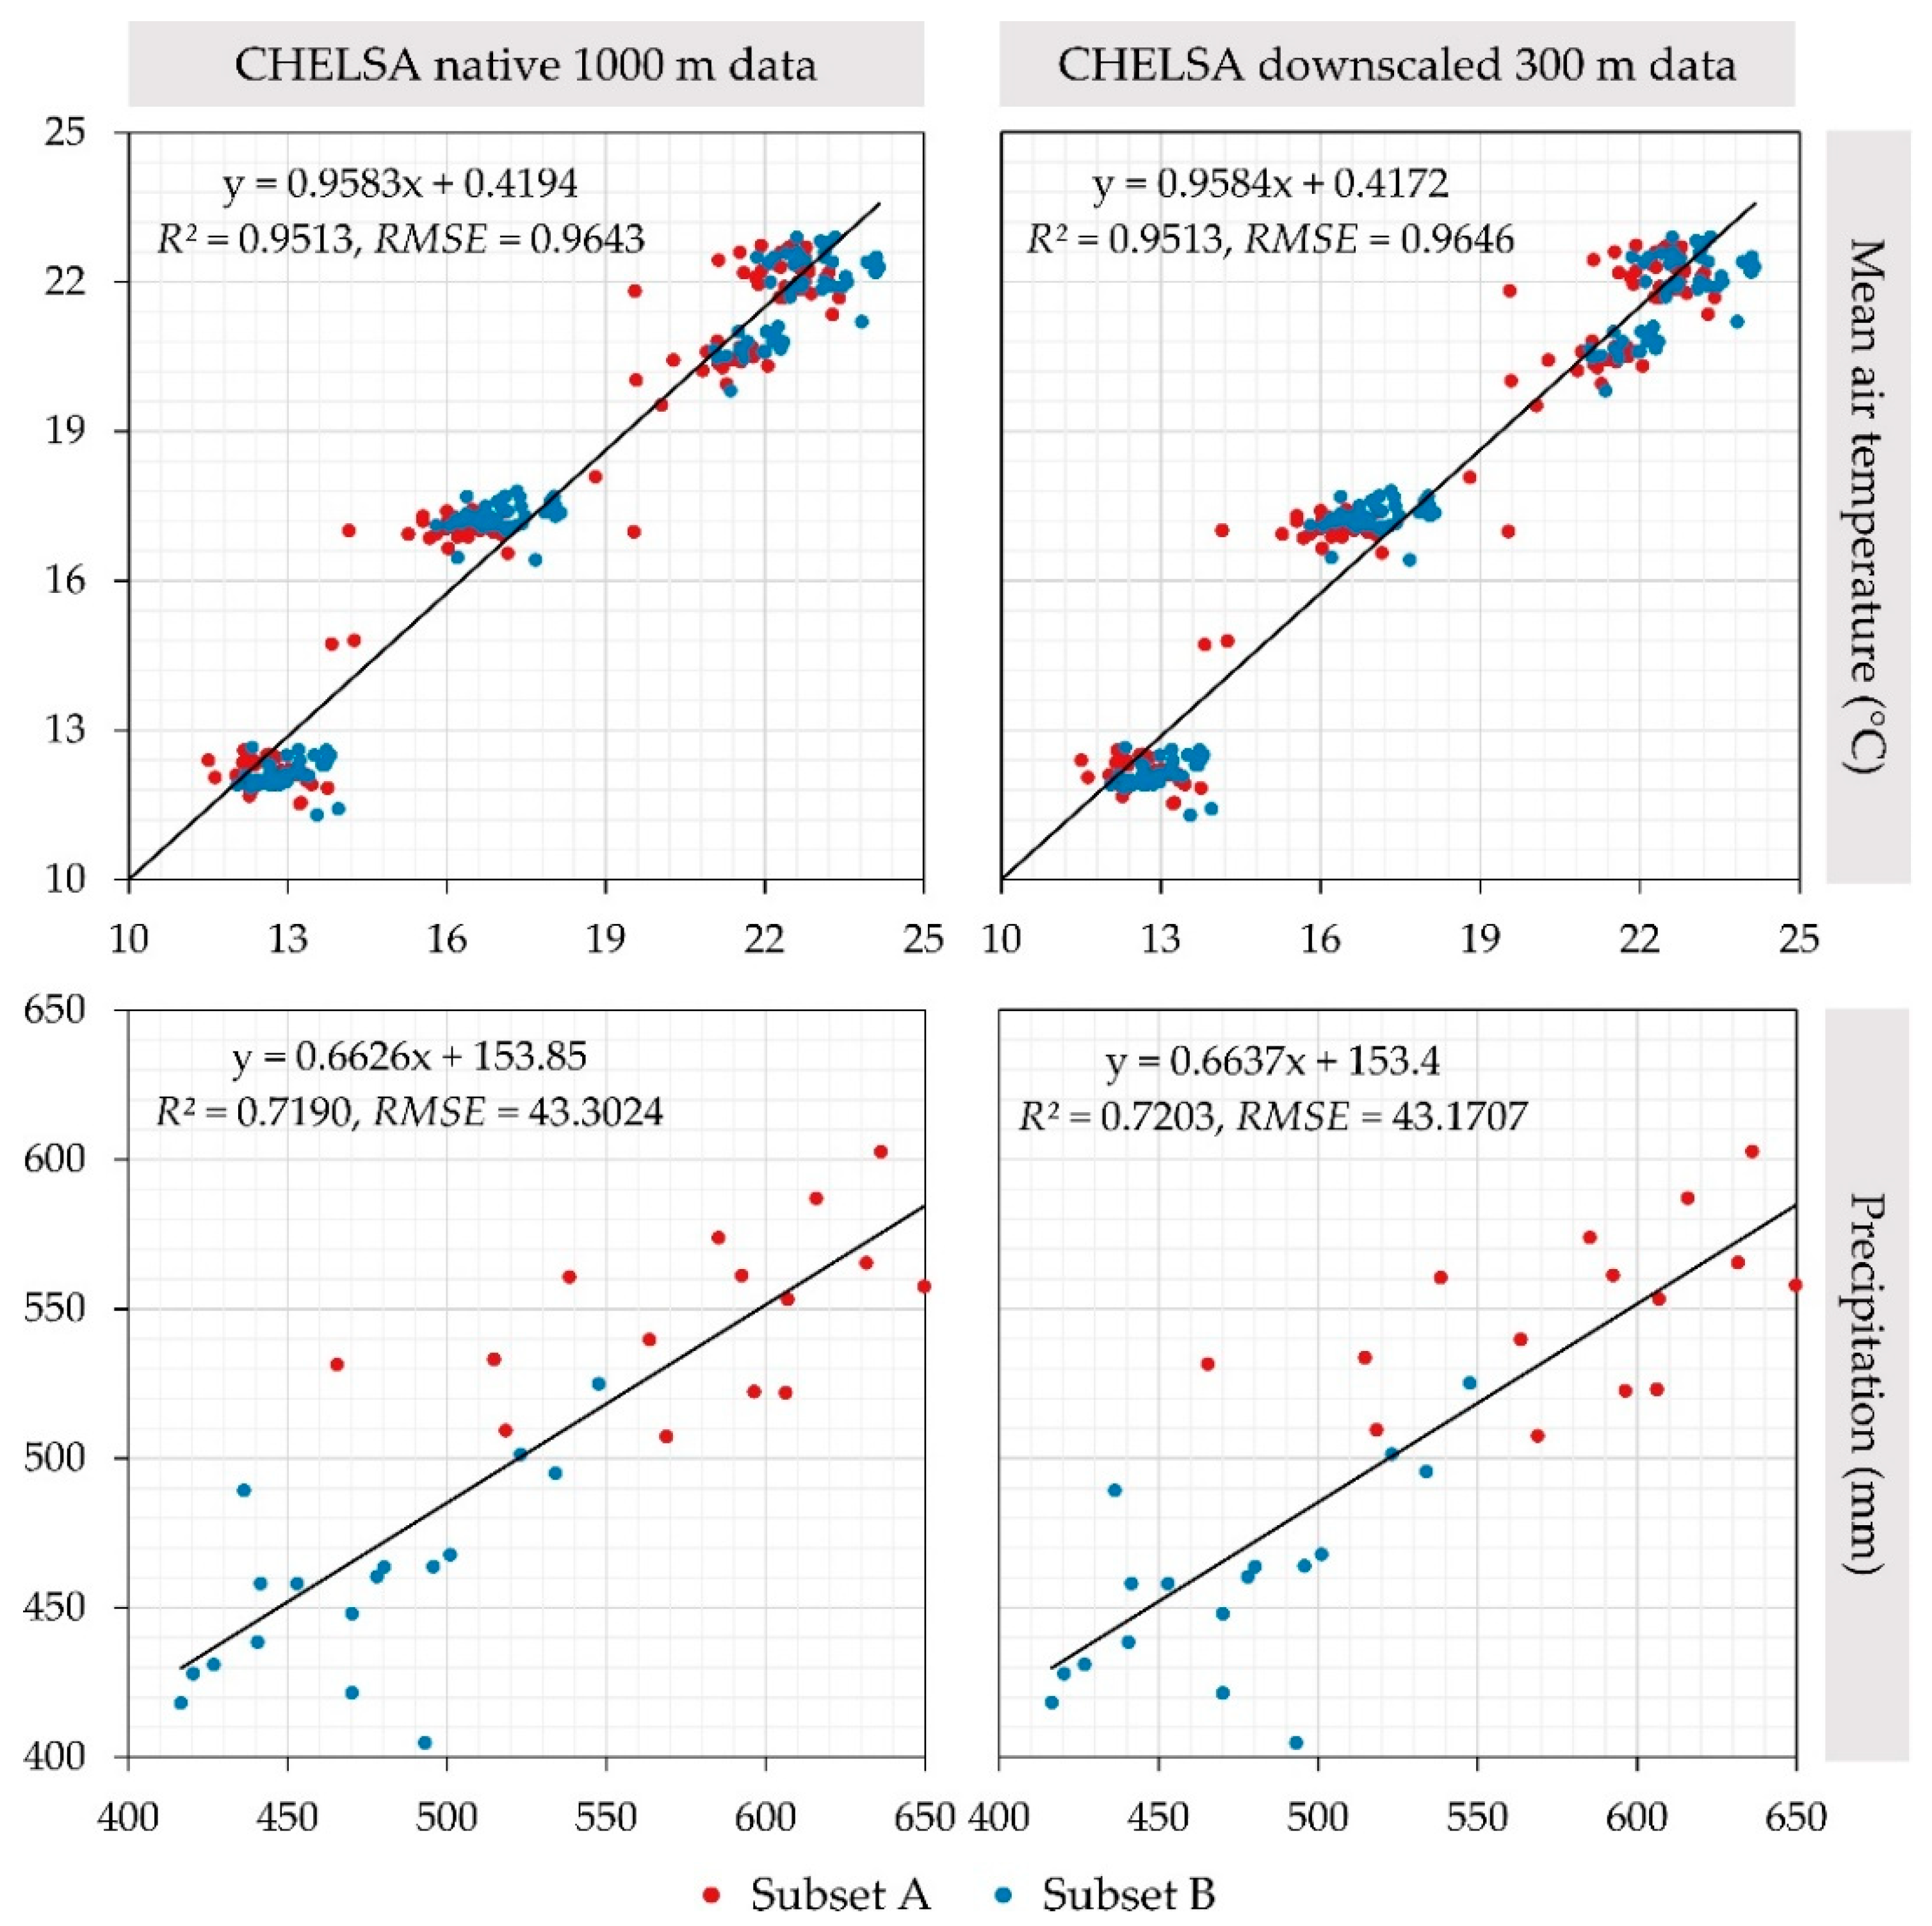
Mean air temperature and precipitation original CHELSA 1000 m data showed a high correlation with the ground truth climate data from DHMZ stations (Appendix A, Table A2). All three evaluated downscaling interpolation methods produced high accuracy values, preserving climate values from the original data at a high degree. The B-spline interpolation method produced the highest downscaling accuracy, achieving a higher correlation with the ground truth data for precipitation compared with the original CHELSEA climate data. Figure 5 displays the correlation between these datasets with the ground truth DHMZ climate data. A slightly higher correlation was observed for April and May air temperatures compared to summertime values for both subsets. Lower precipitation values in Subset B were also more accurately represented by CHELSA data compared to the higher precipitation in Subset A.
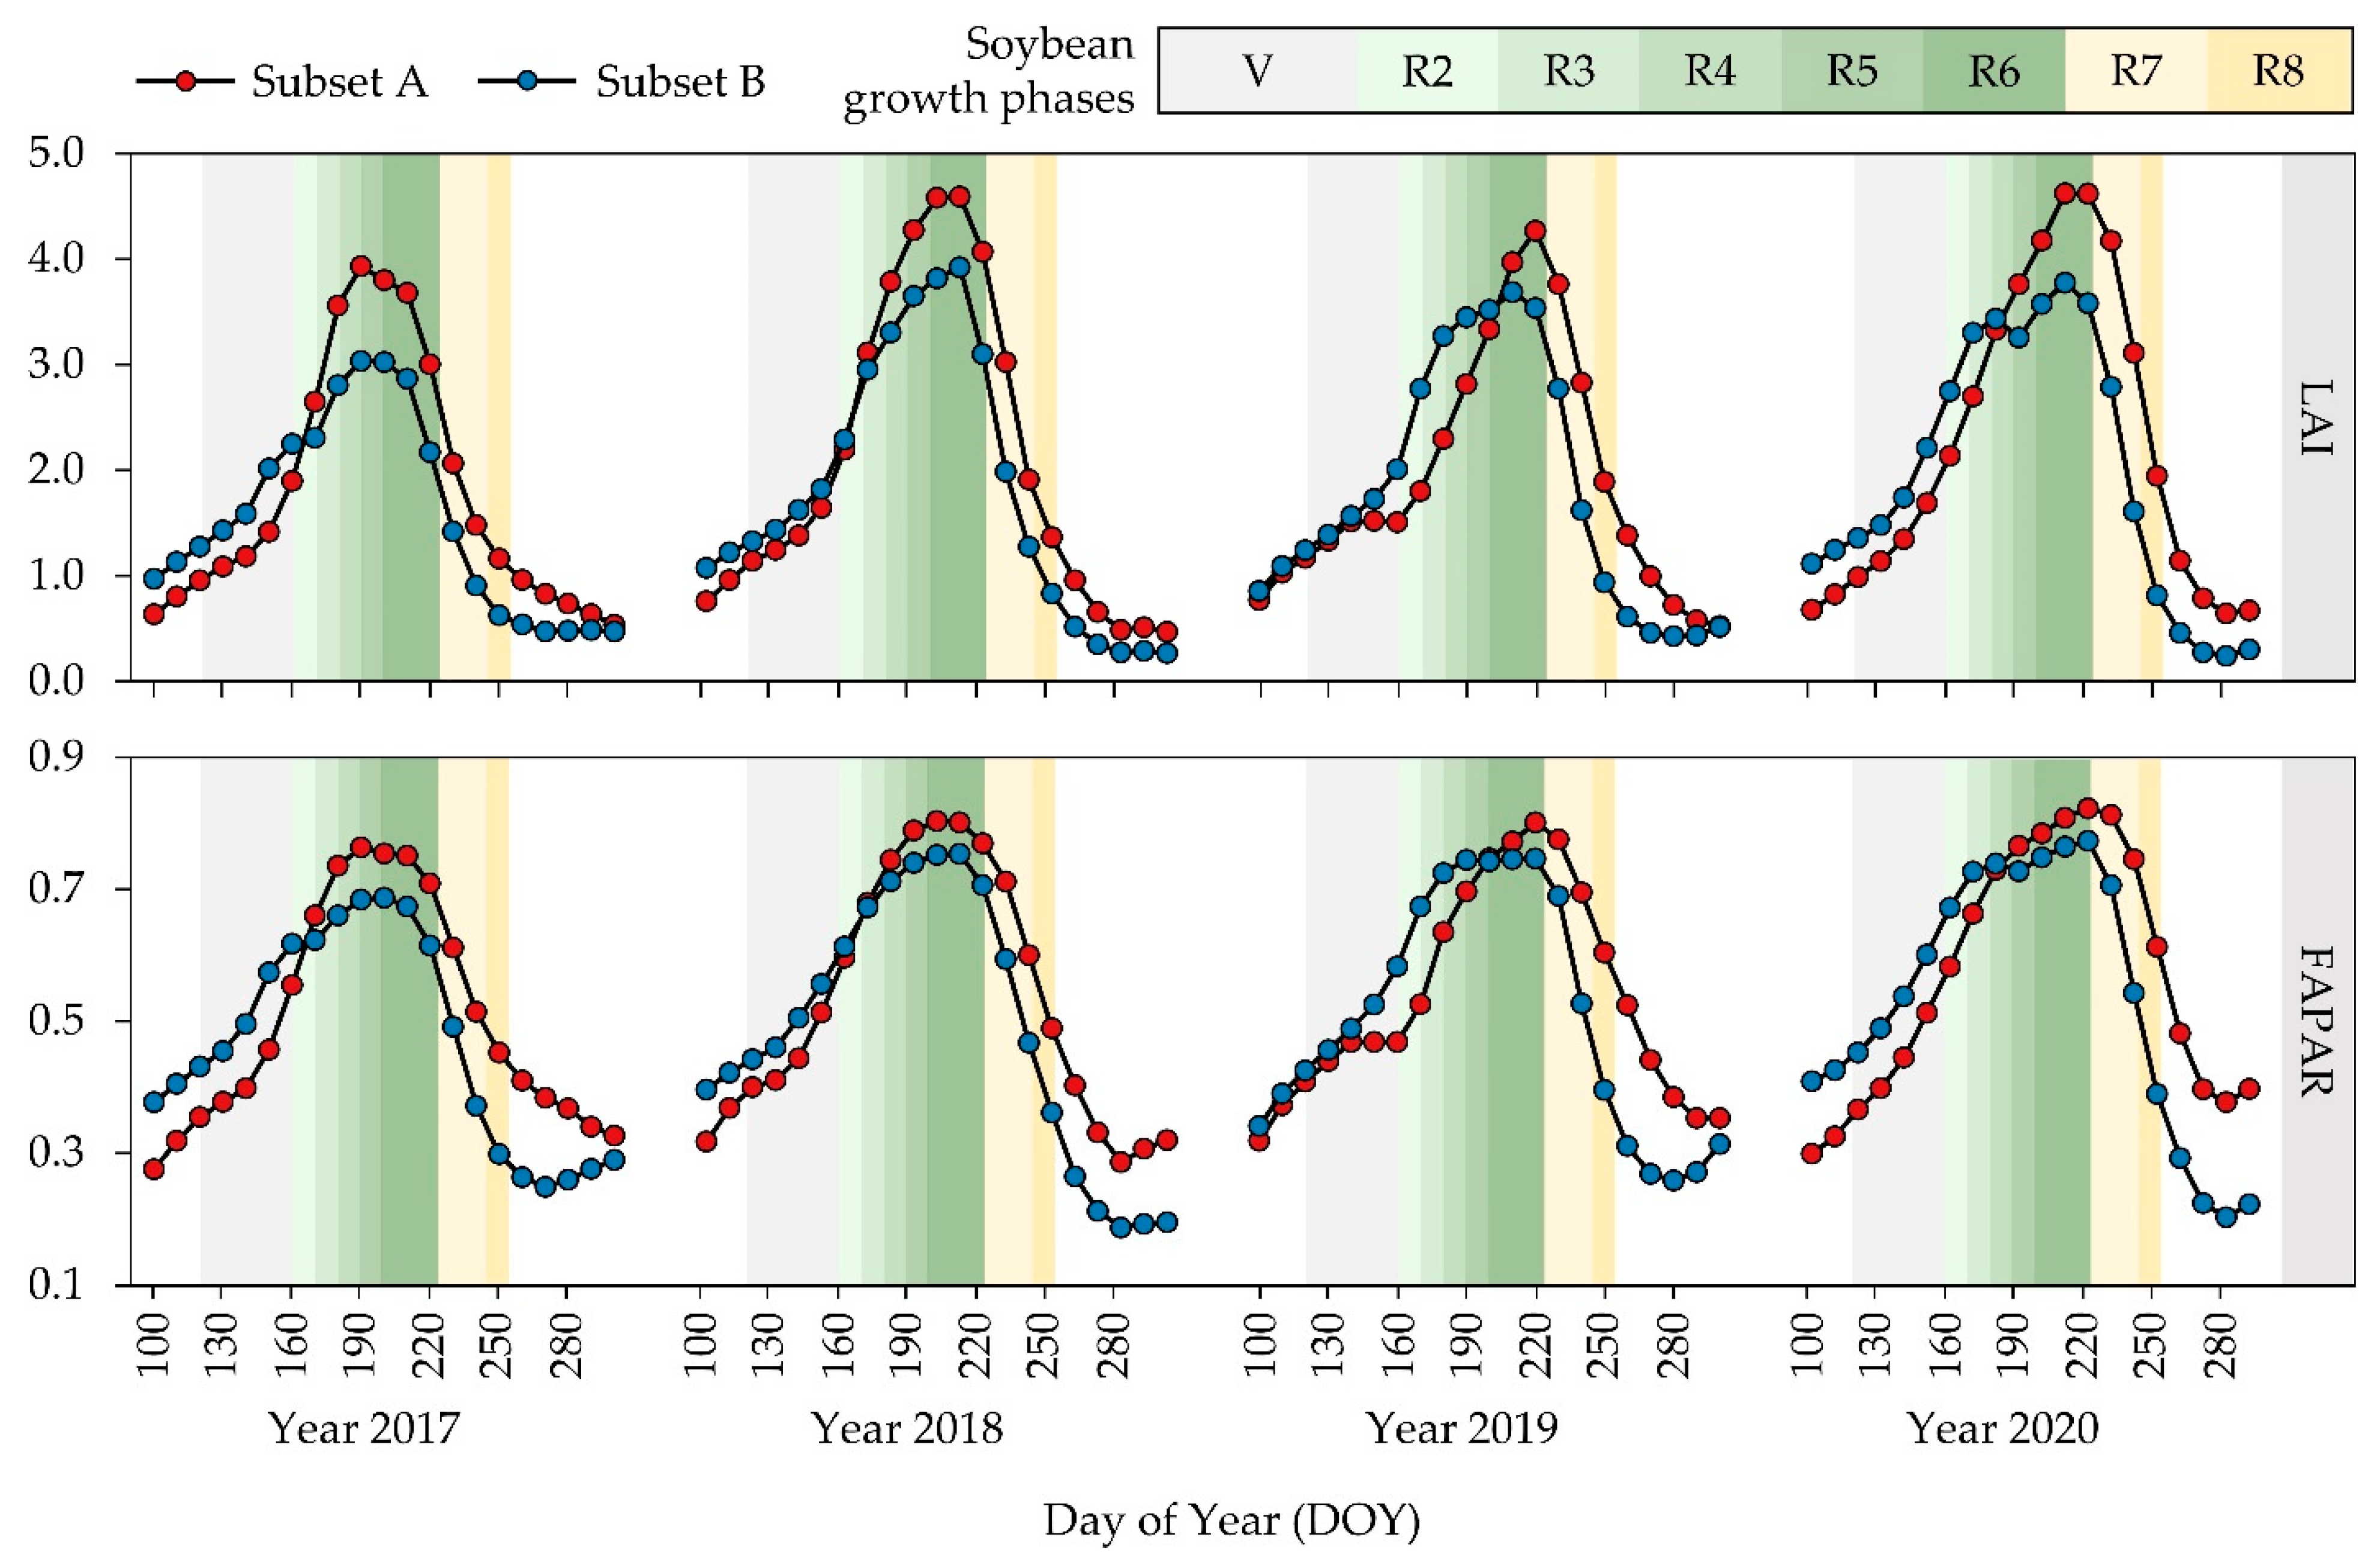
Seasonal trends of mean LAI and FAPAR values in soybean parcels during its vegetative period between April and October from 2017 to 2020 are represented in Figure 6. Both LAI and FAPAR generally reached their peak in late July or early August, which corresponds to the usual periods of soybean varieties in the study area entering the R6 growth stage. These values reached higher peaks in Subset A than in Subset B in all observed years. A slightly later vegetative period of soybean in Subset A compared to Subset B is also noted, which is characteristic for the early soybean maturity groups commonly present in this area. Meanwhile, the soybean vegetative period in Subset B matched the duration of mid-early and mid-late maturity groups, which confirms their presence in the study area from previous studies. Minor sudden changes in LAI and FAPAR trends for the year 2017 in Subset A and year 2020 in Subset B implied the susceptibility of LAI and FAPAR to annual extreme weather conditions during the early reproductive soybean growth stages. These anomalies are a common occurrence caused by drought in the study area, and were almost fully equalized in the latter soybean growth stages.
The total count and coverage of the soybean samples used for the determination of training and test data for soybean cropland suitability assessment are displayed in Table 4. Both subsets produced a relatively stable sample count for each year within the 2017–2020 period. Subset B produced a higher sample count and relative coverage in the subset area due to the significantly higher amount of enlarged soybean parcels in lowland areas than Subset A. A relative percentage of sample coverage within the subset agricultural areas is in accordance with the specifications by Colditz [60], who proposed at least 0.25% from the classified area being designated as training data.
The mean LAI and FAPAR values after suitability classification using K-means as the preprocessing to training data creation are displayed in Appendix A, Table A3. RF produced a superior classification accuracy for soybean cropland suitability in seven of eight yearly suitability values compared to SVM (Table 5). It produced higher mean OA values than SVM in both subsets, resulting in 76.6% to 68.1% for Subset A and 80.6% to 79.5% for Subset B. Cropland suitability assessment accuracy was slightly lower in Subset A, with RF producing significantly higher accuracy in conditions of more limited training data. Both machine learning methods produced a high prediction accuracy in Subset B. The correlation of the higher soybean samples with higher prediction accuracy is also observed for yearly predictions within the subsets. RF and SVM predictions for 2017 and 2018 produced a higher mean OA of 6.5% for Subset A and 5.2% for Subset B, compared to the 2019 and 2020 predictions. A general trend of higher prediction accuracy represented by the figure of merit was observed for three more suitable values for soybean cultivation (5, 4, 3) in relation to the less suitable values.
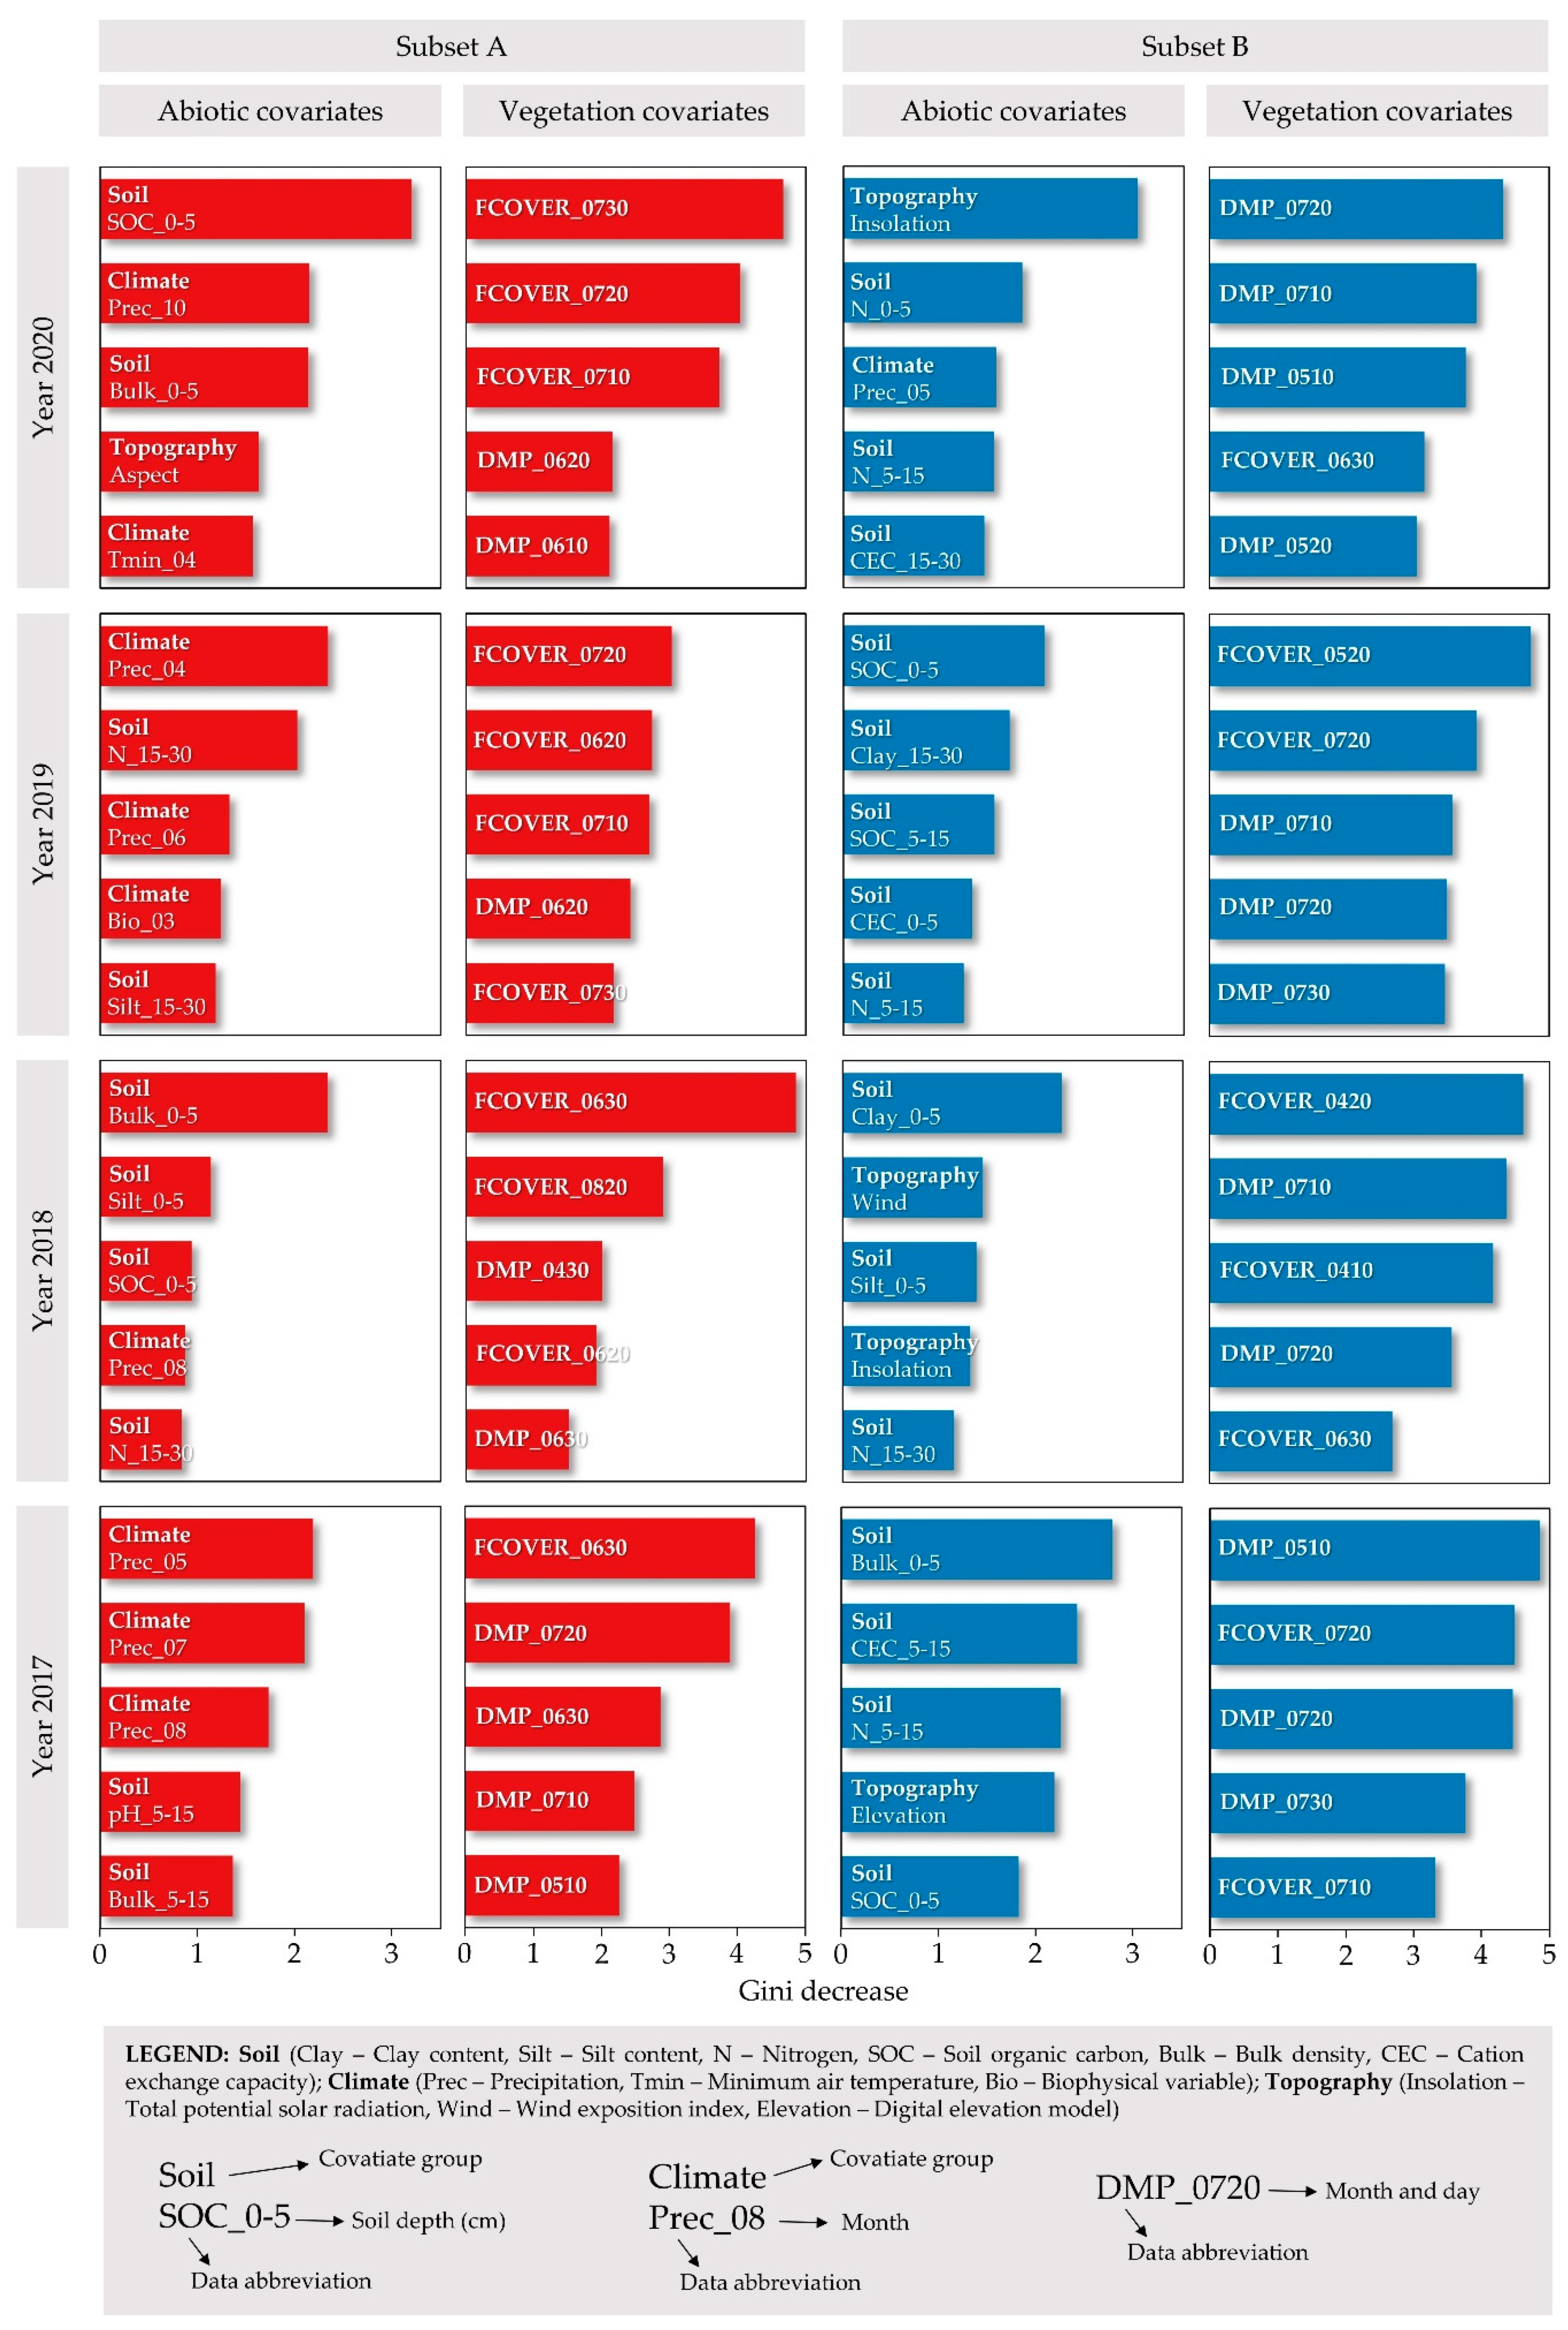
The relative importance of individual covariates divided into the abiotic (climate, soil and topography) and vegetation covariates are presented in Figure 7. Vegetation covariates produced higher individual Gini decrease values compared to abiotic covariates from the same prediction period. However, their total count of 42 compared to the 77 abiotic covariates per prediction indicated similar overall importance of these covariate groups. FCOVER and DMP sensed during June and July had the dominant importance out of the top-five importance vegetation covariates per prediction. These covariates contained 77.5% of the most impactful vegetation covariates considering both subsets. The importance of abiotic covariates varied between the subsets. SoilGrids covariates were the most represented in the top-five most impactful abiotic covariates in Subset A, covering one half of the group. It is closely followed by CHELSA climate data, with 45.0% of the top-five most important abiotic covariates. Precipitation values over the entire soybean vegetative period were the most represented climate data. SoilGrids data were dominantly included within the most impactful covariates in Subset B, representing a 75.0% share. Soil nitrogen was the most frequent soil covariate, especially at the 5–15 cm soil depth. Topographic covariates derived from EU-DEM produced 20.0% of the most impactful abiotic covariates in Subset B.
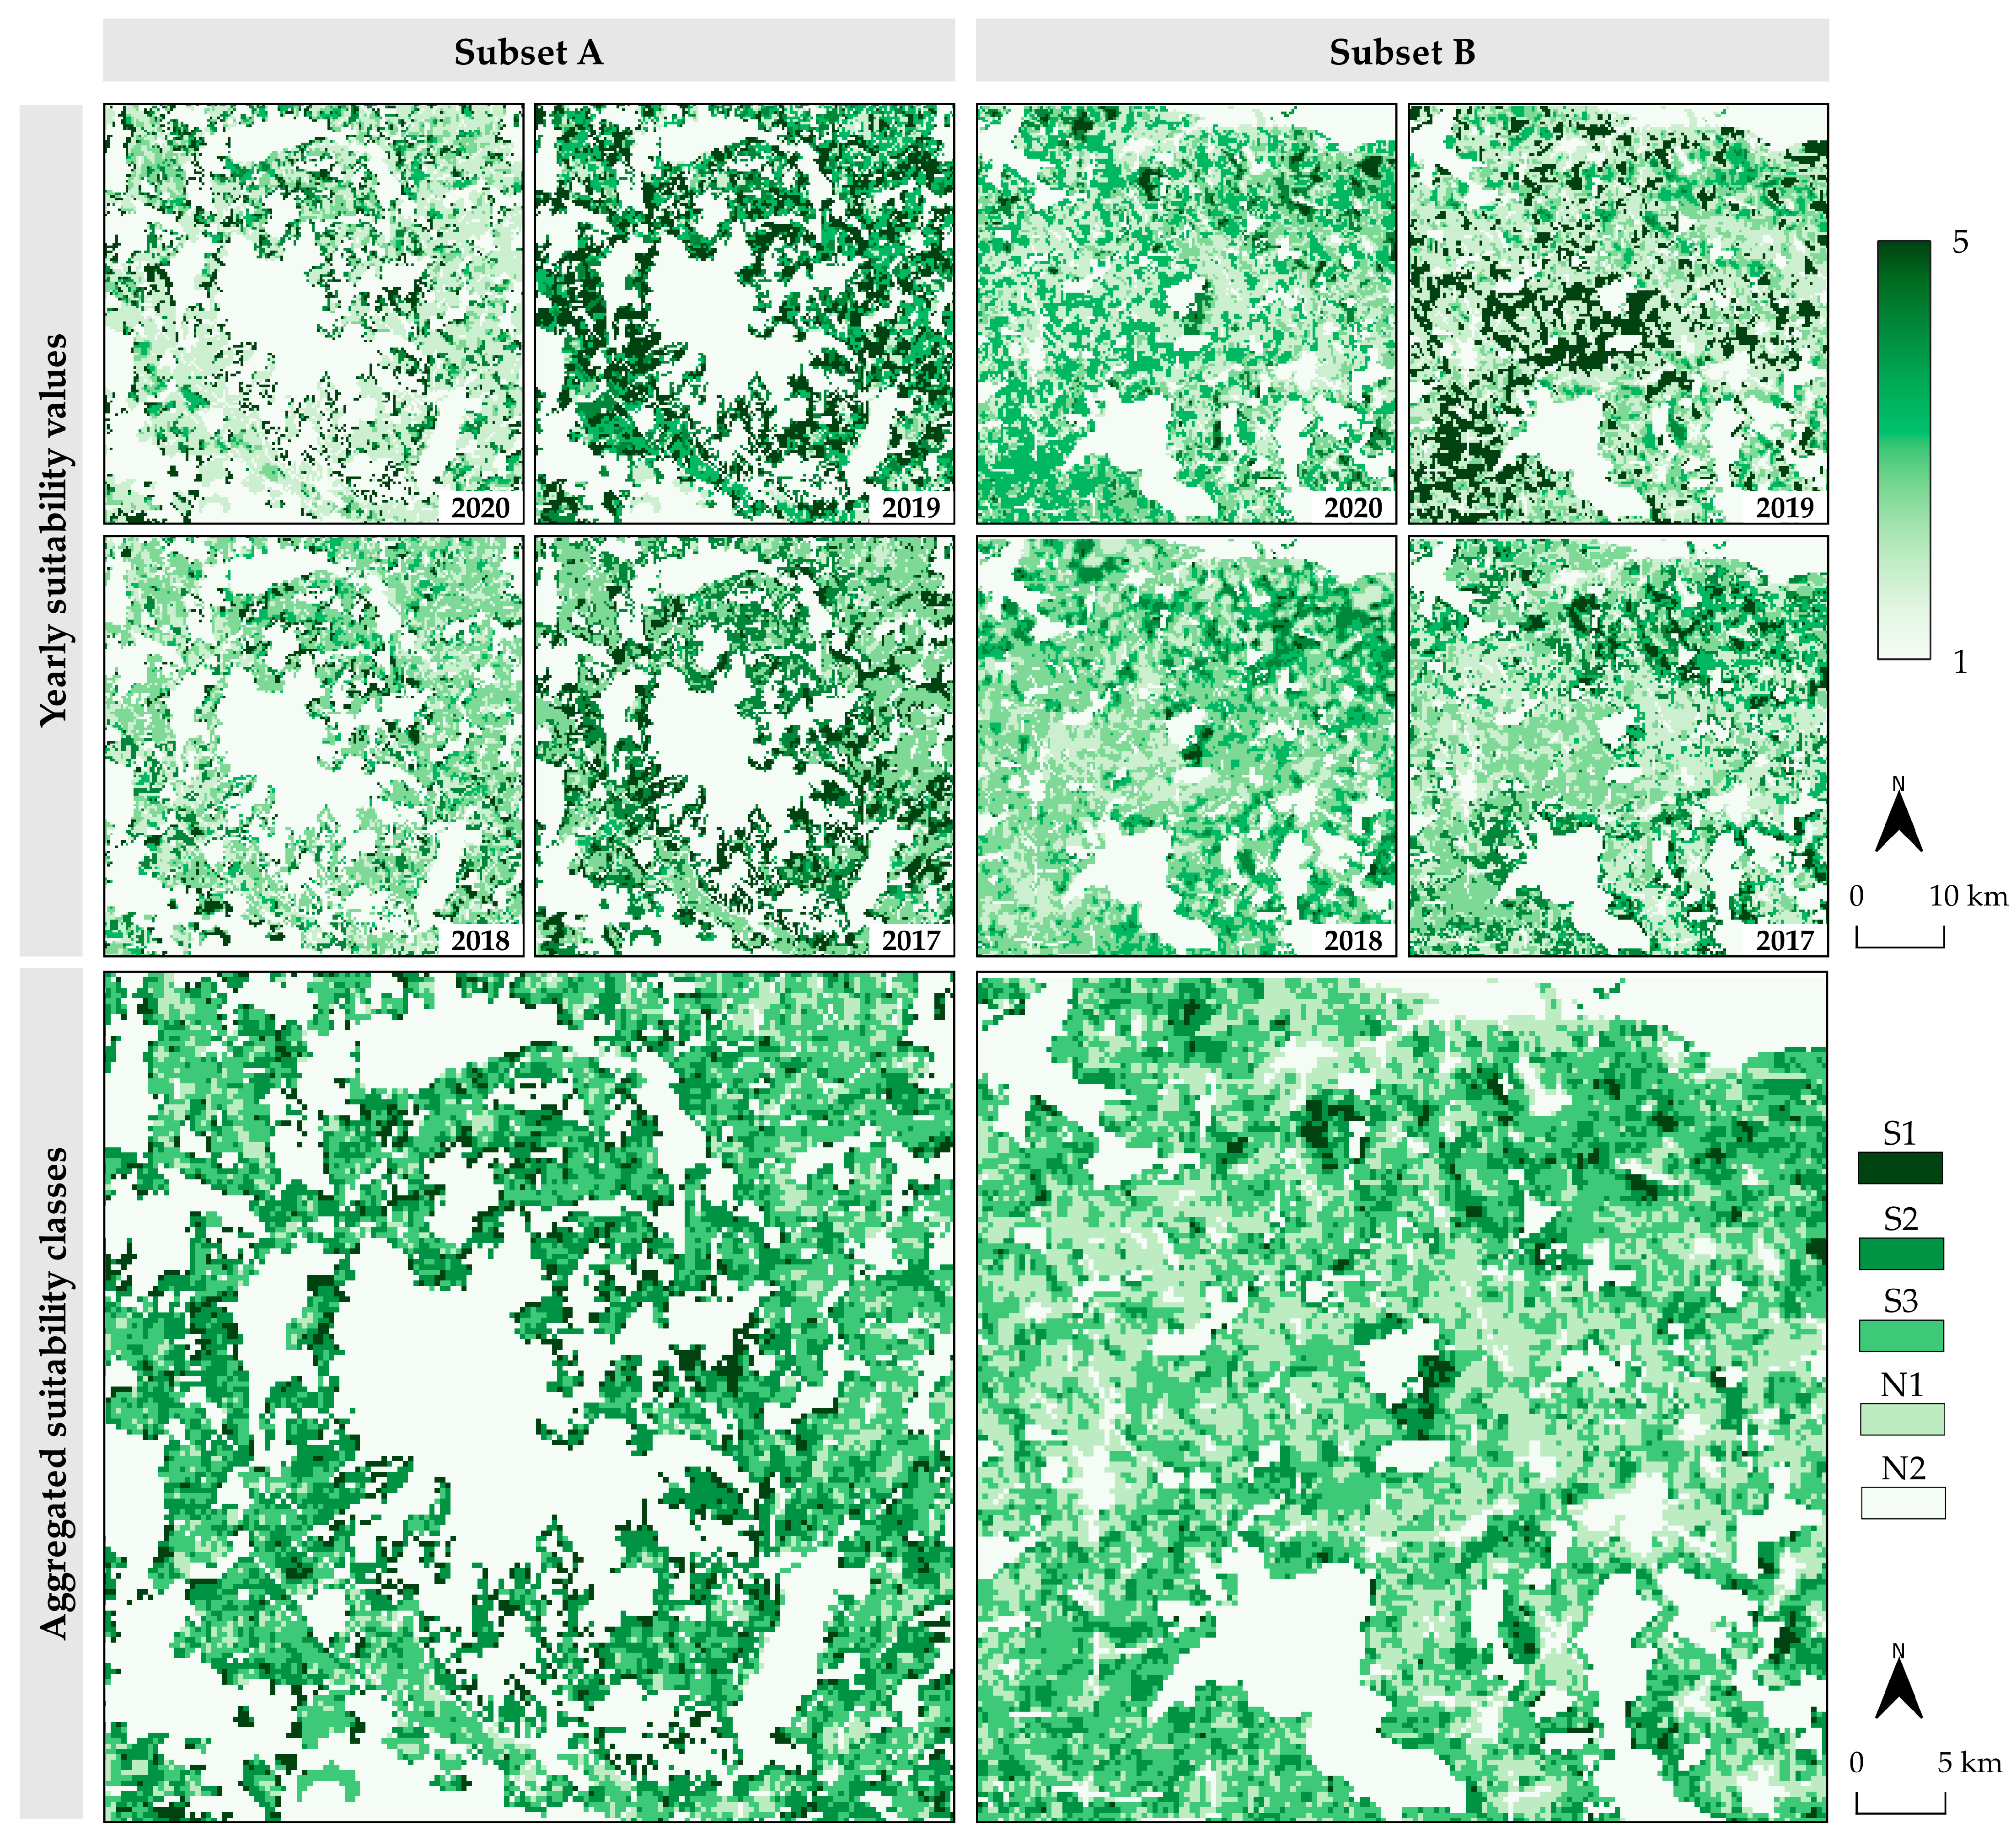
Yearly and aggregated cropland suitability classes for soybean cultivation per subset are displayed in Figure 8. The average aggregated suitability values were 2.376 and 2.406 for Subsets A and B, respectively. Yearly suitability values in 2018 and 2020 produced up to 24.4% lower values compared to the mean yearly suitability in Subset A (Table 6). Traditionally intensively utilized agricultural areas in subset B produced a slightly higher percentage of suitable classes for soybean cultivation (S1–S3) with 49.5% of the subset area, compared to the 49.3% in Subset A. However, multiple locations in Subset A reached a higher suitability peak, especially regarding the most suitable S1 class. The most suitable aggregated suitability classes in Subset A were observed in the central part of the subset, containing soybean parcels dominantly surrounded by forests. The most suitable areas for soybean cultivation in Subset B were largely dispersed over the subset, while the currently non-suitable land was dominantly concentrated by the larger settlements.

4. Discussion

The advantages of the proposed novel cropland suitability assessment method consist of a straightforward and computationally efficient machine learning application and the global availability of open climate, soil, topographic and vegetation data. These are some of the main factors which could ensure its extensive application in the future [64]. The proposed approach provides a stable basis for cropland suitability determination as a potentially superior long-term alternative to GIS-based multicriteria analysis. This approach allows the user to overcome the two most impactful disadvantages of the conventional GIS-based multicriteria approach, allowing the inclusion of complex input data [50] and avoiding subjectivity in suitability assessment [18]. The additional advantage to the conventional approach is the accuracy assessment of the easily accessible LAI and FAPAR data [38]. This process provides a step forward in the objective assessment of model performance and the comparison of FAO suitability classes between two individual datasets. The proposed method was successfully performed using a commonly available desktop personal computer, which cuts down the need for expensive hardware. However, there are still several limitations yet to be resolved. Based on the results obtained in this study and the extensive review of the literature, the improvements of the proposed cropland suitability assessment approach can be performed in four general directions, namely by:
  • adopting performance evaluation for multiple crop types with the aim of determining the multidimensional cropland suitability dataset for a particular study area, presenting a complete solution for the agricultural land management;
  • modification of the suitability assessment approach using high-resolution Sentinel-2 satellite images for the cropland suitability assessment at micro-locations;
  • improvement of the present suitability assessment method considering the optimization of training samples and input covariates;
  • implementation of the predicted soybean cropland suitability in practice considering present agricultural practices in the study area.
Cropland suitability classes predicted using the proposed method primarily reflect suitability consistency throughout multiple years. While the advantage of the relative unsupervised classification of LAI and FAPAR values for the creation of training samples makes it resistant to the annual extremes caused by weather events, at the same time there is some ambiguity in the absolute suitability levels of these values. This could be addressed with the integration of yield data as the measure of absolute suitability levels with the proposed approach based on satellite-derived biophysical crop properties. LAI and FAPAR showed the sensitivity to vegetation properties of various crop types in previous studies, possibly presenting universal crop suitability indicators [65]. Gitelson [37] noted the FAPAR sensitivity to canopy structures and photosynthetic specificities of various crop types, including soybean and maize. The accurate determination of biophysical crop properties was maintained using the high spatial resolution Sentinel-2 and moderate spatial resolution Sentinel-3 products. This strongly indicates the applicability of the proposed method through multiple scales of interest for agricultural land management for major crop types. Moreover, the global coverage and open data availability of both Sentinel-2 and Sentinel-3 ensure widespread applicability of this method in the future [15]. Present methodology focuses on the larger agricultural parcels (above 10 ha) due to the restrictions of spatial resolution of PROBA-V products. Sentinel-2 images require additional processing but would enable expansion of the proposed methods on much smaller agricultural parcels. LAI and FAPAR derived from the 10 m spatial resolution Sentinel-2 images were successfully implemented in crop suitability studies [28], presenting a basis of the proposed method upgrade for the micro-scale analysis. The possible limitation during the creation of training and test samples using LAI and FAPAR as reference values might be the availability of soybean or other crop types ground truth agricultural parcels on the national level. Since these data are usually collected and distributed by national agencies, these data might not be easily accessible in some less developed parts of the world. However, this can be overcome by implementing crop type classification algorithms based on LAI and FAPAR using machine learning, which enabled the extraction of a particular crop type with 80% or higher accuracy in a recent study by Waldner et al. [65].
The yearly prediction accuracy trends from this study imply that the inclusion of the larger sample count over the larger area would result in higher prediction accuracy. Such an approach would also ensure the applicability of the proposed cropland suitability assessment method for minor crop types. The optimal training sample count in the restricted subset areas within Continental Croatia could be ensured for major crop types like soybean, wheat, maize, sunflower and rapeseed at the present time [40]. Additionally, the inclusion of additional covariates in the proposed cropland suitability assessment method could benefit the prediction accuracy, especially using RF [50]. The observations from sensitivity analysis considering the proximity to major land cover classes and soil types indicate that these covariates would be an important addition to future studies. Heterogeneity of suitability values of proximity zones to urban areas indicated a possible significant impact of socio-economic covariates in cropland suitability assessment, like population density [66]. Potential and actual evapotranspiration [8] and actual solar irradiation [67] were successfully derived using the free remote sensing data sources. These covariates would also likely improve the presently used theoretical values calculated from DEM for the majority of crop types besides soybean. Hengl et al. [50] noted the sensitivity of machine learning methods to inaccuracies in covariate data, which could have a significant impact on model performance. This indicates a necessity of accurate harmonization of input data during the resampling process, especially considering a more sensitive downscaling process, which should be considered during the addition of new covariates. The implementation of deep learning methods could present a viable option for the improvement of cropland suitability assessment accuracy in the future. At the present time, these methods generally lack computational efficiency of prediction due to the presence of large and complex training and covariate data [68]. Since this approach requires considerable and expensive hardware resources, it presently impairs the global and low-cost character of the proposed method. With the further improvement of deep learning, it is expected that it will enable an upgrade to conventional machine learning, presenting an even more effective basis of cropland suitability assessment.
Another possible improvement of prediction accuracy of the machine learning methods is through implementing the most recent covariate data. The likely reasons for the lower prediction accuracy for the years 2019 and 2020 compared to the years prior were minor temporal disagreements of input covariates with the study period. Low mean cropland suitability values during the dry and hot year of 2018, compared to the years 2017 and 2019, further reinforces the need for accurate recent data due to sensitivity of suitability values to climate input. The application of the SoilGrids data referenced to the year 2017 was slightly obsolete for the prediction forthcoming years, since soil chemical properties like N and SOC are susceptible to temporal variations [69]. The ambiguities related to the inability to accurately track and model crop and soil management systems by farmers at the local scale indicate the necessity of including multiple data sources for the multi-year cropland suitability assessment. A possible solution is the integration of presently used SoilGrids data with the updated SoilGrids version 2.0 [70], which should establish a reliable global soil dataset for future studies. Similar observations were made about the climate data, which are subjected to the recent impact of climate change [4]. Even with the application of the most recent global climate data using the CHELSA dataset (1979–2013) [49], the effects of climate change within the past decade remain largely uncovered by previous cropland suitability assessment studies. Therefore, the comparison of multitemporal cropland suitability results, periodically updated with new climate data, would likely reflect climate change effects and allow farmers to make necessary adjustments. A possible solution for including the most recent climate change in the prediction could be the integration of present global climate datasets with the historic weather data within the study period [11]. This approach could enhance the proposed method by including the most recent climate trends using the freely accessible global weather data from a variety of online weather portals or national meteorological agencies.

5. Conclusions

The proposed cropland suitability assessment method based on machine learning represents a potential alternative and upgrade to conventional cropland suitability determination using a conventional GIS-based multicriteria analysis. Its advantages are primarily reflected in its computational efficiency, objectivity during the prediction and the ability to integrate complex input covariates. The proposed method is based on open remote sensing and GIS data and software, which makes it widely available worldwide. RF produced superior suitability assessment results to SVM in cases of moderate sample count and a high amount of complex input covariates. Its accuracy is expected to further grow with the inclusion of the additional covariates, including socio-economic covariates, evapotranspiration, solar irradiation and proximity to land cover classes. The creation of the study area larger than 50 × 50 km2 is also expected to increase suitability assessment accuracy, due to the increased training sample count and better model fitting. The presence of the highly suitable S1 class per FAO classification was noted in the 6.1% of Subset A and 1.5% of Subset B. This observation encourages the re-evaluation of present agricultural land management plans, as the agricultural land in Subset A is presently not adequately utilized for soybean cultivation, contrary to the intensively cultivated agricultural land in Subset B.
The accurate and straightforward cropland suitability determination method is necessary to ensure a widely available solution for effective agricultural land management for the sustainability of agricultural production. The proposed method overcomes the limitations of the conventionally used GIS-based multicriteria analysis, and could turn the attention to machine learning in future cropland suitability determination studies. Future studies will be directed in its adjustment to various crop types and the scaling to micro-locations by implementing high-resolution Sentinel-2 images.

Author Contributions

Conceptualization, D.R. and M.G.; methodology, D.R.; software, D.R.; validation, D.R., M.J., M.G., I.P. and O.A.; formal analysis, D.R.; investigation, D.R.; resources, D.R., M.J. and M.G.; data curation, D.R.; writing—original draft preparation, D.R. and M.G.; writing—review and editing, D.R., M.J., M.G., I.P. and O.A.; visualization, D.R.; supervision, M.J., M.G., I.P. and O.A.; project administration, M.J. and M.G.; funding acquisition, M.J., M.G. and O.A. All authors have read and agreed to the published version of the manuscript.

Funding

This research received no external funding.

Acknowledgments

This work was supported by the Faculty of Agrobiotechnical Sciences Osijek as a part of the scientific project: ‘AgroGIT—technical and technological crop production systems, GIS and environment protection’. This work was supported by the University of Zagreb as a part of the scientific project: “Advanced photogrammetry and remote sensing methods for environmental change monitoring” (Grant No. RS4ENVIRO).

Conflicts of Interest

The authors declare no conflict of interest.

Appendix A

Table A1. Climate properties of subset areas per year in the 2017–2020 period between April and October.
Subset/YearAir Temperature (April–October)Precipitation (April–October)
Mean CHELSAAnnualDifference from MeanMean CHELSAAnnualDifference from Mean
A/202017.5 °C17.1°C–2.1%547.6 mm640.1 mm+16.9%
A/201917.4°C–0.3%689.5 mm+25.9%
A/201818.4°C+5.2%479.6 mm–12.4%
A/201717.4°C–0.5%546.5 mm–0.2%
B/202017.9 °C17.8°C–0.3%449.2 mm462.3 mm+2.9%
B/201918.1°C+1.3%558.7 mm+24.4%
B/201819.2°C+7.2%422.0 mm–6.1%
B/201718.0°C+0.8%449.5 mm+0.1%
Table A2. The accuracy assessment of downscaling methods of CHELSA mean air temperature and precipitation data compared to ground truth data from DHMZ stations.
CHELSA DatasetMean Air Temperature (°C)Precipitation (mm)
R2RMSER2RMSE
Native (1000 m)0.95130.96430.719043.3024
NN (300 m)0.95070.96590.713743.9376
BI (300 m)0.95120.96310.712843.9296
BSI (300 m)0.95130.96460.720343.1707
NN: nearest neighbour, BI: bilinear interpolation, BSI: B-spline interpolation.
Table A3. Mean LAI and FAPAR values per suitability class after K-means unsupervised classification.
YearSuitability ClassSubset ASubset B
ElementsMean LAIMean FAPARElementsMean LAIMean FAPAR
2020S1233.0580.647522.7870.551
S2422.4880.5351482.3550.545
S3522.3760.571741.9900.545
N1572.1260.5521711.9880.534
N2621.9240.5611151.5560.495
2019S1322.1220.582481.9690.541
S2472.2800.533692.3660.493
S3541.9120.5441572.1660.507
N1391.9670.5061861.8330.507
N2341.8080.5201581.6510.508
2018S1742.5240.538752.4960.498
S2372.2910.5211532.1830.500
S3661.9540.5601971.8480.490
N1632.0720.5261741.5520.475
N2641.7880.511681.5660.455
2017S1232.2030.5881282.0760.495
S2482.0170.554781.7210.507
S3572.1310.4882031.6460.461
N1841.5710.495781.4650.450
N2871.8010.4771811.3330.441

References

  1. Bengochea Paz, D.; Henderson, K.; Loreau, M. Agricultural Land Use and the Sustainability of Social-Ecological Systems. Ecol. Model. 2020, 437, 109312. [Google Scholar] [CrossRef] [PubMed]
  2. Food and Agriculture Organization of the United Nations (Ed.) The Future of Food and Agriculture: Trends and Challenges; Food and Agriculture Organization of the United Nations: Rome, Italy, 2017; ISBN 978-92-5-109551-5. [Google Scholar]
  3. Yu, J.; Wu, J. The Sustainability of Agricultural Development in China: The Agriculture–Environment Nexus. Sustainability 2018, 10, 1776. [Google Scholar] [CrossRef] [Green Version]
  4. Nelson, G.; Bogard, J.; Lividini, K.; Arsenault, J.; Riley, M.; Sulser, T.B.; Mason-D’Croz, D.; Power, B.; Gustafson, D.; Herrero, M.; et al. Income Growth and Climate Change Effects on Global Nutrition Security to Mid-Century. Nat. Sustain. 2018, 1, 773–781. [Google Scholar] [CrossRef]
  5. Tang, L.; Hayashi, K.; Kohyama, K.; Leon, A. Reconciling Life Cycle Environmental Impacts with Ecosystem Services: A Management Perspective on Agricultural Land Use. Sustainability 2018, 10, 630. [Google Scholar] [CrossRef] [Green Version]
  6. Jurišić, M.; Radočaj, D.; Šiljeg, A.; Antonić, O.; Živić, T. Current Status and Perspective of Remote Sensing Application in Crop Management. J. Cent. Eur. Agric. 2021, 22, 156–166. [Google Scholar] [CrossRef]
  7. Song, G.; Zhang, H. Cultivated Land Use Layout Adjustment Based on Crop Planting Suitability: A Case Study of Typical Counties in Northeast China. Land 2021, 10, 107. [Google Scholar] [CrossRef]
  8. Akpoti, K.; Kabo-bah, A.T.; Zwart, S.J. Agricultural Land Suitability Analysis: State-of-the-Art and Outlooks for Integration of Climate Change Analysis. Agric. Syst. 2019, 173, 172–208. [Google Scholar] [CrossRef]
  9. Harrison, P. (Ed.) World Agriculture: Towards 2015/2030: Summary Report; Food and Agriculture Organization of the United Nations: Rome, Italy, 2002; ISBN 978-92-5-104761-3. [Google Scholar]
  10. United States Department of Agriculture. World Agricultural Supply and Demand Estimates. Available online: https://www.usda.gov/oce/commodity/wasde/wasde0421.pdf (accessed on 13 May 2021).
  11. Radočaj, D.; Jurišić, M.; Gašparović, M.; Plaščak, I. Optimal Soybean (Glycine Max L.) Land Suitability Using GIS-Based Multicriteria Analysis and Sentinel-2 Multitemporal Images. Remote Sens. 2020, 12, 1463. [Google Scholar] [CrossRef]
  12. Dedeoğlu, M.; Dengiz, O. Generating of Land Suitability Index for Wheat with Hybrid System Aproach Using AHP and GIS. Comput. Electron. Agric. 2019, 167, 105062. [Google Scholar] [CrossRef]
  13. Jurišić, M.; Plaščak, I.; Antonić, O.; Radočaj, D. Suitability Calculation for Red Spicy Pepper Cultivation (Capsicum Annum L.) Using Hybrid GIS-Based Multicriteria Analysis. Agronomy 2020, 10, 3. [Google Scholar] [CrossRef] [Green Version]
  14. Binte Mostafiz, R.; Noguchi, R.; Ahamed, T. Agricultural Land Suitability Assessment Using Satellite Remote Sensing-Derived Soil-Vegetation Indices. Land 2021, 10, 223. [Google Scholar] [CrossRef]
  15. Radočaj, D.; Obhođaš, J.; Jurišić, M.; Gašparović, M. Global Open Data Remote Sensing Satellite Missions for Land Monitoring and Conservation: A Review. Land 2020, 9, 402. [Google Scholar] [CrossRef]
  16. Seyedmohammadi, J.; Sarmadian, F.; Jafarzadeh, A.A.; McDowell, R.W. Development of a Model Using Matter Element, AHP and GIS Techniques to Assess the Suitability of Land for Agriculture. Geoderma 2019, 352, 80–95. [Google Scholar] [CrossRef]
  17. Saaty, T.L.; Ozdemir, M.S. Why the Magic Number Seven plus or Minus Two. Math. Comput. Model. 2003, 38, 233–244. [Google Scholar] [CrossRef]
  18. Li, Z.; Fan, Z.; Shen, S. Urban Green Space Suitability Evaluation Based on the AHP-CV Combined Weight Method: A Case Study of Fuping County, China. Sustainability 2018, 10, 2656. [Google Scholar] [CrossRef] [Green Version]
  19. Maxwell, A.E.; Warner, T.A.; Fang, F. Implementation of Machine-Learning Classification in Remote Sensing: An Applied Review. Int. J. Remote Sens. 2018, 39, 2784–2817. [Google Scholar] [CrossRef] [Green Version]
  20. Roell, Y.E.; Beucher, A.; Møller, P.G.; Greve, M.B.; Greve, M.H. Comparing a Random Forest Based Prediction of Winter Wheat Yield to Historical Yield Potential. Agronomy 2020, 10, 395. [Google Scholar] [CrossRef] [Green Version]
  21. Feyisa, G.L.; Palao, L.K.; Nelson, A.; Gumma, M.K.; Paliwal, A.; Win, K.T.; Nge, K.H.; Johnson, D.E. Characterizing and Mapping Cropping Patterns in a Complex Agro-Ecosystem: An Iterative Participatory Mapping Procedure Using Machine Learning Algorithms and MODIS Vegetation Indices. Comput. Electron. Agric. 2020, 175, 105595. [Google Scholar] [CrossRef]
  22. Chemura, A.; Mutanga, O.; Dube, T. Separability of Coffee Leaf Rust Infection Levels with Machine Learning Methods at Sentinel-2 MSI Spectral Resolutions. Precis. Agric. 2017, 18, 859–881. [Google Scholar] [CrossRef]
  23. Jiang, D.; Ma, T.; Ding, F.; Fu, J.; Hao, M.; Wang, Q.; Chen, S. Mapping Global Environmental Suitability for Sorghum Bicolor (L.) Moench. Energies 2019, 12, 1928. [Google Scholar] [CrossRef] [Green Version]
  24. Gómez, D.; Salvador, P.; Sanz, J.; Casanova, J.L. Potato Yield Prediction Using Machine Learning Techniques and Sentinel 2 Data. Remote. Sens. 2019, 11, 1745. [Google Scholar] [CrossRef] [Green Version]
  25. Taghizadeh-Mehrjardi, R.; Nabiollahi, K.; Rasoli, L.; Kerry, R.; Scholten, T. Land Suitability Assessment and Agricultural Production Sustainability Using Machine Learning Models. Agronomy 2020, 10, 573. [Google Scholar] [CrossRef]
  26. Food and Agriculture Organization of the United Nations (FAO). A Framework for Land Evaluation, Chapter 3: Land Suitability Classifications. Available online: http://www.fao.org/3/x5310e/x5310e04.htm (accessed on 2 May 2021).
  27. Akpoti, K.; Kabo-bah, A.T.; Dossou-Yovo, E.R.; Groen, T.A.; Zwart, S.J. Mapping Suitability for Rice Production in Inland Valley Landscapes in Benin and Togo Using Environmental Niche Modeling. Sci. Total Environ. 2020, 709, 136165. [Google Scholar] [CrossRef]
  28. Ayu Purnamasari, R.; Noguchi, R.; Ahamed, T. Land Suitability Assessments for Yield Prediction of Cassava Using Geospatial Fuzzy Expert Systems and Remote Sensing. Comput. Electron. Agric. 2019, 166, 105018. [Google Scholar] [CrossRef]
  29. Wannasek, L.; Ortner, M.; Amon, B.; Amon, T. Sorghum, a Sustainable Feedstock for Biogas Production? Impact of Climate, Variety and Harvesting Time on Maturity and Biomass Yield. Biomass Bioenergy 2017, 106, 137–145. [Google Scholar] [CrossRef]
  30. Baldini, M.; Ferfuia, C.; Zuliani, F.; Danuso, F. Suitability Assessment of Different Hemp (Cannabis Sativa L.) Varieties to the Cultivation Environment. Ind. Crops Prod. 2020, 143, 111860. [Google Scholar] [CrossRef]
  31. Fensholt, R.; Sandholt, I.; Rasmussen, M.S. Evaluation of MODIS LAI, FAPAR and the Relation between FAPAR and NDVI in a Semi-Arid Environment Using in Situ Measurements. Remote Sens. Environ. 2004, 91, 490–507. [Google Scholar] [CrossRef]
  32. Gitelson, A.A.; Peng, Y.; Huemmrich, K.F. Relationship between Fraction of Radiation Absorbed by Photosynthesizing Maize and Soybean Canopies and NDVI from Remotely Sensed Data Taken at Close Range and from MODIS 250m Resolution Data. Remote Sens. Environ. 2014, 147, 108–120. [Google Scholar] [CrossRef] [Green Version]
  33. Khamala, E. Review of the Available Remote Sensing Tools, Products, Methodologies and Data to Improve Crop Production Forecasts; Food and Agriculture Organization of the United Nations: Rome, Italy, 2017. [Google Scholar]
  34. Marshall, M.; Thenkabail, P. Developing in Situ Non-Destructive Estimates of Crop Biomass to Address Issues of Scale in Remote Sensing. Remote Sens. 2015, 7, 808–835. [Google Scholar] [CrossRef] [Green Version]
  35. Casa, R.; Varella, H.; Buis, S.; Guérif, M.; De Solan, B.; Baret, F. Forcing a Wheat Crop Model with LAI Data to Access Agronomic Variables: Evaluation of the Impact of Model and LAI Uncertainties and Comparison with an Empirical Approach. Eur. J. Agron. 2012, 37, 1–10. [Google Scholar] [CrossRef]
  36. Habyarimana, E.; Piccard, I.; Catellani, M.; De Franceschi, P.; Dall’Agata, M. Towards Predictive Modeling of Sorghum Biomass Yields Using Fraction of Absorbed Photosynthetically Active Radiation Derived from Sentinel-2 Satellite Imagery and Supervised Machine Learning Techniques. Agronomy 2019, 9, 203. [Google Scholar] [CrossRef] [Green Version]
  37. Gitelson, A.A. Remote Estimation of Fraction of Radiation Absorbed by Photosynthetically Active Vegetation: Generic Algorithm for Maize and Soybean. Remote Sens. Lett. 2019, 10, 283–291. [Google Scholar] [CrossRef]
  38. Fuster, B.; Sánchez-Zapero, J.; Camacho, F.; García-Santos, V.; Verger, A.; Lacaze, R.; Weiss, M.; Baret, F.; Smets, B. Quality Assessment of PROBA-V LAI, FAPAR and FCOVER Collection 300 m Products of Copernicus Global Land Service. Remote Sens. 2020, 12, 1017. [Google Scholar] [CrossRef] [Green Version]
  39. Radočaj, D.; Jurišić, M.; Zebec, V.; Plaščak, I. Delineation of Soil Texture Suitability Zones for Soybean Cultivation: A Case Study in Continental Croatia. Agronomy 2020, 10, 823. [Google Scholar] [CrossRef]
  40. Jurišić, M.; Radočaj, D.; Krčmar, S.; Plaščak, I.; Gašparović, M. Geostatistical Analysis of Soil C/N Deficiency and Its Effect on Agricultural Land Management of Major Crops in Eastern Croatia. Agronomy 2020, 10, 1996. [Google Scholar] [CrossRef]
  41. Bogunovic, I.; Trevisani, S.; Seput, M.; Juzbasic, D.; Durdevic, B. Short-Range and Regional Spatial Variability of Soil Chemical Properties in an Agro-Ecosystem in Eastern Croatia. Catena 2017, 154, 50–62. [Google Scholar] [CrossRef]
  42. Croatian Bureau of Statistics, Areas and Production of Cereals and Other Crops. 2020. Available online: https://www.dzs.hr/Hrv_Eng/publication/2020/01-01-18_01_2020.htm (accessed on 15 May 2021).
  43. Galić Subašić, D. Influence of Irrigation, Nitrogen Fertilization and Genotype on the Yield and Quality of Soybean (Glycine max (L.) Merr.). Ph.D. Thesis, Josip Juraj Strossmayer University of Osijek, Faculty of Agrobiotechical Sciences Osijek, Osijek, Croatia, 2018. [Google Scholar]
  44. Liu, X.; Jin, J.; Herbert, S.J.; Zhang, Q.; Wang, G. Yield Components, Dry Matter, LAI and LAD of Soybeans in Northeast China. Field Crops Res. 2005, 93, 85–93. [Google Scholar] [CrossRef]
  45. Yadav, K.; Congalton, R.G. Accuracy Assessment of Global Food Security-Support Analysis Data (GFSAD) Cropland Extent Maps Produced at Three Different Spatial Resolutions. Remote Sens. 2018, 10, 1800. [Google Scholar] [CrossRef] [Green Version]
  46. Hsieh, P.F.; Lee, L.C.; Chen, N.Y. Effect of Spatial Resolution on Classification Errors of Pure and Mixed Pixels in Remote Sensing. IEEE Trans. Geosci. Remote Sens. 2001, 39, 2657–2663. [Google Scholar] [CrossRef]
  47. Anthony, P.; Malzer, G.; Sparrow, S.; Zhang, M. Soybean Yield and Quality in Relation to Soil Properties. Agron. J. 2012, 104, 1443–1458. [Google Scholar] [CrossRef]
  48. Müller, M.; Schneider, J.R.; Klein, V.A.; da Silva, E.; da Silva Júnior, J.P.; Souza, A.M.; Chavarria, G. Soybean Root Growth in Response to Chemical, Physical, and Biological Soil Variations. Front. Plant Sci. 2021, 12, 272. [Google Scholar] [CrossRef] [PubMed]
  49. Karger, D.N.; Conrad, O.; Böhner, J.; Kawohl, T.; Kreft, H.; Soria-Auza, R.W.; Zimmermann, N.E.; Linder, H.P.; Kessler, M. Climatologies at High Resolution for the Earth’s Land Surface Areas. Sci. Data 2017, 4, 170122. [Google Scholar] [CrossRef] [PubMed] [Green Version]
  50. Hengl, T.; de Jesus, J.M.; Heuvelink, G.B.M.; Gonzalez, M.R.; Kilibarda, M.; Blagotić, A.; Shangguan, W.; Wright, M.N.; Geng, X.; Bauer-Marschallinger, B.; et al. SoilGrids250m: Global Gridded Soil Information Based on Machine Learning. PLoS ONE 2017, 12, e0169748. [Google Scholar] [CrossRef] [PubMed] [Green Version]
  51. EU-DEM v1.1—Copernicus Land Monitoring Service. Available online: https://land.copernicus.eu/imagery-in-situ/eu-dem/eu-dem-v1.1 (accessed on 21 April 2021).
  52. PROBA-V Products User Manual v3.01. Available online: https://proba-v.vgt.vito.be/sites/proba-v.vgt.vito.be/files/products_user_manual.pdf (accessed on 21 April 2021).
  53. Liu, Y.; Dai, L. Modelling the Impacts of Climate Change and Crop Management Measures on Soybean Phenology in China. J. Clean. Prod. 2020, 262, 121271. [Google Scholar] [CrossRef]
  54. Liu, S.; Zhang, P.; Marley, B.; Liu, W. The Factors Affecting Farmers’ Soybean Planting Behavior in Heilongjiang Province, China. Agriculture 2019, 9, 188. [Google Scholar] [CrossRef] [Green Version]
  55. Böhner, J.; Antonić, O. Land-Surface Parameters Specific to Topo-Climatology. In Developments in Soil Science; Hengl, T., Reuter, H.I., Eds.; Geomorphometry; Elsevier: Amsterdam, The Netherlands, 2009; Chapter 8; Volume 33, pp. 195–226. [Google Scholar]
  56. Stein, A.; Riley, J.; Halberg, N. Issues of Scale for Environmental Indicators. Agric. Ecosyst. Environ. 2001, 87, 215–232. [Google Scholar] [CrossRef] [Green Version]
  57. Liu, H.; Weng, Q. Scaling Effect of Fused ASTER-MODIS Land Surface Temperature in an Urban Environment. Sensors 2018, 18, 4058. [Google Scholar] [CrossRef]
  58. Peng, S.; Ding, Y.; Liu, W.; Li, Z. 1 Km Monthly Temperature and Precipitation Dataset for China from 1901 to 2017. Earth Syst. Sci. Data 2019, 11, 1931–1946. [Google Scholar] [CrossRef] [Green Version]
  59. Dabija, A.; Kluczek, M.; Zagajewski, B.; Raczko, E.; Kycko, M.; Al-Sulttani, A.H.; Tardà, A.; Pineda, L.; Corbera, J. Comparison of Support Vector Machines and Random Forests for Corine Land Cover Mapping. Remote Sens. 2021, 13, 777. [Google Scholar] [CrossRef]
  60. Colditz, R.R. An Evaluation of Different Training Sample Allocation Schemes for Discrete and Continuous Land Cover Classification Using Decision Tree-Based Algorithms. Remote Sens. 2015, 7, 9655–9681. [Google Scholar] [CrossRef] [Green Version]
  61. Grabska, E.; Hostert, P.; Pflugmacher, D.; Ostapowicz, K. Forest Stand Species Mapping Using the Sentinel-2 Time Series. Remote Sens. 2019, 11, 1197. [Google Scholar] [CrossRef] [Green Version]
  62. Pontius, R.G.; Millones, M. Death to Kappa: Birth of Quantity Disagreement and Allocation Disagreement for Accuracy Assessment. Int. J. Remote Sens. 2011, 32, 4407–4429. [Google Scholar] [CrossRef]
  63. Food and Agriculture Organization of the United Nations (FAO). A Framework for Land Evaluation, Chapter 7: Land Suitability Assessment. Available online: http://www.fao.org/3/t0741e/T0741E10.htm (accessed on 16 May 2021).
  64. Wolanin, A.; Camps-Valls, G.; Gómez-Chova, L.; Mateo-García, G.; van der Tol, C.; Zhang, Y.; Guanter, L. Estimating Crop Primary Productivity with Sentinel-2 and Landsat 8 Using Machine Learning Methods Trained with Radiative Transfer Simulations. Remote Sens. Environ. 2019, 225, 441–457. [Google Scholar] [CrossRef]
  65. Waldner, F.; Lambert, M.-J.; Li, W.; Weiss, M.; Demarez, V.; Morin, D.; Marais-Sicre, C.; Hagolle, O.; Baret, F.; Defourny, P. Land Cover and Crop Type Classification along the Season Based on Biophysical Variables Retrieved from Multi-Sensor High-Resolution Time Series. Remote Sens. 2015, 7, 10400–10424. [Google Scholar] [CrossRef] [Green Version]
  66. Møller, A.B.; Mulder, V.L.; Heuvelink, G.B.M.; Jacobsen, N.M.; Greve, M.H. Can We Use Machine Learning for Agricultural Land Suitability Assessment? Agronomy 2021, 11, 703. [Google Scholar] [CrossRef]
  67. Gašparović, I.; Gašparović, M.; Medak, D. Determining and Analysing Solar Irradiation Based on Freely Available Data: A Case Study from Croatia. Environ. Dev. 2018, 26, 55–67. [Google Scholar] [CrossRef]
  68. Darwin, B.; Dharmaraj, P.; Prince, S.; Popescu, D.E.; Hemanth, D.J. Recognition of Bloom/Yield in Crop Images Using Deep Learning Models for Smart Agriculture: A Review. Agronomy 2021, 11, 646. [Google Scholar] [CrossRef]
  69. Pu, X.; Xie, J.; Cheng, H.; Yang, S. Temporal Trends of Soil Organic Carbon and Total Nitrogen Losses in Seasonally Frozen Zones of Northeast China: Responses to Long-Term Conventional Cultivation (1965–2010). Environ. Process. 2014, 1, 415–429. [Google Scholar] [CrossRef] [Green Version]
  70. Poggio, L.; de Sousa, L.M.; Batjes, N.H.; Heuvelink, G.; Kempen, B.; Ribeiro, E.; Rossiter, D. SoilGrids 2.0: Producing soil information for the globe with quantified spatial uncertainty. Soil 2021, 7, 217–240. [Google Scholar] [CrossRef]
Figure 1. Major components of the conventional and proposed cropland suitability determination methods.
Agronomy 11 01620 g001
Figure 2. Workflow of the proposed cropland suitability assessment method.
Agronomy 11 01620 g002
Figure 3. The study area with two 50 × 50 km subsets.
Agronomy 11 01620 g003
Figure 4. Two-step classification principle using K-means and machine learning for soybean cropland suitability assessment.
Agronomy 11 01620 g004
Figure 5. Scatterplot between ground truth climate data from DHMZ and the most accurate downscaling B-spline interpolation method.
Agronomy 11 01620 g005
Figure 6. Mean LAI and FAPAR values in the soybean vegetative periods during 2017–2020.
Agronomy 11 01620 g006
Figure 7. Relative importance of top five (out of 119) abiotic and vegetation covariates using Gini decrease values per yearly cropland suitability result.
Agronomy 11 01620 g007
Figure 8. Yearly and aggregated cropland suitability classes for soybean cultivation.
Agronomy 11 01620 g008
Table 1. General properties of subset areas.
PropertiesSubsetData Source
AB
Longitude/Latitude16°45′ E, 45°41′ N18°38′ E, 45°20′ N/
Major land cover classesAgricultural areas (55.5%), Forests (39.9%), Urban areas (2.9%)Agricultural areas (75.7%), Forests (17.8%), Urban areas (5.7%)CORINE 2018
Total country soybean area in 202010.1%22.8%APPRRR
Mean annual air temperature11.0 °C ± 0.2 °C11.1 °C ± 0.1 °CCHELSA
Mean air temperature
(April–October)
17.5 °C ± 0.3 °C17.9 °C ± 0.1 °CCHELSA
Total annual precipitation859.1 mm ± 34.7 mm685.9 mm ± 24.9 mmCHELSA
Total precipitation
(April–October)
547.6 mm ± 28.3 mm449.2 mm ± 14.2 mmCHELSA
Mean elevation134.8 m ± 41.0 m91.1 m ± 9.7 mEU-DEM
Mean slope1.5°0.4°EU-DEM
Major soil types per FAO85 classificationDystric Gleysol (Gd), Stagno-Gleyic Luvisol (Lgs)Eutric Gleysol (Ge), Mollic Gleysol (Gm), Orthic Luvisol (Lo)ESDC
APPRRR: Paying Agency for Agriculture, Fisheries and Rural Development of Croatia, ESDC: European Soil Data Centre.
Table 2. A generalized description of covariates used in the study.
Covariate GroupCovariateMeasurement UnitNative Spatial
Resolution (m)
Data Source
ClimateMean monthly air temperature°C1000CHELSA [49]
Minimum monthly air temperature°C
Maximum monthly air temperature°C
Total monthly precipitationmm
Bioclimatic variablesvarying
SoilNitrogencg kg−1250SoilGrids [50]
Soil organic carbondg kg−1
pH/
Cation exchange capacitymmol(c) kg−1
Clay contentg kg−1
Silt contentg kg−1
Sand contentg kg−1
Bulk densitycg cm−3
TopographicDigital elevation modelm25EU-DEM [51]
Slope°derived from EU-DEM
Aspect°
Total potential solar radiationkWh m−2
Topographic wetness index/
Wind exposition index/
VegetationDry matter productivitykg ha−1 day−1300PROBA-V [52]
Fraction of vegetation cover/
Table 3. Designation of FAO suitability classes according to suitability values obtained after machine learning classification.
FAO Suitability ClassPercentage of Maximum Suitability per FAO Specifications [63] Range of Suitability Values
S180–100%4–5
S260–80%3–4
S340–60%2–3
N120–40%1–2
N20–20%non-agricultural
Table 4. Training and test sample count and area covered per subset agricultural land.
Subset/YearTotal Sample CountArea (ha)Percentage of Subset Agricultural Land (%)
A/202023621241.53
A/201920618541.34
A/201830427361.97
A/201729926911.94
B/202056050402.67
B/201961855622.94
B/201866760033.18
B/201766860123.18
Table 5. Accuracy assessment of cropland suitability values prediction using machine learning methods.
Subset/
Year
MethodSuitability ValuesOA
5 (Very High)4 (High)3 (Moderate)2 (Low)1 (Very Low)
FocFocFocFocFoc
A/2020RF46.25.00.838.77.68.462.55.05.057.68.43.471.40.89.273.1
SVM43.84.23.440.66.79.251.79.22.536.210.115.159.06.76.763.0
A/2019RF66.73.81.977.82.92.965.73.87.746.27.75.841.76.76.775.0
SVM64.74.81.038.513.51.953.21.919.242.97.77.745.56.74.865.4
A/2018RF73.24.62.660.04.60.769.45.22.054.55.27.864.42.08.578.4
SVM51.07.87.852.45.21.355.99.20.744.77.29.858.02.011.868.6
A/2017RF76.91.30.750.06.03.369.06.00.066.13.39.372.23.36.780.0
SVM69.22.00.748.36.04.057.66.72.766.75.36.060.74.711.375.3
B/2020RF60.72.91.164.85.46.162.83.22.561.56.19.056.96.15.176.2
SVM44.05.10.055.87.67.660.04.31.462.23.612.659.25.84.773.6
B/2019RF67.91.61.373.21.61.969.25.23.962.77.55.865.04.27.179.9
SVM70.82.30.083.81.30.667.75.24.560.06.59.167.44.55.580.2
B/2018RF82.11.80.362.55.74.265.95.47.274.53.34.578.91.21.282.5
SVM99.90.00.066.36.31.861.54.810.864.85.75.477.81.80.681.3
B/2017RF73.02.73.365.13.01.569.26.44.576.21.81.276.62.15.583.9
SVM78.32.71.852.34.51.872.43.96.480.01.80.669.13.96.483.0
F: figure of merit (%); o: omission (%), c: commission (%); OA: overall agreement (%); highest OA values per subset/year were bolded.
Table 6. Class coverage area per aggregated soybean suitability class.
SubsetClass Coverage per Aggregated Suitability Class (%)
S1S2S3N1N2
A6.121.022.25.745.0
B1.513.434.625.125.3
Publisher’s Note: MDPI stays neutral with regard to jurisdictional claims in published maps and institutional affiliations.