Article

Comprehensive Evaluation of Salt Tolerance in Rice (Oryza sativa L.) Germplasm at the Germination Stage

College of Agriculture, Yangzhou University, Yangzhou 255009, China
*
Author to whom correspondence should be addressed.
Agronomy 2021, 11(8), 1569; https://doi.org/10.3390/agronomy11081569
Submission received: 29 June 2021 / Revised: 31 July 2021 / Accepted: 2 August 2021 / Published: 5 August 2021

Abstract

:
Salt stress reduces the yield and quality of rice. It is of great significance to screen out salt-tolerant varieties for the development and utilization of saline land. The study was carried out on 114 rice varieties; first, seven varieties were selected and treated with different salt concentrations (0, 50, 85, 120, 155, 190, 225 mM), and seven traits, including germination energy, germination capacity, shoot length, root length, root number, plant fresh weight, and seedling vigor index, were measured. The salt concentration at which the sodium chloride injury index was 50% of the control was considered the optimal salt concentration. Second, 114 rice germplasms were carried out under an optimal salt concentration (120 mM). Then, principal component analysis, fuzzy function analysis, stepwise regression analysis, correlation analysis, and systematic cluster analysis were carried out on each parameter. There was a significant correlation between each parameter and the D-value, and the correlation coefficient between the seedling vigor index and D-value was the highest. D-value = − 0.272 + 1.335 × STI − SVI + 0.549 × STI − RN − 0.617 × STI-RL + 0.073 × STI − GE, R2 = 0.986. Using this equation, the sodium chloride tolerance of rice in the germination experiment could be quickly identified. This study showed that the seedling vigor index was a reliable parameter to identify the salinity tolerance of rice varieties. Five groups were obtained by classification at a Euclidean distance of 5. There were 8 highly salt-tolerant cultivars, 23 salt-tolerant cultivars, 42 cultivars with moderate salt tolerance, 33 salt-sensitive cultivars, and 8 highly salt-sensitive cultivars. In this study, we found that Riguang was the most salt-tolerant rice variety, and Xiangxuejing15 was the most salt-sensitive variety.

1. Introduction

Coastal mudflat improvement and utilization have a long history, and coastal mudflats are a vital reserve resource for crop cultivation [1], but soil salinity in coastal regions is a major impediment to soil [2]. Salinity is a critical abiotic problem that inhibits the growth rate, and reduces the yield and quality of all crops [3], which can cause a reduction in growth and limit yield more than other toxic substances [4]. Moreover, plants under saline stress are more vulnerable to disease attacks [5]. The salt concentration is high when the surface soil is dry and decreases when the soil is flooded. Rice is grown under waterlogged conditions [6], and rice is the earliest crop for utilizing coastal saline lands after salt leaching and improved measures of tidal flat soil [7]. Developed and screening salt-tolerant rice cultivars moderate the impacts of salinity on rice production and contribute to progress towards food security at a worldwide scale.
Rice is a glycophytic plant, and salt stress has adverse effects on rice growth and yield, which depend on crop stages, stress severity and duration, and the tolerance of the rice variety [8]. Salt tolerance differs among different germplasms, and salt tolerance differs among different rice-growing periods in one rice variety. The seedling stage is one of the most sensitive to salt in rice [9]. Salt-tolerant rice can be grown in areas of saline, and developing salt-tolerant rice germplasms is an efficient way to decrease rice loss [10,11]. For instance, germination, seedling growth or biomass aggregation, and survival have been the foremost commonly utilized conditions for recognizing the salinity resistance potential in plants [12]. There have been more studies on salt tolerance evaluation and screening thus far. Zhang et al. identified 34 rice cultivars tolerant to a 0.3% sodium chloride solution at the seedling stage of 500 tested rice cultivars, and this experiment took longer than one month [13]. Sun et al. watered 550 rice cultivars with saline water for vegetative growth and reproductive growth; 78 rice cultivars were screened out, and this experiment took upwards of six months to complete [14]. However, Wu et al. determined salt tolerance at the germination stage of 549 rice germplasm resources using a seven-day test [15]. The growth period of rice is approximately half a year; if there are more rice varieties, it is time-consuming and always takes much work, and the salt content in the soil is distributed unevenly [16,17]. However, salt-tolerant screening experiments of the rice germination period are less time consuming: only seven to ten days [18,19]. The salt composition is evenly distributed over the water. As a result, rice seed germination measures are an appropriate way to assess the plant response to salt stress. The relatively high levels of salt in germination media generate high osmotic pressure in solution, inhibiting root uptake of water during germination [20]. High salinity delays and reduces the germination percentage of plants. Salinity decreases the germination percentage, root length, coleoptile length, and seedling growth [21]. These germination salt resistance screening results provide valuable data to encourage screening salt-resistant rice varieties [22]. The main objective of the present study was to screen salt-tolerant rice varieties under non-saline and saline treatments from 114 rice germplasms at the early germination stage and determine highly salt-tolerant and salt-sensitive varieties, and information from this study related to early-stage evaluation will also help researchers select rice germplasms with high salinity tolerance for the development and utilization of coastal tidal flats.

2. Materials and Methods

2.1. Experiment Materials

The seeds of rice varieties were kindly provided by Professor Haiyan Wei, which were collected from 28 to 30 October 2018 (rice mature period) in the fields of Taizhou city (120.14° E, 32.61° N), Jiangsu province, China. After drying all rice varieties, seeds were stored at 4 °C in a small cold storage house for germination experiments.

2.2. Experimental Design

First, the optimal salt concentration was determined. In this study, 114 rice germplasms were used for the experimental subjects, and 114 rice varieties were evaluated for salt tolerance. Seven rice varieties (Changruan 07-10, Shengxiang 66, Fujing 1608, Wujing 215, Changnongjing 14-7, Su 2110, Lianjing 15) were selected at random to determine the most appropriate sodium chloride concentration. For this, a series of six increasing concentrations of sodium chloride were used, i.e., 50, 85, 120, 155, 190, 225 mM, with distilled water used as the control treatment.
Second, salt-tolerant varieties were screened. The salt tolerance of 114 rice varieties was identified under optimal sodium chloride concentration. Uniformly sized rice seeds were selected for the experiment. All seeds were sterilized with 5% sodium hypochlorite solution for 30 min, and then washed three times with distilled water. After washing, 30 seeds of each rice germplasm were placed in a 9-cm Petri dish lined with two filter papers soaked in either 10 mL of purified water (control) or the same amount of a saline solution, and covered with a Petri dish lid to minimize evaporation. The Petri dishes containing seeds were placed in a growth chamber and appropriate amounts of pure water were added to keep the seed from drying out.
Experiments were conducted at the Research Institute of Rice Industrial Engineering Technology, Yangzhou University, in a growth chamber (HP 1000GS-B by Wuhan Ruihua Instrument & Equipment Co., LTD, Wuhan, China). During the experiments, a photoperiod of 12 h/12 h light/dark (light: 8:00–22:00, 28 °C; dark: 22:00–8:00, 25 °C) and a relative humidity of 75% were maintained in the growth chamber. Germinated seeds were defined as those in which the length of the root exceeded the length of the seed or the length of the shoot surpassed half the length of the seed [23]. When the sodium chloride injury index (SII) was 50% of the control, the sodium chloride concentration was deemed to be the best-fit sodium chloride concentration.

2.3. Measurement Indicators

To evaluate the salt tolerance of rice germplasms at the germination stage, the germination energy (GE), germination capacity (GC), shoot length (SL, cm), root length (RL, cm), root number (RN), plant fresh weight (PFW), and seedling vigor index (SVI) were determined. These parameters were calculated using the formulas below:
The GE was calculated at 4 DAS: GE = G4/T × 100%;
The GC was calculated at 10 DAS: GC = G10/T × 100%.
G4 is the number of germinated seeds at 4 DAS, G10 is the number of germinated seeds at 10 DAS, and T is the total number of seeds.
The SL, RL, PFW, and SVI were measured at 10 DAS.
The salt tolerance index (STI) was the ratio of the value for the sodium chloride treated plant/value for the control.
Salt injury index (SII): SII = 1 − STI [12].

2.4. Principal Component Analysis Salt Tolerance Evaluation

The salt tolerance of rice germplasms was evaluated using principal component analysis (PCA). First, all variables (STI-GE, STI-GC, STI-SL, STI-RL, STI-RN, STI-PFW, and STI-SVI) were standardized using z-scores. Then, PCA was performed for dimension reduction and principal components with eigenvalues greater than 0.9 were extracted.

2.5. Membership Function Analysis

The formulas for calculating the membership function values of the comprehensive indexes of different varieties of rice are as follows:
μ(Xi) = (Xi − X min)/(X max − X mix)
where Xi is the measured value of the index, and X Max and X mix are the maximum and minimum values of an index of all the tested materials, respectively [24].
The weight of each comprehensive index is:
W j = P j j = 1 n P j   j = 1 ,   2 , ,   n
where Wj represents the weight of the Jth comprehensive index, and P represents the contribution rate of the Jth comprehensive index of each rice variety obtained by PCA [25].

2.6. Calculation of the Comprehensive Evaluation Value of Salt Tolerance

The combined salinity tolerance of different rice varieties is as follows:
D = j = 1 n [ u ( X j ) × W j ]   j = 1 ,   2 , ,   n
where D-value is the comprehensive evaluation value of salt tolerance of each rice variety under the salt stress condition obtained from the comprehensive index evaluation.

2.7. Pearson Correlation Analysis

Pearson correlation analysis was carried out between the D-value and salt tolerance coefficient of each agronomic character of all rice varieties.

2.8. Stepwise Regression Analysis

The D-value was taken as the dependent variable, and the salt tolerance coefficient of agronomic traits of each rice variety was taken as the independent variable. Stepwise regression analysis was conducted by selecting the entry mode.

2.9. Hierarchical Cluster Analysis

Hierarchical cluster analysis was used to evaluate salt tolerance by Ward’s algorithm and the Euclidean distance. The salt tolerance of rice germplasms was segmented into five classes: highly salt tolerant, salt tolerant, moderately salt tolerant, salt sensitive, and highly salt sensitive.

2.10. Statistical Analysis

The data were arranged in Microsoft Excel 2016, and data were plotted using Origin 2018 software. Principal component analysis, Pearson correlation analysis, and stepwise regression analysis were assessed by IBM SPSS V.25 statistical software, and a dendrogram (hierarchical cluster analysis) was drawn on the bioinformatics platform. Availiable online:http://www.bioinformatics.com.cn (accessed on 28 July 2021).

3. Results

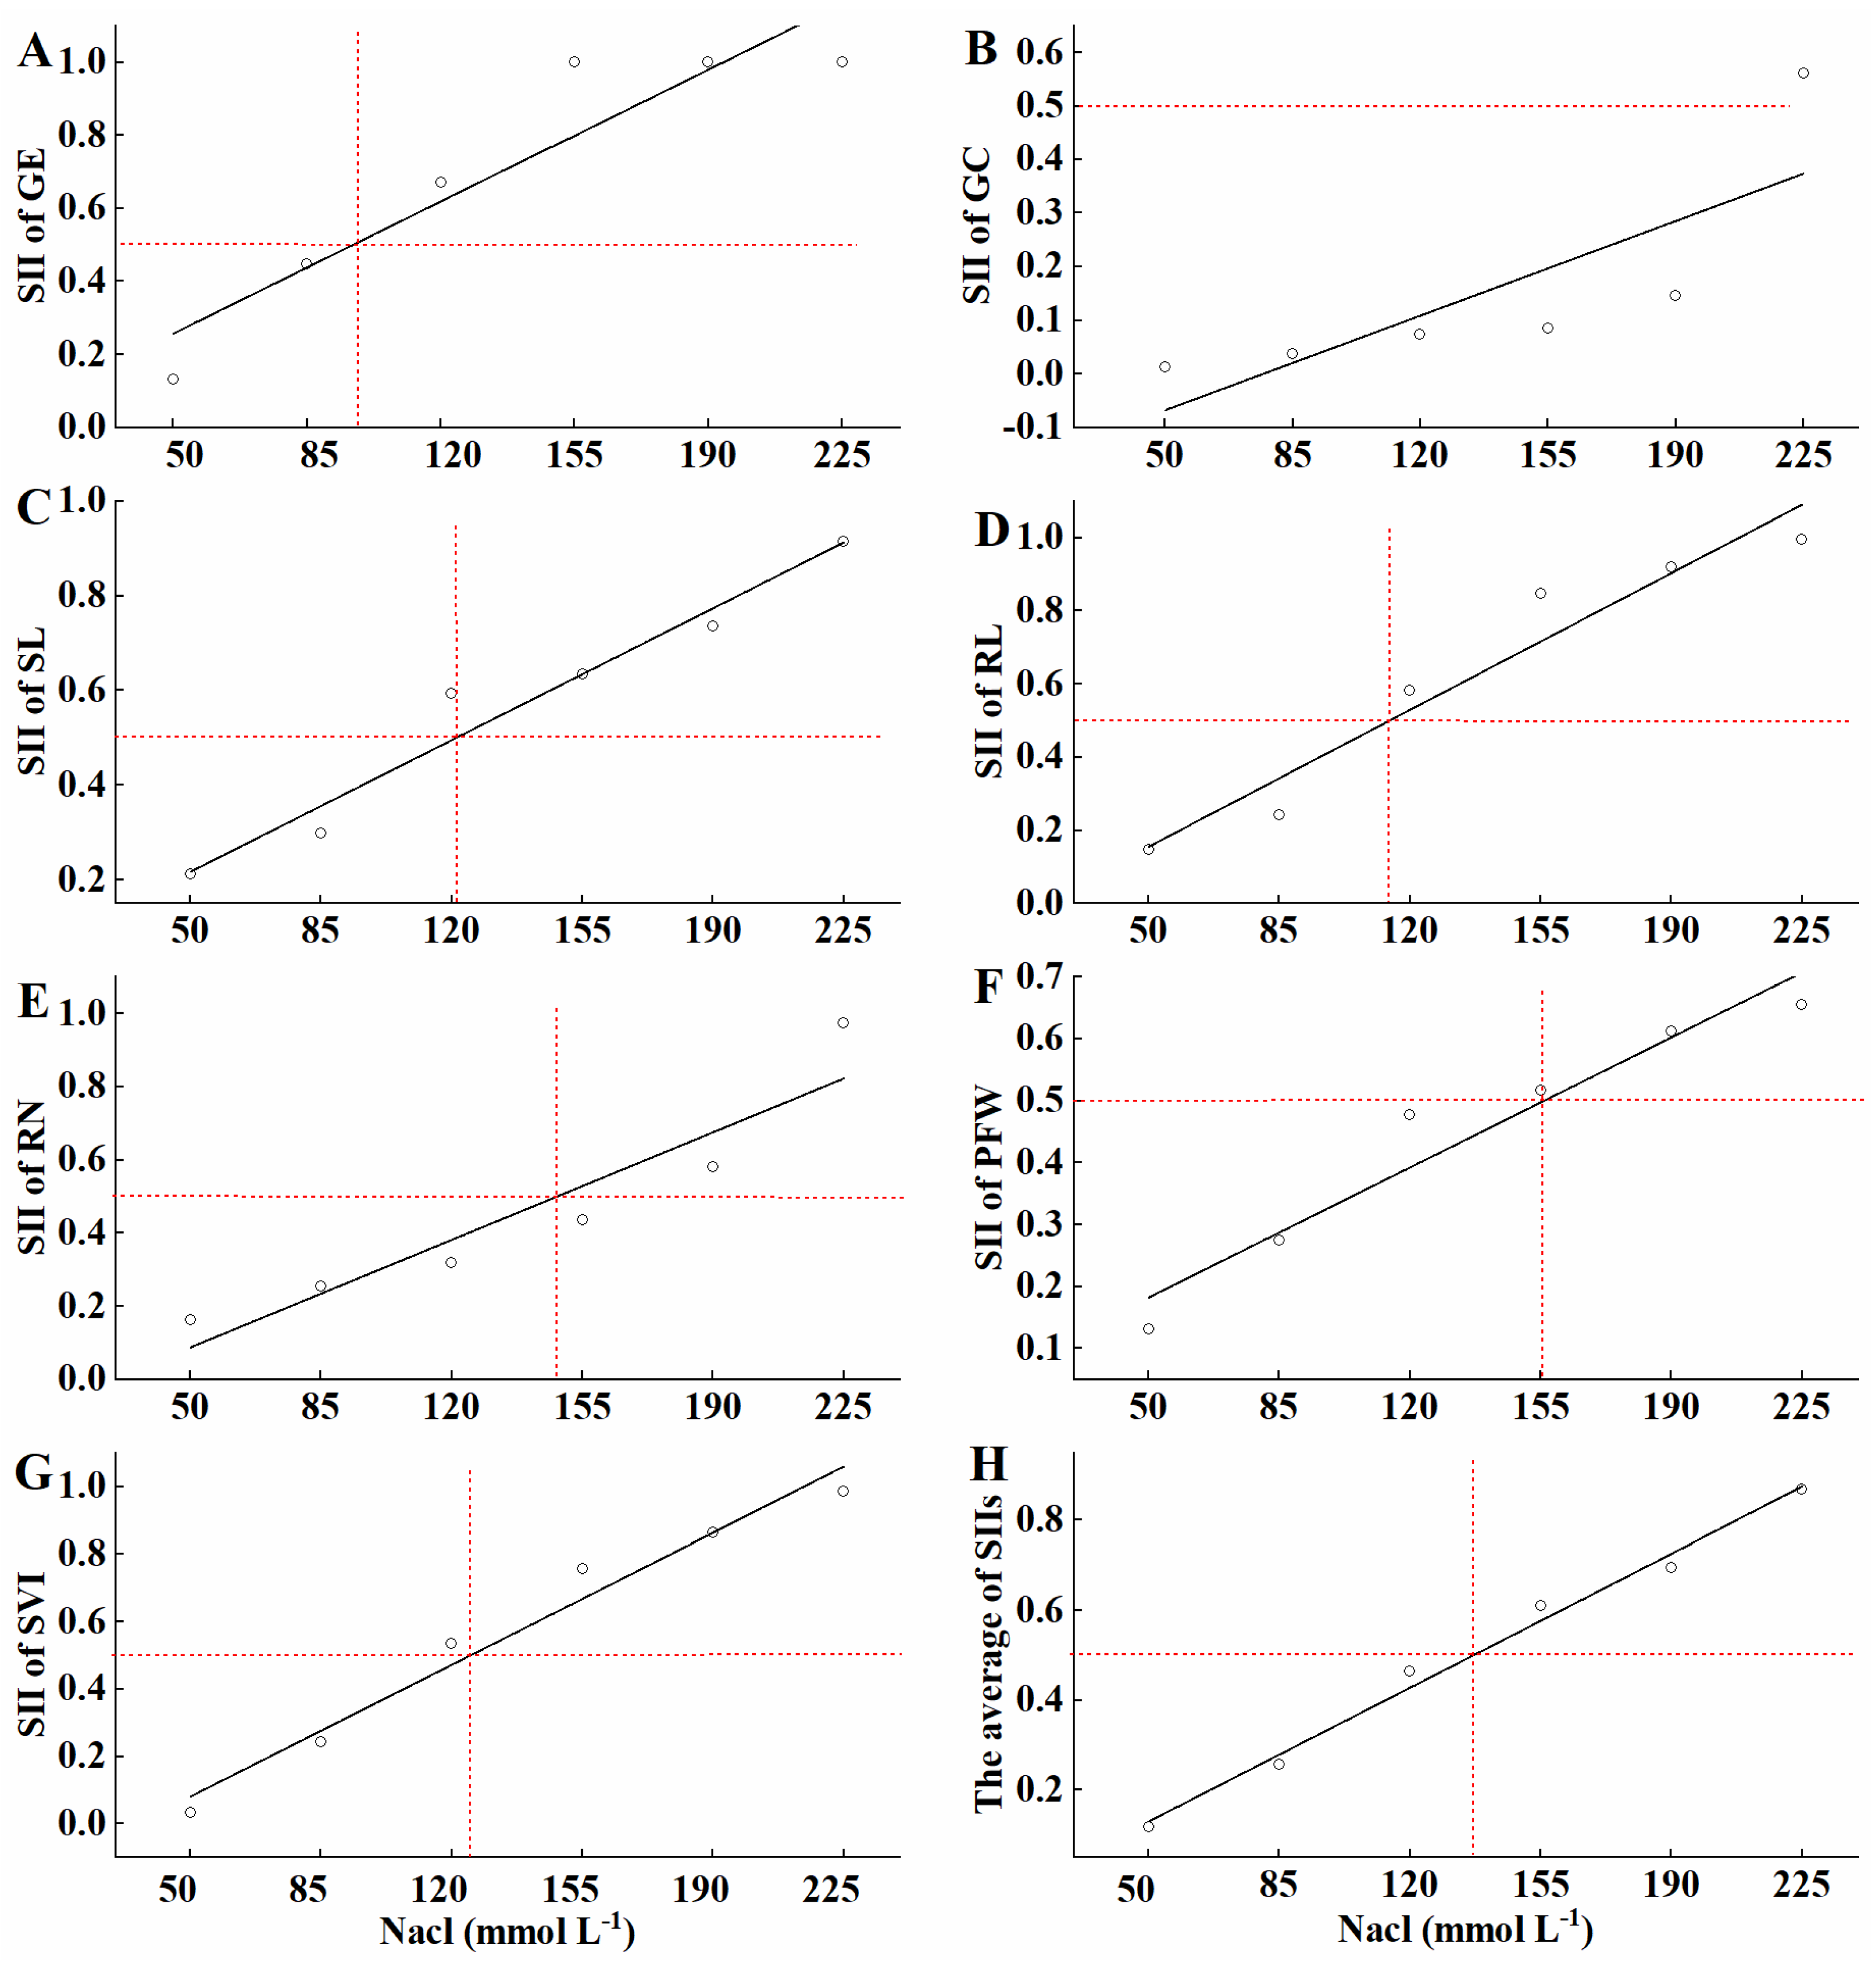
3.1. Determination of the Best-Fit Salt Concentration

We determined the GE, GC, SL, RL, RN, PFW, and SVI of seven rice germplasms at 4 and 10 DAS. As seen in Figure 1, when treated with 97.11 mM sodium chloride, the SII of GE decreased to 50% of that of the control. The sodium chloride concentration at which the SII of GC decreased to 50% was 275.35 mM. For SL, RL, RN, PFW, and SVI, the concentrations of sodium chloride that led to a 50% decrease in the SII were 121.17, 114.62, 148.34, 155.99, and 125.07 mM, respectively. The average SII was 136.83 mM, which was 50% lower than that of the control. Therefore, 120 mM sodium chloride was used in the present study to evaluate the salt tolerance of the other 114 rice germplasms.

3.2. Comprehensive Evaluation of Salt Tolerance of 114 Rice Germplasm Resources under Optimal Salt Concentrations

PCA for salinity and varietal evaluation was performed for all studied parameters. In PCA, the principal components with cumulative percentages greater than 85% were extracted. Three principal components had eigenvalues greater than 0.9. F1 accounted for 55.676% of the data variance, F2 accounted for 16.066%, and F3 accounted for 13.536%. The top three principal components accounted for 85.278% of the total variance (Table 1).
As seen in Table 1, SVI contributed the most to F1, followed by shoot length, root length, and plant fresh weight. The germination rate and germination potential contributed the most to F2, while the root number contributed the most to F3.
The principal component values, membership functions and D-values of 114 rice varieties participating in the experiment are shown in Table 2. The fuzzy function method was used to obtain the corresponding membership function values. Table 1 shows that the weights of the three principal components were 65.292%, 18.841%, and 15.874%. Using the weight and membership function is useful to judge the salt resistance of rice varieties in the integrated evaluation. The larger the D-value, the stronger the salt resistance, and vice versa. This method more objectively reflected all participants in the test of the salt resistance of rice varieties. As seen in Table 2, Riguang had the highest salt tolerance, followed by Ningjing 7 and Haidao 86. Xiangxuejing 15 showed the weakest salt tolerance, followed by Huxiangjing 106.

3.3. Stepwise Regression Analysis of 114 Rice Germplasm Resources

In this study, the D-value in Table 2 was taken as the dependent variable, the salt tolerance coefficient of seven parameter indexes at 120 mM salt concentration was taken as the independent variable to conduct stepwise regression analysis, and the optimal regression equation was established: D-value = −0.272 + 1.335 × STI − SVI + 0.549 × STI − RN − 0.617 × STI − RL + 0.073 × STI − GE. R2 = 0.986. Table 3 evaluates the prediction accuracy of the regression equation from the aspects of prediction difference and prediction accuracy. The prediction errors of all rice varieties are less than 0.031, and the prediction accuracy of 99.12% rice varieties is greater than 90%. Xiangxuejing 15 was the most sensitive variety to salt among all varieties, and its prediction accuracy was the lowest at 21.79%.
According to the regression equation, among all parameter indexes, the significant positive correlation coefficient between the SVI and D-value was the largest, and the SVI was the most representative of the salinity tolerance of rice varieties. The greater the SVI of rice varieties, the greater the value of D, indicating the stronger salt tolerance of the rice varieties. Conversely, salt tolerance is weaker.

3.4. Pearson Correlation between Salt Gradient and Germination Index

Pearson correlation analysis reflects the closeness and the degree of the linear relationship between the two factors. As evident from Table 4, Pearson correlations were observed between STI-GE, STI-GC, STI-SL, STI-RL, STI-RN, STI-PFW, STI-SVI, and the D-value. Of these, the highest Pearson correlation coefficient was between STI-SVI and STI-RL (0.96). The second highest Pearson correlation coefficient was observed between STI-SVI and STI-SL (0.82), followed by the Pearson correlation between STI-SL and STI-PFW (0.81). The Pearson correlation coefficient between STI-GE and STI-RN (0.11) was the lowest.
As seen in Table 4, the salt tolerance coefficient of each parameter index in this experiment was significantly correlated with the D-value, but the correlation coefficients varied in size.
Among them, the correlation coefficient between the STI-SVI and D-value was the highest, and the correlation coefficient was 0.83. The second was STI-SL, STI-PFW, STI-RN, STI-RL, STI-GC, and STI-GE in the order of strength, and their correlation coefficients were 0.81, 0.75, 0.71, 0.69, 0.63, and 0.51, respectively. Table 4 shows that there was no significant correlation between STI-GE and STI-RN, or between STI-GC and STI-PFW.

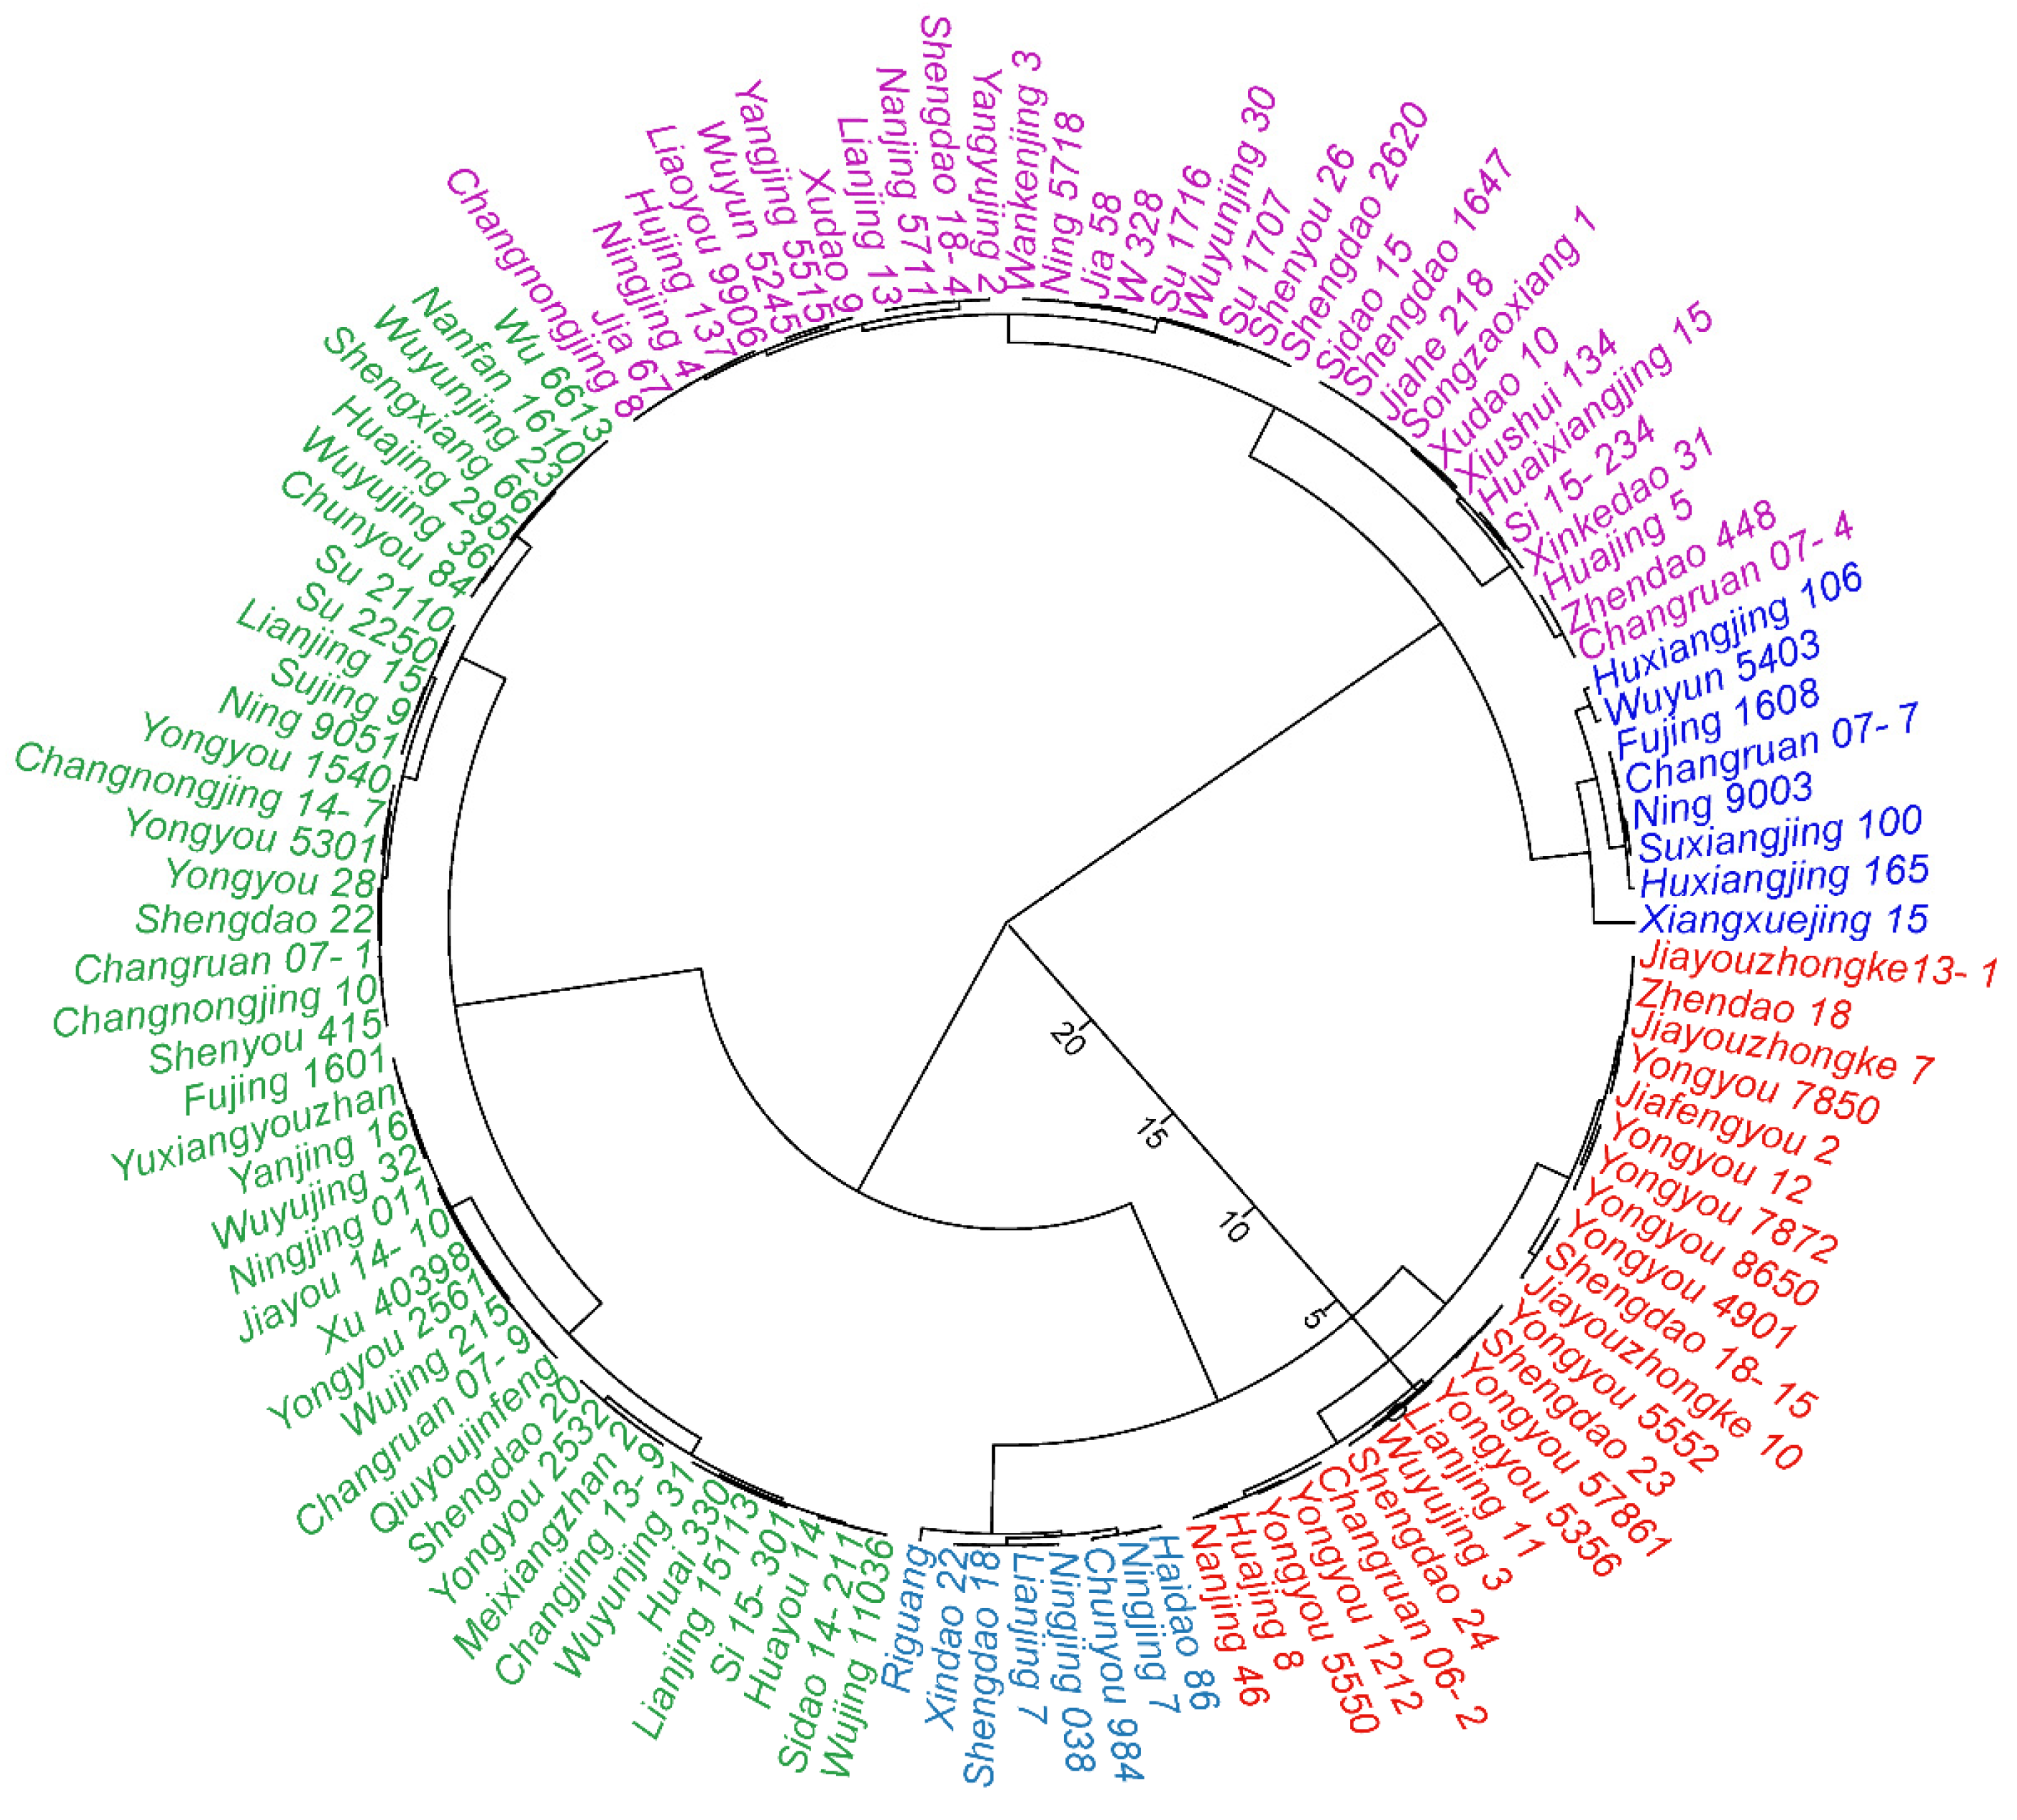
3.5. Salt Tolerance Classification and Screening for a Reliable Salt Tolerance Indicator

Based on the D-value and Euclidean distance, Ward’s method was used for systematic cluster analysis. As shown in Figure 2, 114 rice varieties were divided into five groups, and the salt tolerance of each rice variety was divided into five grades: highly salt tolerant, salt tolerant, moderately salt tolerant, salt sensitive, and highly salt sensitive.
The first group is highly salt-tolerant varieties, accounting for 7.02%, and contains eight species: Riguang, Ningjing 7, Haidao 86, Chunyou 984, Xindao 22, Shengdao 18, Lianjing 7, and Ningjing 038.
The second group is salt-tolerant varieties, accounting for 20.17%, which contains 23 species: Shengdao 18-15, Yongyou 4901, Jiayouzhongke 10, Yongyou 7872, Yongyou 12, Yongyou 8650, Jiayouzhongke 7, Zhendao 18, Jiayouzhongke 13-1, Jiafengyou 2, Yongyou 7850, Nanjing 46, Huajing 8, Yongyou 1212, Changruan 06-2, Yongyou 5550, Shengdao 24, Lianjing 11, Yongyou 5356, Wuyujing 3, Shengdao 23, Yongyou 5552, and Yongyou 57861.
The third group is moderately salt-tolerant varieties, accounting for 36.84%, which contains 42 species: Shengdao 20, Yongyou 2532, Meixiangzhan 2, Changjing 13-9, Sidao 14-211, Wujing 11036, Huayou 14, Lianjing 15113, Si 15-301, Huai 330, Wuyunjing 31, Yanjing 16, Wuyujing 32, Fujing 1601, Yuxiangyouzhan, Ningjing 011, Jiayou 14-10, Xu 40398, Yongyou 2561, Wujing 215, Changruan 07-9, Qiuyoujinfeng, Su 2110, Su 2250, Sujing 9, Ning 9051, Lianjing 15, Changnongjing 14-7, Yongyou 5301, Yongyou 1540, Yongyou 28, Shengdao 22, Changruan 07-1, Changnongjing 10, Shenyou 415, Wuyujing 36, Chunyou 84, Shengxiang 66, Huajing 295, Wu 6613, Nanfan 1610, and Wuyunjing 23.
The fourth group is salt-sensitive varieties, accounting for 28.95%, which contains 33 species: Nanjing 5711, Lianjing 13, Shengdao 18-4, Yangyujing 2, Xudao 9, Yangjing 5515, Wuyun 5245, Ningjing 4, Jia 67, Changnongjing 8, Liaoyou 9906, Hujing 137, Shengdao 2620, Shenyou 26, Wuyunjing 30, Su 1716, Su 1707, W 328, Jia 58, Ning 5718, Wankenjing 3, Si 15-234, Huaixiangjing 15, Xinkedao 31, Songzaoxiang 1, Jiahe 218, Shengdao 1647, Sidao 15, Xiushui 134, Xudao 10, Zhendao 448, Huajing 5, and Changruan 07-4.
The fifth group is highly salt-sensitive varieties, accounting for 7.02%, and contains eight species: Changruan 07-7, Fujing 1608, Suxiangjing 100, Ning 9003, Huxiangjing 165, Wuyun 5403, Huxiangjing 106, and Xiangxuejing 15.

4. Discussion

Cultivating, screening, and improving the salt-tolerant ability of rice by cultivation measures leads to improving the utilization rate and economic benefit of salt–alkali lands [26]. Direct seeding rice is becoming more critical due to its low cost and ease of operation, so rice salt tolerance screening at the germination stage is attaining more attention [27]. Highly salt-tolerant and sensitive varieties can be obtained through rice variety screening and by analyzing varieties’ physiological mechanism of salt-tolerance. In addition, by planting salt-tolerant rice varieties, land use efficiency and rice can be increased in coastal tidal flats.
Rice seed germination is a critical stage in its ontogenesis. Imbibition, the initial stage of seed germination, is a physical process that mostly depends on the seed’s size, shape, and chemical makeup [27]. Internal factors (exogenous factors) and external factors (salt stress) influenced the seed germination process [28].
In this study, 114 rice varieties were evaluated and screened for salt tolerance. The first step of this experiment was to determine the optimal salt tolerance screening concentration. Salt screening concentration is critical to the screening test; low salinity screening concentration would lead to the majority of salt-tolerant varieties, while too high salinity screening concentration would lead to the majority of salt-sensitive varieties, but the differences among rice varieties reached the maximum under conditions of suitable salinity screening concentration [29]. Different researchers use different methods to determine the optimal screening concentration. For example, Geng et al. use the quartile deviation method to determine the optimal salt concentration screening for salt tolerance in rice [30]. Wu et al. use the rice shoot parameter index, which reaches 50% inhibition of salt concentration to confirm the best screening concentration through shoot experiments [15]. The quartile difference is the difference between the upper quartile and the lower quartile [31]. When the quartile difference reaches the maximum, the corresponding salt concentration is the optimal screening salt concentration. The 50% inhibition method determines the corresponding salt concentration when the salt tolerance coefficient of each parameter index reaches 0.5, and the salt concentration is the optimal salt concentration for screening [15]. In this study, we assumed that these two methods to determine the optimal screening salt concentration have the same effect. We used two methods to determine the optimal screening salt concentration. The results show that the optimal screening salt concentration confirmed by the two methods is 120 mM.
Salt stress damages the cell membrane during seed imbibition, impairs membrane function or structure, increases membrane permeability, and damages the plasma membrane; as a result, seed germination, and germination energy and capacity reduced [20]. Under salt stress, intracellular K+ and Na+ exosmosis increased. At the same time, the activities of amylase and soluble sugar content decreased significantly, resulting in the delaying of starch hydrolysis and clustering of starch grains in rice seeds’ starch storage tissue [32]. Simultaneously, protease activity, protein conversion rate, and dry matter consumption were reduced in rice seed, whereas the residual protein in aleurone cytoplasm increased [32]. Thus, rice seedlings were stunted in shoot length, root length, root number, fresh plant weight, and seedling vigor index [33].
This present study shows that the SII-SL, SII-RL, SII-RN, and SII-SVI were 1.0 at 225 mM salt, which is in agreement with Wu et al.; their results showed that when the salt concentration was 250 mM, the SII-SFW, SII-RFW, SII-SL, SII-RL, SII-TFW, and the average SIIs were 1.0 [15]. Both experimental results showed that a high salt concentration inhibited the germination of rice seeds, elongation of root and shoot length, and increased plant fresh weight. Previous studies have put forward different opinions on the optimal salt concentration and reliable screening indexes; Tian et al. used 125 mM NaCl solution to screen 64 japonica rice varieties for salt tolerance at the germination stage. They took the germination index, relative root length, and relative salt damage rate as important indexes for rapid identification of salt tolerance at the germination stage of japonica germplasm resources [34]. Feng et al. suggested that shoot length and root length could be used as essential indexes for rapid screening of salt–alkali tolerance in rice during germination by using 120 mM NaCl salt solution [35]. Wu et al. considered 200 mM NaCl to be the optimal salt concentration for screening, and they suggested STI-SFW as a reliable parameter for evaluating the salt tolerance of B. napus inbred lines [15]. Hu et al. used tests to determine that the best first salt stress concentration was 1.2% [36]. This experimental study considered 120 mM NaCl to be the optimal salt concentration for screening. The seedling vigor index could be a rapid parameter to evaluate rice salt tolerance at the germination stage. The salt tolerance of different species is different; the salt tolerance of B. napus inbred lines was higher than that of rice, and 120 mM was the most suitable salt concentration for salt tolerance screening in the rice germination stage. Root and shoot length are the most direct indicators of plant salt tolerance, because the seedling vigor index can be obtained from root length and shoot length. Therefore, we conclude that the seedling vigor index can represent the best salt tolerance of plants. Germination indexes and post-hoc statistical analysis were of vital importance in scientific research. Different researchers have used different determination indexes and different statistical methods to study the screening of salt tolerance of varieties. Ding et al. evaluated and screened 300 samples of sweet sorghum for salt tolerance at the germination stage using membership function values of germination energy, germination rate, germination index, germination vigor index, and root fresh weight as comprehensive indexes [37]. Hu et al. used the salt concentration of 88 different genetic backgrounds of B. napus in a rape germination test and determined the germination rate, root length, whole plant fresh weight, and germination potential seven days after sowing [26]. In this study, the germination energy, germination capacity, shoot length, root length, root number, plant fresh weight, and seedling vigor index were calculated at 4 and 10 days after sowing, and subordinate function analysis and clustering analysis were used to comprehensively evaluate salt resistance via PCA. In this study, the germination test was time-consuming, and there were many agronomic traits compared with the above studies. Moreover, based on the principal components, fuzzy function analysis was carried out to obtain a comprehensive evaluation of the D-value, and progressive regression analysis of the D-value and salt tolerance coefficient of each parameter index showed that the results were more reliable.

5. Conclusions

In this study, we used 120 mM NaCl to screen rice salt tolerance in the germination stage and found strong correlations among root length, shoot length, and plant fresh weight. The vigor index, root number, root length, and germination energy of seedlings were determined by the mathematical model equation D-value = − 0.272 + 1.335 × STI − SVI + 0.549 × STI − RN − 0.617 × STI − RL + 0.073 × STI − GE, which can quickly judge the salinity tolerance of rice at the germination stage. Using systematic cluster analysis, the rice varieties were divided into five groups according to the salt-tolerance development of the rice germination stage, and the rice germplasms were classified by hierarchical cluster analysis in 8 HST, 23 ST, 42 MST, 33 SS, and 8 HSS. In all cultivars, the cultivar Riguang was most tolerant to salt, while Xiangxuejing 15 was the most sensitive. The present study indicated that the SVI is a reliable indicator of salt tolerance in the germination stage. These results will contribute to the screening and breeding of salt-tolerant rice germplasms.

Author Contributions

R.Z. and Q.D. planned and designed the experiments. R.Z., S.H., Y.W. and Y.L. performed and recorded data during the experiments. R.Z. and Q.L. statistically analyzed the data and prepared the tables and graphs. R.Z. wrote the manuscript. Q.D., P.G., Y.C. and H.W. approved the final manuscript after review. All authors have read and agreed to the published version of the manuscript.

Funding

This research was funded by the National Science and Technology Support Program (2015 BAD01B03), and the Jiangsu Province Key Research and Development Program (BE2019343).

Institutional Review Board Statement

Not applicable.

Informed Consent Statement

Not applicable.

Data Availability Statement

Not available.

Acknowledgments

This study was supported by the National Science and Technology Support Program (2015 BAD01B03), and the Jiangsu Province Key Research and Development Program (BE2019343).

Conflicts of Interest

The author declared no conflict of interest.

References

  1. Li, Q.; Yang, A.; Zhang, W. Efficient acquisition of iron confers greater tolerance to saline-alkaline stress in rice (Oryza sativa L.). J. Exp. Bot. 2016, 67, 6431–6444. [Google Scholar] [CrossRef] [Green Version]
  2. Long, X.; Liu, L.; Shao, T.; Shao, H.; Liu, Z. Developing and sustainably utilize the coastal mudflat areas in China. Sci. Total Environ. 2016, 56, 1077–1086. [Google Scholar] [CrossRef]
  3. Horie, T.; Karahara, I.; Katsuhara, M. Salinity tolerance mechanisms in glycophytes: An overview with the central focus on rice plants. Rice 2012, 5, 11. [Google Scholar] [CrossRef] [Green Version]
  4. Yahia, O.; Ghazi, A.K.; Tawaha, A.; Rahman, A.; Horani, A. Variation in Germination and Ion Uptake in Barley Genotypes under Salinity Conditions. World J. Agric. Sci. 2006, 2, 11–15. [Google Scholar]
  5. Khan, M.A.; Shirazi, M.U.; Ali, M.; Mumtaz, S.; Ashraf, M.Y. Comparative performance of wheat genotypes growing in saline water. Can. J. Bot. 2006, 38, 1633–1639. [Google Scholar]
  6. Wang, Y.; Li, T.; Li, Y.; Bjorn, L.O.; Rosendahl, S.; Olsson, P.A.; Li, S.; Fu, X. Community dynamics of arbuscular mycorrhizal fungi in high-input and intensively irrigated rice cultivation systems. Appl. Environ. Microbiol. 2015, 81, 2958–2965. [Google Scholar] [CrossRef] [Green Version]
  7. Quan, R.; Wang, J.; Hui, J.; Bai, H.; Lyu, X.; Zhu, Y.; Zhang, H.; Zhang, Z.; Li, S.; Huang, R. Improvement of Salt Tolerance Using Wild Rice Genes. Front. Plant Sci. 2017, 8, 2269. [Google Scholar] [CrossRef] [Green Version]
  8. Zeng, L.; Shannon, M.C. Salinity Effects on Seedling Growth and Yield Components of Rice. Crop Sci. 2000, 40, 996–1003. [Google Scholar] [CrossRef] [Green Version]
  9. Reddy, I.N.B.L.; Kim, B.K.; Yoon, I.S.; Kim, K.H.; Kwon, T.R. Salt Tolerance in Rice: Focus on Mechanisms and Approaches. Rice Sci. 2017, 24, 123–144. [Google Scholar] [CrossRef]
  10. Luo, Y.; Reid, R.; Freese, D.; Li, C.; Watkins, J.; Shi, H.; Zhang, H.; Loraine, A.; Song, B. Salt tolerance response revealed by RNA-Seq in a diploid halophytic wild relative of sweet potato. Sci. Rep. 2017, 7, 9624. [Google Scholar] [CrossRef]
  11. Maheshwari, P.; Kovalchuk, I. Agrobacterium-Mediated Stable Genetic Transformation of Populus angustifolia and Populus balsamifera. Front. Plant Sci. 2016, 7. [Google Scholar] [CrossRef] [Green Version]
  12. Wang, H.; Xiao, X.; Yang, M.; Gao, Z.; Zang, J.; Fu, X.; Chen, Y. Effects of salt stress on antioxidant defense system in the root of Kandelia candel. Bot. Stud. 2014, 55, 57. [Google Scholar] [CrossRef] [Green Version]
  13. Zhang, S.; Hui, Z.; Jing, L.; Wen, F. Primary Screening of Salt-tolerant Rice Germplasm in Entire Growth Period. Chin. Agric. Sci. Bull. 2013, 29, 63–68. [Google Scholar]
  14. Sun, X.; Jiang, Q.; Hu, Z.; Zhang, H.; Xu, C.; Shi, Y.; Han, L.; Zhang, H. Screening and identification of salt-tolerant rice germplasm in whole growth period. Acta Agron. Sin. 2019, 45, 1656–1663. [Google Scholar]
  15. Wu, H.; Guo, J.; Wang, C.; Li, K.; Zhang, X.; Yang, Z.; Li, M.; Wang, B. An Effective Screening Method and a Reliable Screening Trait for Salt Tolerance of Brassica napus at the Germination Stage. Front. Plant Sci. 2019, 10. [Google Scholar] [CrossRef]
  16. Hu, J.; Tashpolat, T.; Iiyas, N.; Zhang, F.; Mamat, S. Spatial variability of soil salt content in Yutian oasis. Soils 2017, 49, 162–170. [Google Scholar]
  17. Qi, D.; Guo, G.; Li, M.; Cao, G.; Zhang, J.; Zhou, Q.; Zhang, S.; Xu, X.; Han, L. Progress of physiology and genetic research on saline-alkaline tolerance in rice. J. Plant Genet. Resour. 2007, 8, 486–493. [Google Scholar]
  18. Zheng, C.; Zhang, Z.; Zhou, G.; Xie, X. Evaluation on salt tolerance of different rice varieties during germination stage. Shandong Agric. Sci. 2018, 50, 38–42. [Google Scholar]
  19. Du, Z.; Zhang, Y.; Tian, Z.; Bian, J.; Sun, X. Alkali resistance screening of japonica rice varieties during budding stage in cold region. Heilongjiang Agric. Sci. 2017, 6–10. [Google Scholar] [CrossRef]
  20. Li, W. Effect of Salt Stress on Seed Germination and Seedling Growth of Rice. Master’s Thesis, Chinese Academy of Agricultural Sciences, Beijing, China, 2011. Available online: https://kns.cnki.net/kcms/detail/detail.aspx?dbcode=CMFD&dbname=CMFD2012&filename=1012318229.nh&v=3HNO6lOT58LlgcIa6GcPo%25mmd2B5eLmPFQMTNQGKaL%25mmd2F677CoC8rNLI8ZzMnmCYmrogJIH (accessed on 4 May 2021).
  21. Agnihotri, R.K.; Palni, L.M.; Spandey, D. Screening of landraces of rice under cultivation in Kumaun Himalaya for salinity stress during germination and early seedling growth. Indian J. Plant Physiol. 2006, 11, 266–272. [Google Scholar]
  22. Das, D.; Ali, M.A.; Sarkar, T.A.; Ali, M.Y. Germination and seedling growth of indigenous aman rice under salt stress. J. Bangladesh Agric. Univ. 2017, 15, 182. [Google Scholar] [CrossRef] [Green Version]
  23. Lu, Q.; Niu, X.; Zhang, M.; Wang, C.; Xu, Q.; Feng, Y.; Yang, Y.; Wang, S.; Yuan, X.; Yu, H.; et al. Genome-Wide Association Study of Seed Dormancy and the Genomic Consequences of Improvement Footprints in Rice (Oryza sativa L.). Front. Plant Sci. 2018, 8, 2213. [Google Scholar] [CrossRef] [Green Version]
  24. Han, R.; Lu, X.; Gao, G.; Yang, X. Analysis of the principal components and the subordinate function of alfalfa drought resistance. Acta Agrestia Sin. 2006, 14, 142–146. [Google Scholar]
  25. Dai, H.; Wu, H.; Amanguli, M.; Wang, L.; Maimaiti, A.; Zhang, J. Analysis of Salt-Tolerance and Determination of Salt-Tolerant Evaluation Indicators in Cotton Seedlings of Different Genotypes. Sci. Agric. Sin. 2014, 47, 1290–1300. [Google Scholar]
  26. Zhang, S.; Liu, L.; Liu, Z. Research advantages of salt tolerance and breeding in rice. North Rice 2009, 39, 118–121. [Google Scholar]
  27. Wang, Z.; Wang, J.; Bao, Y.; Wu, Y.; Zhang, H. Quantitative trait loci controlling rice seed germination under salt stress. Euphytica 2010, 178, 297–307. [Google Scholar] [CrossRef]
  28. Xin, C.; Ma, H.; Zhao, Q.; Wang, Y.; Liu, Q.; Yang, J.; Chen, B.; Lin, X. Effects of salt stress on rice seed germination and seedling growth. Barley Cereal Sci. 2019, 36, 7–10. [Google Scholar]
  29. Guan, Z.; Chen, S.; Wang, Y.; Chen, F. Screening of salt-tolerance concentration and comparison of salt-tolerance for chrysanthemum and its related taxa. Chin. J. Ecol. 2010, 29, 467–472. [Google Scholar]
  30. Geng, L.; Ma, X.; Cui, D.; Zhang, Q.; Han, B.; Han, L. Identification and Evaluation Method for Saline Tolerance in Rice During the Whole Growth Stage. J. Plant Genet. Resour. 2019, 20, 267–275. [Google Scholar]
  31. Zhou, M.; Wang, W. Representative points of student’s tn distribution and their applications in statistical simulation. Acta Math. Appl. Sin. 2016, 39, 620–640. [Google Scholar]
  32. Guo, Y.; Zhang, W.; Yang, H.; Qu, W. Germination characteristics of rice seed under salt stress and physiological basis of salt-tolerance of rice in seedlings. J. Anhui Agric. Sci. 2006, 34, 1053–1054. [Google Scholar]
  33. Ruan, S.; Xue, Q. Germination characteristics of seeds under salt stress and physiological basis of salt-tolerance of seedlings in hybrid rice. Chin. J. Rice Sci. 2002, 16, 281–284. [Google Scholar]
  34. Tian, L.; Chen, Y.; Liu, J.; Ma, X.; Wang, N.; Yang, B.; Li, Y.; Guo, H.; Li, J.; Hu, H. Comprehensive Evaluation and Selection of Rice (Oryza sativa japonica) Germplasm for Saline Tolerance at Germination Stage. Chin. J. Rice Sci. 2017, 31, 75–86. [Google Scholar]
  35. Feng, Z.; Liu, X.; Jiang, C.; Liang, Z. Comprehensive Evaluation of Rice (Oryza sativa japonica) Germplasm for Alkaline/Saline Tolerance at Germination Stage from Jilin Province, China. Soils Crop 2016, 5, 120–127. [Google Scholar]
  36. Hu, D.; Wu, D.; You, J.; He, Y.; Qian, W. Principal Component Analysis and Comprehensive Evaluation on Salt Tolerance Related Traits in Brassica napus L. Bot. Res. 2018, 7, 101–112. [Google Scholar]
  37. Ding, T.; Yang, Z.; Wei, X.; Yuan, F.; Yin, S.; Wang, B. Evaluation of salt-tolerant germplasm and screening of the salt-tolerance traits of sweet sorghum in the germination stage. Funct. Plant Biol. 2018, 45. [Google Scholar] [CrossRef] [PubMed]
Figure 1. Determination of the optimal sodium chloride concentration for evaluating salt tolerance. The sodium chloride concentration of the salt injury index is 0.5 of the germination energy (A), germination capacity (B), shoot length (C), root length (D), root number (E), plant fresh weight (F), seedling vigor index (G), and the average of seven rice germplasms under different sodium chloride concentrations (H). Data in the figure are the means for each parameter under salt stress.
Agronomy 11 01569 g001
Figure 2. Hierarchical cluster analysis based on the D-value, Euclidean distance, and Ward’s algorithm were used to evaluate the salt tolerance of 114 rice germplasms. As shown in the figure, highly salt-tolerant varieties are blue in color; red color represents salt-tolerant varieties; green color represents moderately salt-tolerant varieties; magenta color represents salt-sensitive varieties; and blue color represents highly salt-sensitive varieties.
Agronomy 11 01569 g002
Table 1. Eigenvector of comprehensive indexes and proportion.
TraitComprehensive Index
F1F2F3
Germination energy0.5260.525−0.449
Germination capacity0.4490.7850.073
Shoot length0.896−0.1720.070
Root length0.868−0.269−0.243
Root number0.4910.1910.793
Plant fresh weight0.845−0.2930.142
Seedling vigor index0.952−0.092−0.165
Eigenvalue3.8971.1250.948
Weight (%)65.29218.84115.874
Contribution ratio (%)55.67616.06613.536
Cumulative contribution ratio (%)55.67671.74185.278
Notes: F1, F2, and F3 are principal component values corresponding to each trait.
Table 2. Principal component value, membership function value, and D-value of each rice variety.
Variety NamePrincipal ComponentsMembership FunctionD-Value
F1F2F3μ1μ2μ3
Riguang1.971.081.540.850.780.810.83
Ningjing 71.95−0.051.090.840.590.720.78
Haidao 862.75−0.86−1.451.000.450.190.76
Chunyou 9842.15−0.07−0.370.880.580.410.75
Xindao 221.820.53−0.250.820.690.440.73
Shengdao 180.942.351.190.651.000.740.73
Lianjing 71.230.331.960.710.650.900.73
Ningjing 0381.35−0.722.460.730.471.000.72
Shengdao 18-150.731.201.810.610.800.870.69
Yongyou 49011.591.60−2.040.780.870.070.68
Jiayouzhongke 101.73−0.97−0.330.800.430.420.67
Yongyou 78721.520.57−1.360.760.690.210.66
Yongyou 121.66−0.20−1.150.790.560.250.66
Yongyou 86501.91−0.46−1.940.840.520.090.66
Jiayouzhongke 71.77−3.461.290.810.000.760.65
Zhendao 180.251.092.460.520.781.000.65
Jiayouzhongke 13-11.600.13−1.710.780.620.130.65
Jiafengyou 21.58−0.92−0.740.780.440.340.64
Yongyou 78501.250.13−0.560.710.620.370.64
Nanjing 460.90−0.751.190.640.470.740.63
Huajing 80.57−0.081.570.580.580.820.62
Yongyou 12121.090.19−0.860.680.630.310.61
Changruan 06-20.660.93−0.080.600.760.470.61
Yongyou 55500.78−0.480.760.620.510.650.61
Shengdao 240.601.35−0.570.590.830.370.60
Lianjing 110.45−0.461.710.560.520.840.60
Yongyou 53560.590.400.320.590.660.560.60
Wuyujing 30.570.300.440.580.650.580.59
Shengdao 230.421.28−0.140.550.820.460.59
Yongyou 55520.840.28−0.730.630.640.340.59
Yongyou 578611.29−1.66−0.760.720.310.330.58
Shengdao 200.050.541.400.480.690.780.57
Yongyou 25320.750.09−0.890.620.610.310.57
Meixiangzhan 20.341.31−0.600.540.820.360.56
Changjing 13-90.19−0.521.740.510.510.850.56
Sidao 14-2110.061.92−0.330.480.930.420.56
Wujing 110360.530.19−0.450.570.630.400.56
Huayou 140.53−0.510.080.570.510.510.55
Lianjing 151130.59−0.58−0.240.590.500.440.55
Si 15-3010.61−1.090.160.590.410.520.54
Huai 3300.54−0.23−0.430.580.560.400.54
Wuyunjing 31−0.140.641.120.450.710.720.54
Yanjing 160.08−1.021.650.490.420.830.53
Wuyujing 32−0.281.780.200.420.900.530.53
Fujing 16010.60−1.47−0.030.590.340.480.52
Yuxiangyouzhan−0.230.850.790.430.740.650.52
Ningjing 0110.10−0.540.790.490.500.650.52
Jiayou 14-100.16−1.491.500.500.340.800.52
Xu 40398−0.100.690.340.450.710.560.52
Yongyou 25610.83−0.81−1.690.630.460.140.52
Wujing 2150.110.41−0.210.490.670.450.52
Changruan 07-9−0.460.581.690.380.700.840.52
Qiuyoujinfeng−0.050.69−0.010.460.710.490.51
Su 21100.430.03−1.350.560.600.210.51
Su 2250−0.201.85−0.780.440.910.330.51
Sujing 9−0.36−0.742.190.400.470.940.50
Ning 9051−0.301.150.030.420.790.500.50
Lianjing 15−0.17−0.721.320.440.470.760.50
Changnongjing 14-70.061.06−1.390.480.780.200.49
Yongyou 53010.12−0.24−0.400.500.550.410.49
Yongyou 15400.30−0.42−0.980.530.520.290.49
Yongyou 280.50−0.93−1.340.570.440.210.49
Shengdao 22−0.130.90−0.790.450.750.330.49
Changruan 07−1−0.161.56−1.420.440.860.190.48
Changnongjing 100.16−1.520.370.500.330.570.48
Shenyou 415−0.21−0.070.310.430.580.550.48
Wuyujing 36−0.511.000.190.380.770.530.47
Chunyou 840.23−1.51−0.370.520.340.410.47
Shengxiang 66−0.391.20−0.910.400.800.300.46
Huajing 295−0.670.310.940.350.650.680.46
Wu 6613−0.630.580.490.350.700.590.46
Nanfan 1610−0.33−0.140.050.410.570.500.46
Wuyunjing 23−0.520.330.290.370.650.550.45
Nanjing 5711−0.810.640.570.320.710.610.44
Lianjing 13−0.890.510.950.300.680.690.44
Shengdao 18-4−0.41−0.05−0.340.390.590.420.43
Yangyujing 2−0.760.82−0.050.330.740.480.43
Xudao 9−0.800.78−0.110.320.730.470.42
Yangjing 5515−0.690.050.150.340.600.520.42
Wuyun 5245−0.520.52−0.970.370.680.290.42
Ningjing 4−0.46−0.21−0.740.390.560.340.41
Jia 67−0.930.680.100.300.710.510.41
Changnongjing 8−1.020.560.510.280.690.600.41
Liaoyou 9906−0.42−0.07−1.160.390.580.250.41
Hujing 137−0.78−0.110.170.330.580.530.41
Shengdao 2620−0.93−0.020.530.300.590.600.40
Shenyou 26−0.650.68−1.230.350.710.240.40
Wuyunjing 30−0.780.59−0.700.320.700.350.40
Su 1716−0.81−0.070.010.320.580.490.40
Su 1707−1.130.580.520.260.700.600.40
W 328−0.64−1.240.420.350.380.580.39
Jia 58−0.39−1.67−0.100.400.310.470.39
Ning 5718−0.990.82−0.420.280.740.400.39
Wankenjing 3−1.050.130.410.270.620.570.39
Si 15-234−0.78−0.41−0.290.320.520.430.38
Huaixiangjing 15−0.95−0.090.030.290.580.500.38
Xinkedao 31−1.231.11−0.290.240.790.430.37
Songzaoxiang 1−1.18−0.691.130.250.480.720.37
Jiahe 218−0.62−2.060.360.360.240.560.37
Shengdao 1647−1.200.280.200.250.640.530.37
Sidao 15−0.93−0.41−0.140.300.530.460.37
Xiushui 134−0.64−1.34−0.380.350.370.410.36
Xudao 10−0.96−0.620.080.290.490.510.36
Zhendao 448−1.240.09−0.070.240.610.480.35
Huajing 5−1.620.381.010.160.660.700.34
Changruan 07-4−1.18−0.09−0.220.250.580.440.34
Changruan 07-7−0.76−2.02−0.260.330.250.440.33
Fujing 1608−1.220.43−1.340.240.670.210.32
Suxiangjing 100−1.20−0.72−0.560.240.470.370.31
Ning 9003−1.620.89−0.690.160.750.350.30
Huxiangjing 165−1.33−0.44−1.130.220.520.260.28
Wuyun 5403−1.63−1.05−0.840.160.410.320.24
Huxiangjing 106−1.92−1.65−0.570.110.310.370.19
Xiangxuejing 15−2.48−3.21−2.360.000.040.000.01
Notes: F1, F2, and F3 are principal component values corresponding to each trait; μ1, μ2, and μ3 are membership function values corresponding to each rice variety.
Table 3. Analysis of evaluation accuracy of the equation.
NumPredictive D-ValuePrimary ValueDifferenceEvaluation AccuracyNumPredictive D-ValuePrimary ValueDifferenceEvaluation Accuracy
10.5230.540−0.01896.74580.6590.6400.01997.07
20.0350.0080.02721.79590.4800.482−0.00299.63
30.5240.5200.00499.30600.5110.519−0.00898.54
40.6140.6050.00998.60610.4810.4600.02195.67
50.3900.398−0.00897.91620.6100.5890.02196.48
60.6670.6610.00699.11630.5000.509−0.00998.16
70.6540.660−0.00799.01640.4960.4950.00199.73
80.4900.493−0.00499.28650.4890.4830.00698.79
90.5890.5660.02396.14660.7460.764−0.01897.66
100.6810.6810.00099.99670.5590.5450.01497.57
110.6540.671−0.01797.41680.3920.3870.00598.72
120.6310.6250.00699.11690.5260.531−0.00599.12
130.6240.6120.01298.15700.5840.5700.01497.53
140.4910.4910.00099.99710.5920.599−0.00898.70
150.3810.3790.00299.51720.3610.373−0.01296.76
160.6110.649−0.03894.17730.3530.3440.00997.59
170.3990.400−0.00199.65740.4870.4750.01397.43
180.4190.4050.01496.56750.3630.368−0.00598.63
190.3250.330−0.00598.44760.3710.3660.00498.84
200.2330.235−0.00299.05770.3510.3420.00997.53
210.3880.397−0.00997.75780.3750.3660.00997.68
220.6710.6450.02596.21790.5060.4980.00898.40
230.5190.5150.00499.23800.4610.4550.00698.69
240.5520.5500.00299.72810.5680.5580.01098.27
250.3570.363−0.00798.11820.4460.4350.01297.42
260.5940.5640.03094.92830.4150.439−0.02394.73
270.6100.6090.00199.86840.5760.594−0.01797.06
280.7720.7510.02197.28850.4910.4860.00698.87
290.6450.657−0.01298.18860.4330.4200.01397.10
300.5600.5560.00499.26870.4010.3900.01297.08
310.5060.520−0.01497.38880.3850.3800.00698.57
320.6460.647−0.00199.88890.5600.5440.01796.99
330.7400.7240.01697.88900.3650.3630.00299.35
340.3530.3460.00797.88910.4710.4580.01397.17
350.5240.5170.00898.50920.5960.620−0.02496.14
360.5720.580−0.00798.76930.5220.525−0.00399.39
370.5890.596−0.00798.86940.5260.545−0.01996.60
380.2190.1880.03185.74950.7220.732−0.01098.58
390.3840.3670.01795.52960.2640.282−0.01893.57
400.4150.3930.02294.60970.3870.401−0.01496.63
410.3910.395−0.00498.91980.5330.5290.00499.29
420.4710.4550.01796.49990.8370.8290.00799.14
430.2950.307−0.01296.001000.7320.735−0.00299.71
440.3980.408−0.01097.581010.3110.3040.00797.81
450.3740.392−0.01895.361020.4140.4070.00798.30
460.6190.641−0.02296.511030.4130.4110.00299.41
470.5260.5030.02395.601040.7950.7750.02097.48
480.6010.5880.01397.851050.5030.520−0.01796.71
490.4350.4190.01696.371060.5900.597−0.00798.90
500.4780.481−0.00399.411070.4310.437−0.00698.70
510.4680.509−0.04192.001080.2900.317−0.02791.40
520.4990.501−0.00299.581090.7150.728−0.01398.21
530.4800.487−0.00798.581100.4430.4300.01397.13
540.4150.4090.00698.541110.3920.422−0.03092.78
550.4680.4650.00399.351120.6170.690−0.07389.41
560.4540.456−0.00299.481130.5210.524−0.00499.31
570.5150.520−0.00599.071140.5810.5650.01797.13
Notes: “num” stands for rice varieties. 1, 2, 3, 4, 5, 6, 7, 8, 9, 10, 11, 12, 13, 14, 15, 16, 17, 18, 19, 20, 21, 22, 23, 24, 25, 26, 27, 28, 29, 30, 31, 32, 33, 34, 35, 36, 37, 38, 39, 40, 41, 42, 43, 44, 45, 46, 47, 48, 49, 50, 51, 52, 53, 54, 55, 56, 57, 58, 59, 60, 61, 62, 63, 64, 65, 66, 67, 68, 69, 70, 71, 72, 73, 74, 75, 76, 77, 78, 79, 80, 81, 82, 83, 84, 85, 86, 87, 88, 89, 90, 91, 92, 93, 94, 95, 96, 97, 98, 99, 100, 101, 102, 103, 104, 105, 106, 107, 108, 109, 110, 111, 112, 113, and 114 represent Wuyunjing 31, Xiangxuejing 15, Ningjing 011, Yongyou 5550, Wuyunjing 30, Yongyou 7872, Yongyou 12, Yongyou 5301, Yongyou 2532, Yongyou 4901, Jiayouzhongke 10, Nanjing 46, Yongyou 1212, Yongyou 1540, Huaixiangjing 15, Jiayouzhongke 7, Shenyou 26, Hujing 137, Changruan 07-7, Wuyun 5403, Su 1716, Jiayouzhongke 13-1, Qiuyoujinfeng, Huayou 14, Xiushui 134, Changjing 13-9, Changruan 06-2, Chunyou 984, Yongyou 8650, Wujing 11036, Yongyou 2561, Zhendao 18, Ningjing 038, Zhendao 448, Changruan 07-9, Yongyou 57861, Yongyou 5356, Huxiangjing 106, Jiahe 218, W 328, Su 1707, Wuyunjing 23, Suxiangjing 100, Changnongjing 8, Jia 58, Jiafengyou 2, Sujing 9, Yongyou 5552, Wuyun 5245, Shenyou 415, Su 2250, Ning 9051, Yongyou 28, Jia 67, Chunyou 84, Wu 6613, Jiayou 14-10, Yongyou 7850, Changnongjing 10, Wujing 215, Shengxiang 66, Shengdao 23, Su 2110, Changnongjing 14-7, Changruan 07-1, Haidao 86, Lianjing 15113, Wankenjing 3, Yanjing 16, Shengdao 20, Shengdao 24, Xinkedao 31, Huajing 5, Wuyujing 36, Songzaoxiang 1, Shengdao 1647, Changruan 07-4, Sidao 15, Lianjing 15, Nanfan 1610, Sidao 14-211, Shengdao 18-4, Nanjing 5711, Wuyujing 3, Shengdao 22, Yangjing 5515, Ning 5718, Si 15-234, Huai 330, Xudao 10, Huajing 295, Huajing 8, Fujing 1601, Si 15-301, Shengdao 18, Huxiangjing 165, Shengdao 2620, Wuyujing 32, Riguang, Xindao 22, Ning 9003, Liaoyou 9906, Ningjing 4, Ningjing 7, Xu 40398, Lianjing 11, Lianjing 13, Fujing 1608, Lianjing 7, Yangyujing 2, Xudao 9, Shengdao 18-15, Yuxiangyouzhan, and Meixiangzhan 2, respectively.
Table 4. Pearson correlation analysis between salt tolerance indexes of germination energy (STI-GE), germination capacity (STI-GC), shoot length (STI-SL), root length (STI-RL), root number (STI-RN), plant fresh weight (STI-PFW), and seedling vigor index (STI-SVI) of 114 rice germplasms in the presence of 120 mM sodium chloride.
STI-GESTI-GCSTI-SLSTI-RLSTI-RNSTI-PFWSTI-SVID-Value
STI-GE1.00
STI-GC0.41 **1.00
STI-SL0.34 **0.29 **1.00
STI-RL0.36 **0.19 *0.72 **1.00
STI-RN0.110.32 **0.41 **0.22 *1.00
STI-PFW0.29 **0.150.81 **0.68 **0.43 **1.00
STI-SVI0.44 **0.40 **0.82 **0.96 **0.31 **0.74 **1.00
D-value0.51 **0.63 **0.81 **0.69 **0.71 **0.75 **0.83 **1.00
Notes: ** indicates a significant correlation at the level of 0.01 (double-tailed); * indicates a significant correlation at the level of 0.05 (double-tailed).
Publisher’s Note: MDPI stays neutral with regard to jurisdictional claims in published maps and institutional affiliations.

