Article

Multivariate Analysis of Seed Chemical Diversity among Jatropha curcas in Botswana

1
The United Graduate School of Agricultural Sciences, Tottori University, Tottori 680-8553, Japan
2
Department of Agricultural Research, Ministry of Agriculture, Private Bag 0033 Gaborone, Botswana
3
Regional Collaboration Center, Aomori Public University, Aomori 030-0196, Japan
4
Arid Land Research Center, Tottori University, Tottori 680-0001, Japan
*
Author to whom correspondence should be addressed.
Agronomy 2021, 11(8), 1570; https://doi.org/10.3390/agronomy11081570
Submission received: 30 June 2021 / Revised: 30 July 2021 / Accepted: 2 August 2021 / Published: 6 August 2021
(This article belongs to the Section Agricultural Biosystem and Biological Engineering)

Abstract

:
Jatropha (Jatropha curcas L.) has been identified as a potential bioenergy feedstock in arid regions, but knowledge of the diversity of its chemical characteristics is limited. In this study, 61 Jatropha accessions growing in Botswana, where both severe drought and winter frosts frequently occur, were analyzed for their seed chemical properties. Histogram analyses and meta-analysis comparisons with seeds from other countries/continents showed that the median/mean dry seed weight, toxic compound phorbol esters, and C18:0 fatty acid levels in the Botswanan accessions were lower than those from other countries/continents. A clustered heat map analysis indicated five clades for the Botswanan accessions, and their physicochemical traits were also categorized into five groups. Many positive and negative correlations were observed among the chemical traits, including negative correlations between the C18:3 (linolenic acid) content and yield-related traits (lipid content and dry seed weight). Principal component analysis highlighted the existence of accessions with highly deviated seed chemical compositions, such as those enriched in C18:0/C18:1 and C16:0/C16:1/C18:3 fatty acids. Overall, the present study suggests considerable diversity in the seed chemical compositions of Botswanan Jatropha accessions. Various accessions could be useful as feedstock for specific industrial products, as well as for breeding materials for the fortification of specific chemical ingredients.

1. Introduction

Jatropha curcas L. (Jatropha) is a seed oil-bearing deciduous shrub belonging to the Euphorbiaceae family. It is native to Latin America and has spread across the tropical and subtropical regions of the world [1,2]. Because of its impressive ability to survive under harsh environmental conditions, such as drought and extreme heat, Jatropha has received considerable attention as a feedstock material for bioenergy production in arid regions. Its cultivation has been encouraged as a measure of climate change mitigation, energy security, and rural development [2,3,4,5,6]. Its seeds contain various fatty acid moieties and are usually dominated by oleic acid (C18:1) and linoleic acid (C18:2) [1]. Fatty acid composition is an important chemical trait because it affects many aspects of biofuel quality, such as combustion kinetics and oxidative stability [1,7]. Moreover, Jatropha possesses a wide range of toxic compounds [8], and phorbol ester (PE) have drawn attention for their tumor-promoting activity [9]. Therefore, knowledge of the chemical traits of Jatropha is of critical importance from the perspective of environmental safety and health hazards. To increase the efficiency and sustainability of Jatropha biomass utilization, germplasm selection and breeding efforts have continued and progressed [10]. To further maximize the potential of this energy crop, a comprehensive investigation of the chemical properties of various Jatropha genetic resources is required.
A feasibility study was conducted in 2007 on the potential for the production and use of biofuels in Botswana. It suggested Jatropha as a potential feedstock in this country [11,12]. Since then, various studies have been undertaken on the development and assessment of Jatropha bioenergy in Botswana, including cultivation management [13,14,15,16], plant physiology [17,18,19], the assessment and utilization of seed oils and non-oil biomass feedstock [20,21,22], and environmental and socio-economic impacts [12,14,23,24]. The research also revealed dozens of unique Jatropha accessions in the drought- and frost-prone regions of Botswana, among which several potentially superior genotypes with high yields, insect pest tolerance, and environmental adaptations have been nominated [13,15,25]. Moreover, previous research reported variation in the seed lipid content and fatty acid compositions of Jatropha seeds harvested from four geographical locations in Botswana [22]. However, a comprehensive survey of the seed chemical properties of Botswanan Jatropha accessions has not been reported thus far.
As part of the investigation to characterize the Jatropha genetic resource in Botswana, a cultivation trial was initiated at an experimental farm in the southeast region of the country [13]. We anticipated that Jatropha collection from the drought- and frost-prone regions of Botswana may include genotype(s) with unique physiological, agronomical, and biochemical properties. Using seeds harvested from the experimental farm, the present study examined the characteristics and variation of seed chemical traits, such as lipid and PE contents and fatty acid composition, among various Botswanan Jatropha accessions.

2. Materials and Methods

2.1. Climate and Geography of Botswanan Jatropha Collection Sites

Data on the geographical coordinates of the Botswanan Jatropha accessions were obtained from previous research [13]. Information on geography and climate was obtained from the following datasets: an administrative area dataset in GADM [26], an inland water dataset in DIVA-GIS [27] supported by the Digital Chart of the World project [28], an altitude dataset from the NASA Shuttle Radar Topography Mission [29], and a dataset of bioclimatic variables from WorldClim 2.0 [30,31]. Regional precipitation, maximum temperature, and minimum temperature variables were extracted from BIO12 (annual precipitation), BIO5 (maximum temperature of the warmest month), and BIO6 (minimum temperature of the coldest month) of WorldClim, respectively. The bioclimatic variables were the monthly averages from 1970 to 2000 at a spatial resolution of approximately 1 km2. QGIS [32] was used to plot and extract geographical and environmental information. The raster data for these variables were reshaped along with a shapefile of Botswana according to the GADM dataset.

2.2. Plant Materials

The seeds of 61 Botswanan Jatropha accessions, including a candidate superior germline from Jackalas1 (No. 121207-1, hereafter referred to as JK) [13], together with one accession from Ghana (hereafter GA), were used in this study. They were planted in 2011 in an experimental field at the Department of Agricultural Research, Gaborone, Botswana, and grown for more than five years, as described previously [14]. Fully matured seeds were harvested in the 2016/2017 season, dried under ventilation, and stored in a freezer at −30 °C. The 5–15 seeds were randomly selected from each accession and thawed at room temperature of 25 ± 2 °C before measurement. The seeds were dried in a drying chamber at 60 °C for 3 days, and the dry weight (DW) of the seeds was individually measured using an electric balance. Three seeds, one with the median DW and two close to the median DW on either side, were selected, and their kernels and shells were manually separated to measure their kernel/seed gravimetric ratio (K/S). The kernels (n = 3 for each accession) were subsequently used for chemical analyses.

2.3. Lipid Extraction

Total lipids were extracted from the Jatropha kernels as described previously [33], with the following modifications. Individual kernels were ground finely using a pestle and mortar, and approximately 100 mg of the powder was placed in a 1.5 mL tube. Next, 400 µL of n-hexane and 2 µL of 0.01% butylated hydroxytoluene in n-hexane were added and the mixture was agitated vigorously for 30 min using a microtube mixer (MT-400, Tomy Seiko, Tokyo, Japan). The homogenate was centrifuged at 20,000× g for 2 min at room temperature, and the supernatant was transferred into a new tube. The pellet was extracted again using the same procedure, and the supernatants were combined. This process was repeated three times. The combined supernatant was evaporated under reduced pressure using a vacuum dryer centrifugal concentrator (CC-105, Tomy Seiko) equipped with a low-temperature trap (TU-055, Tomy Seiko) to obtain the total lipids. The total lipids derived from each individual kernel were weighed and stored in a freezer at −30 °C. The lipids were defrosted at 50 °C for 30 min before methyl derivatization.

2.4. Fatty Acid Analysis

An aliquot (2 µL) of the total lipid was derivatized to fatty acid methyl esters (FAMEs) using a methylation kit (Fatty Acid Methylation Kit, Nacalai Tesque, Kyoto, Japan), and the derivative was purified using a purification kit (Fatty Acid Purification Kit, Nacalai Tesque). The FAMEs were analyzed by gas chromatography (GC) using a GC 4000 (GL Sciences, Tokyo, Japan) equipped with a flame ionization detector at 230 °C and an InertCap WAX-HT capillary column (30 m, 0.25 mm i.d., 0.25 µm, GL Sciences). Helium was used as the carrier gas at a flow rate of 1.2 mL min−1. An aliquot of the FAME sample (1 µL) was injected into the GC using an auto-sampler (ASI 240, GL Sciences). The analysis was carried out with a temperature program consisting of an initial step at 40 °C for 1 min, followed by a ramping step with an increment of 10 °C min−1 to 240 °C, and then held for 15 min at 240 °C. Fatty acid analysis was performed three times for each accession, using independently extracted total lipids. Palmitic, palmitoleic, stearic, oleic, linoleic, and linolenic acid standards (Fujifilm Wako Pure Chemical, Osaka, Japan) were derivatized using the same method as mentioned above and used for peak validation. The iodine value (IV) was calculated according to the American Oil Chemists Society Cd 1c-85 [34], using the following formula:
IV = [C16:1] × 0.950 + [C18:1] × 0.860 + [C18:2] × 1.732 + [C18:3] × 2.616,
where [C16:1], [C18:1], [C18:2], and [C18:3] represent the weight fractions of palmitoleic, oleic, linoleic, and linolenic acids, respectively, when the total fatty acid content was set to 1.

2.5. Phorbol Ester Extraction

The PE fraction was prepared as described previously [35], with the following modifications. Kernel powder (15 mg) was placed in a 1.5 mL plastic tube, 400 µL of methanol was added, and the mixture was stirred with a microtube mixer for 30 min. After centrifugation at 20,000× g at room temperature for 2 min, the supernatant was transferred to a new tube. The pellet was extracted again with 400 µL of methanol and centrifuged, and the supernatant was combined. This extraction procedure was repeated three times. The supernatant was dried under reduced pressure using a centrifugal concentrator. Next, 600 µL of n-hexane was added to the dried extract and stirred vigorously using a vortex mixer. Acetonitrile (600 µL) was added, and the sample was vortexed again and centrifuged at 20,000× g at room temperature for 2 min. The lower acetonitrile layer was collected and filtered through a 0.20 µm PTFE filter (Millex-LG syringe-driven filter unit, Merck, Kenilworth, NJ, USA). The filtrate was dried using a vacuum dryer centrifugal concentrator, dissolved in 200 µL of acetonitrile, and used as a sample for LC/MS analysis, as described below.

2.6. PE Analysis

The PE content was analyzed as described previously [36,37], with the following modifications. The 3 µL of the extracted PE sample was injected into an Agilent 6420 triple-quadrupole LC/MS equipped with an electrospray (ESI) ionization source (Agilent, Santa Clara, CA, USA) and a Discovery HS F5 column (250 mm, 2.1 mm i.d., 5 µm) (Merck) at 40 °C. Gradient elution was carried out with A buffer (5 mM ammonium acetate in 0.1% formic acid) and B buffer (acetonitrile), at a total flow rate of 0.25 mL min−1. The initial mobile phase was 40% B buffer for 2 min, and then changed linearly to 95% B buffer over 25 min. It was held for 2 min, and then changed to 40% B buffer and held for 10 min to equilibrate the column. The mass spectrometry conditions were as follows: ESI positive mode, nitrogen gas at 350 °C at 10 L min−1, capillary voltage 2.5 kV, and fragmentor voltage 100 V. PE were detected using multiple reaction monitoring (MRM). The fragmentation pattern of 12-O-tetradecanoylphorbol 13-acetate (TPA) (Fujifilm Wako Pure Chemical) was used as a standard reference for PE, with a characteristic ion transition from 311 to 293 m/z [37,38]. The TPA calibration curve for quantification was prepared in the range of 0.15–60.00 µg (R2 = 0.9999).

2.7. Meta-Analysis of Jatropha Seed Chemical Composition

Published information regarding the DW, K/S, lipid content, PE content, and IV of worldwide Jatropha accessions was searched on Google Scholar [39] on 1 February 2021, using the keywords listed in Supplementary Table S1. The collected information was used for the meta-analysis when the following conditions were met: (i) The country of origin of the Jatropha accessions was described, (ii) dried seeds were used for the DW and K/S measurements, (iii) complete extraction of seed lipids was performed using organic solvents (such as n-hexane) and its content was examined on a weight percent per kernel basis, and (iv) the IV was examined following the recommended practice of the American Oil Chemists Society Cd 1c-85 [34]. The selected references used for the meta-analysis are listed in Supplementary Table S2, and the number of Jatropha accessions in each country used in the meta-analysis are shown in Supplementary Table S3. The values derived from the references are compiled in Supplementary Tables S4 (DW), S5 (K/S), S6 (lipid content), S7 (PE content), and S8 (IV), and their statistical summary is presented in Supplementary Table S9. The compiled data on fatty acid composition were cited from a meta-analysis of Jatropha accessions from 26 countries in a previous study [33].

2.8. Statistical Analysis

The R environment [40] was used to calculate and draw violin plots, heatmaps, dendrograms, and scatterplots of the principal component analysis (PCA). In the histogram analyses, bin widths were defined according to the Freedman-Diaconis rule [41] and calculated using Microsoft Excel, as shown in Supplementary Table S10. Multiple comparisons for the violin plots and the scatterplot matrix were calculated using the Wilcoxon signed-rank exact test. A multi-layer radar chart for the composition of fatty acids and PE was drawn using Microsoft Excel. The R function ‘diana’ in the ‘ComplexHeatmap’ package [42] (version 3.12) was used to compute divisive clustering and depict a heatmap. Half the height of each dendrogram was used as the threshold level for separating the accession and chemical trait groups. Spearman’s rank correlation coefficients among the measurement parameters were computed using the R function ‘ggpairs’, and the results were interpreted in a scatterplot matrix using the ‘ggplot2’ [43] and ‘GGally’ packages [44] in R. Linear regressions were computed using the R functions ‘lm’ and ‘geom_smooth’ in the ‘ggplot2’ package. All regression lines were accompanied by confidence bands (probability = 0.95). For the PCA, all seed trait variables were computed using the R function ‘prcomp’ in the ‘stats’ package (version 4.2.0) [40]. The number of principal components was defined by Horn’s parallel analysis using the R function ‘fa.parallel’ in the ‘psych’ package [45,46,47] (version 2.1.3). A biplot map of the PCA was plotted using Microsoft Excel. An error ellipse (probability of 0.90) was calculated using the R function ‘Ellipses’ in the ‘car’ package [48].

3. Results and Discussion

3.1. Geographical and Environmental Features of the Botswanan Jatropha Accession Collection Sites

Figure 1A shows a map of the collection sites of Jatropha accessions in Botswana [13,25]. The collection sites were located at altitudes ranging from 914–1303 m above sea level (Figure 1B). The average annual precipitation at these sites from 1970 to 2000 ranged from 318–534 mm yr−1 (Figure 1C), which is lower than the suggested optimum range (900–1500 mm yr−1) for Jatropha production worldwide [1,49,50]. The average daily maximum temperature in the hottest month at the Jatropha collection sites in Botswana ranged from 30.0–36.4 °C (Figure 1D), which is comparable to the reported total range (27.6–41.6 °C) of Jatropha plantation sites worldwide [51]. In contrast, the average daily minimum temperature in the coldest month at the Jatropha collection sites was 3.2–8.4 °C (Figure 1E), which corresponds with the lowest minimum temperature range (4.4–19.3 °C) of plantation sites worldwide [51]. In the present study, the Botswanan accessions were categorized into three geographic groups: the north (N), central (C), and southeast (S) groups (Figure 1A). The N group included 15 accessions from regions with higher temperatures throughout the year. The C and S groups had 26 and 19 accessions, respectively, from regions with relatively mild temperatures in summer and colder temperatures in winter.

3.2. Frequency Distribution of Seed Chemical Traits among Botswanan Accessions

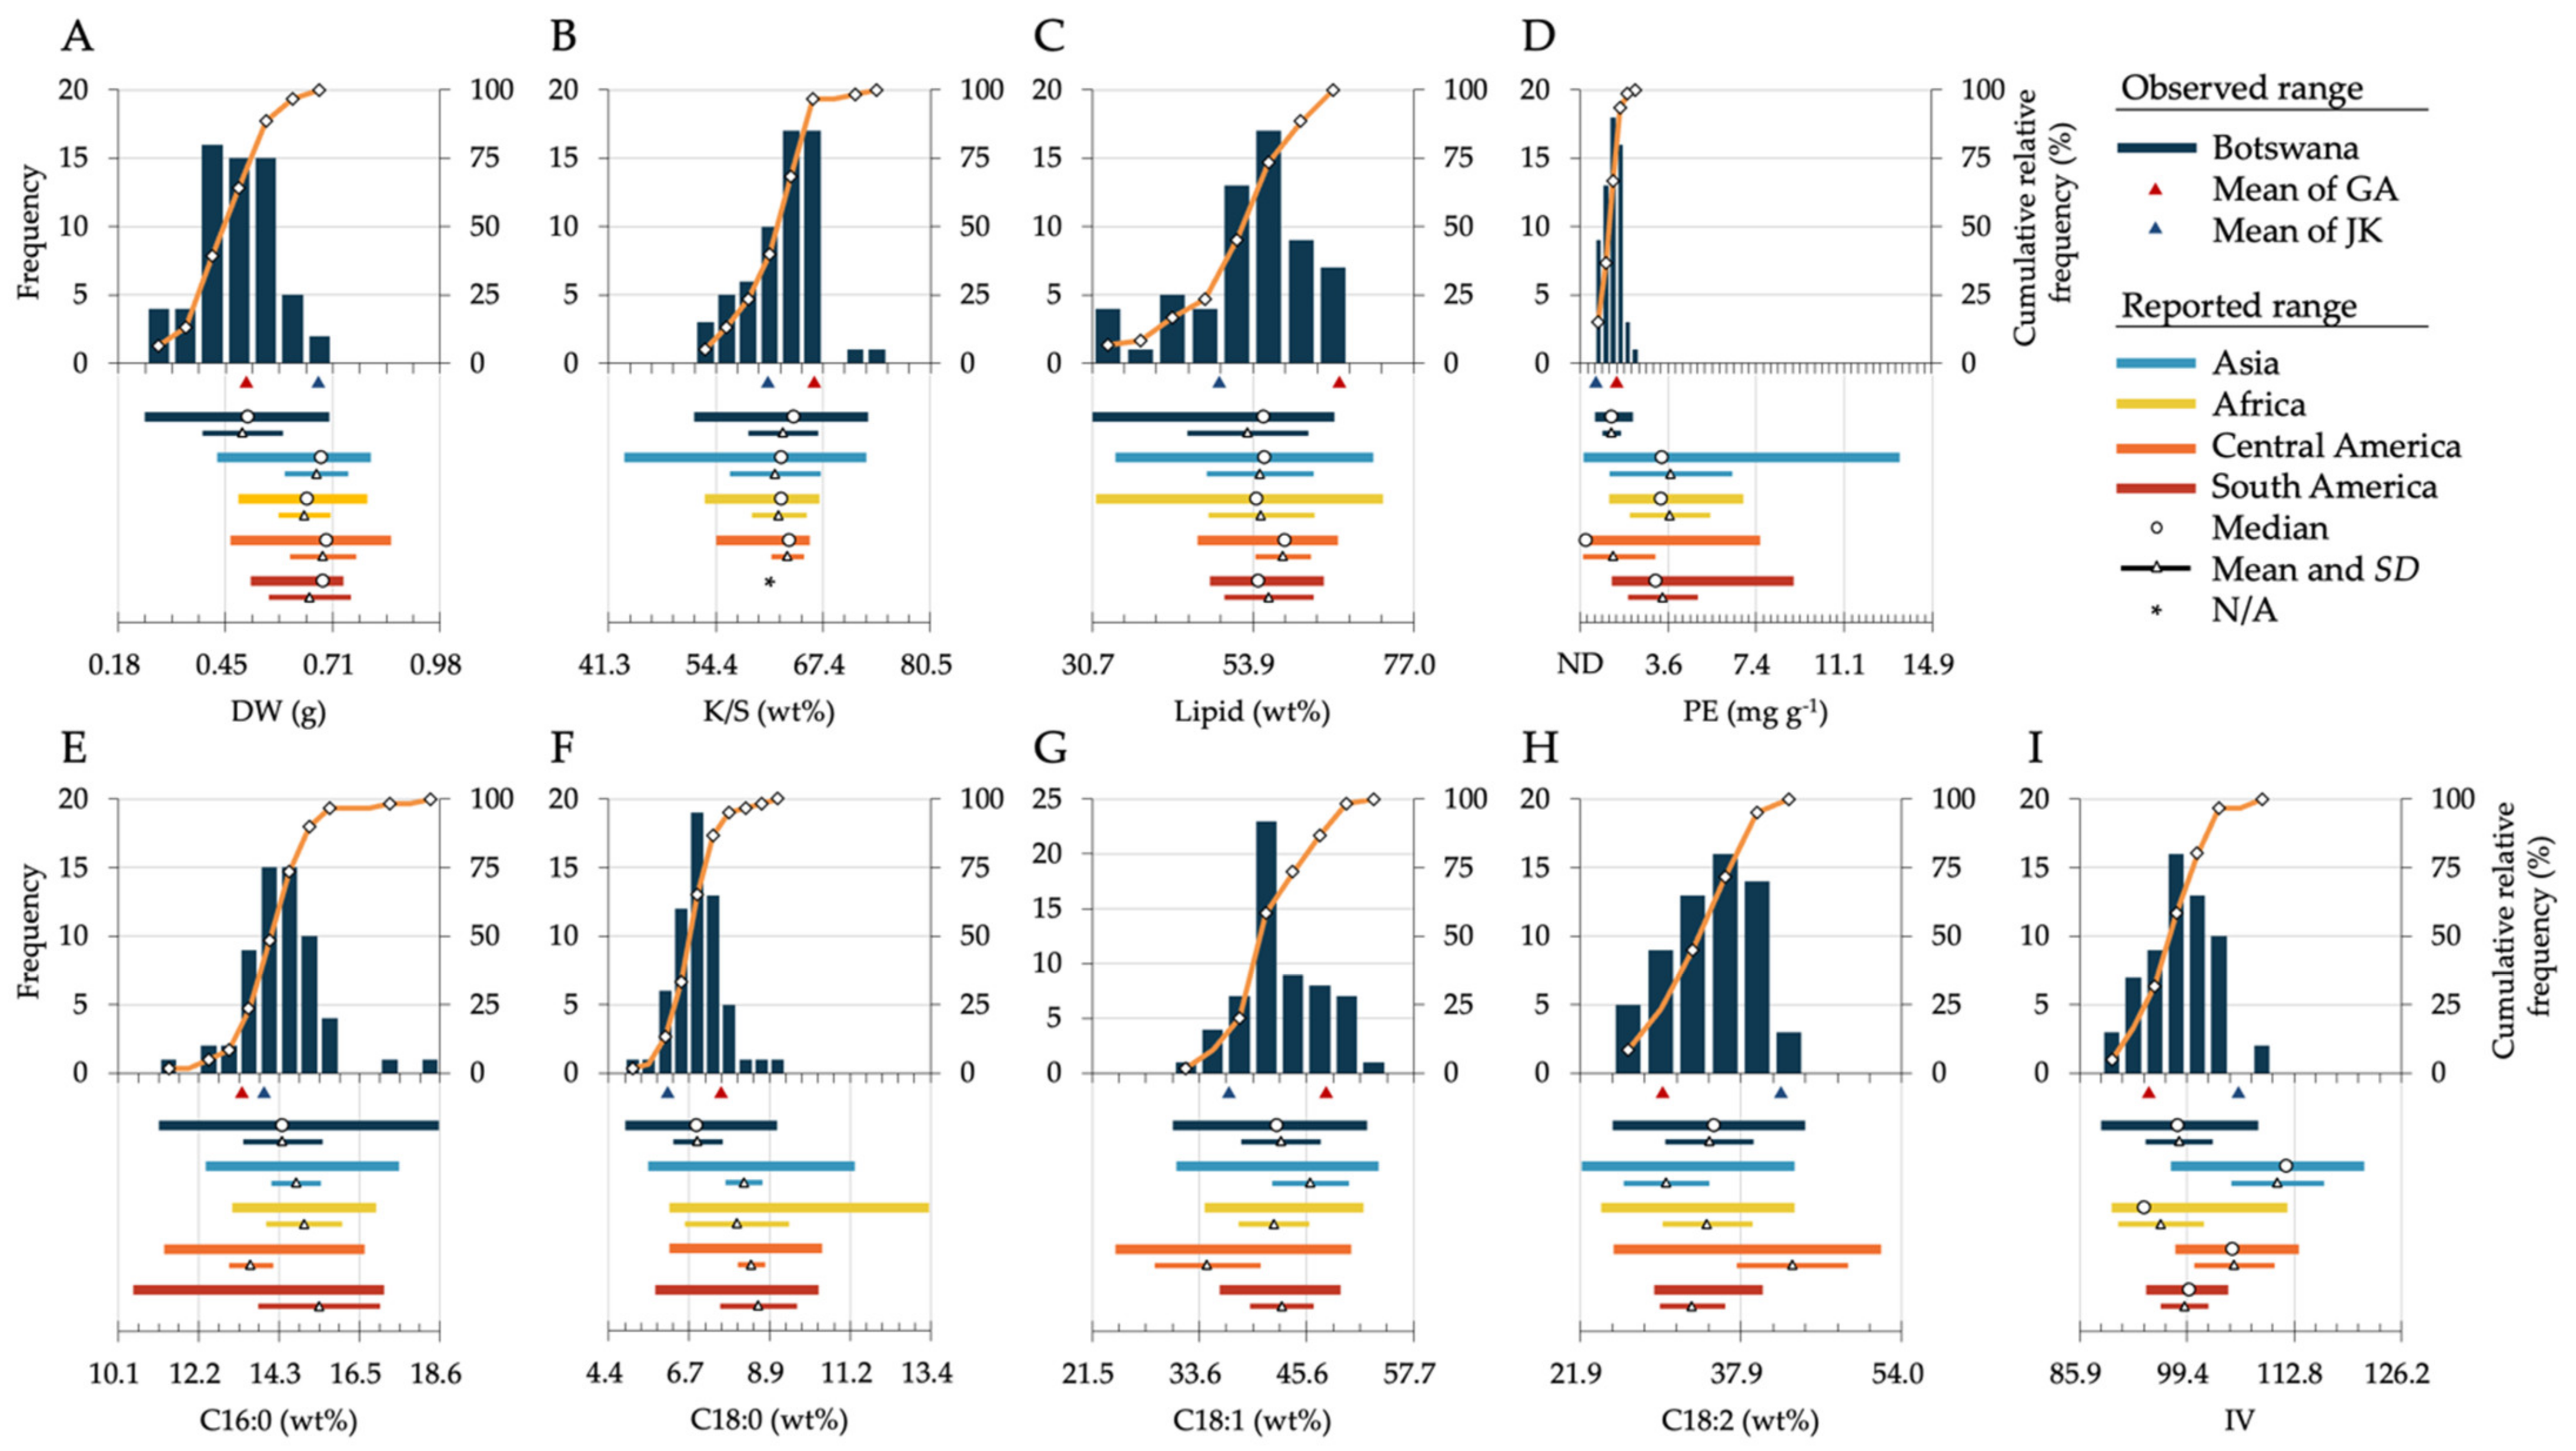
The 60 Botswanan Jatropha accessions, together with a candidate superior Jatropha germplasm, JK, from Jackalas1 [13] in the north of Botswana, and an external accession from Ghana [14,25], were collectively grown on an experimental farm in Gaborone, Botswana [13,25]. Seeds harvested in the 2016/2017 season were subjected to chemical composition analyses. The distributions of the seed chemical traits, such as lipid and PE content, major fatty acid composition, IV, DW, and K/S are shown as histograms and cumulative frequency charts in Figure 2 and Table S10.
To evaluate the observed seed chemical traits in the Botswanan accessions, a meta-analytic comparison with external global accessions was performed. For this analysis, published literature on these traits was searched on Google Scholar using a set of keywords for seed chemical compositions and countries, as compiled in Supplementary Table S1. The obtained 40 studies (compiled in Supplementary Table S2) reported a total of 638 Jatropha accessions from 46 countries, which spanned the Jatropha cultivation zones in four continents (Supplementary Table S3). The DW (Supplementary Table S4), K/S (Table S5), lipid content (Table S6), PE (Table S7), and IV (Table S8) reported in these studies showed considerable variations among Jatropha accessions (Table S9).
The seed trait comparisons suggested several features of Botswanan Jatropha accessions which differed from external accessions (Figure 2, Supplementary Tables S9 and S10). Seed DW in the Botswanan population ranged from 0.25–0.71 g seed−1, and the accessions JK and GA had the mean values of 0.68 and 0.50 g seed−1, respectively. The median of Botswanan population was 0.50 g seed−1, which was markedly lower than the medians of the external accessions from four regions of the world (0.65–0.70 g seed−1). The factors responsible for the lower median of seed weights in the Botswanan accessions are currently unknown, but it could be at least partly attributable to the shorter growing season in Botswana owing to the cold winters [14]. The median values for the K/S gravimetric ratio and lipid content in the Botswanan population (63.9 and 55.5 wt%, respectively) were comparable to those in the external accessions (62.4–63.3 wt% and 54.5–58.5 wt%, respectively). The lipid content of accession GA (66.4 wt%) was the highest among the accessions used in the present study. The PE content in the Botswanan Jatropha accessions ranged from 0.48–2.11 mg g−1 with a median of 1.22 mg g−1. Notably, the candidate superior accession JK had a PE content of 0.53 mg g−1, which was among the lowest values in this study. Although the median PE value in Botswana was higher than that in Central America, which includes many non-toxic varieties [52,53,54,55,56,57], the value was markedly lower than those in other Asian, African, and Southern American countries (3.09–3.32 mg g−1), suggesting that the PE content in Botswanan Jatropha accessions is relatively low.
Among the major fatty acids in the Botswanan accessions, the C16:0 (palmitic acid) and C18:0 (stearic acid) saturated fatty acids showed ranges of 11.2–18.5 and 4.9–9.1 wt%, with means of 14.4 and 6.9 wt%, respectively (Figure 2E,F). These mean values were comparable to those reported for the global Jatropha accessions (13.6–15.4 and 8.0–8.6 wt%, respectively) (Figure 2E,F) [33]. It is noteworthy that one Botswanan accession (accession S15) had an exceptionally low C18:0 (stearic acid) content of only 4.9 wt%, which was the lowest value reported among all Jatropha accessions worldwide. The C18:1 (oleic acid) and C18:2 (linoleic acid) unsaturated fatty acid content in the Botswanan accessions ranged from 30.5–52.5 and 25.1–44.4 wt%, respectively, with means of 42.8% and 34.9% (Figure 2G,H). These values were generally similar to those in the external Jatropha accessions, while some Botswanan accessions had markedly higher C18:1 (>52.5 wt%, accession C23) and C18:2 (>44.4 wt%, accession S15) content values. Consequently, the IV, an index representing fatty acid desaturation, showed a range of 88.6–108.3 for the Botswanan accessions (Figure 2I); these values were lower than the upper limit (≤120) stipulated in EN 14214 [58] and were of sufficient quality for use as FAMEs for biodiesel. Lower level of IV, which is advantageous as feedstock for oxidation-resistant biodiesel, was observed in accessions N14 (IV of 88.6), S14 (89.2), S3 (89.2), and C25 (89.2). The candidate superior accession JK had modestly higher C18:2 content and IV than the medians of all accessions, while GA showed relatively lower values for these parameters. As fatty acid composition and desaturation define the lipid physicochemical properties that are relevant to industrial applications [59,60], the observed variation in the fatty acid composition in the Botswanan Jatropha accessions provide useful background information on germline selection for future industrial applications and selective breeding.

3.3. Regional Differences in the Seed Chemical Compositions of Botswanan Accessions

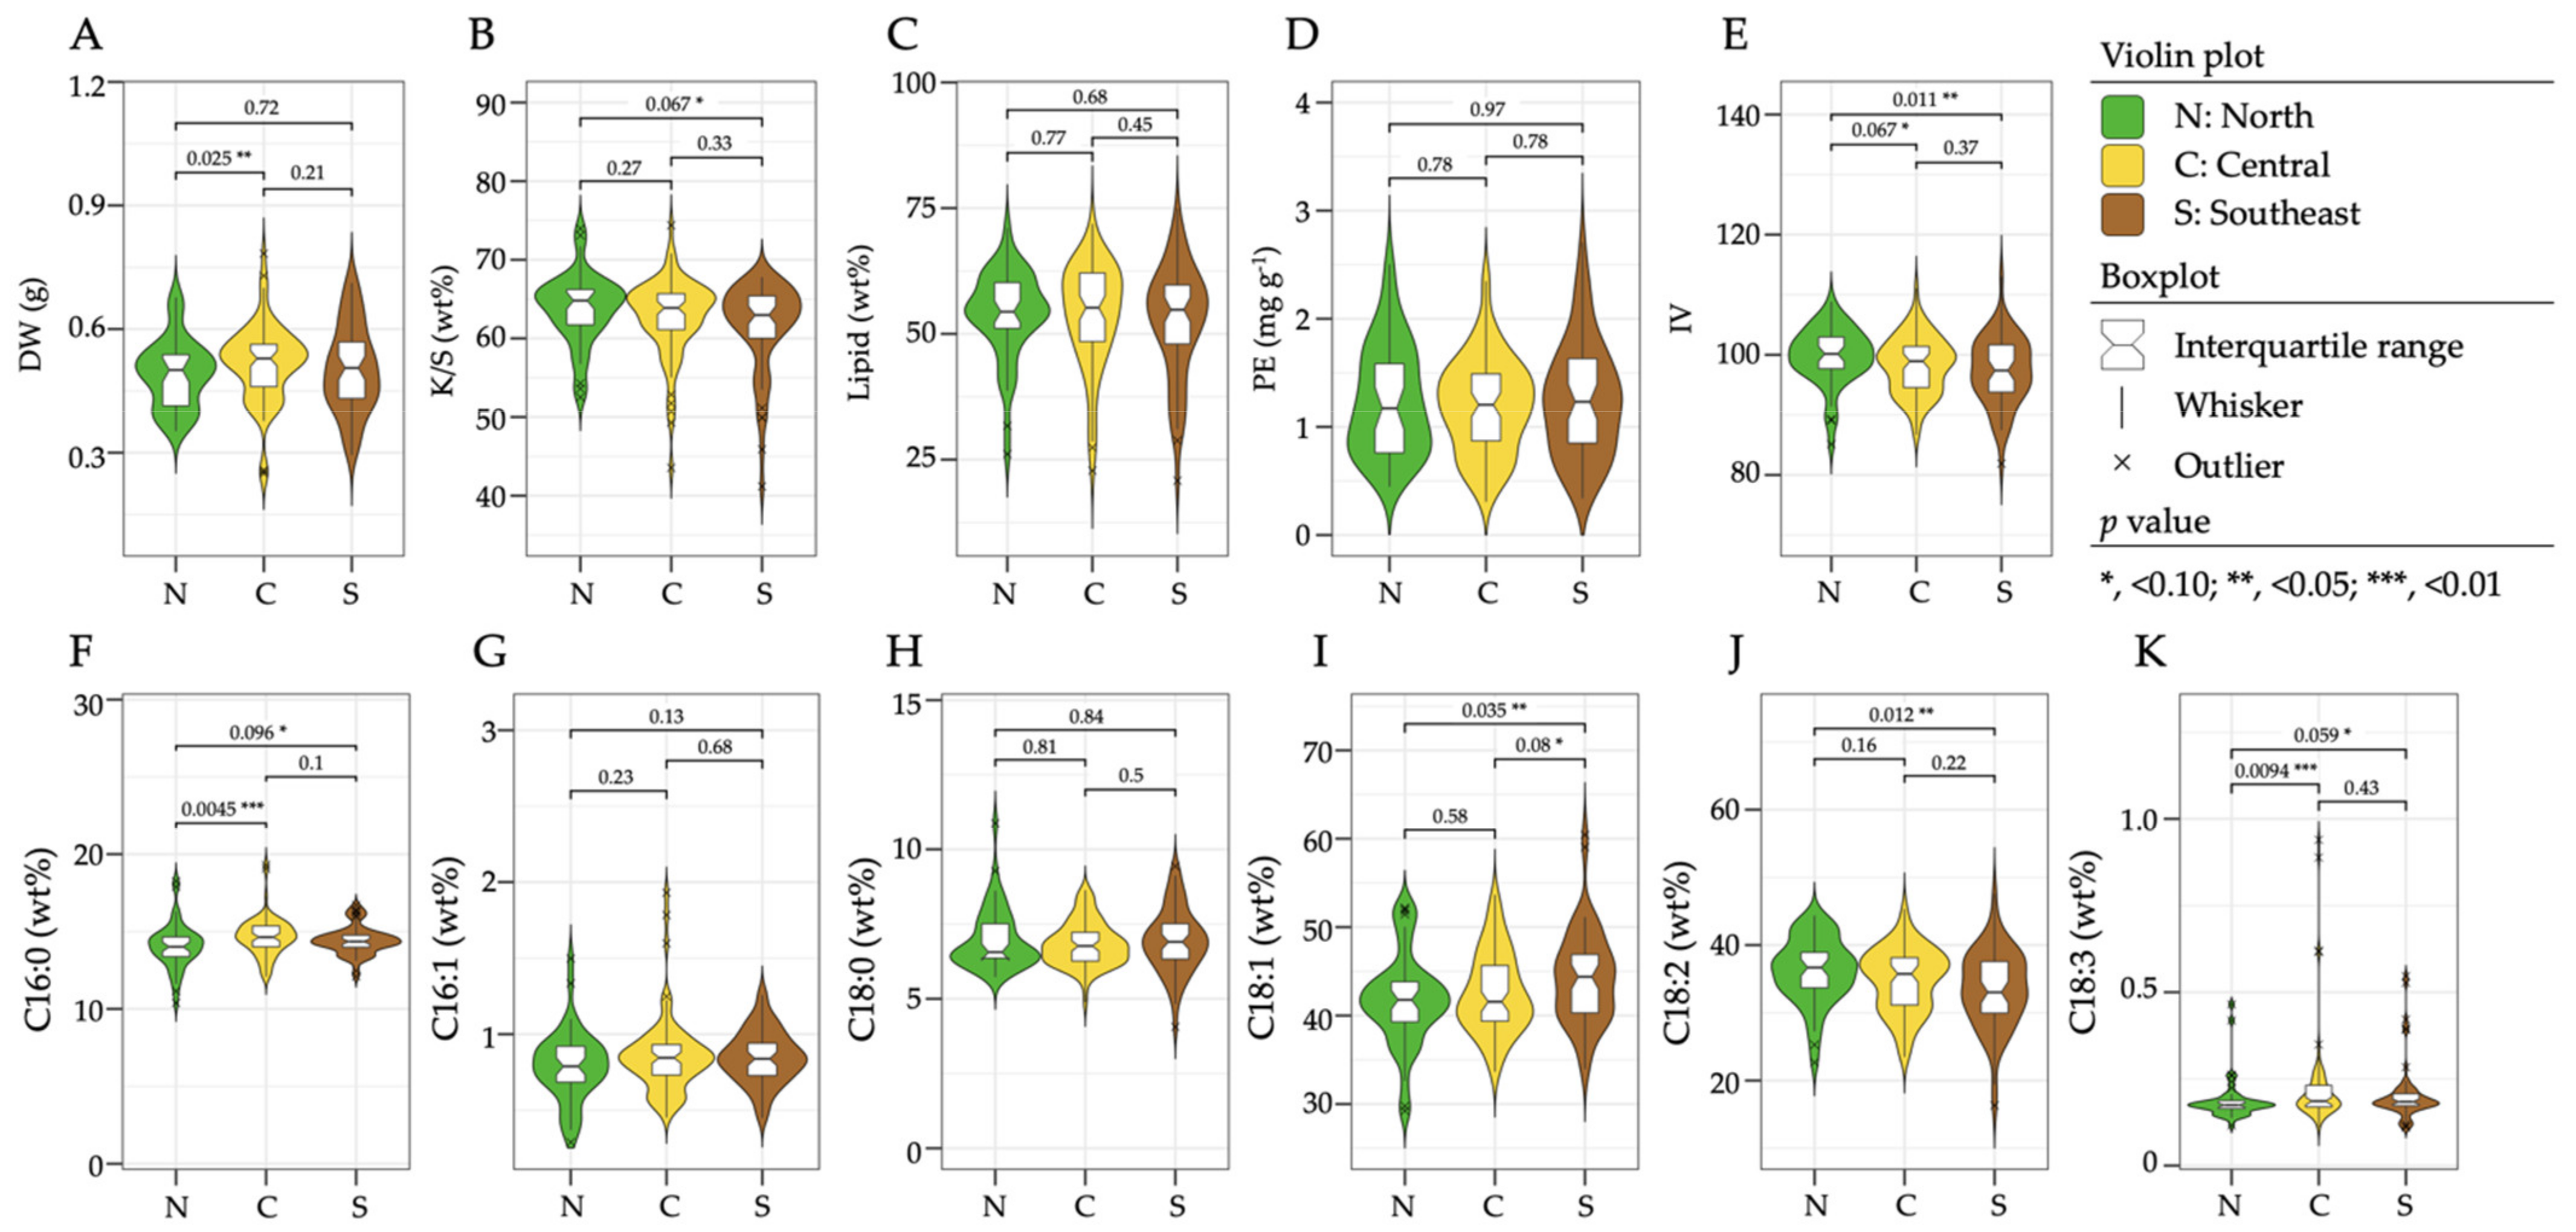
Subsequently, we evaluated whether the regional domestic origins (N, C, and S) of the Botswanan accessions affected their seed chemical composition. The violin/boxplots of the three regions show a broad and largely overlapped pattern for most of the physicochemical traits, and the total lipid, PE, C16:1, and C18:0 parameters showed no significant differences (p > 0.1) among the three regions in the Wilcoxon statistical tests (Figure 3). However, small but significant differences were observed in some physicochemical traits, such as the higher IVs in the N geographical group than in the C and S groups at p < 0.1, and p < 0.05, respectively (Figure 3E), and the higher C18:1 content in the S group than in the N or C groups at p < 0.05 and p < 0.1, respectively (Figure 3I). These observations suggest that regional differences in seed physicochemical properties were recognizable, but not markedly large in the Botswanan accessions.

3.4. Accessions with Unique Seed Chemical Compositions

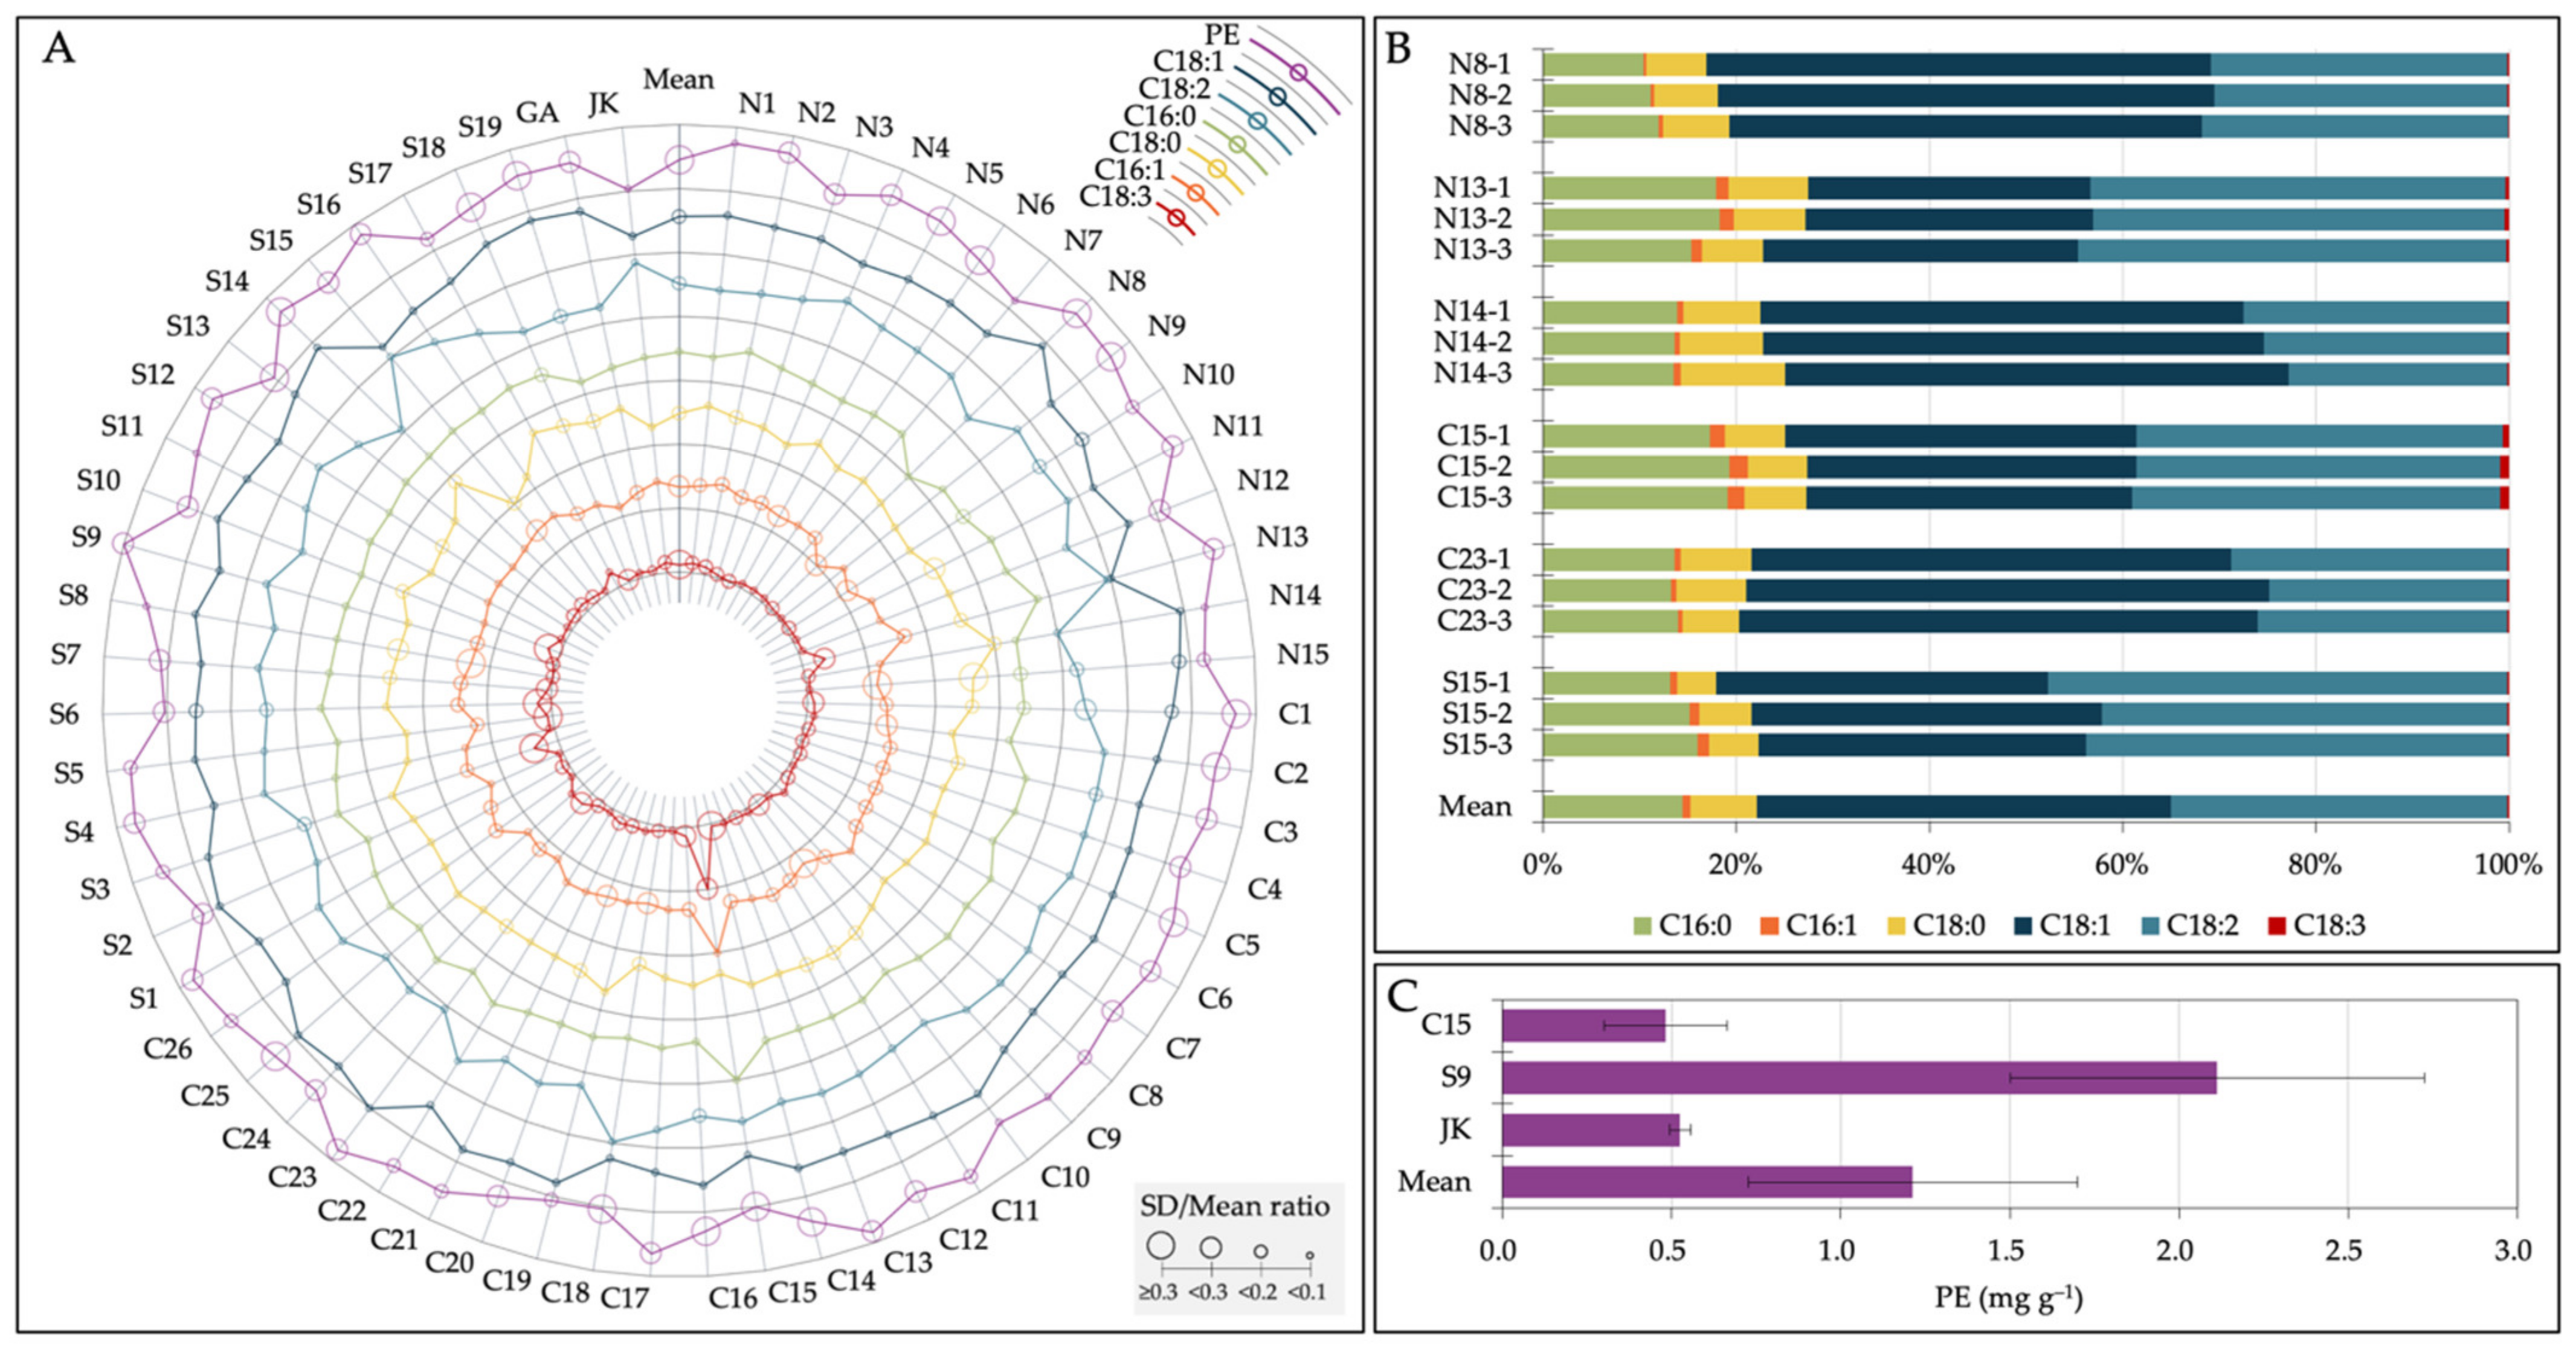
Figure 4A depicts a multiple-layer radar chart showing the differences in fatty acid and PE content among the Botswanan accessions. The plot revealed that some accessions were outstandingly rich in specific chemical components, such as the high C16:0, C16:1, and C18:3 content in accession C15, high C18:1 content in accession C23, high C18:2 content in accession S15, and high PE content in accession S9. Regarding C16:0 and C18:1, the SD/mean ratio, an index that represents the homogeneity of chemical compositions among individual seeds in a given accession, was <0.1 in 93.5% of all 62 accessions, suggesting that these components were relatively homogeneous among different individual seeds. In contrast, the PE values tended to fluctuate among the individual seeds in a given accession, with 25.8% of the accessions showing an SD/mean ratio over 0.3.
Figure 4B shows the fatty acid composition of unique representative accessions. Accession N14 showed the lowest C18:2 (25.1 ± 2.3%) content among all the accessions, while the highest C18:2 value was observed in accession S15 (44.4 ± 2.9%). These observations were consistent with their lowest (88.6) and highest (108.3) IVs among the Botswanan accessions (Figure 2I and Supplementary Table S10). Accession C23 had the highest C18:1 content (52.5 ± 2.5%). Accession C15 had the highest C16:0, C16:1, and C18:3 content, which was 1.3-, 2.1-, and 3.9-fold higher than the averages of all the Botswanan accessions. Accession C15 was also characterized by the lowest PE content (0.48 ± 0.18 mg g−1) among all the Botswanan accessions (Figure 4C), and was also one of the lowest PE levels globally (Figure 2D). Other accessions showing the lowest level of PE in this study were accessions S6 (0.53 ± 0.14 mg g−1), JK (0.53 ± 0.03 mg g−1), and C18 (0.54 ± 0.16 mg g−1).

3.5. Categorization of Botswanan Accessions Based on Their Seed Chemical Traits

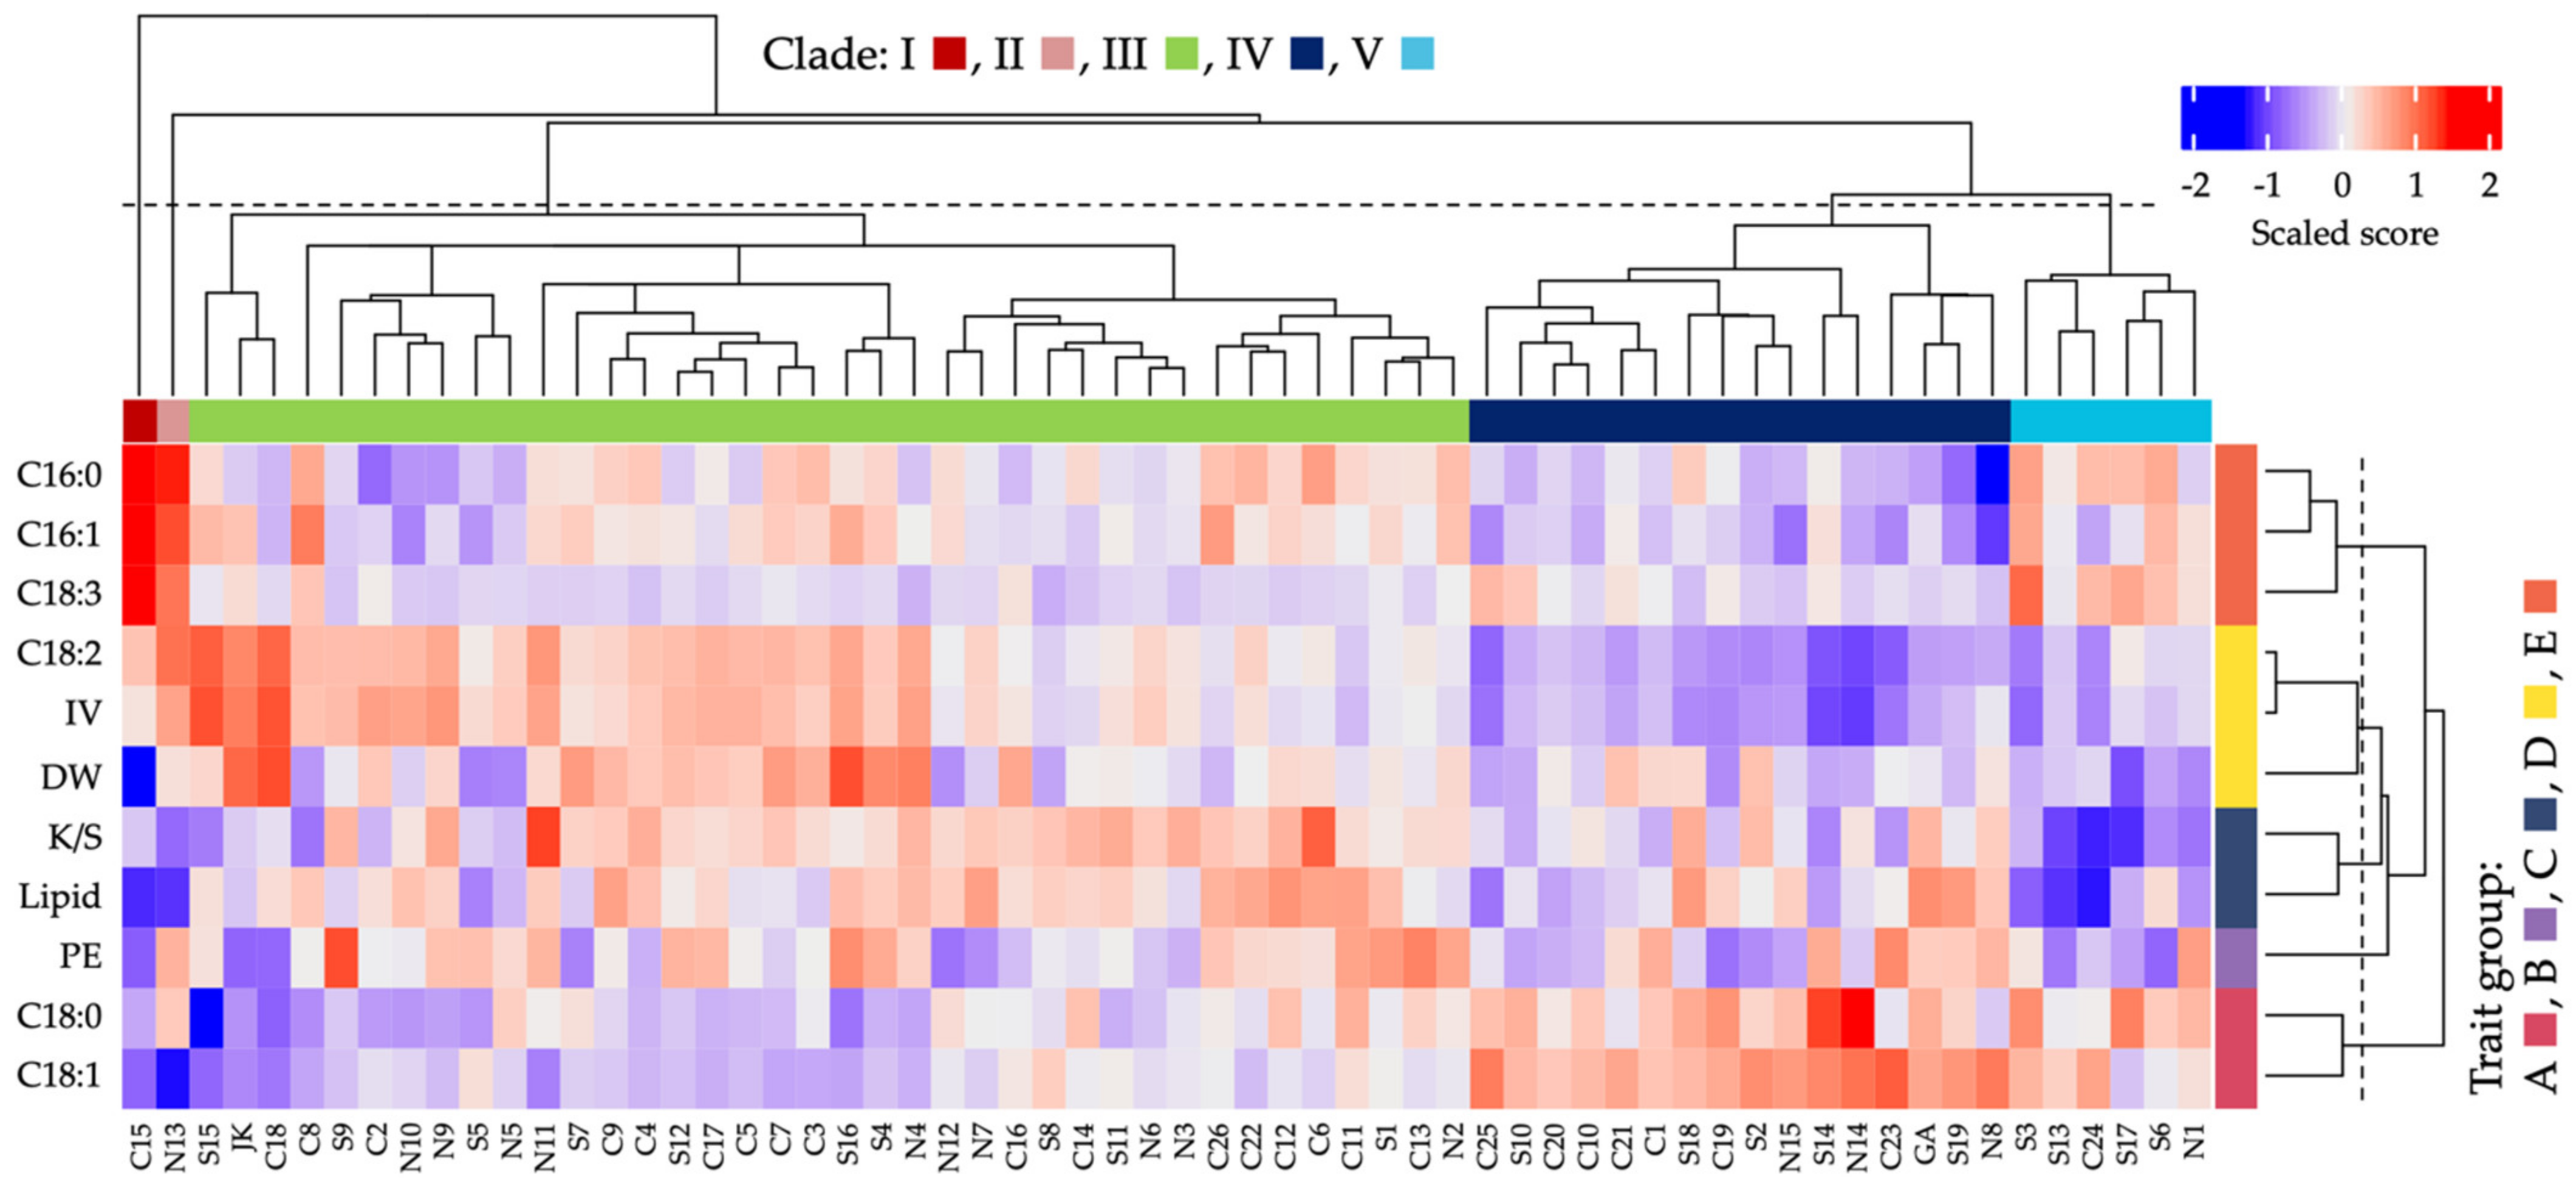
The relationship between individual Botswanan Jatropha accessions and their seed chemical traits was visualized using heatmap analysis (Figure 5). Based on a threshold level of half the height of the dendrograms, the Botswanan accessions were clustered into five clades, while the trait parameters were split into five groups. Clade I was the most distant and comprised only a single accession (accession C15), which was characterized by high values for the group E chemical traits (C16:0, C16:1, C18:3) and low values for yield-related traits, such as DW and lipid content. Clade II also comprised a single accession (N13), with the lowest C18:1 value. Clade III formed the largest group (38 accessions) which included the accession JK, representing 61% of all accessions. Clade IV was the second largest clade (16 accessions, 26%) and included the accession GA. It was characterized by low values for trait groups D (C18:2, IV, and DW) and E (C16:0, C16:1, and C18:3), and high values for trait group A (C18:0 and C18:1). Clade V comprised six accessions and was characterized by low values for trait group C (K/S and lipid content).

3.6. Correlations between Seed Chemical Traits

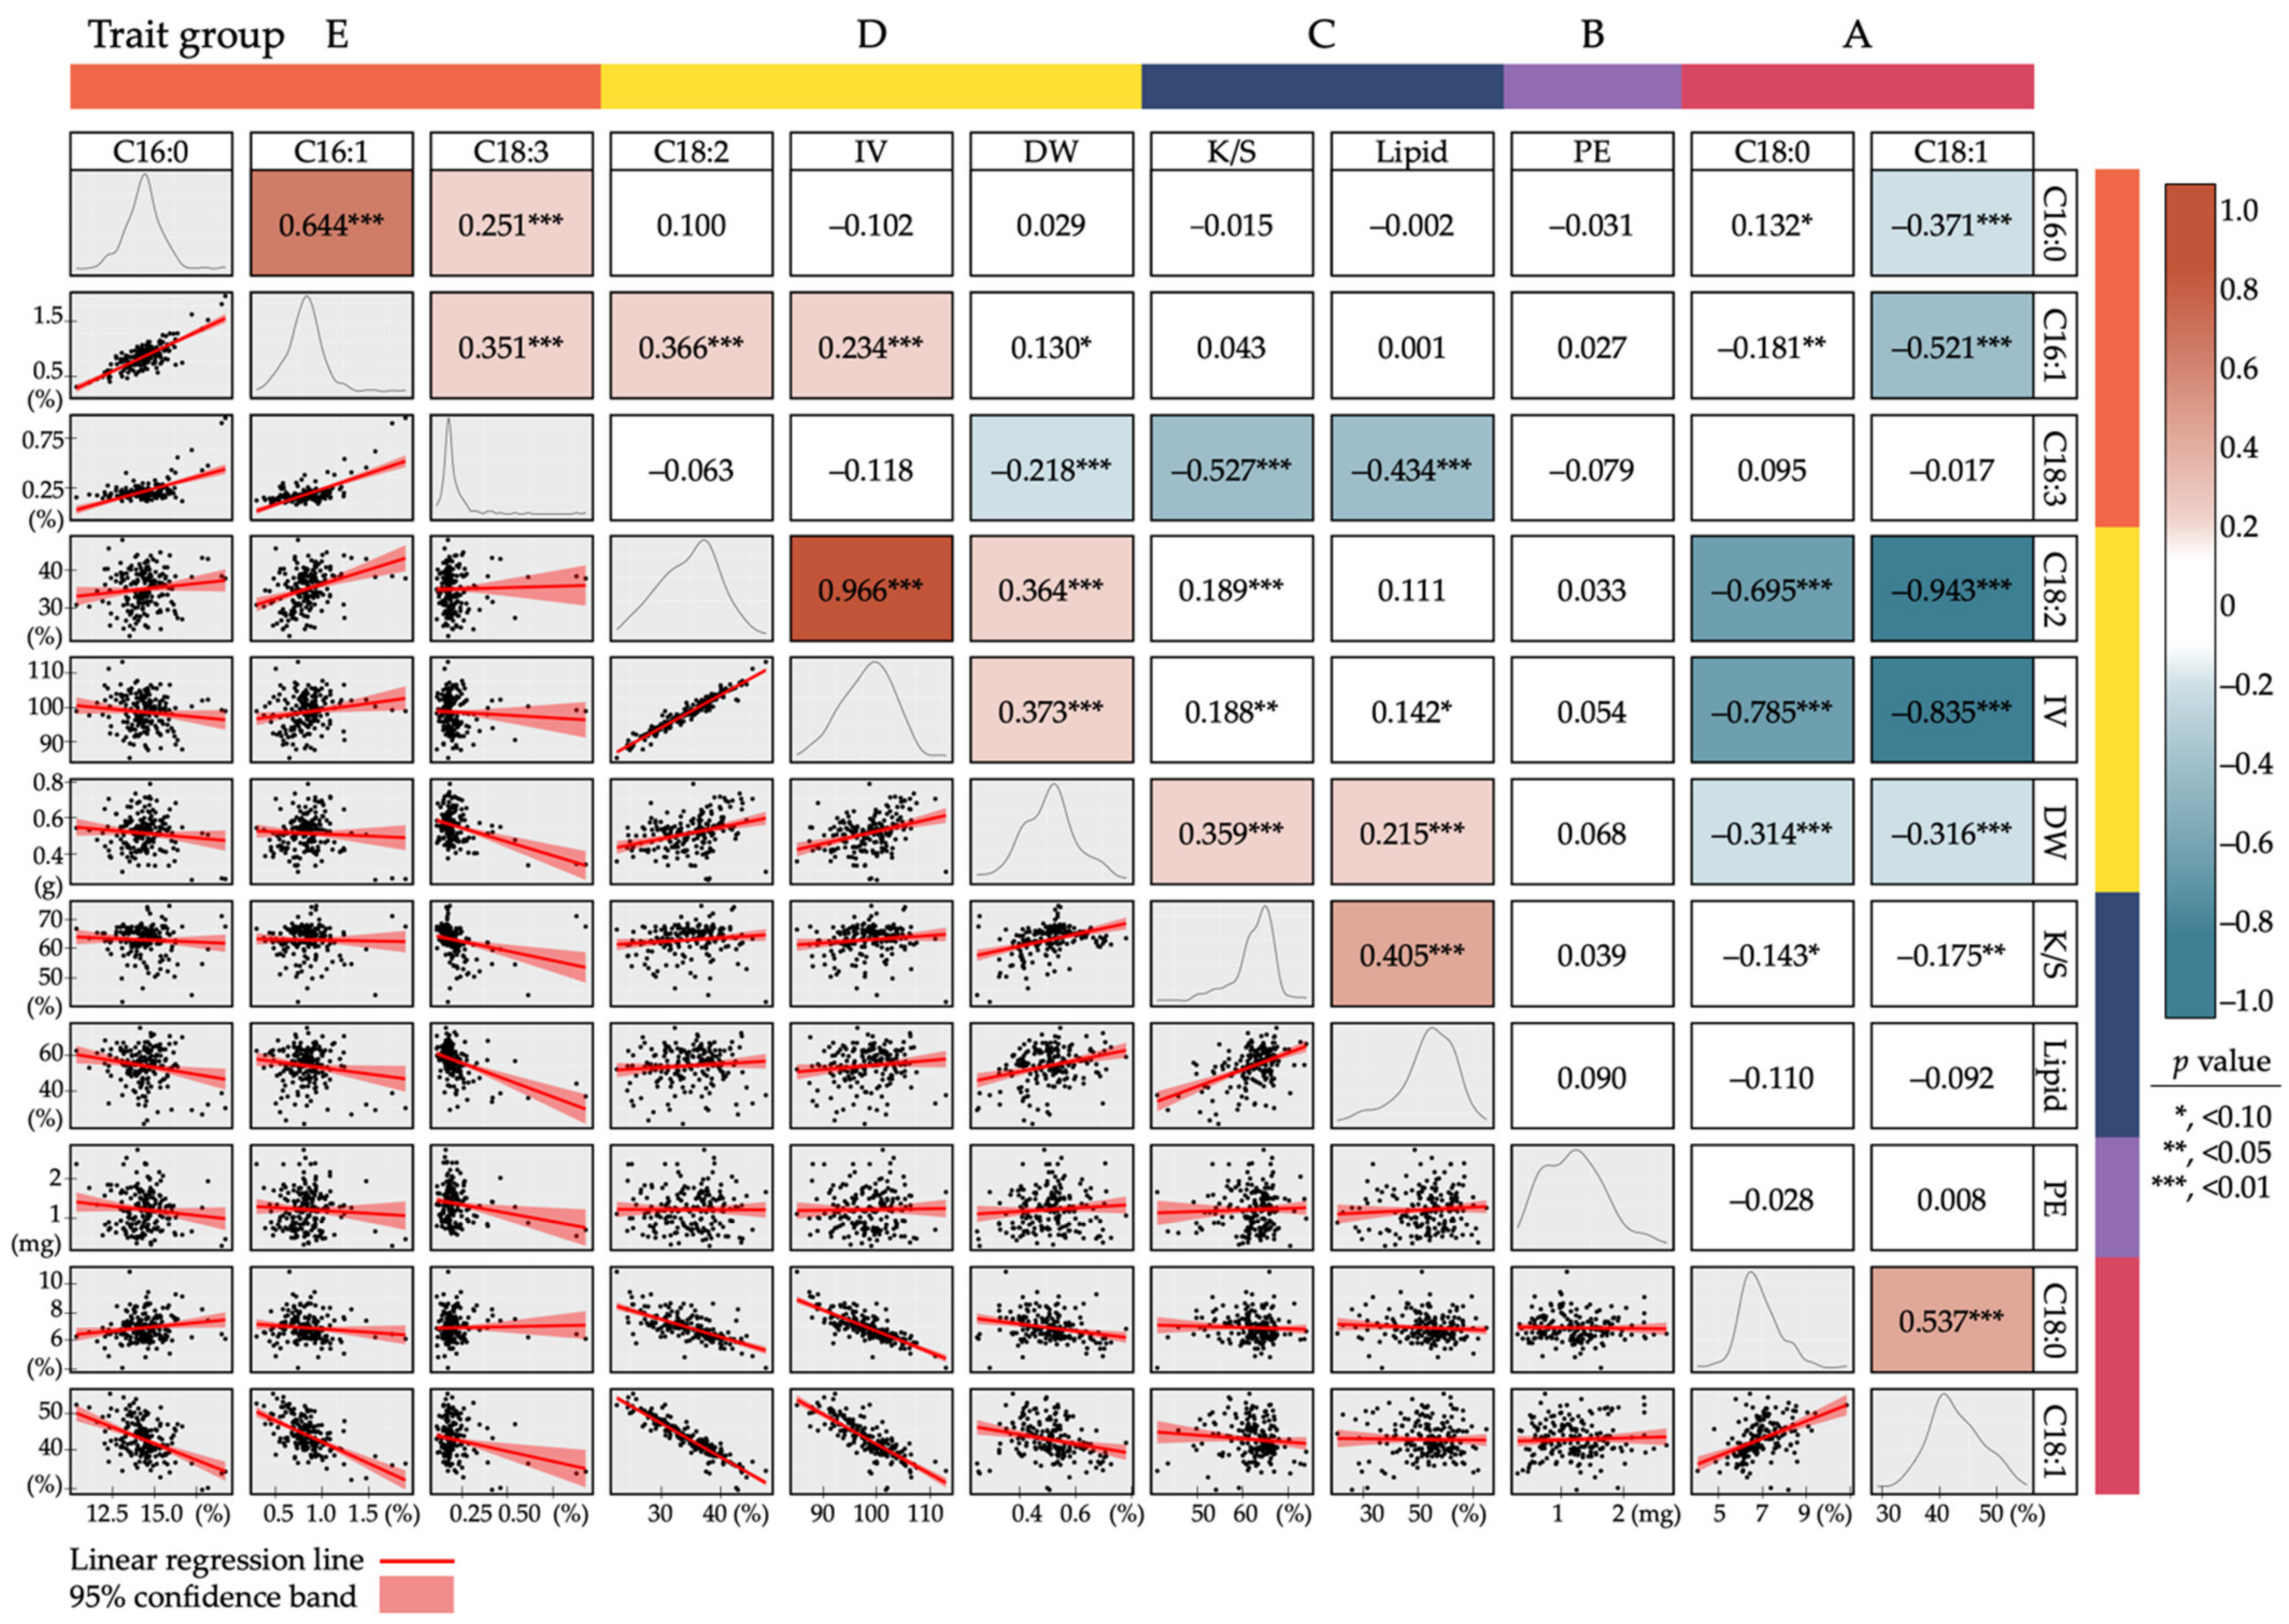
The correlations between the seed chemical traits of the Botswanan accessions were further examined using Spearman’s rank correlation analyses (Figure 6). Consequently, significant positive correlations were observed between specific combinations of traits, such as the IV and C18:2 content (correlation coefficient of 0.966), which both belonged to chemical trait group D in the heat map analysis in Figure 5. A significant positive correlation was observed between the lipid content and K/S ratio (0.405), both of which belonged to chemical trait group C. Positive correlations among DW, K/S, and lipid content have been reported previously [61,62]. Similarly, positive correlations were found between C16:0 and C16:1 (0.644, within trait group E) and C18:0 and C18:1 (0.537, within trait group A).
In contrast, significant negative correlations were observed between some combinations of groups A and D. For example, C18:1 and C18:2 had a strong negative correlation (−0.943), suggesting a trade-off relationship between these components, as previously reported in many plants, including Jatropha [63,64]. Genotypic variations in the C18:1/C18:2 ratio of seed fatty acids have been observed in many crops [63,65]. This variation has been attributed, at least in part, to the level of Δ12 desaturase (FAD2) activity, which is responsible for the desaturation of oleate to linoleate [66]. Moreover, the synthesis of C18:1 fatty acids occurs in proplastids in developing seeds, and the conversion of C18:1 to C18:2 and then to C18:3 occurs in the cytosol; thus, the conversion of C18:1 to C18:2 is potentially affected by the efficiency of C18:1 transport from the proplastids to the cytosol [65,66,67]. It is intriguing to observe that the C18:3 content showed significant negative correlations with yield-related traits, such as the K/S ratio (−0.527), lipid content (−0.434), and DW (−0.218); however, the molecular mechanisms underlying these negative correlations are currently unknown. The levels of the C16:1 and C18:1 monounsaturated fatty acids were significantly negatively correlated (−0.521), suggesting that fatty acid Δ9 desaturase isozymes with differential substrate specificities may affect the ratio of these monounsaturated fatty acids, as reported previously in cotton seeds [68].
It is noteworthy that the PE content did not show any significant correlations with other chemical traits (Figure 6), suggesting that seed PE levels may be regulated independently from yield traits and fatty acid metabolism. The biosynthetic pathway of PE in Jatropha is largely uncharacterized, but the conversion of geranyl diphosphate to casbene by terpene cyclase casbene synthase (CS) is suggested to be a key step in PE biosynthesis [69,70,71]. More than 10 CS gene homologs were found in the Jatropha genome [72,73], and a correlation between the protein abundance of these CS isozymes and PE levels among Jatropha genotypes was reported via targeted proteome analysis [74]. Unraveling the relationship between the variation in PE levels and the CS expression profiles of the Botswanan Jatropha accessions awaits further investigation in the future.

3.7. Principal Component Analysis

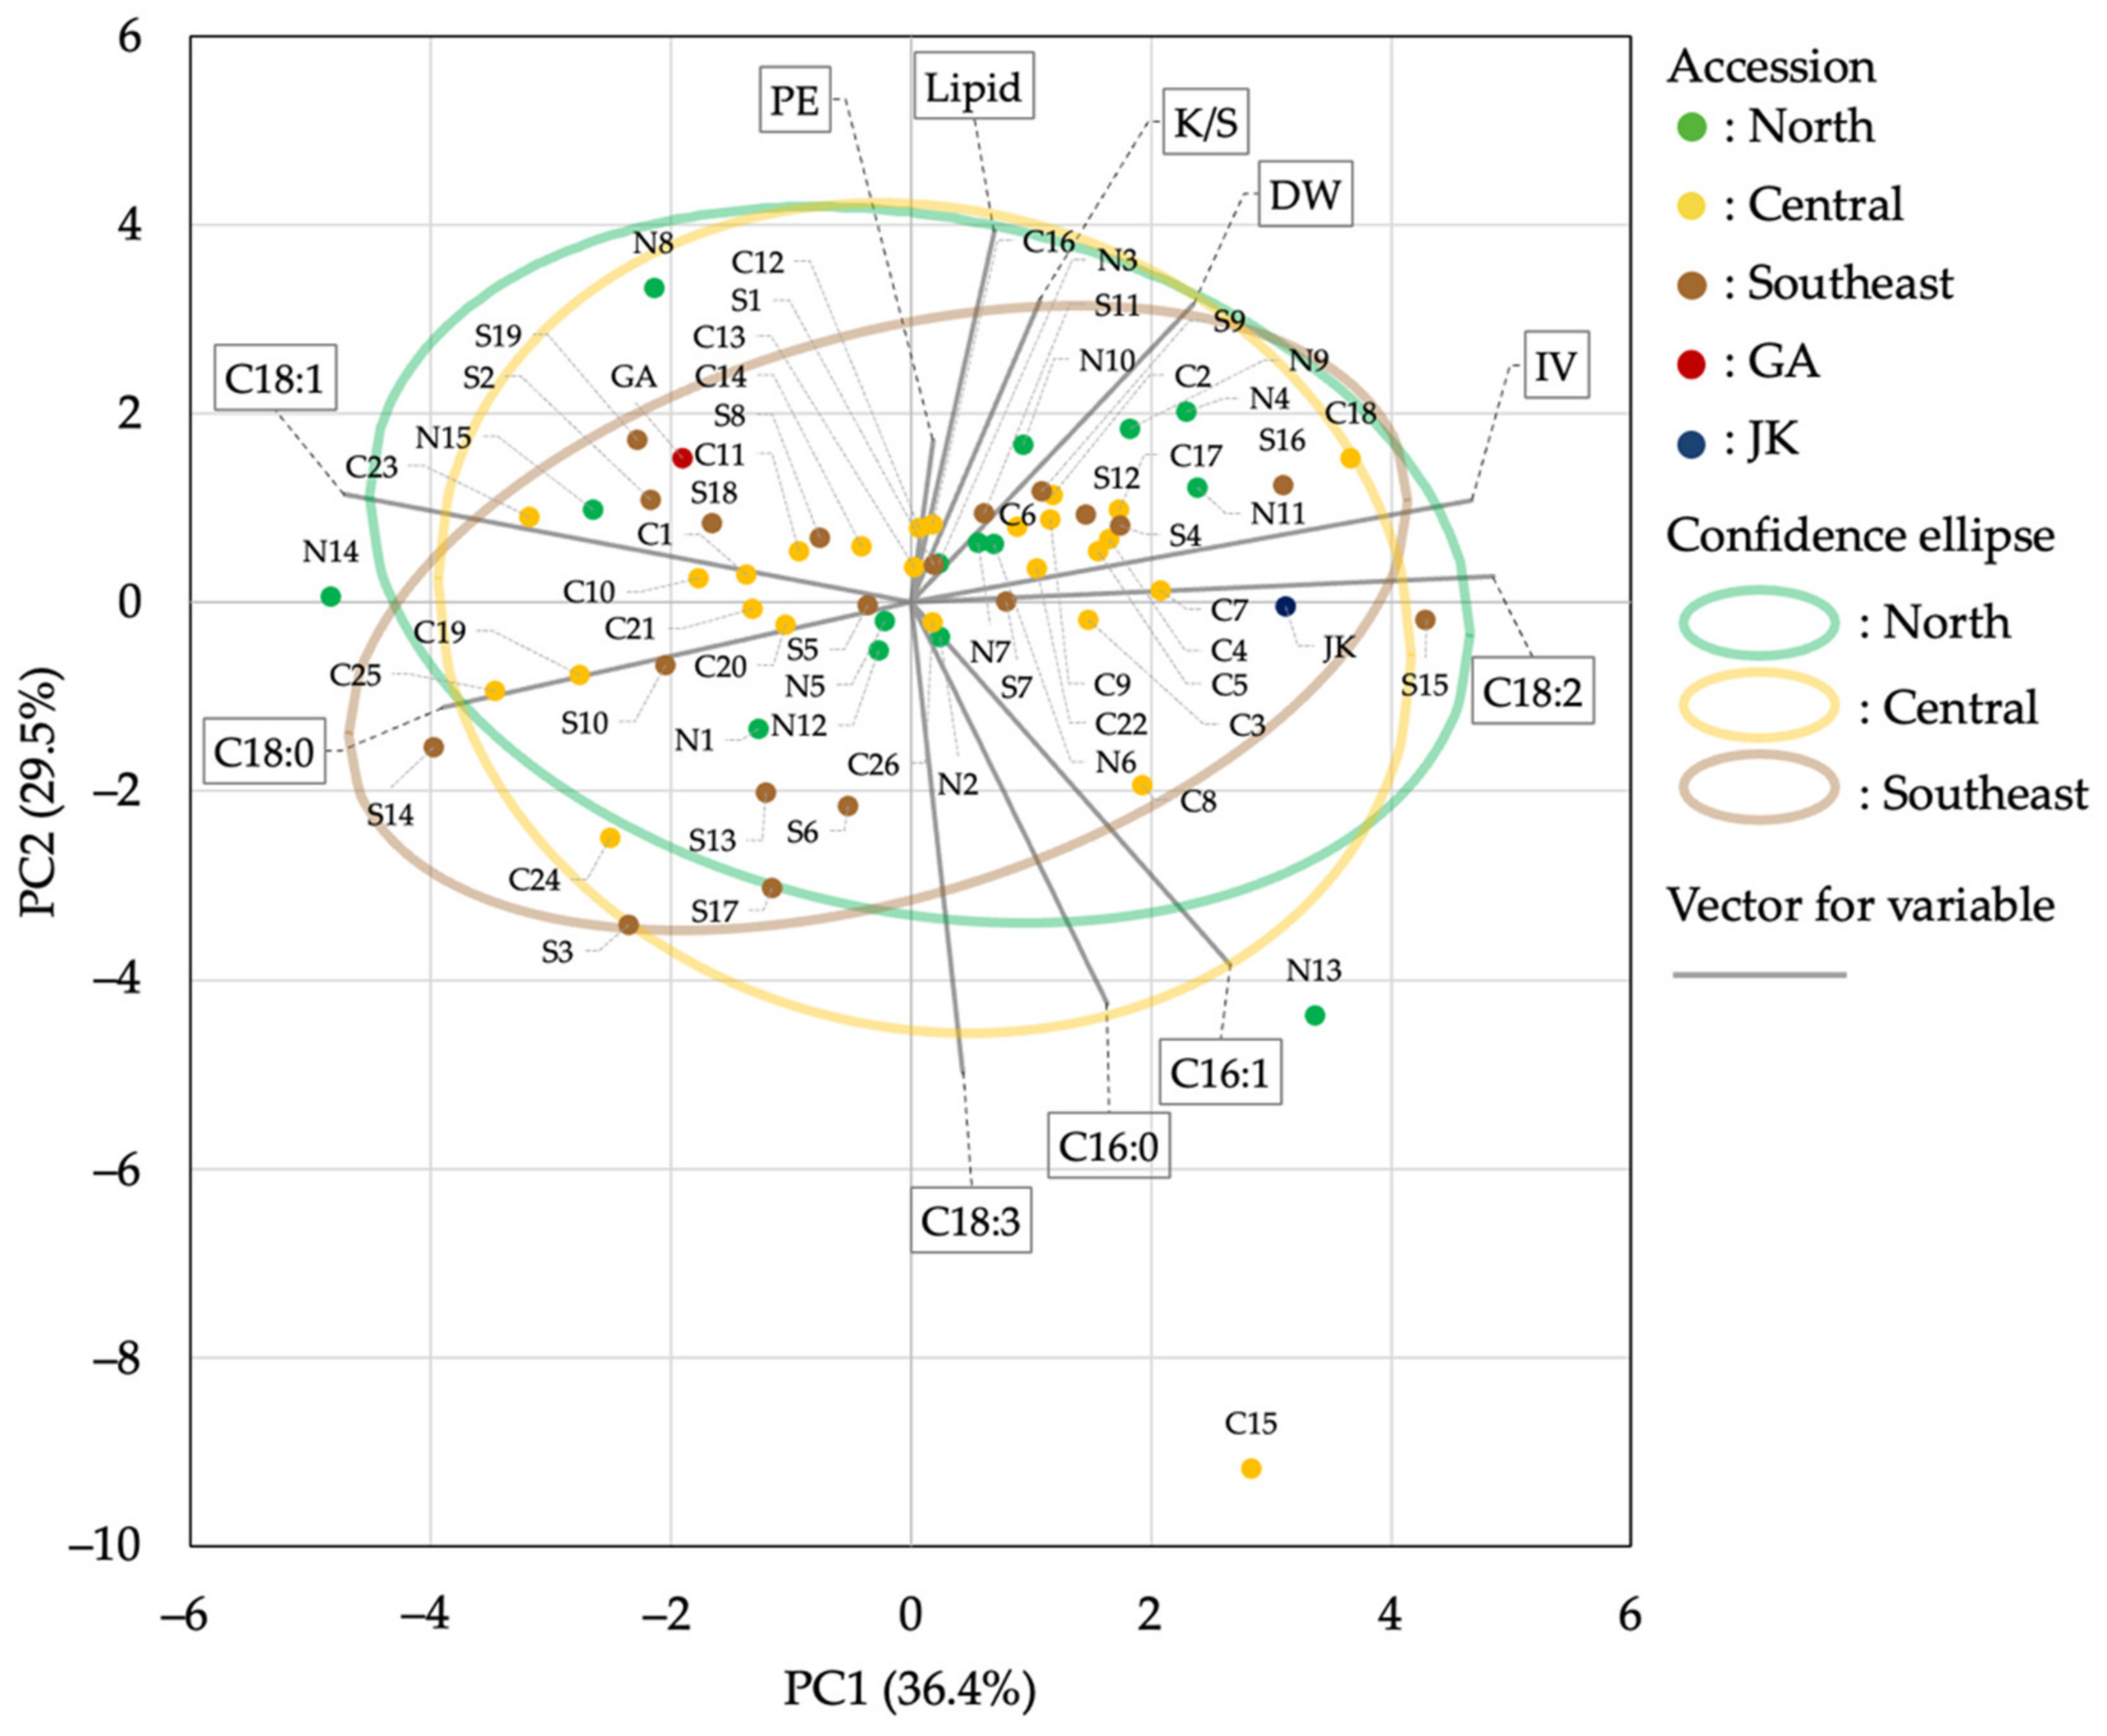
The characteristics of the Botswanan Jatropha population, in terms of seed chemical traits, were further evaluated using PCA. Horn’s parallel analysis indicated that the actual eigenvalues of the first two principal components (PCs) exceeded those of randomly generated simulated eigenvalues (Supplementary Table S11). Therefore, the first and second PCs were selected for score plot analysis (Figure 7, Supplementary Table S12), together explaining 65.9% of the information. The PCA map suggests that the Botswanan Jatropha accessions have a population structure comprising a loose core gathering close to the map origin, which included GA and the candidate superior accession JK, with several outlier accessions that have deviated from the core. The confidence ellipses for the N, C, and S geographical regions largely overlapped, but those of N and C were slightly larger than that of S, at least partly owing to the existence of deviated accessions such as C15, N13, and N14. These outlier accessions were associated with eigenvectors for specific chemical traits. For example, accession C15 was associated with the abundance of C16:0, C16:1, and C18:3, and accession N14 was associated with the levels of C18:1 and C18:0. These observations show that the Jatropha resources in Botswana contain several accessions with unique seed chemical properties.

4. Conclusions

This study suggests that Botswanan Jatropha accessions possess considerable diversity, in terms of seed chemical composition, which is characterized by variation in fatty acids, IVs, and PE levels. The Botswanan accessions contained several outlier germlines with strongly deviated seed chemical compositions, which could potentially be useful for industrial applications. The accessions with lower level of IV, such as accessions N14, S14, S3, and C25, could be advantageous as feedstock for oxidation-resistant biodiesel, while the accessions with lower levels of toxic PE, such as accessions C15, S6, JK, and C18, could be beneficial from a health or environmental perspective. The regional differences among the three geographical areas were relatively small, which suggests that these outlier accessions might have generated spontaneously in each geographical location. Further studies are needed to address the effects of the cultivation environment, associated genetic factors, and their combinations on the observed seed chemical diversity. Moreover, future investigations and exploitation of these Jatropha genetic resources, as materials for breeding and industrial applications, are anticipated.

Supplementary Materials

The following are available online at https://www.mdpi.com/article/10.3390/agronomy11081570/s1, Table S1: Keywords to search references for meta-analysis, Table S2: References used in the meta-analysis, Table S3: The number of reported accessions in each country used in the meta-analysis, Table S4: The data list for the meta-analysis of DW, Table S5: The data list for the meta-analysis of K/S gravimetric ratio, Table S6: The data list for the meta-analysis of lipid content, Table S7: The data list for the meta-analysis of PE content, Table S8: The data list for the meta-analysis of IV, Table S9: The reported regional differences in the seed traits in the meta-analysis, Table S10: Statistical summary on the seed traits of indigenous Jatropha accessions in Botswana, Table S11: Eigenvalues computed by the Horn’s parallel analysis, Table S12: PC scores of Jatropha indigenous accessions in Botswana.

Author Contributions

Conceptualization, S.T. and K.A.; methodology, S.T. and K.A.; resources, G.C., Y.I., T.K. and C.M.; chemical analyses, S.T.; formal analysis and visualization, S.T.; validation and interpretation, S.T., G.C., C.M., H.T. and K.A.; writing—original draft preparation, S.T.; writing—review and editing, S.T., G.C., C.M., H.T. and K.A. All authors have read and agreed to the published version of the manuscript.

Funding

This research was funded by the SATREPS program of the Japan Science and Technology Agency and the Japan International Cooperation Agency, the Joint Research Program and the Project Marginal Region Agriculture, the Arid Land Research Center, Tottori University, the IPDRE Program, Tottori University, and the Government of Botswana.

Data Availability Statement

Data is contained within the article.

Acknowledgments

We are grateful to Tomohiro Bito for his technical supports on fatty acids analyses, and Minoru Morimoto and Hiroyuki Oka for their supports on PE analyses.

Conflicts of Interest

The authors declare no conflict of interest.

References

  1. Achten, W.M.J.; Verchot, L.; Franken, Y.J.; Mathijs, E.; Singh, V.P.; Aerts, R.; Muys, B. Jatropha bio-diesel production and use. Biomass Bioenergy 2008, 32, 1063–1084. [Google Scholar] [CrossRef] [Green Version]
  2. Montes, J.M.; Melchinger, A.E. Domestication and breeding of Jatropha curcas L. Trends Plant Sci. 2016, 21, 1045–1057. [Google Scholar] [CrossRef] [PubMed]
  3. Kheira, A.A.A.; Atta, N.M.M. Response of Jatropha curcas L. to water deficits: Yield, water use efficiency, and oilseed characteristics. Biomass Bioenergy 2009, 33, 1343–1350. [Google Scholar] [CrossRef]
  4. Gasparatos, A.; von Maltitz, G.P.; Johnson, F.X.; Lee, L.; Mathai, M.; de Oliveira, J.A.P.; Willis, K.J. Biofuels in Sub-Sahara Africa: Drivers, impacts and priority policy areas. Renew. Sustain. Energy Rev. 2015, 45, 879–901. [Google Scholar] [CrossRef]
  5. Quinn, L.D.; Straker, K.C.; Guo, J.; Kim, S.; Thapa, S.; Kling, G.; Lee, D.K.; Voigt, T.B. Stress-tolerant feedstocks for sustainable bioenergy production on marginal land. BioEnergy Res. 2015, 8, 1081–1100. [Google Scholar] [CrossRef] [Green Version]
  6. Gonzáles, N.F.C. International experiences with the cultivation of Jatropha curcas for biodiesel production. Energy 2016, 112, 1245–1258. [Google Scholar] [CrossRef]
  7. Ramos, M.J.; Fernández, C.M.; Casas, A.; Rodríguez, L.; Pérez, Á. Influence of fatty acid composition of raw materials on biodiesel properties. Bioresour. Technol. 2009, 100, 261–268. [Google Scholar] [CrossRef] [PubMed]
  8. Devappa, R.K.; Makkar, H.P.S.; Becker, K. Jatropha toxicity—A review. J. Toxicol. Environ. Health Part B 2010, 13, 476–507. [Google Scholar] [CrossRef]
  9. Goel, G.; Makkar, H.P.S.; Francis, G.; Becker, K. Phorbol esters: Structure, biological activity, and toxicity in animals. Int. J. Toxicol. 2007, 26, 279–288. [Google Scholar] [CrossRef]
  10. Martin, M.; Bohlinger, B.; Senger, E.; Dongmeza, E.; Andrianirina, Z.T.; Montes, J.M. Genetic improvement of edible and non-edible Jatropha for marginal environments in Sub-Saharan Africa. In Jatropha, Challenges for a New Energy Crop: Volume 3: A Sustainable Multipurpose Crop; Mulpuri, S., Carels, N., Bahadur, B., Eds.; Springer: Singapore, 2019; pp. 3–27. [Google Scholar] [CrossRef]
  11. Environment, Computer, and Geophysical Application. The Feasibility Study for the Production and Use of Biofuels in Botswana; Ministry of Minerals, Energy and Water Affairs: Gaborone, Botswana, 2007. [Google Scholar]
  12. Kgathi, D.L.; Mmopelwa, G.; Chanda, R.; Kashe, K.; Murray-Hudson, M. A review of the sustainability of Jatropha cultivation projects for biodiesel production in Southern Africa: Implications for energy policy in Botswana. Agric. Ecosyst. Environ. 2017, 246, 314–324. [Google Scholar] [CrossRef]
  13. Inafuku-Teramoto, S.; Mazereku, C.; Coetzee, T.; Gwafila, C.; Lekgari, L.A.; Ketumile, D.; Fukuzawa, Y.; Yabuta, S.; Masukujane, M.; George, D.G.M.; et al. Production approaches to establish effective cultivation methods for Jatropha (Jatropha curcas L.) under cold and Semi-arid climate conditions. Int. J. Agron. Plant Prod. 2013, 4, 3804–3815. [Google Scholar]
  14. Ishimoto, Y.; Kgokong, S.; Yabuta, S.; Tominaga, J.; Coetzee, T.; Konaka, T.; Mazereku, C.; Kawamitsu, Y.; Akashi, K. Flowering pattern of biodiesel plant Jatropha in frost- and drought-prone regions of Botswana. Int. J. Green Energy 2017, 14, 908–915. [Google Scholar] [CrossRef]
  15. Masukujane, M.; Coetzee, T.; Ngwanathebe, R.B.; Ishimoto, Y.; Akashi, K. Diversity and seasonal variation of insect pests of Jatropha in Gaborone, Botswana. Int. J. Trop. Insect Sci. 2018, 38, 294–298. [Google Scholar] [CrossRef]
  16. Moseki, O.; Murray-Hudson, M.; Kashe, K. Crop water and irrigation requirements of Jatropha curcas L. in Semi-arid conditions of Botswana: Applying the CROPWAT model. Agric. Water Manag. 2019, 225, 105754. [Google Scholar] [CrossRef]
  17. Tominaga, J.; Inafuku, S.; Coetzee, T.; Kawamitsu, Y. Diurnal regulation of photosynthesis in Jatropha curcas under drought during summer in a Semi-arid region. Biomass Bioenergy 2014, 67, 279–287. [Google Scholar] [CrossRef] [Green Version]
  18. Vurayai, R.; Nkoane, B.; Moseki, B.; Chaturvedi, P. Phytoremediation potential of Jatropha curcas and Pennisetum clandestinum grew in polluted soil with and without coal fly ash: A case of BCL Cu/Ni mine, Selibe-Phikwe, Botswana. J. Biodivers. Environ. Sci. 2017, 10, 193–206. [Google Scholar]
  19. Konaka, T.; Ishimoto, Y.; Yamada, M.; Moseki, B.; Tsujimoto, H.; Mazereku, C.; Akashi, K. Tolerance evaluation of Jatropha curcas and Acacia burkei to acidic and copper/nickel-contaminated soil. J. Lucknow 2019, 40, 1109–1114. [Google Scholar] [CrossRef]
  20. Ogura, T.; Date, Y.; Masukujane, M.; Coetzee, T.; Akashi, K.; Kikuchi, J. Improvement of physical, chemical, and biological properties of Aridisol from Botswana by the incorporation of torrefied biomass. Sci. Rep. 2016, 6, 28011. [Google Scholar] [CrossRef] [Green Version]
  21. Kethobile, E.; Ketlogetswe, C.; Gandure, J. Characterisation of the non-oil Jatropha biomass material for use as a source of solid fuel. Biomass Convers. Biorefinery 2020, 10, 1251–1267. [Google Scholar] [CrossRef]
  22. Jonas, M.; Ketlogetswe, C.; Gandure, J. Variation of Jatropha curcas seed oil content and fatty acid composition with fruit maturity stage. Heliyon 2020, 6, e03285. [Google Scholar] [CrossRef]
  23. Ishimoto, Y.; Yabuta, S.; Kgokong, S.; Motsepe, M.; Tominaga, J.; Teramoto, S.; Konaka, T.; Mmopelwa, G.; Kawamitsu, Y.; Akashi, K.; et al. Environmental evaluation with greenhouse gas emissions and absorption based on life cycle assessment for a Jatropha cultivation system in frost- and drought-prone regions of Botswana. Biomass Bioenergy 2018, 110, 33–40. [Google Scholar] [CrossRef]
  24. Kashe, K.; Kgathi, D.L.; Murray-Hudson, M.; Mfundisi, K.B. Assessment of benefits and risks of growing Jatropha (Jatropha curcas) as a biofuel crop in sub-Saharan Africa: A contribution to agronomic and socio-economic policies. J. For. Res. 2018, 29, 1–12. [Google Scholar] [CrossRef]
  25. Gwafila, C.; Batlang, U.; Ngwako, S. Morphological and molecular characterization of Jatropha curcas L. germplasm in Botswana. Afr. J. Biotechnol. 2019, 18, 726–734. [Google Scholar] [CrossRef]
  26. GADM Home Page, Version 3.6. Available online: https://gadm.org (accessed on 1 May 2021).
  27. DIVA-GIS Home Page, Version 7.5. Available online: https://www.diva-gis.org (accessed on 1 May 2021).
  28. Danko, D.M. The digital chart of the world project. Photogramm. Eng. Remote Sens. 1992, 58, 1125–1128. [Google Scholar]
  29. Farr, T.G.; Rosen, P.A.; Caro, E.; Crippen, R.; Duren, R.; Hensley, S.; Kobrick, M.; Paller, M.; Rodriguez, E.; Roth, L.; et al. The shuttle radar topography mission. Rev. Geophys. 2007, 45, 25–36. [Google Scholar] [CrossRef] [Green Version]
  30. Fick, S.E.; Hijmans, R.J. WorldClim 2: New 1-km spatial resolution climate surfaces for global land areas. Int. J. Climatol. 2017, 37, 4302–4315. [Google Scholar] [CrossRef]
  31. WorldClim Home Page, Version 2.1. Available online: https://www.worldclim.org (accessed on 1 May 2021).
  32. QGIS Home Page, Version 3.12. Available online: https://qgis.org (accessed on 1 May 2021).
  33. Osorio, L.R.M.; Salvador, A.F.T.; Jongschaap, R.E.E.; Perez, C.A.A.; Sandoval, J.E.B.; Trindade, L.M.; Visser, R.G.F.; Van Loo, E.N. High level of molecular and phenotypic biodiversity in jatropha curcas from central America compared to Africa, Asia, and South America. BMC Plant Biol. 2014, 14, 77. [Google Scholar] [CrossRef] [Green Version]
  34. American Oil Chemists’ Society. Recommended practice Cd 1c-85. In Official Methods and Recommended Practices of the AOCS; American Oil Chemists’ Society: Champaign, IL, USA, 1998. [Google Scholar]
  35. He, W.; King, A.J.; Khan, M.A.; Cuevas, J.A.; Ramiaramanana, D.; Graham, I.A. Analysis of seed phorbol-ester and curcumin content together with genetic diversity in multiple provenances of jatropha curcas L. from Madagascar and Mexico. Plant Physiol. Biochem. 2011, 49, 1183–1190. [Google Scholar] [CrossRef] [PubMed]
  36. Baldini, M.; Ferfuia, C.; Bortolomeazzi, R.; Verardo, G.; Pascali, J.; Piasentier, E.; Franceschi, L. Determination of phorbol esters in seeds and leaves of Jatropha curcas and animal tissue by high-performance liquid chromatography-tandem mass spectrometry. Ind. Crop. Prod. 2014, 59, 268–276. [Google Scholar] [CrossRef]
  37. Faria-Machado, A.F.; Licurgo, F.M.S.; Pires, J.M.F.; Campos, R.d.S.; Wilhelm, A.E.; De Souza, M.d.L.M.; Antoniassi, R. Method validation for analysis of phorbol esters from jatropha curcas. Ind. Crop. Prod. 2019, 140, 111627. [Google Scholar] [CrossRef]
  38. Vogg, G.; Achatz, S.; Kettrup, A.; Sandermann, H. Fast, sensitive and selective liquid chromatographic-tandem mass spectrometric determination of tumor-promoting diterpene esters. J. Chromatogr. A 1999, 855, 563–573. [Google Scholar] [CrossRef] [Green Version]
  39. Google Scholar Home Page. Available online: https://scholar.google.com (accessed on 1 May 2021).
  40. R Core Team. R: A Language and Environment for Statistical Computing; R Foundation for Statistical Computing: Vienna, Austria, 2020. [Google Scholar]
  41. Freedman, D.; Diaconis, P. On the histogram as a density estimator: L2 theory. Z. Für Wahrscheinlichkeitstheorie Verwandte Geb. 1981, 57, 453–476. [Google Scholar] [CrossRef] [Green Version]
  42. Gu, Z.; Eils, R.; Schlesner, M. Complex heatmaps reveal patterns and correlations in multidimensional genomic data. Bioinformatics 2016, 32, 2847–2849. [Google Scholar] [CrossRef] [PubMed] [Green Version]
  43. Wickham, H. Ggplot2: Elegant Graphics for Data Analysis; Version 3.3.2; Springer: New York, NY, USA, 2016; ISBN 978-3-319-24277-4. [Google Scholar]
  44. Schloerke, B.; Cook, D.; Larmarange, J.; Briatte, F.; Marbach, M.; Thoen, E.; Elberg, A.; Toomet, O.; Crowley, J.; Hofmann, H.; et al. GGally: Extension to Ggplot2, Version 1.5.0. Available online: https://github.com/ggobi/ggally (accessed on 1 May 2021).
  45. Horn, J.L. A rationale and test for the number of factors in factor analysis. Psychometrika 1965, 30, 179–185. [Google Scholar] [CrossRef] [PubMed]
  46. Hayton, J.C.; Allen, D.G.; Scarpello, V. Factor retention decisions in exploratory factor analysis: A tutorial on parallel analysis. Organ. Res. Methods 2004, 7, 191–205. [Google Scholar] [CrossRef]
  47. Revelle, W. psych: Procedures for Personality and Psychological Research, Version 2.1.3. Available online: https://CRAN.R-project.org/package=psych (accessed on 1 May 2021).
  48. Fox, J.; Weisberg, S. An {R} Companion to Applied Regression, Third Edition. Available online: https://socialsciences.mcmaster.ca/jfox/Books/Companion/ (accessed on 1 May 2021).
  49. Brittaine, R.; Lutaladio, N. Jatropha: A Smallholder Bioenergy Crop: The Potential for Pro-Poor Development; FAO: Rome, Italy, 2010; Volume 8, ISBN 978-92-5-106438-2. [Google Scholar]
  50. Garg, K.K.; Karlberg, L.; Wani, S.P.; Berndes, G. Jatropha production on wastelands in India: Opportunities and trade-offs for soil and water management at the watershed scale. Biofuels Bioprod. Biorefining 2011, 5, 410–430. [Google Scholar] [CrossRef] [Green Version]
  51. Maes, W.H.; Trabucco, A.; Achten, W.M.J.; Muys, B. Climatic growing conditions of Jatropha curcas L. Biomass Bioenergy 2009, 33, 1481–1485. [Google Scholar] [CrossRef]
  52. Makkar, H.P.S.; Becker, K.; Sporer, F.; Wink, M. Studies on nutritive potential and toxic constituents of different provenances of Jatropha curcas. J. Agric. Food Chem. 1997, 45, 3152–3157. [Google Scholar] [CrossRef]
  53. Makkar, H.P.S.; Aderibigbe, A.O.; Becker, K. Comparative evaluation of non-toxic and toxic varieties of Jatropha curcas for chemical composition, digestibility, protein degradability, and toxic factors. Food Chem. 1998, 62, 207–215. [Google Scholar] [CrossRef]
  54. Basha, S.D.; Francis, G.; Makkar, H.P.S.; Becker, K.; Sujatha, M. A comparative study of biochemical traits and molecular markers for assessment of genetic relationships between Jatropha curcas L. germplasm from different countries. Plant Sci. 2009, 176, 812–823. [Google Scholar] [CrossRef]
  55. Herrera, J.M.; Ayala, A.L.M.; Makkar, H.; Francis, G.; Becker, K. Agroclimatic conditions, chemical and nutritional characterization of different provenances of Jatropha curcas L. from Mexico. Eur. J. Sci. Res. 2010, 39, 396–407. [Google Scholar]
  56. Mulpuri, S.; Muddanuru, T.; Francis, G. Start codon targeted (SCoT) polymorphism in toxic and non-toxic accessions of Jatropha curcas L. and development of a codominant SCAR marker. Plant Sci. Int. J. Exp. Plant Biol. 2013, 207, 117–127. [Google Scholar] [CrossRef]
  57. Marínez, A.M.; Brito, R.F.; Ayala, A.M.; Herrera, J.M.; Vargas, G.P.; Dávila, J.G. Chemical and physical characterizaton of Jatropha curcas L. seed from the Northern Sierra of Puebla, México. J. Plant Sci. 2018, 6, 25. [Google Scholar] [CrossRef]
  58. EN 14214:2008. Automotive Fuels. Fatty Acid Methyl Esters (FAME) for Diesel Engines. Requirements and Test Methods; European Standards: Pilsen, Czech Republic, 2019. [Google Scholar]
  59. Wilson, R.F. Seed composition. In Soybeans: Improvement, Production, and Uses; Shibles, R.M., Harper, J.E., Wilson, R.F., Shoemaker, R.C., Eds.; Wiley: Hoboken, NJ, USA, 2004; pp. 621–677. [Google Scholar] [CrossRef]
  60. Tsakraklides, V.; Kamineni, A.; Consiglio, A.L.; MacEwen, K.; Friedlander, J.; Blitzblau, H.G.; Hamilton, M.A.; Crabtree, D.V.; Su, A.; Afshar, J.; et al. High-oleate yeast oil without polyunsaturated fatty acids. Biotechnol. Biofuels 2018, 11, 131. [Google Scholar] [CrossRef] [PubMed] [Green Version]
  61. Diédhiou, I.; Sambou, Y.S.; Sagna, M.D.; Diédhiou, P.M. Genetic parameters for fruits, seeds and oil content traits of Jatropha curcas L. in a Semi-arid region of Senegal. J. Exp. Agric. Int. 2016, 11, 1–11. [Google Scholar] [CrossRef]
  62. Chakrabarty, S.; Islam, A.K.M.A.; Sultana, N.; Chakraborty, P. Genetic diversity of Jatropha curcas L. genotypes: A potential biofuel crop in Bangladesh. Biofuels 2019. [Google Scholar] [CrossRef]
  63. McVetty, P.B.E.; Scarth, R. Breeding for improved oil quality in brassica oilseed species. J. Crop Prod. 2002, 5, 345–369. [Google Scholar] [CrossRef]
  64. Montes, J.M.; Technow, F.; Bohlinger, B.; Becker, K. Seed quality diversity, trait associations and grouping of accessions in Jatropha curcas L. Ind. Crops Prod. 2013, 51, 178–185. [Google Scholar] [CrossRef]
  65. Yeilaghi, H.; Arzani, A.; Ghaderian, M.; Fotovat, R.; Feizi, M.; Pourdad, S.S. Effect of salinity on seed oil content and fatty acid composition of safflower (Carthamus tinctorius L.) genotypes. Food Chem. 2012, 130, 618–625. [Google Scholar] [CrossRef]
  66. Browse, J.; Somerville, C. Glycerolipid synthesis: Biochemistry and regulation. Annu. Rev. Plant Physiol. Plant Mol. Biol. 1991, 42, 467–506. [Google Scholar] [CrossRef]
  67. Flagella, Z.; Giuliani, M.M.; Rotunno, T.; Di Caterina, R.; De Caro, A. Effect of saline water on oil yield and quality of a high oleic Sunflower (Helianthus annuus L.) hybrid. Eur. J. Agron. 2004, 21, 267–272. [Google Scholar] [CrossRef]
  68. Liu, X.; Li, L.; Li, W.; Lu, D.; Chen, F.; Li, J. Quantitative determination of phorbol ester derivatives in Chinese Jatropha curcas seeds by high-performance liquid chromatography/mass spectrometry. Ind. Crop. Prod. 2013, 47, 29–32. [Google Scholar] [CrossRef]
  69. King, A.J.; Montes, L.R.; Clarke, J.G.; Affleck, J.; Li, Y.; Witsenboer, H.; Van Der Vossen, E.; Linde, P.; Van Der Tripathi, Y.; Tavares, E.; et al. Linkage mapping in the oilseed crop Jatropha curcas L. Reveals a locus controlling the biosynthesis of phorbol esters which cause seed toxicity. Plant Biotechnol. J. 2013, 11, 986–996. [Google Scholar] [CrossRef] [PubMed] [Green Version]
  70. King, A.J.; Brown, G.D.; Gilday, A.D.; Larson, T.R.; Graham, I.A. Production of bioactive diterpenoids in the Euphorbiaceae depends on evolutionarily conserved gene clusters. Plant Cell 2014, 26, 3286–3298. [Google Scholar] [CrossRef] [PubMed] [Green Version]
  71. Nakano, Y.; Ohtani, M.; Polsri, W.; Usami, T.; Sambongi, K.; Demura, T. Characterization of the carbine synthase homolog from Jatropha (Jatropha Curcas L.). Plant Biotechnol. 2012, 29, 185–189. [Google Scholar] [CrossRef] [Green Version]
  72. Hirakawa, H.; Tsuchimoto, S.; Sakai, H.; Nakayama, S.; Fujishiro, T.; Kishida, Y.; Kohara, M.; Watanabe, A.; Yamada, M.; Aizu, T.; et al. Upgraded genomic information of Jatropha Curcas L. Plant Biotechnol. 2012, 29, 123–130. [Google Scholar] [CrossRef] [Green Version]
  73. Sato, S.; Hirakawa, H.; Isobe, S.; Fukai, E.; Watanabe, A.; Kato, M.; Kawashima, K.; Minami, C.; Muraki, A.; Nakazaki, N.; et al. Sequence analysis of the genome of an oil-bearing tree, Jatropha curcas L. DNA Res. 2011, 18, 65–76. [Google Scholar] [CrossRef]
  74. De Almeida, N.P.; Neto, D.F.M.; Carneiro, G.R.A.; de Farias, A.R.B.; Domont, G.B.; de Assis de Paiva Campos, F.; Nogueira, F.C.S. Monitoring carbene synthase in Jatropha curcas tissues using targeted proteomics. Plant Methods 2021, 17, 15. [Google Scholar] [CrossRef] [PubMed]
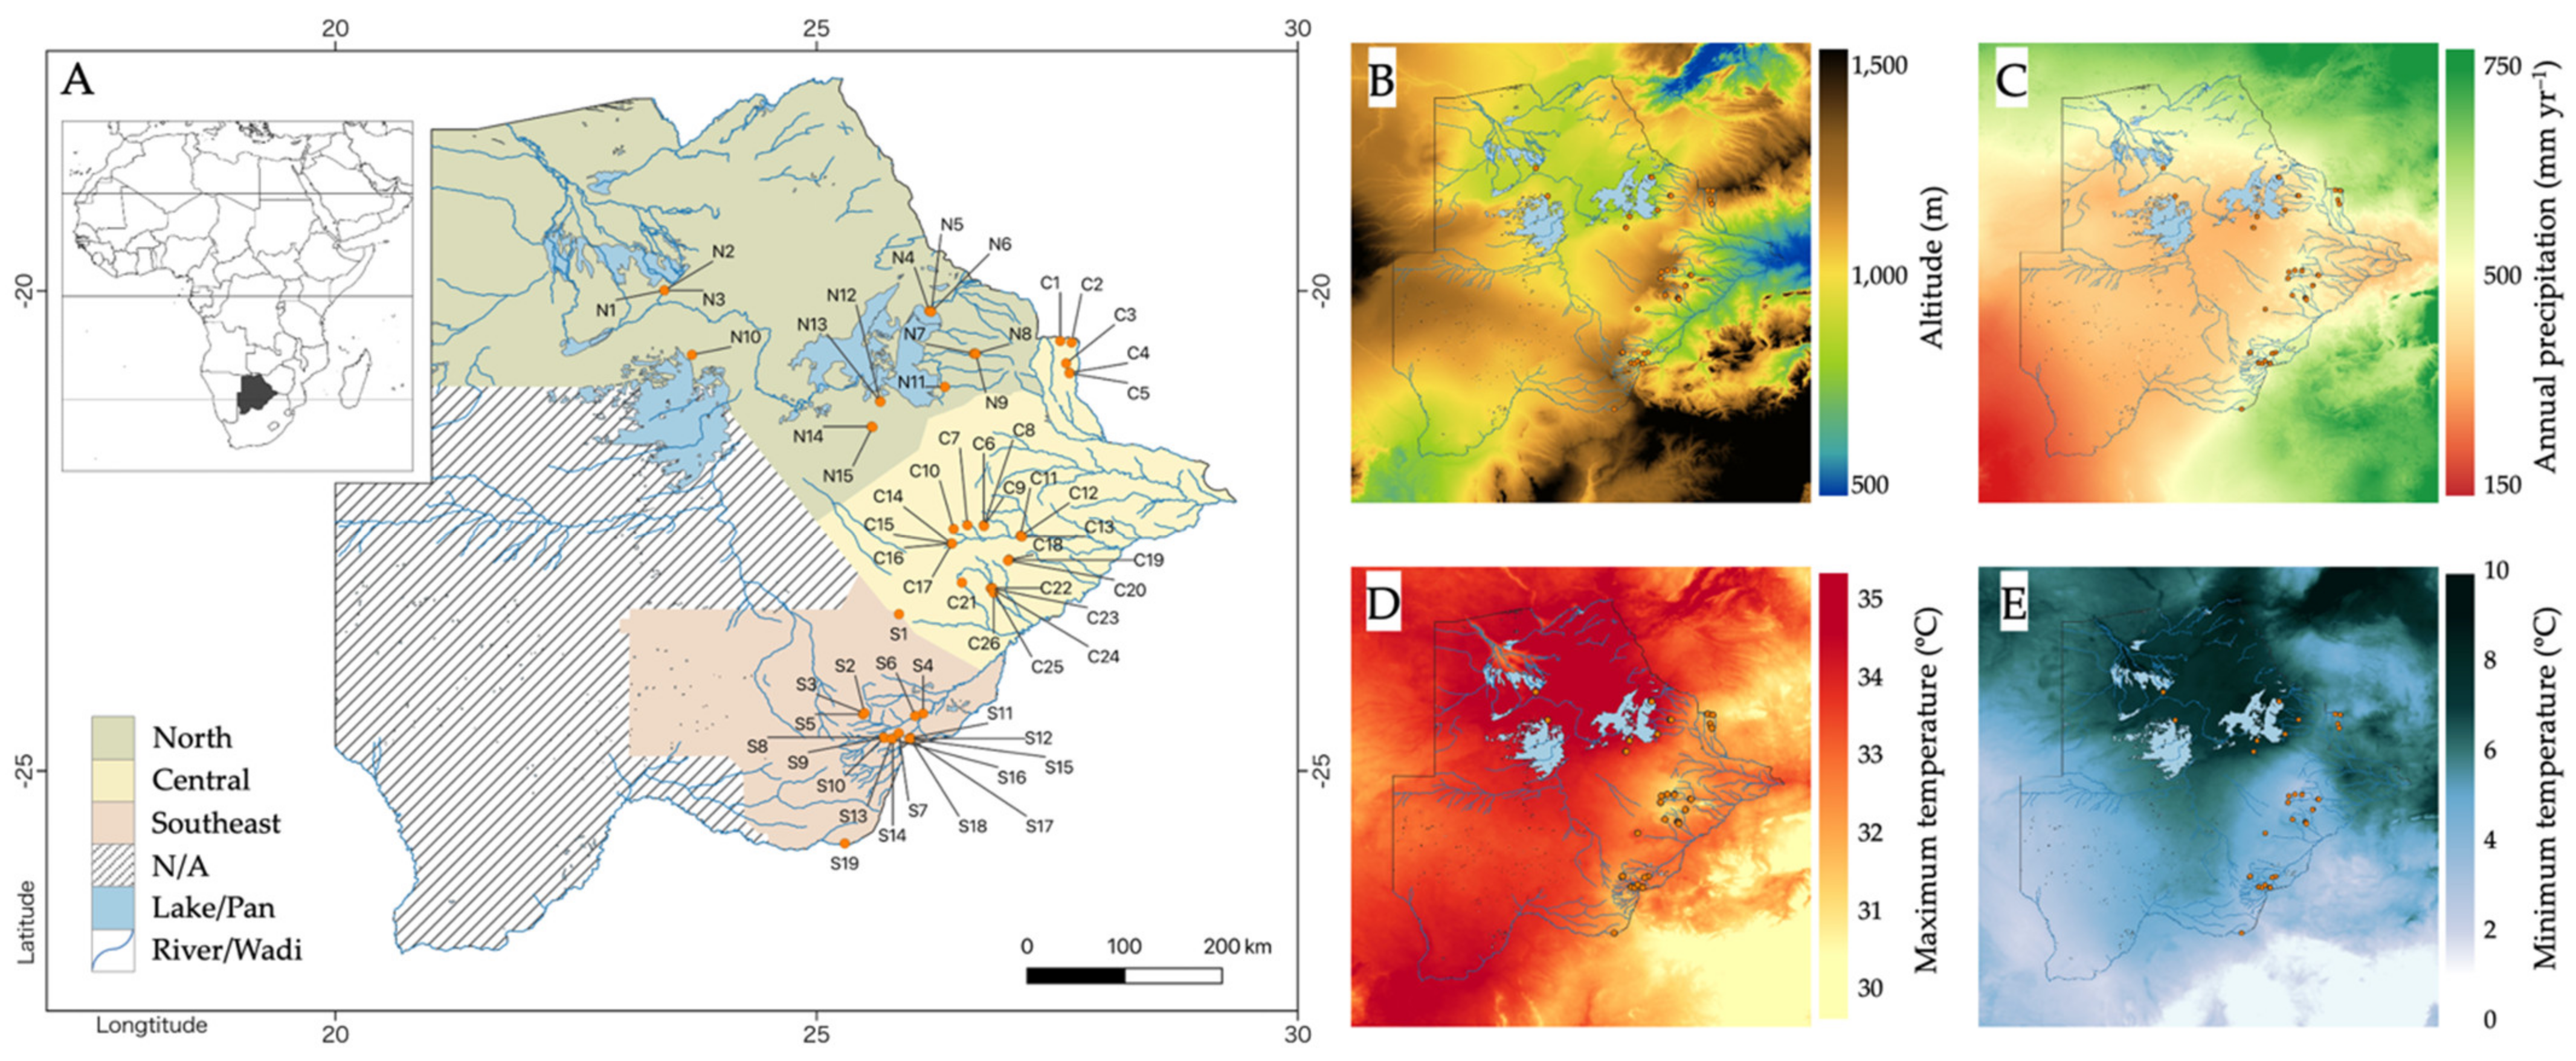
Figure 1. Geographic distribution of Jatropha accessions and environmental factors in Botswana. (A) The collection sites of Jatropha accessions analyzed in this study are indicated by orange dots, with their accession IDs, on a map of Botswana. Color legend for the three geographical areas (North, Central, and Southeast) adopted in this study is indicated in the bottom left corner. N.A. represents a region where Jatropha trees were not available. Inset in the top left corner denotes the location of Botswana on the African continent. (B) The altitude, (C) annual precipitation, (D) maximum temperature of the hottest month, and (E) minimum temperature of the coldest month in Botswana.
Agronomy 11 01570 g001
Figure 2. Frequency distribution histograms of seed physicochemical traits for the Botswanan accessions. The (A) dry seed weight (DW), (B) kernel/seed gravimetric ratio (K/S), (C) lipid, (D) phorbol ester (PE), (E) palmitic acid (C16:0), (F) stearic acid (C18:0), (G) oleic acid (C18:1), and (H) linoleic acid (C18:2) content, and (I) iodine values (IV) are shown. In each panel, the dark blue vertical bars corresponding to the left vertical axis scale and orange polygonal curves corresponding to the right vertical axis scale represent the frequency and cumulative relative frequency for the 60 Botswanan accessions, respectively. Their bin widths are compiled in Table S10. The values for each accession are the mean of three independent seeds (the one with the median DW and the two with the closest values on either side). Means of GA and JK accessions are shown as red and blue triangles, respectively, below the horizontal axes. The reported ranges in other regions of the world, collected in the meta-analysis, are indicated by horizontal bars below the x-axis, with their color codes and mean/median symbols shown at the top right corner. Detailed data on worldwide Jatropha seed traits for (AD), and (I) are compiled in Supplementary Tables S4–S9. In (EH), the minimum, maximum, mean, and SD data on the fatty acid compositions in each continent are adapted from published data in Osorio et al. (2014). N/A, data not available.
Agronomy 11 01570 g002
Figure 3. Violin/box plot analysis of the geographical diversity of seed chemical compositions among Botswanan Jatropha accessions. The three accession groups (North (N), Central (C), and Southeast (S)) defined in Figure 1 were used for the analysis. The estimated distributions of the populations are displayed as colored violin plots for the (A) DW, (B) K/S gravimetric ratio, (C) total lipid and (D) PE content, (E) IV, and the (F) C16:0, (G) palmitoleic acid (C16:1), (H) C18:0, (I) C18:1, (J) C18:2, and (K) α-linolenic acid (C18:3) content. The notched box-and-whisker plots represent the median, interquartile range, and variability, and their outliers are shown as crosses. The significance of the difference between groups was calculated using the Wilcoxon test, and their p values are provided above the brackets. Significant differences with p values below 0.10, 0.05, and 0.01 are expressed by *, **, and ***, respectively.
Agronomy 11 01570 g003
Figure 4. Variations of seed chemical traits in Botswanan Jatropha accessions. (A) A concentric circular plot showing the content of fatty acids and PE in each accession. The accession IDs are placed outside the radius, and the average content (n = 3) is normalized and shown as a line plot in each track, where the inner and outer perimeters represent the minimum and maximum values, respectively, among all the accessions. Values for the fatty acid and PE components are shown in different colors, as depicted in the legend in the top right corner. The circles around the points illustrate the SD/mean ratios in each accession, which are categorized into four groups according to their relative magnitudes (>30%, 20–30%, 10–20%, and <10%), and expressed as differently sized circles, as depicted in the legend in the bottom right corner. (B) The fatty acid compositions (wt%) of representative Jatropha accessions. The profiles of three independent seeds for accessions N8, N13, N14, C15, C23, S15, and the mean of all accessions are shown. The color legend for each fatty acid is shown at the bottom of the panel. (C) PE content of representative accessions. The accessions with the lowest (C15) and highest (S9) PE content are shown, with accession JK and the mean of all accessions for comparison. The values are the mean ± SD (n = 3).
Agronomy 11 01570 g004
Figure 5. A clustered heat map of seed chemical components among Botswanan accessions. Left vertical and bottom horizontal axes show chemical traits and accession IDs, respectively. The plotted colors represent metabolite levels and are based on the log2-transformed ratio of the measured metabolite concentration to the mean concentration of the metabolite across all accessions, as shown in the legend at the top right corner. Data for each metabolite is mean-centered, such that the average log2 across all samples is set as zero. The dendrograms for the accessions and chemical traits are shown at the top horizontal and right vertical axes, respectively. Half the height of the dendrogram was used as the threshold level for both clade and trait categorization, shown by the broken lines. The categorized accession clades and chemical trait groups are indicated using color codes along the axes.
Agronomy 11 01570 g005
Figure 6. Matrix of scatter plots and Spearman’s rank correlations for seed chemical components among the Botswanan Jatropha accessions. The chemical trait groups (AE) conform with Figure 5. Scatter plots are presented in the bottom left half, where each accession is plotted as a black point. The red straight lines and surrounding pale red bands show the linear regression lines and their 95% confidence bands, respectively. The Spearman’s rank correlation coefficients are presented in the upper right half. The colors of the boxes represent positive or negative correlations according to a color scale on the top right vertical axis. The significance of the differences was calculated using the Wilcoxon test, and p values below 0.10, 0.05, and 0.01 are expressed as *, **, and ***, respectively.
Agronomy 11 01570 g006
Figure 7. PCA biplot illustrating the chemical trait diversity of Botswanan Jatropha accessions. Accessions from the North (N), Central (C), and Southeast (S) geographical groups are shown as green, yellow, and brown dots, respectively. The error ellipses of the same color show the probability range (p > 0.9) of the multivariate normal distribution for each geographical group. Vectors in gray indicate the direction and strength of the variable effects.
Agronomy 11 01570 g007
Publisher’s Note: MDPI stays neutral with regard to jurisdictional claims in published maps and institutional affiliations.