Article

Efficacy of Fungicides against Fusarium Head Blight Depends on the Timing Relative to Infection Rather than on Wheat Growth Stage

by
Elisa González-Domínguez
1,
Pierluigi Meriggi
1,
Matteo Ruggeri
1 and
Vittorio Rossi
2,*
1
Horta srl, 29122 Piacenza, Italy
2
Department of Sustainable Crop Production, Università Cattolica del Sacro Cuore, 29122 Piacenza, Italy
*
Author to whom correspondence should be addressed.
Agronomy 2021, 11(8), 1549; https://doi.org/10.3390/agronomy11081549
Submission received: 8 July 2021 / Revised: 29 July 2021 / Accepted: 30 July 2021 / Published: 1 August 2021
(This article belongs to the Special Issue Strategies for the Control of Fusarium Head Blight in Cereals)

Abstract

:
Fungicides used to control Fusarium head blight (FHB) are commonly applied at the wheat growth stage considered to be most susceptible, i.e., anthesis. We compared the efficacy of the most commonly used fungicide groups that were applied following two strategies: (i) at pre-defined growth stages, from the first half of heading to the end of flowering (experiment 1, in 2013 to 2015), or (ii) based on timing of infection by F. graminearum, specifically at 10, 7, 4, or 1 day before, or 3 or 5 days after artificial inoculation of the fungus (experiment 2, in 2017 and 2018). Fungicide efficacy was evaluated in terms of FHB incidence, FHB severity, and DON contamination by using generalised mixed models. In experiment 1, all fungicide groups reduced FHB severity and DON but only by <50% compared to an untreated control, with no differences among fungicides or growth stages at time of application. In experiment 2, the efficacy of fungicides was higher for applications at 1 or 4 days before inoculation than at 7 or 10 days before or 3 or 5 days after inoculation, with differences among fungicide groups. Based on our results, the timing of fungicide application for FHB control should be based on the time of F. graminearum infection rather than on wheat phenology.

1. Introduction

Fusarium head blight (FHB) is an economically important disease of wheat, barley, and other small-grain cereals, and has become increasingly important worldwide over the last 30 years [1,2,3]. FHB is caused by a complex of Fusarium spp., among which F. graminearum sensu lato (teleomorph Gibberella zeae) is predominant in European and American wheat fields; F. culmorum, F. avenaceum, F. sporotrichioides, F. langsethiae, and Microdochium nivale, are also frequently isolated from infected grain [4,5,6,7].
FHB epidemics result in yield losses due to a reduced number of grains per spike and reduced grain weight because of shrivelling [3,8]. Fusarium species also produce mycotoxins (trichothecenes, zearalenone, moniliformin, fumonisins, and enniatins) that accumulate in grain and are harmful to both humans and other animals. Deoxynivalenol (DON) is the mycotoxin most frequently associated with FHB, and maximum limits for DON contamination in grain and food exist in several countries [2,4,9].
Fusarium graminearum survives in host crop residues, and the inoculum consists of both air-borne ascospores and splash-borne conidia [10,11,12]. Production and dispersal of this inoculum to spikes have been associated with warm, rainy, and moist spring conditions [3,11,12,13,14]. Infection of spikes can occur from flowering to hard dough, even though anthesis is considered the most susceptible growth stage of wheat [3,15,16,17].
Considerable progress has been made over the last decades in FHB control, which is mainly based on the integration of multiple interventions [18,19] that include crop rotation with non-host plants, management of crop residue, use of resistant cultivars (resistant to infection and/or to DON accumulation), and fungicide applications. Fungicides are still essential for the control of FHB; their effectiveness in reducing the disease and mycotoxin contamination is, however, highly variable. This variability may be related to both the inherent efficacy of the fungicides and to the timing of their application. Triazole and strobirulin fungicides are demethylation inhibitor (DMI) and quinone outside inhibitor (QoI), respectively, and are widely used to control FHB and other wheat diseases [10]; their efficacy has been demonstrated in field trials, sometimes with contradictory results [10,18,20,21,22]. Concerning the timing of application, fungicide treatments are mostly recommended between wheat heading and anthesis [19], with inconsistent results [10,18,23]. For instance, D’Angelo et al. [23] observed better control when fungicides where applied 2 days post anthesis (DPA) than at anthesis or 4, 5, or 6 DPA. Bolanos-Carriel et al. [10] observed the same level of control when fungicides where applied at anthesis or 6 DPA, and lower control when applied at 1 or 2 DPA. In a meta-analysis of 29 trials, Paul et al. [18] reported similar efficacies of triazoles when applied 3, 5, or 7 DPA.
Inconsistent FHB control provided by fungicides applied at different growth stages of wheat may be related to: (i) the degree and duration of pre- and post-infection activity of the fungicide used, and (ii) the time of fungal infection relative to the time of fungicide application. For instance, a fungicide that has no post-infection activity but high, 7-day long pre-infection activity that is applied at full anthesis may result in efficient FHB control if infection by F. graminearum occurs 5 days before full anthesis or no FHB control if infection by F. graminearum occurs 2 days after full anthesis.
In the current study, we compared the efficacy of fungicides belonging to different chemical groups (DMI, demethylation inhibitor; QoI, quinone outside inhibitor; MBC, methyl benzimidazole carbamate; and SDHI, succinate-dehydrogenase inhibitor) when applied at (i) four fixed wheat growth stages, from half of heading to end of flowering, and at (ii) 10, 7, 4, or 1 day before, or 3 or 5 days after artificial inoculation with F. graminearum.

2. Materials and Methods

2.1. Experiments

Two field experiments (EXP1 and EXP2) were conducted at the experimental farm of Horta (https://www.horta-srl.it/en/ca-bosco/; accessed on 31 July 2021) at Ravenna (North Italy; 44°28′57.3″ N 12°10′38.3″ E). The main characteristics of the two experiments are listed in Table 1. The commercial fungicides selected are labelled against FHB in Italy and are commonly used in wheat fields to control fungal aerial diseases.
EXP1 was conducted in 2013, 2014, and 2015 on durum wheat cv. Normanno, which is highly susceptible to FHB [25]. Fungicides were applied once at four wheat growth stages (timings): (i) half of heading, half of heads emerged (growth stage GS55 of Meier [24]); (ii) end of heading (GS59); (iii) beginning of flowering, first anthers visible (GS61); and (iv) end of flowering, all spikelets have completed flowering but some dehydrated anthers may remain (GS69).
In EXP1, seven commercial fungicides or fungicide mixtures were tested in 2013 and 2014, and four were tested in 2015. An untreated control was also assessed (Table 1 and Table 2). Timings and fungicides were arranged in a split-plot design, with four replicates. A plot (a fungicide applied at one growth stage) was 1.5 × 4.0 m wide, and each plot was surrounded by a 1-m-wide bare-soil border. To favour natural infection by FHB pathogens, the experiment was conducted in rotation with maize, and all plots were irrigated with an overhead sprinkler system, providing 3 mm of water per day at GS65, i.e., on 14 and 15 May in 2013, with natural rain in the following 2 days (12.8 mm in total); from 5 to 10 May in 2014 (18 mm in total); and from 9 to 14 May in 2015 (18 mm in total).
EXP2 was conducted in 2017 and 2018 on durum wheat cv. Obelix, which has medium-high susceptibility to FHB [25]. Fungicides were applied once at 10, 7, 4 or 1 day before, or 3 or 5 days after artificial inoculation with a mixture of DON-producing F. graminearum strains. The experimental design was similar to that in EXP1. In both years, six commercial fungicides were tested belonging to different chemical groups, plus an untreated control (Table 1 and Table 2). Plots were artificially inoculated at full flowering (GS65), i.e., on 19 May in 2017 and on 18 May in 2018. For artificial inoculation, 1.3 L of a conidial suspension (1.3 × 10⁵ conidia/mL) was uniformly sprayed on each plot with a lightweight 4-nozzle trial boom sprayer (Delvano, Belgium). Following artificial inoculation, all plots were irrigated with an overhead sprinkler for 4 h in 2017 and for 6 h in 2018 to ensure infection. The inoculum was prepared by using 14-day-old colonies grown on potato dextrose agar (PDA) at 25 °C, with a 12-h photoperiod in white light; a mixture of 5 strains of F. graminearum was used; these included CBS110261 and CBS110262 from the CBS collection and MPVP072, MPVP073, and MPVP074 from the university collection of Piacenza. Strain identity was confirmed by sequencing the Elongation Factor 1α, and the ability of the strains to produce DON was confirmed as indicated by Somma et al. [26]. The conidial suspensions were obtained by gently scraping the colony surface twice with the addition of 20 mL of sterile water, by filtering the resulting suspensions through a double layer of sterile cheesecloth, and by adjusting the final suspension to 1.3 × 10⁵ conidia/mL by mixing equal quantities of the 5 strains.
In both EXP1 and EXP2, fungicides were applied using a 4-nozzle boom sprayer (Delvano, Belgium). Fungicides were applied and artificial inoculations were performed at 17:00 in the absence of wind. The crops were managed according to the usual practice, and no additional irrigations or fungicide treatments were applied. For EXP2, a plastic transparent cover was set up before heading to exclude rain; the structure was 2-m high, and only the upper parts of the plants were covered to avoid reducing hindering air circulation (Figure S1).

2.2. Disease Assessment and Mycotoxin Contamination

Disease incidence (proportion of affected spikes, on a 0 to 1 scale, where 1 is 100% incidence) and severity (percentage of spike area showing FHB symptoms) were assessed at GS75 (medium milk: grain content milky) by examining 50 random spikes per plot. Severity was estimated using a standard diagram with 10 severity categories: 0, 7, 14, 21, 33, 50, 66, 75, 90, and 100% [28]. Deoxynivalenol (DON) contamination in ppb was determined for each of the 50 spikes as indicated in in the Supplementary file Text S1. Air temperature, relative humidity, and rainfall were recorded hourly by an automatic weather station (iMeteos OEM Model-1, Pessl Instruments GmbH, Weiz, Austria) located 100 m from the experimental field (Figure 1).

2.3. Data Analysis

Data were analysed with R software (v 4.0.4) [29]. Data from both EXP1 and EXP2 were analysed by using generalized linear-mixed models (GLMMs), with disease incidence, severity, and DON as explanatory variables. For FHB incidence, the GLMM was run with a binomial distribution and logit link function by using the function glmer of the ‘lme4′ package [30,31]; for FHB severity and DON, the GLMM was run with a beta distribution and logit link function by using the function glmmTMB of the ‘glmmTMB’ package [32,33]. In all analyses, the fungicide group (FUNG) and timing of application (TIME) were considered as fixed effects, while years (YEAR) were considered as random effects because the disease pressure or DON concentrations in the different years were considered a subset of the global population (i.e., the pressure of the disease or DON concentration differs with environmental conditions, which differ among years); specifically, the structure 1 year was used in the glmer and glmmTMB functions, which allows intercepts to vary between groups [34]. To reduce the levels of the factor FUNG, the commercial products listed in Table 2 were grouped based on FRAC [27] as described in Table 1.
For each dataset, four models were run: (i) with only YEAR as a random factor; (ii) with FUNG as a fixed factor and YEAR as a random factor; (iii) with FUNG + TIME as fixed factors and YEAR as a random factor; and (iv) with the interaction FUNG × TIME as fixed factors and YEAR as a random factor. The best model was selected based on the lowest value of Akaike’s information criterion (AIC) and the probability level of Chi test conducted with the function anova [35,36]. The goodness-of-fit of the models was also evaluated by the visual examination of the standardized Pearson residuals for the different levels of each factor. The dispersion and residuals of the models were tested by using the functions testDispersion and simulateResiduals of the ‘DHARMa’ package; these functions use a simulation-based approach to create readily interpretable scaled residuals for fitted glmm [37].
For both EXP1 and EXP2, effect sizes of the different fungicides (FUNG) and timing of application (TIME) are presented as the average natural logarithm response ratios for each factor relative to the control ( L ¯ ); in other words, L ¯ = µT − µNT, where µT is the estimated mean log of FHB incidence, severity, or DON concentration, and µNT is the estimated mean log of FHB incidence, severity, or DON concentration in the control. Control levels were the disease pressure and DON concentration in the untreated spikes. A negative value of L ¯ indicates that the model estimated a lower value in the treatment than in the control; therefore, the lower the negative value of L ¯ , the better the FHB control or the lower the DON concentration. L ¯ and its standard error were provided by the functions glmm and glmmTMB; the functions also provided a standard normal test statistic, Z, that determines whether the effect sizes were significantly different from zero, i.e., whether the treatment significantly reduced FHB disease or DON concentration. The 95% confidence interval (CI) of L ¯ was calculated by using the function confint of the ‘stats’ package. Fungicide efficacy was calculated in the form of the overall mean percentage of FHB control ( C ¯ ). Values of C ¯ and their confidence intervals were obtained by back-transforming L ¯ and its CI values in the form C ¯ = (1 − (exp(L)) × 100). Large negative values of L ¯ correspond to large positive C ¯ , which indicates a high efficacy [38].

3. Results

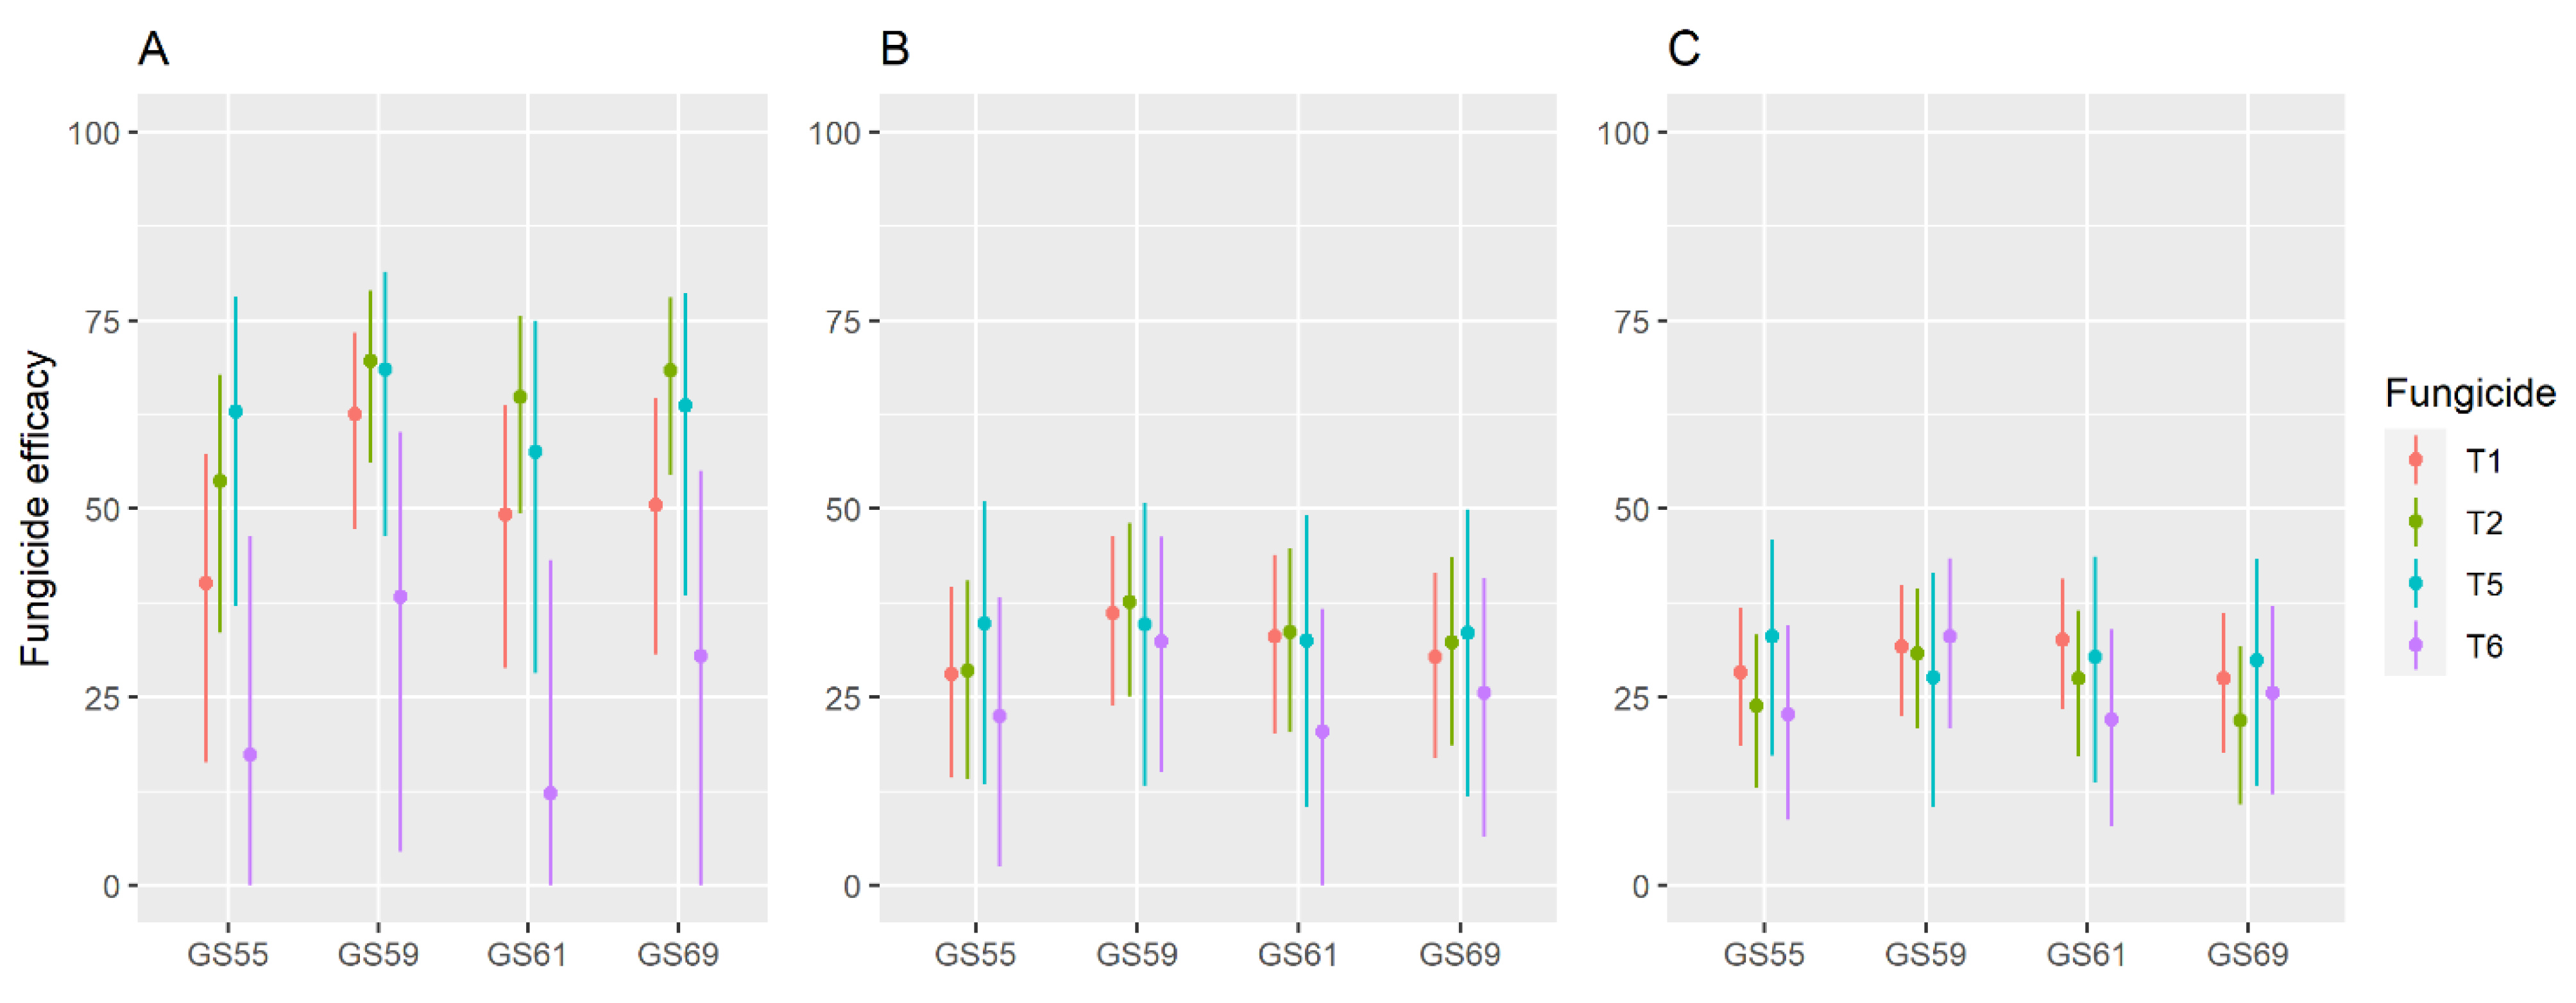
3.1. Timing of Fungicides at Different Wheat Growth Stages (EXP 1)

Weather conditions in 2013, 2014, and 2015 were rainy and moist (Figure 1A–C), so that FHB incidence in the untreated control was 0.67 in 2013, 0.80 in 2014, and 0.71 in 2015; average FHB severity was 26.4%, 18.16%, and 13.4% in the 3 years, respectively. DON concentrations in the untreated control were 210, 1212, and 676 ppb in the 3 years, respectively (Figure S2).
Based on the GLMM, the interaction between fungicides and timings of application had a significant effect on FHB incidence, FHB severity, and DON concentration. In fact, models 1.4, 1.8, and 1.12, which considered the interaction FUNG×TIME, had the lowest values of AIC and deviance, and were significant with P < 0.001, indicating that the interaction of the two factors contributed to the explanatory ability of the model (Table 3). The dispersion and residuals of these models showed a general agreement between expected and observed data (Figure S3).
Based on these models, the fungicides belonging to T1 (DMI), T2 (DMI + QoI), and T5 (DMI + MS) significantly reduced FHB incidence when applied at any growth stage of wheat, given that the average response ratio L ¯ was significantly < 0 (P < 0.003; Table 4). Average fungicide efficacy ( C ¯ ) of T1, T2, and T5 fungicides ranged from 40% (T1 applied at GS55) to 69% (T2 applied at GS59) (Figure 2A). Compared with the untreated control, fungicides belonging to T6 (DMI and MBC) significantly reduced FHB incidence when applied at GS59 (P = 0.03), but not when applied at the other growth stages (P > 0.102; Table 4).
All fungicides significantly reduced FHB severity (P < 0.05) and DON concentration (P < 0.003) compared to the untreated control (Table 4). For both FHB severity and DON concentration, the differences among fungicides and timings were not significant, as shown by the overlap of the CI of the response ratios L ¯ , and fungicide efficacies C ¯ (Table 4 and Figure 2B,C). Average fungicide efficacy was overall low, ranging from 20% (T6 at GS61) to 37% (T2 at GS59) for FHB severity, and from 22% (T6 at GS61) to 33% (T5 at GS55 and T6 at GS59) for DON concentration (Figure 2B,C).

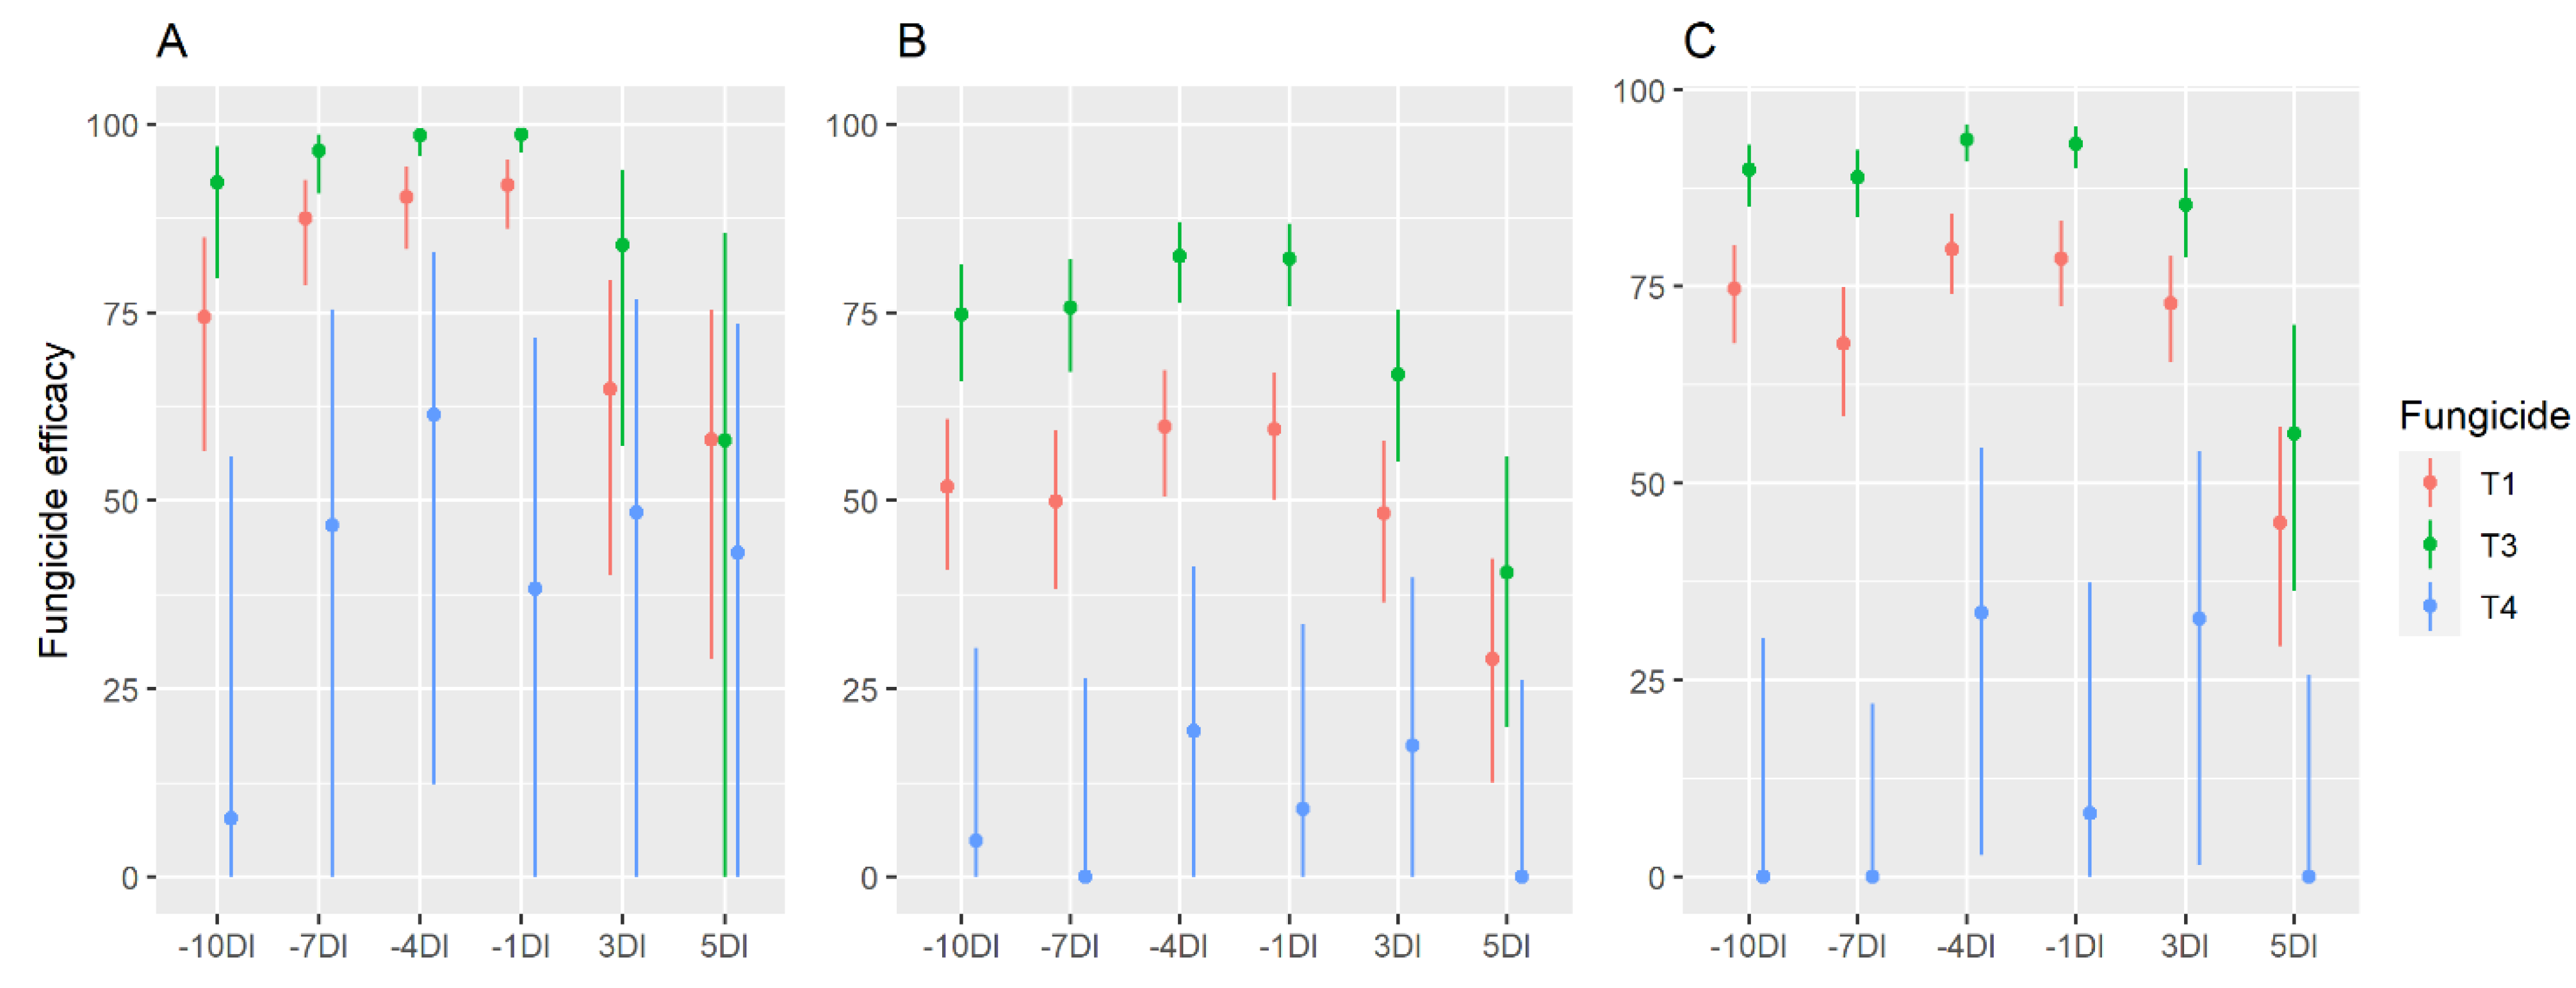
3.2. Timing of Fungicides Relative to Timing of F. graminearum Inoculation (EXP2)

In EXP2, the weather from January to June was drier in 2017 than in 2018, with 163 mm of rain in 2017 and 240 mm of rain in 2018 (Figure 1D,E). Consequently, FHB disease levels and DON concentrations in the untreated control were higher in 2018 than in 2017: average FHB incidence was 0.21 in 2017 and 0.92 in 2018; average FHB severity was 3.2% in 2017 and 19.8% in 2018; and average DON concentration was 619 in 2017 and 3946 ppb in 2018 (Figure S4).
As was the case in EXP1, the interaction between fungicides and timing had a significant effect on FHB incidence, FHB severity, and DON concentration in EXP2. Models 2.4, 2.8, and 2.12, which consider FUNG × TIME, had the lowest values of AIC and deviance, and were significant with P < 0.001 (Table 3). The dispersion and residuals of these models showed a general agreement between expected and observed data (Figure S5).
Based on the effect sizes ( L ¯ ) of these models for EXP2, treatments with fungicides belonging to T1 (DMI) and T3 (DMI and SDHI) but not T4 (MBC) significantly reduced FHB incidence and severity, as well as the DON concentration relative to the untreated control when applied 1 to 10 days before inoculation (P < 0.001 for −1 to −10DI; Table 5). Fungicide efficacy, however, was higher for T3 than for T1 in terms of FHB severity and DON concentration (Figure 3B,C). FHB incidence was reduced by >90% compared to the untreated control when T3 was applied at any time before inoculation; efficacy was lower when fungicides were applied 3 days after inoculation (3DI), and there was no significant FHB reduction at 5DI (Figure 3A). Fungicides belonging to T1 showed a similar trend, but the efficacy was overall lower than for fungicides belong to T3. For FHB severity, the average efficacy for pre-inoculation applications ranged from 75 to 82% for T3, and from 50 to 60% for T1; efficacies were lower for post-inoculation applications than for pre-inoculation applications (Figure 3B). For DON concentration, average efficacy of T3 was >88% when applied at −1 to −10DI, whereas it ranged from 68 to 78% for T1. For DON concentration, the efficacy of T1 and T3 was lower when they were applied 5DI rather than before inoculation (Figure 3C). When applied 3DI, the efficacy was similar to −7DI, but slightly lower than −1DI and −4DI. For fungicides belonging to T4, only applications performed at −4DI resulted in slightly different DON concentrations relative to the untreated control (P = 0.03; Table 5); for the other pre- and post-inoculation applications, no differences were observed in DON concentration with the untreated control (P > 0.48; Table 5).

4. Discussion

In this research, we evaluated the effects of two fungicide-application strategies for control of FHB of wheat and DON contamination of kernels. The first application strategy (EXP1) was based on wheat phenology; because it is commonly accepted that wheat susceptibility is higher at anthesis than at earlier (heading) or later (grain ripening) stages [2,18,19], fungicides are usually applied once from heading to flowering to prevent infection. This can be considered a “calendar-based strategy” and is the most common one followed by farmers worldwide [10,19,38,39]. The second application strategy (EXP2) was based on the timing of fungicide applications according to the time of infection by F. graminearum; both preventative (pre-infection) and curative (post-infection) applications were evaluated. Because in EXP2 we (i) applied an artificial inoculum of F. graminearum conidia and subsequently provided favourable conditions for infection through artificial rains, and we (ii) prevented natural infections by deploying a plastic cover that presumably prevented the deposition of air- or splash-borne inoculum on spikes [3,12], we assume that there were no natural infections and that the infection of spikes resulted from the artificial inoculation. This second strategy is innovative in that the fungicides are applied based on the infection risk and on fungicide pre- and post-infection properties. The second strategy also follows the principles of IPM (Integrated Pest Management) in that it is based on an understanding of pathogen biology, weather conditions, and mechanisms of fungicide action rather than on host phenology. Moreover, by following this strategy, fungicides would be applied only when necessary, optimizing its application and reducing the number of treatments and the risk of resistance appearance [40,41].
The results indicated that when fungicides were applied based on wheat phenology, although the interaction between timing and fungicide was significant, the reduction of FHB severity and DON concentration was <50%, with no differences among the tested growth stages. In previous research, timing of fungicides at different growth stages resulted in contradictory results. For instance, Bolanos-Carriel et al. [10] observed a higher efficacy of Prosaro (a mixture of tebuconazole and prothioconazole) applied 6 days after anthesis than at anthesis. D’Angelo et al. [23], in contrast, observed a better performance of the fungicides when applied at anthesis in one of their trials. In a meta-analysis of 29 studies, Paul et al. [18] reported that there were no significant differences when fungicides were applied at 3, 5, or 7 days post anthesis. Inconsistency in the results obtained with fungicides applied based on the wheat phenology is likely related to the time of F. graminearum infection with respect to fungicide application. Infection by F. graminearum occurs after a rain, when temperatures range from 20 to 30 °C and with at least 16 h of wetness [15]. Therefore, an application at any wheat growth stage can be preventative or curative, with an unknown number of days elapsing between infection and fungicide application, depending on the time of infection.
Results from EXP2 demonstrated that when fungicides were applied at different times pre- and post-infection, the interaction between timing and fungicide had a significant and considerable effect on fungicide efficacy. When DMI (T1) or DMI + SDHI (T3) fungicides were applied 1 or 4 days before infection, efficacy was >90% for FHB incidence and >78% for DON contamination. When these fungicides were applied 5 days post-infection, the average efficacy was lower (58% for FHB incidence and from 45 to 56% for DON concentration depending on the fungicide). These results confirm the hypothesis that the efficacy of fungicides depends on their preventative and curative activity with respect to infection rather than on a specific growth stage of wheat. These results therefore show that the control of FHB may be improved by replacing a wheat phenology-based strategy with an infection risk-based strategy.
An infection-risk based strategy may enable growers to select the best fungicide based on its expected efficacy with respect to the timing of infection. When applied based on wheat phenology (in EXP1), the efficacy of triazole fungicides (DMI) ranged from 14 to 43% for FHB severity and DON contamination, which was wider but generally similar to the range observed by Paul et al. [38] for tebuconazole (35 to 44%) but lower than that found by Machado et al. [39] for the same fungicide (47 to 68%). However, when DMI fungicides were applied 1 or 4 days before inoculation (in EXP2), the efficacy was higher for both FHB severity (50 to 67%) and DON contamination (72 to 84%). When applied 7 days before inoculation, the efficacy of DMI fungicides was also high in reducing DON contamination (58 to 75%). However, when applied 3 or 5 days after F. graminearum inoculation, DMI fungicides efficacy was lower and more variable (30 to 79%).
The efficacy of DMI fungicides increased when used in a mixture with SDHI; the mixture was very effective when applied at 1 or 4 days before inoculation (75 to 87% efficacy for FHB severity, and 90 to 96% for DON contamination), but also when applied up to 10 days before inoculation (65 to 81% for severity and 85 to 93% for DON concentration). However, the efficacies of DMI and DMI + SDHI were similar when applied after inoculation.
Our results overall show that, for the control of FHB, fungicides should be applied as preventatives and as close as possible to the time of infection. In addition to reducing spore germination, DMI and SDHI fungicides are absorbed into the leaf tissue and prevent fungal growth in the early stages of the infection [42]; they may therefore have the potential to be used for post-infection control [43]. In the current study, however, we found that mixtures of DMI and SDHI fungicides had some post-infection efficacy in terms of DON contamination but not in terms of FHB severity, and that mixtures reduced DON contamination when applied at 3 days but not at 5 days post-inoculation of F. graminearum.
In our research, efficacy was lower for MBC than for DMI fungicides. In EXP2, however, MBC were used in only one year; therefore, even though the GLMM provided a good fit of our unbalanced experiment, results concerning MBC fungicides need to be confirmed by further experiments.
In conclusion, we found that the timing of fungicide applications to control FHB should be based on the time of F. graminearum infection during the period of host susceptibility rather than on wheat phenology. Accurate prediction of FHB infection is therefore crucial for timely application of fungicides. Most of the mathematical models developed for predicting FHB have focused more on predicting DON contamination of kernels than on guiding disease control [3,44,45,46,47]. Most of these are regression-based models and are derived from long-term field observations and/or DON analyses; these empirical models describe the overall effects of weather variables on FHB and/or DON concentration but may not perform equally well in regions different from those where they were developed because of the local nature of the field data. Indeed, the weather variables selected and their weight differ among models, and this reflects the differences in the dataset used for model development [3]. The model of Rossi et al. [48], in contrast, is process-based (or mechanistic) and is used for timing fungicide applications for FHB control within a decision support system (DSS) named grano.net [49]. The model calculates a daily infection risk based on the effect of weather conditions on the sporulation, spore dispersal, and infection for the main Fusarium and Microdochium spp. causing FHB, including F. graminearum [5,7,12,13,15]. The infection risk calculated by the model is then combined with agronomic, plot-specific risk factors including the susceptibility level of the variety to FHB, the wheat growth stage (calculated by a crop model [50]), the inoculum level due to the previous crop, and soil and crop residue management; this provides an overall FHB risk for any day from wheat heading onward [51]. Because the FHB model in the DSS provides warnings on likely infection periods for 7 days in the future, the DSS may be useful for scheduling preventative fungicide applications at times when the specific fungicides are most effective.

Supplementary Materials

The following figures and tables are available online at https://www.mdpi.com/article/10.3390/agronomy11081549/s1. Text S1: Supplementary methodology. Figure S1: plastic cover in EXP2 to protect the plants from natural rains. Figure S2: Effect of different fungicides applied at different wheat growth stages on FHB incidence, FHB severity and DON concentration in EXP1. Figure S3: QQ-plot and residuals of simulations performed with DHARMa for GLMMs of EXP1. Figure S4: Effect of different fungicides applied at different timings with respect to artificial inoculation of Fusarium graminearum in terms of FHB incidence, FHB severity, and DON concentration in EXP2. Figure S5: QQ-plot and residuals of simulations performed with DHARMa for GLMMs of EXP2. Table S1: Effect size (L) and corresponding statistics estimated by GLMMs of the control of Fusarium head blight (FHB) incidence with different fungicides applied based on wheat growth stage (EXP1). Table S2: Effect size (L) and corresponding statistics estimated by GLMMs of the control of Fusarium head blight (FHB) severity with different fungicides applied based on wheat growth stage (EXP1). Table S3: Effect size (L) and corresponding statistics estimated by GLMMs in the reduction of DON concentration by different fungicides applied based on wheat growth stage (EXP1). Table S4: Effect size (L) and corresponding statistics estimated by GLMMs of the control of Fusarium head blight (FHB) incidence with different fungicides applied based on days before or after artificial inoculation of spikes with Fusarium graminearum (EXP2). Table S5: Effect size (L) and corresponding statistics estimated by GLMMs of the control of Fusarium head blight (FHB) severity with different fungicides applied based on days before or after artificial inoculation of spikes with Fusarium graminearum (EXP2). Table S6: Effect size (L) and corresponding statistics estimated by GLMMs of the reduction of DON concentration with different fungicides applied based on days before or after artificial inoculation of spikes with Fusarium graminearum (EXP2).

Author Contributions

Conceptualization, E.G.-D., P.M., and V.R.; methodology, E.G.-D., P.M., and V.R.; formal analysis, E.G.-D. and V.R.; investigation, M.R. and P.M.; writing—original draft preparation, E.G.-D. and V.R.; writing—review and editing, E.G.-D., P.M., M.R., and V.R. All authors have read and agreed to the published version of the manuscript.

Funding

This research received no external funding.

Data Availability Statement

Data available on request due to restrictions.

Conflicts of Interest

The authors declare no conflict of interest.

References

  1. Keller, M.D.; Bergstrom, G.C.; Shields, E.J. The aerobiology of Fusarium graminearum. Aerobiologia (Bologna). 2014, 30, 123–136. [Google Scholar] [CrossRef]
  2. Savary, S.; Djurle, A.; Yuen, J.; Ficke, A.; Rossi, V.; Esker, P.D.; Fernandes, J.M.C.; Del Ponte, E.M.; Kumar, J.; Madden, L.V.; et al. A White Paper on Global Wheat Health Based on Scenario Development and Analysis. Phytopathology 2017, 107, 1109–1122. [Google Scholar] [CrossRef] [PubMed] [Green Version]
  3. Xu, X. Effects of environmental conditions on the development of Fusarium ear blight. Eur. J. Plant Pathol. 2003, 109, 683–689. [Google Scholar] [CrossRef]
  4. Del Ponte, E.M.; Spolti, P.; Ward, T.J.; Gomes, L.B.; Nicolli, C.P.; Kuhnem, P.R.; Silva, C.N.; Tessmann, D.J. Regional and field-specific factors affect the composition of Fusarium head blight pathogens in subtropical no-till wheat agroecosystem of Brazil. Phytopathology 2015, 105, 246–254. [Google Scholar] [CrossRef] [Green Version]
  5. Nazari, L.; Pattori, E.; Somma, S.; Manstretta, V.; Waalwijk, C.; Moretti, A.; Meca, G.; Rossi, V. Infection incidence, kernel colonisation, and mycotoxin accumulation in durum wheat inoculated with Fusarium sporotrichioides, F. langsethiae or F. poae at different growth stages. Eur. J. Plant Pathol. 2019, 153, 715–729. [Google Scholar] [CrossRef]
  6. Xu, X.M.; Nicholson, P.; Thomsett, M.A.; Simpson, D.; Cooke, B.M.; Doohan, F.M.; Brennan, J.; Monaghan, S.; Moretti, A.; Mule, G.; et al. Relationship between the fungal complex causing Fusarium head blight of wheat and environmental conditions. Phytopathology 2008, 98, 69–78. [Google Scholar] [CrossRef] [Green Version]
  7. Nazari, L.; Pattori, E.; Terzi, V.; Morcia, C.; Rossi, V. Influence of temperature on infection, growth, and mycotoxin production by Fusarium langsethiae and F. sporotrichioides in durum wheat. Food Microbiol. 2014, 39, 19–26. [Google Scholar] [CrossRef]
  8. Willocquet, L.; Meza, W.R.; Dumont, B.; Klocke, B.; Feike, T.; Kersebaum, K.C.; Meriggi, P.; Rossi, V.; Ficke, A.; Djurle, A.; et al. An outlook on wheat health in Europe from a network of field experiments. Crop Prot. 2021, 139, 105335. [Google Scholar] [CrossRef]
  9. Van Egmond, H.P.; Schothorst, R.C.; Jonker, M.A. Regulations relating to mycotoxins in food : Perspectives in a global and European context. Anal. Bioanal. Chem. 2007, 389, 147–157. [Google Scholar] [CrossRef] [Green Version]
  10. Bolanos-Carriel, C.; Wegulo, S.N.; Baenziger, P.S.; Funnell-Harris, D.; Hallen-Adams, H.E.; Eskridge, K.M. Effects of fungicide chemical class, fungicide application timing, and environment on Fusarium head blight in winter wheat. Eur. J. Plant Pathol. 2020, 158, 667–679. [Google Scholar] [CrossRef]
  11. Manstretta, V.; Gourdain, E.; Rossi, V. Deposition patterns of Fusarium graminearum ascospores and conidia within a wheat canopy. Eur. J. Plant Pathol. 2015, 143, 873–880. [Google Scholar] [CrossRef]
  12. Manstretta, V.; Rossi, V. Effects of weather variables on ascospore discharge from Fusarium graminearum perithecia. PLoS ONE 2015, 10, e0138860. [Google Scholar] [CrossRef] [Green Version]
  13. Manstretta, V.; Morcia, C.; Terzi, V.; Rossi, V. Germination of Fusarium graminearum ascospores and wheat infection are affected by dry periods and by temperatura and humidity during dry periods. Phytopathology 2016, 106, 262–269. [Google Scholar] [CrossRef] [Green Version]
  14. Kriss, A.B.; Paul, P.A.; Madden, L.V. Relationship between yearly fluctuations in Fusarium head blight intensity and environmental variables: A window-pane analysis. Phytopathology 2010, 100, 784–797. [Google Scholar] [CrossRef]
  15. Rossi, V.; Ravanetti, A.; Pattori, E.; Giosuè, S. Influence of temperature and humidity on the infection of wheat spikes by some fungi causing fusarium head blight. J. Plant Pathol. 2001, 83, 189–198. [Google Scholar]
  16. Del Ponte, E.M.; Fernandes, J.M.C.; Bergstrom, G.C. Influence of growth stage on fusarium head blight and deoxynivalenol production in wheat. J. Phytopathol. 2007, 155, 577–581. [Google Scholar] [CrossRef] [Green Version]
  17. McCallum, B.D.; Tekauz, A. Influence of inoculation method and growth stage on fusarium head blight in barley. Can. J. Plant Pathol. 2002, 24, 77–80. [Google Scholar] [CrossRef]
  18. Paul, P.A.; Salgado, J.D.; Bergstrom, G.; Bradley, C.A.; Byamukama, E.; Byrne, A.M.; Chapara, V.; Cummings, J.A.; Chilvers, M.I.; Dill-Macky, R.; et al. Integrated effects of genetic resistance and prothioconazole + tebuconazole application timing on Fusarium head blight in wheat. Plant Dis. 2019, 103, 223–237. [Google Scholar] [CrossRef] [PubMed] [Green Version]
  19. McMullen, M.; Bergstrom, G.; De Wolf, E.; Dill-Macky, R.; Hershman, D.; Shaner, G.; Van Sanford, D. A unified effort to fight an enemy of wheat and barley: Fusarium head blight. Plant Dis. 2012, 96, 1712–1728. [Google Scholar] [CrossRef] [PubMed] [Green Version]
  20. Paul, P.A.; Lipps, P.E.; Hershman, D.E.; McMullen, M.P.; Draper, M.A.; Madden, L. V Efficacy of triazole-based fungicides for Fusarium head blight and deoxynivalenol control in wheat: A multivariate meta-analysis. Phytopathology 2008, 98, 999–1011. [Google Scholar] [CrossRef] [Green Version]
  21. Paul, P.A.; McMullen, M.P.; Hershman, D.E.; Madden, L.V. Meta-analysis of the effects of triazole-based fungicides on wheat yield and test weight as influenced by Fusarium head blight intensity. Phytopathology 2010, 100, 160–171. [Google Scholar] [CrossRef] [Green Version]
  22. Haidukowski, M.; Visconti, A.; Perrone, G.; Vanadia, S.; Pancaldi, D.; Covarelli, L.; Balestrazzi, R.; Pascale, M. Effect of prothioconazole-based fungicides on Fusarium head blight, grain yield and deoxynivalenol accumulation in wheat under field conditions. Phytopathol. Mediterr. 2012, 51, 236–246. [Google Scholar]
  23. D’Angelo, D.L.D.; Bradley, C.A.; Ames, K.A.; Willyerd, K.T.; Madden, L.; Paul, P. Efficacy of fungicide applications during and after anthesis against Fusarium head blight and deoxynivalenol in soft red winter wheat. Plant Dis 2014, 98, 1387–1397. [Google Scholar] [CrossRef] [PubMed] [Green Version]
  24. Meier, U. Growth Stages of Mono-and Dicotyledonous Plants; BBCH Monograph; Federal Biological Research Centre for Agriculture and Forestry: Berlin, Germany, 2001. [Google Scholar]
  25. Rossi, V.; Manstretta, V.; Meriggi, P.; Silvestri, M. Le malattie del grano nell’Italia settentrionale. Terra E Vita 2014, 6, 6–9. [Google Scholar]
  26. Somma, S.; Alvarez, C.; Ricci, V.; Ferracane, L.; Ritieni, A.; Logrieco, A.; Moretti, A. Trichothecene and beauvericin mycotoxin production and genetic variability in Fusarium poae isolated from wheat kernels from northern Italy. Food Addit. Contam. 2010, 27, 729–737. [Google Scholar] [CrossRef] [PubMed] [Green Version]
  27. FRAC. FRAC Code List 2020: Fungicides Sorted by Mode of Action. Available online: http://www.phi-base.org/images/fracCodeList.pdf (accessed on 31 July 2021).
  28. Oliver, R.E.; Cai, X.; Friesen, T.L.; Halley, S.; Stack, R.W.; Xu, S.S. Evaluation of Fusarium head blight resistance in tetraploid wheat (Triticum turgidum L.). Crop. Sci. 2008, 48, 213–222. [Google Scholar] [CrossRef]
  29. R CoreTeam. R: A Language and Environment for Statistical Computing; R Foundation for Statistical Computing: Vienna, Austria, 2020. [Google Scholar]
  30. Bates, D.; Mächler, M.; Bolker, B.M.; Walker, S.C. Fitting linear mixed-effects models using lme4. J. Stat. Softw. 2015, 67. [Google Scholar] [CrossRef]
  31. Madden, L.V.; Turechek, W.W.; Nita, M. Evaluation of generalized linear mixed models for analyzing disease incidence. Plant Dis. 2002, 86, 315–325. [Google Scholar] [CrossRef] [PubMed] [Green Version]
  32. Douma, J.C.; Weedon, J.T. Analysing continuous proportions in ecology and evolution: A practical introduction to beta and Dirichlet regression. Methods Ecol. Evol. 2019, 10, 1412–1430. [Google Scholar] [CrossRef] [Green Version]
  33. Brooks, M.E.; Kristensen, K.; van Benthem, K.J.; Magnusson, A.; Berg, C.W.; Nielsen, A.; Skaug, H.J.; Mächler, M.; Bolker, B.M. GlmmTMB balances speed and flexibility among packages for zero-inflated generalized linear mixed modeling. R J. 2017, 9, 378–400. [Google Scholar] [CrossRef] [Green Version]
  34. Harrison, X.A.; Donaldson, L.; Correa-Cano, M.E.; Evans, J.; Fisher, D.N.; Goodwin, C.E.D.; Robinson, B.S.; Hodgson, D.J.; Inger, R. A brief introduction to mixed effects modelling and multi-model inference in ecology. PeerJ 2018, 6, e4794. [Google Scholar] [CrossRef] [Green Version]
  35. Crawley, M. The R Book, 2 nd ed.; Wiley: Chichester, UK, 2013. [Google Scholar]
  36. Quinn, G.; Keough, M. Experimental Design and Data Analysis for Biologists; MIT Press: Cambridge, MA, USA, 2011. [Google Scholar]
  37. Hartig, F. DHARMa: Residual diagnostics for hierarchical (multi-level/mixed) regression models. 2021. Available online: http://florianhartig.github.io/DHARMa/ (accessed on 31 July 2021).
  38. Paul, P.A.; Lipps, P.E.; Hershman, D.E.; McMullen, M.P.; Draper, M.A.; Madden, L.V. A quantitative review of tebuconazole effect on Fusarium head blight and deoxynivalenol content in wheat. Phytopathology 2007, 97, 211–220. [Google Scholar] [CrossRef] [Green Version]
  39. Machado, F.J.; Santana, F.M.; Lau, D.; Del Ponte, E.M. Quantitative review of the effects of triazole and benzimidazole fungicides on Fusarium head blight and wheat yield in Brazil. Plant Dis. 2017, 101, 1633–1641. [Google Scholar] [CrossRef] [Green Version]
  40. Rossi, V.; Sperandio, G.; Caffi, T.; Simonetto, A.; Gianni, G. Critical success factors for the adoption of decision tools in IPM. Agronomy 2019, 9, 710. [Google Scholar] [CrossRef] [Green Version]
  41. Rossi, V.; Caffi, T.; Salinari, F. Helping farmers face the increasing complexity of decision-making for crop protection. Phytopathol. Mediterr. 2012, 51, 457–479. [Google Scholar]
  42. Mueller, D.; Kiersten, A.; Dufault, N.; Bradley, C.A.; Chilvers, M.I. Part I. Introduction. In Fungicides for Field Crops; APS Press: St Paul, MN, USA,, 2017; pp. 1–13. [Google Scholar]
  43. Mueller, D.; Kiersten, A.; Dufault, N.; Bradley, C.; Chilvers, M. Part IV. Using fungicides to manage diseases on field crops. In Fungicides for Field Crops; APS Press: St Paul, MN, USA, 2017; pp. 43–101. [Google Scholar]
  44. Musa, T.; Hecker, A.; Vogelgsang, S.; Forrer, H.R. Forecasting of Fusarium head blight and deoxynivalenol content in winter wheat with FusaProg. EPPO Bull. 2007, 37, 283–289. [Google Scholar] [CrossRef]
  45. Bondalapati, K.D.; Dakota, S.; Stein, J.M.; Science, P.; Neate, S.M.; Pathology, P.; Dakota, N.; Halley, S.H. Development of weather-based predictive models for Fusarium head blight and deoxynivalenol accumulation for spring malting barley. Plant Disease 2012, 96, 673–680. [Google Scholar] [CrossRef] [PubMed] [Green Version]
  46. Klem, K.; Váňová, M.; Hajšlová, J.; Lancová, K.; Sehnalová, M. A neural network model for prediction of deoxynivalenol content in wheat grain based on weather data and preceding crop. Plant, Soil Environ. 2007, 53, 421–429. [Google Scholar] [CrossRef] [Green Version]
  47. Gourdain, E.; Piraux, F.; Barrier-Guillot, B. A model combining agronomic and weather factors to predict occurrence of deoxynivalenol in durum wheat kernels. World Mycotoxin J. 2011, 4, 129–139. [Google Scholar] [CrossRef]
  48. Rossi, V.; Giosuè, S.; Pattori, E.; Spanna, F.; Vecchio, A. Del A model estimating the risk of Fusarium head blight on wheat *. EPPO Bull. 2003, 421–425. [Google Scholar] [CrossRef]
  49. Rossi, V.; Giosuè, S.; Terzi, V.; Scudellari, D. A decision support system for Fusarium head blight on small grain cereals. EPPO Bull. 2007, 37, 359–367. [Google Scholar] [CrossRef]
  50. Rossi, V.; Racca, P.; Giosuè, S.; Pancaldi, D.; Alberti, I. A simulation model for the development of brown rust epidemics in winter wheat. Eur. J. Plant Pathol. 1997, 103, 453–465. [Google Scholar] [CrossRef]
  51. Rossi, V.; Manstretta, V.; Ruggeri, M. A multicomponent decision support system to manage Fusarium head blight and mycotoxins in durum wheat. World Mycotoxin J. 2015, 8, 629–640. [Google Scholar] [CrossRef]
Figure 1. Weather conditions from January to July in the experimental field located at Ravenna, North Italy, in 2013 (A), 2014 (B), and 2015 (C) for EXP1, and in 2017 (D) and 2018 (E) for EXP2. The figure shows daily values of temperature (T; red line; in degrees Celsius), relative humidity (RH; light blue line; in percentage), and rain (blue bars; in millimetres).
Agronomy 11 01549 g001
Figure 2. Efficacy of fungicide treatments applied at different wheat growth stages in reducing Fusarium Head Blight (FHB) incidence (A), FHB severity (B), and DON concentration (C) in EXP1. Fungicides were applied at GS55 (half of heading), GS59 (end of heading), GS61 (beginning of flowering), or GS69 (end of flowering). Fungicide treatments were grouped as: T1 (DMI), T2 (DMI + QoI), T5 (DMI + MS) and T6 (DMI + MBC) (Table 1 and Table 2). Bars indicate 95% confidence intervals calculated by the GLMM detailed in Table 4.
Agronomy 11 01549 g002
Figure 3. Efficacy of fungicide treatments applied at different times relative to the artificial inoculation of Fusarium graminearum in reducing FHB incidence (A), FHB severity (B), and DON concentration (C) in EXP2. Fungicides were applied 10, 7, 4, or 1 day before, or 3 or 5 days after inoculation (DI). Fungicide treatments were grouped as follows: T1 (DMI), T3 (DMI + SDHI), and T4 (MBC) (Table 1 and Table 2). Bars indicate 95% confidence intervals calculated by the GLMM.
Agronomy 11 01549 g003
Table 1. Main characteristics of the experiments carried out at Ravenna, North Italy, for the control of Fusarium head blight with different fungicides and different application times (application times were based on wheat growth stages in EXP1 and on days before or after artificial inoculation of wheat spikes with Fusarium graminearum in EXP2).
Experiment 1YearCultivarPrevious CropN. of Subplots 2Fungicides 3
EXP12013NormannoCorn29ARE (T1) / AMIS (T2)/ CAR (T1) / CUST (T2) / ENOV + TEB (T6)/ ORI (T1)/ PROS (T1)
2014NormannoCorn29AMIS (T2)/ CAR (T1)/ CUST (T2)/ ENOV + TEB (T6)/ FOLI (T1)/ ORI (T1)/ PROS (T1)
2015NormannoCorn17MIR + CARN (T2)/ FOLP + ORI (T5)/ ORI (T1)/
PROS (T1)
EXP22017ObelixSugarbeet36CAR (T1)/ ENOV (T4)/ MYST (T1)/ PROL (T1)/
SAK (T1)/ SPOR (T1)
2018ObelixPeas36BIN (T1)/ CAR (T1)/ MYST (T1)/ PROL (T1)/
SEG (T3)/ SPOR (T1)
1 In experiment 1 (EXP1), fungicides were applied at four fixed growth stages of wheat: half of heading (GS55, Meier [24]); end of heading (GS59); beginning of flowering (GS61); or end of flowering (GS69). In experiment 2 (EXP2), fungicides were applied at 10, 7, 4 or 1 day before, or at 3 or 5 days after artificial inoculation with F. graminearum. 2 Number of combinations of application times and fungicide treatments (including the untreated control).3 Details of the fungicides are listed in Table 2. For data analysis, fungicide treatments were assigned to group T1–T6: T1 contained only DMI (demethylation inhibitor); T2 contained DMI and QoI (quinone outside inhibitor); T3 contained DMI and SDHI (succinate-dehydrogenase inhibitor); T4 contained MBC (methyl benzimidazole carbamate); T5 contained DMI and MS (multi-site fungicides); and T6 contained DMI and MBC.
Table 2. Characteristics of the commercial products used in the experiments described in Table 1.
Code in Table 1Commercial Name 1Active Ingredients (Concentration %)Dose 2MOA 3Producer
AMISAmistar Plusazoxystrobin (6.8) + tebuconazole (11.7)2 l/haQoI(11) + DMI(3)Syngenta
AREAres 25 WGtebuconazole (25.0)1 kg/haDMI (3)Nufarm
BINBinal Protetraconazole (3.9) + prochloraz (21.9)1.96 l/haDMI (3)Gowan
CARCarambametconazole (8.6)1 l/haDMI (3)BASF
CARNCarnivalprochloraz (35.6)1.1 l/haDMI (3)Adama
CUSTCustodiaazoxystrobin (11.0) + tebuconazole (18.4)1.25 l/haQoI(11) + DMI(3)Adama
ENOVEnovit Metilthiophanate-methyl (41.7)1.25 l/haMBC (1)Sipcam
FOLIFolicur WGtebuconazole (25.0)1 kg/haDMI (3)Bayer
FOLPFolpan 80 WGfolpet (80.0)0.9 kg/haMS (M04)Adama
ORIOrius Ptebuconazole (12.3) + prochloraz (24.6)1.7 l/haDMI (3)Adama
MIRMirador SCazoxystrobin (23.2)1 l/haQoI (11)Adama
MYSTMystic 430 SCtebuconazole (40.2)0.58 l/haDMI (3)Nufarm
PROLProlineprothioconazole (25.0)0.8 l/haDMI (3)Bayer
PROSProsarotebuconazole (12.7) + prothioconazole (12.7)1 l/haDMI (3)Bayer
SAKSakurabromuconazole (15.9) + tebuconazole (10.2)1.2 l/haDMI (3)Nufarm
SEGSeguris Eraisopyrazam (11.2) + prothioconazole (13.5)1 l/haSDHI (7) + DMI(3)Syngenta
SPORSportak 45 EWprochloraz (39.8)1 l/haDMI (3)BASF
TEBTebusip 46tebuconazole (4.5)46.5 l/haDMI (3)Sipcam
1 Commercial name for the Italian market. 2 Label dose at which fungicides were used in each experiment. 3 Mode of action of the active ingredients as listed by the FRAC [27]. The FRAC code is in parentheses.
Table 3. Generalized linear mixed models fit to the data from the experiments carried out at Ravenna, North Italy, for the control of Fusarium head blight with different fungicides applied based on wheat growth stages (EXP1) and on days before or after artificial inoculation of wheat spikes with Fusarium graminearum (EXP2).
EXP 1VariableModel 2Factors 3AIC 4DevianceChisqP (>Chisq)
EXP1FHB incidence1.1(1|YEAR)2445624452--
1.2FUNG + (1|YEAR)2410024088364.6<0.001
1.3FUNG + TIME + (1| YEAR)240472402760.7<0.001
1.4FUNG×TIME + (1|YEAR)239912393988.1<0.001
FHB severity1.5(1|YEAR)−64025−64031--
1.6FUNG + (1|YEAR)−64411−64425393.5<0.001
1.7FUNG + TIME + (1| YEAR)−64456−6447852.7<0.001
1.8FUNG×TIME + (1|YEAR)−64479−6453354.8<0.001
DON1.9(1|YEAR)−10765−10771--
1.10FUNG + (1|YEAR)−11326−11340569.1<0.001
1.11FUNG + TIME + (1| YEAR)−11404−1142686.0<0.001
1.12FUNG×TIME + (1|YEAR)−11455−1150983.0<0.001
EXP2FHB incidence2.1(1|YEAR)1079610792--
2.2FUNG + (1|YEAR)1004010030761.3<0.001
2.3FUNG + TIME + (1| YEAR)95829560470.3<0.001
2.4FUNG×TIME + (1|YEAR)93599301258.5<0.001
FHB severity2.5(1|YEAR)−55317−55323--
2.6FUNG + (1|YEAR)−55886−55898574.6<0.001
2.7FUNG + TIME + (1| YEAR)−56070−56094196.6<0.001
2.8FUNG×TIME + (1|YEAR)−56287−56347252.8<0.001
DON2.9(1|YEAR)−18734−18740--
2.10FUNG + (1|YEAR)−19790−198021061.7<0.001
2.11FUNG + TIME + (1| YEAR)−20127−20151349.5<0.001
2.12FUNG×TIME + (1|YEAR)−20622−20682530.8<0.001
1 In EXP1, fungicides were applied at four fixed growth stages of wheat: half of heading (GS55 [24]); end of heading (GS59); beginning of flowering (GS61); or end of flowering (GS69). In EXP2, fungicides were applied 10, 7, 4, or 1 day before, or 3 or 5 days after artificial inoculation with F. graminearum. 2 Models for FHB incidence were run with a binomial distribution and a logit link function; models for FHB severity and DON rate were run with a beta distribution and a logit link function. 3 Fungicide group (FUNG) and timing of application (TIME) were considered as fixed effects, while years (YEAR) were considered as random effects. Fungicides are listed in Table 1 and Table 2. 4 AIC, Akaike’s information criterion; Deviance, minus twice the maximized log-likelihood; Chisq, Chi test and the associated probability (P value) when comparing models with the same dataset.
Table 4. Effect size (L) and corresponding statistics estimated by GLMMs of the control of Fusarium head blight (FHB) incidence, FHB severity, and DON concentration with different fungicides applied based on wheat growth stage (EXP1).
Growth
Stage 1
Fungicide Group 2FHB Incidence 3FHB SeverityDON
L 4se (L) 5P(Z) 6Lse (L)P(Z)Lse (L)P(Z)
GS55T1−0.5140.1710.003−0.3300.089<0.001−0.3320.065<0.001
T2−0.7690.185<0.001−0.3350.093<0.001−0.2720.068<0.001
T5−0.9900.269<0.001−0.4280.1440.003−0.4020.109<0.001
T6−0.1900.2210.389−0.2540.1170.030−0.2570.085<0.001
GS59T1−0.9810.174<0.001−0.4480.090<0.001−0.3820.065<0.001
T2−1.1900.187<0.001−0.4730.093<0.001−0.3680.068<0.001
T5−1.1550.271<0.001−0.4260.1440.003−0.3230.1090.003
T6−0.4830.2230.030−0.3920.117<0.001−0.4020.085<0.001
GS61T1−0.6780.172<0.001−0.4020.089<0.001−0.3940.065<0.001
T2−1.0430.185<0.001−0.4100.093<0.001−0.3210.068<0.001
T5−0.8570.269<0.001−0.3930.1440.006−0.3610.1090.001
T6−0.1300.2220.558−0.2290.1170.050−0.2490.0850.003
GS69T1−0.7040.172<0.001−0.3610.089<0.001−0.3210.065<0.001
T2−1.1500.186<0.001−0.3890.093<0.001−0.2470.068<0.001
T5−1.0140.270<0.001−0.4090.1440.004−0.3560.1090.001
T6−0.3630.2220.102−0.2950.1170.011−0.2960.0850.001
1 Fungicides were applied at four fixed growth stages of wheat: half of heading (GS55 [24]); end of heading (GS59); beginning of flowering, (GS61); or end of flowering (GS69). 2 Fungicide were grouped as T1 (when contain only DMI), T2 when contain DMI and QoI (Quinone outside Inhibitors), T5 when contain DMI and MS (Multi-Site) and T6 when contain DMI and MBC. 3 Model structures are detailed in Table 3: model 1.4 for FHB incidence, model 1.8 for FHB severity, and model 1.9 for DON concentration. Detailed statistics of each model are provided in the supplementary Tables S1– S3. 4 log-transformed response ratio for each treatment relative to the untreated control. 5 standard error of L. 6 Probability value (significance level) of Z (standard normal statistic).
Table 5. Effect size (L) and corresponding statistics estimated by GLMMs of the control of Fusarium head blight (FHB) incidence, FHB severity, and DON concentration with fungicides of different groups applied based on days before or after artificial inoculation of wheat spikes with Fusarium graminearum (EXP2).
Fungicide Timing 1Fungicide Group 2FHB Incidence 3FHB SeverityDON
L4se (L) 5P(Z) 6Lse (L)P(Z)Lse (L)P(Z)
-10DIT1−1.3640.271<0.001−0.7300.105<0.001−1.3760.126<0.001
T3−2.5540.494<0.001−1.3770.154<0.001−2.2860.192<0.001
T4−0.0810.3760.830−0.0490.1610.7610.0250.1970.898
-7DIT1−2.0750.273<0.001−0.6910.106<0.001−1.1330.129<0.001
T3−3.3500.495<0.001−1.4140.155<0.001−2.1960.192<0.001
T4−0.6300.3930.1090.0090.1610.9530.1370.1970.488
-4DIT1−2.3320.274<0.001−0.9110.105<0.001−1.5970.126<0.001
T3−4.1850.516<0.001−1.7390.155<0.001−2.7560.189<0.001
T4−0.9530.4190.023−0.2160.1610.179−0.4090.1940.035
-1DIT1−2.5130.276<0.001−0.9020.106<0.001−1.5390.127<0.001
T3−4.3020.524<0.001−1.7210.155<0.001−2.6750.189<0.001
T4−0.4830.3970.224−0.0940.1610.558−0.0840.1960.667
3DIT1−1.0440.271<0.001−0.6600.105<0.001−1.3050.126<0.001
T3−1.8270.499<0.001−1.1020.153<0.001−1.9250.193<0.001
T4−0.6630.4060.103−0.1920.1610.232−0.3970.1940.041
5DIT1−0.8710.2700.001−0.3420.1060.001−0.5980.128<0.001
T3−0.8680.5440.111−0.5190.1520.001−0.8290.193<0.001
T4−0.5640.3900.1480.0130.1610.9350.0900.1970.648
1 Fungicides were applied 1, 7, 4, or 10 days before, or 3 or 5 days after the day of inoculation (DI) with a mixture of F. graminearum strains.2 Fungicide treatments were grouped as T1 when they contained only DMI, T3 when they contained DMI and SDHI, and T4 when they contained MBC. 3 Model structures are detailed in Table 3: models 2.4, 2.8, and 2.9 were used FHB incidence, FHB severity, and DON concentration, respectively. Detailed statistics of each model are provided in supplementary Tables S4–S6. 4 log-transformed response ratio for each treatment relative to the untreated control. 5 standard error of L. 6 Probability value (significant level) of Z (standard normal statistic).
Publisher’s Note: MDPI stays neutral with regard to jurisdictional claims in published maps and institutional affiliations.

