Article

Optimization of the Microwave-Assisted Extraction of Simple Phenolic Compounds from Grape Skins and Seeds

1
Department of Chemistry, Faculty of Science, Abdelmalek Essaâdi University, B.P. 2121, M’Hannech II, Tétouan 93002, Morocco
2
Department of Analytical Chemistry, Faculty of Sciences, University of Cadiz, Agrifood Campus of International Excellence (ceiA3), IVAGRO, 11510 Puerto Real, Cadiz, Spain
3
Laboratory of Valorization of Resources and Chemical Engineering, Department of Chemistry, Abdelmalek Essaâdi University, Ancienne Route de l’Aéroport, Km 10, Ziaten, B.P. 416, Tangier 90000, Morocco
*
Authors to whom correspondence should be addressed.
Agronomy 2021, 11(8), 1527; https://doi.org/10.3390/agronomy11081527
Submission received: 19 June 2021 / Revised: 24 July 2021 / Accepted: 27 July 2021 / Published: 30 July 2021
(This article belongs to the Special Issue Extraction and Analysis of Bioactive Compounds in Crops)

Abstract

:
A method for the extraction of phenolic compounds from grape seeds and skins using microwave-assisted extraction (MAE) was developed. Optimization of the effects of the extraction parameters in terms of the results of extraction was obtained using the response surface methodology. The parameters studied were extraction solvent (methanol, ethanol, acetone, and water), percentage of methanol in water, quantity of sample in relation to volume of extraction solvent (solid:liquid, 10–50 mg mL−1), power (100–500 W), magnetic stirring speed (0–100%), and extraction time (5–20 min). Finally, the repeatability and the intermediate precision of the method were determined. The best conditions proved to be: 65% methanol in water as an optimum extraction solvent; 0.5 g of grape skin or seed in a volume of 25 mL; a power of 500 W with the maximum stirring speed (100%); and an extraction time of 5 min. The phenolic compounds proved to be stable in the optimized extraction conditions. The resulting repeatability and the intermediate precision of the optimized method showed a relative standard deviation below 7%. The new method applied on Napoleon grape allowed for the determination of catechin (453.2 (mg kg−1)), epicatechin (306.3 mg kg−1), caftaric acid (22.37 mg caffeic acid equivalents kg−1), dihydrokaempferol-glycoside (11.13 mg kaempferol equivalents kg−1), quercetin (18.28 mg kg−1), quercetin-3-glucoside (20.09 mg quercetin equivalents kg−1), and kaempferol-3-glucoside (11.10 mg kaempferol equivalents kg−1).

Graphical Abstract

1. Introduction

Phenolic compounds constitute a complex and highly diverse family of secondary metabolites of plants [1]. The majority of these compounds are widespread in the plant kingdom, particularly in fruits and vegetables [2]. Furthermore, there is also growing evidence that these compounds may play relevant roles in neurodegenerative disease prevention and exhibit antioxidant, anti-inflammatory, anti-allergic, and powerful antibacterial properties [3]. Amongst these foodstuffs, grapes are one of the most abundantly grown fruits worldwide. Continuing research in grape phenolics is considered by the industry to be a necessary element of the current market success [4,5,6].
Grape phenolics comprise two major groups of compounds: flavonoids and non-flavonoids. In turn, flavonoids consist of families of anthocyanins, flavanols, and flavonols whereas non-flavonoids include both phenolic acids and stilbenes [7]. Anthocyanins (delphinidin, cyanidin, petunidin, peonidin, and malvidin glucoside derivatives) are the pigments responsible for the colors of red grapes and flavanols or proanthocyanins (catechin and its derivatives) are key participants in the sensations of astringency and bitterness produced by wine. On their side, flavanols (kaempferol, quercetin, myricetin, and their glycoside derivatives) occurring in grape skins are mostly responsible for color in white wines [8].
Finally, two common groups of phenolic acids are the benzoic acids (vanillic, gallic, and syringic acids) and the cinnamic acids (caffeic, p-coumaric, and ferulic acids), most of which are provided by wood aging [9]. Stilbenes, such as resveratrol, have more recently focused the attention of researchers because of their antioxidant properties [10]. Stilbenes also have several additional biological properties, including anti-obesity, anti-inflammatory, and anti-cancer effects [11].
In grapes, phenolics are mostly found in seeds and skins. The skin, making up 10–20% of the berry weight at maturity, contains approximately 25% (white) and 50% (red) of the whole content of phenolics in grapes [12]. Skins can be utilized for producing non-wine products rich in phenolics, such as grape skin extract [13]. As Dwyer et al. [14] conclude, there is a significant market potential for pomace by-products, including colorants and phenolic products.
Due to the interest in their use as nutraceuticals in other foods, industrial methods have been developed for the recovery and extraction of the phenolic compounds present in grapes [15,16]. Studies have therefore focused on the parts of the fruit with the highest concentration, namely the seeds and skins [17]. There are several methods that use total phenolics [18,19,20], the Folin–Ciocalteau method for example, to determine the total level of phenolic compounds instead of individual phenolic compounds. In some cases, additional general parameters, including total catechins and total tannins, have also been used [21]. The individual determination of phenolic compounds can be achieved by applying some chromatographic methods on the resulting extracts. However, the specific extraction conditions can produce different recoveries for specific phenolic compounds. Regarding extraction methods based on MAE, the effects of several extraction variables, including solvent, temperature, time, and solvent to sample ratio, on the recoveries of individual anthocyanins from grape skins have previously been evaluated [22]. The most important extraction variables were identified, and the extraction solvent was found to be the extraction variable that produced the highest effect on the recovery.
Moreover, it must be noted that both skins and seeds can easily be degraded by several microorganisms. The skins can be degraded due to the presence of various enzyme types and because they are a good food source for various microorganisms. It would therefore be convenient to have an efficient, fast, and, as far as possible, automatable method for the extraction of phenolic compounds from these parts of the fruit, with specific information about the different individual phenolic compounds in the samples [23].
To develop a process of extraction, it is important to optimize highly significant factors affecting this process. The classical approach of changing one variable at a time and studying the effect of the variable on the response is a complicated technique, particularly in a multivariate system or if more than one response is of importance [24,25]. Experimental designs are statistical techniques that can be used for optimizing such multivariable systems [26]. Among the available methods, the design of experiments based on the response surface methodology is very useful. Specifically, the Box–Behnken design [27] can be used for the optimization of multiple variables to predict the best performance conditions with a minimal number of experiments [28].
Different techniques have been employed for the final determination of these phenolic compounds in the extracts from grapes, including spectrophotometry, high-performance liquid chromatography (HPLC), high-performance liquid chromatography coupled with mass spectrometry (HPLC-MS), and ultra-high-performance liquid chromatography (UHPLC) [29]. Traditionally, HPLC has been the most frequently used technique.
The aim of this work is to develop an analytical method allowing for the determination of phenolics in grape skins and seeds. To determine the best extraction conditions, the Box–Behnken design was used to obtain information about the effects and interactions among the extraction conditions on the level of recovery of specific phenolic compounds, allowing for a faster optimization.

2. Materials and Methods

2.1. Products and Reagents

The solvents used (ethanol, acetone, and methanol (Panreac, Barcelona, Spain)) were of HPLC grade. The water was supplied by a Millipore Milli-Q system (Bedford, MA, USA). The standards ((+)-catechin, caffeic acid, (−)-epicatechin, and rutin) and the 2,5-dihydroxybenzaldehyde used as an internal standard were obtained from Sigma (St. Louis, MO, USA).

2.2. Plant Material

To carry out the MAE method, the “Napoleon” (Vitis vinifera) variety of grape was used. Grapes were frozen and the skin and seeds were manually separated from the rest of the fruit. All the material was first freeze-dried before being ground with a conventional mixer until a homogenous sample had been obtained for the analysis. In the case of the skins, the average weight loss during freeze-drying was 37.85%, while for the seeds this was 6.39%. The dried sample obtained was stored in the freezer at −20 °C prior to analysis.

2.3. Extraction Process

The extraction of grape-derived phenolic compounds by means of microwaves was carried out under different extraction conditions in closed vessels: temperature: 100 °C; solvents: methanol, ethanol, acetone, and water; power: 100–500 W; volume of solvent: 15–50 mL; quantity of sample in relation to volume of solvent: 10–50 mg mL−1; extraction time: 5–20 min; magnetic stirring: 0–100%. The extraction using microwaves was carried out in an Ethos 1600 microwave extractor (Milestone, Shelton, CT, USA). Only microwave energy was used to heat the samples.

2.4. Separation and Quantification of Phenolic Compounds

In this study, the analyses of the extracts were performed by HPLC in a Waters system (Waters Corporation, Milford, MA, USA), consisting of an autosampler (717 plus), a pump controller (600S), a pump (616), a photodiode array detector (996), and a fluorescence detector (474), using an RP-18 column (LiChrospher 100, 250 mm × 3 mm, 5 µm particle size, Merck, Darmstadt, Germany) and a gradient of acidified water (2% acetic acid) (solvent A) and methanol–water–acetic acid (90:8:2) (solvent B) at a flow rate of 1 mL/min. The gradient was as follows (time (min), % solvent B): 0.0, 20%; 10, 25%; 20, 50%; 21, 100%. The UV absorbance was monitored from 200 to 400 nm. Identification was made by comparison of the UV-Vis spectrum with the commercial standards available for catechin, epicatechin, and caffeic acid. In the case of the flavanols, identification was made using an LC-MS system. The UV-Visible signal was used for quantification of caftaric acid and flavanols. A fluorescence signal was used for quantification of catechin and epicatechin. The fluorescence output signal (excitation wavelength, 280 nm; emission wavelength, 310 nm) was monitored and integrated using Millennium 32 Chromatography Manager software (Waters). A stock solution of catechin (100 mg L−1), epicatechin (100 mg L−1), and rutin (100 mg L−1) was prepared in methanol–water (1:1). The stock solution was diluted to give 6 different standard solutions from 1 to 100 mg L−1. The resulting calibration curves were y = 8054 x − 15154 (R2 = 0.999) for caffeic acid (LQ = 1.30 mg L−1); y = 43738 x + 21262 (R2 = 0.999) for catechin (LQ = 0.18 mg L−1); y = 47438 x + 31076 (R2 = 0.999) for epicatechin (LQ = 0.06 mg L−1); and y = 7401 x + 1039 (R2 = 0.999) for rutin (LQ = 0.95 mg L−1), where y (absorbance units) is the signal in the detector and x (mg L−1) is the concentration.
For the LC-MS analyses, we used an ultra-high-performance liquid chromatograph (UHPLC) coupled to a photodiode array (PDA) detector (Waters Corporation, Milford, MA, USA) and a quadrupole-time-of-flight mass spectrometer (Q-ToF-MS) (Xevo G2 QToF, Waters Corp., Milford, MA, USA). The column was a reverse-phase C18 analytical column with a 1.7 μm particle size, 2.1 × 100 mm (ACQUITY UPLC CSH C18, Waters). The mobile phase A, a 2% formic acid–water solution, and the mobile phase B, a 2% formic acid–methanol solution, were used at a flow rate of 0.4 mL min−1. The gradient employed was the following (time (min), % solvent B): 0.00, 15%; 3.30, 20%; 3.86, 30%; 5.05, 40%; 5.35, 55%; 5.64, 60%; 5.95, 95%; and 7.50, 95%. The total run time was 12 min: 8 min for the analysis and 4 additional minutes for re-equilibration. The mass spectra were acquired in negative ion mode under the following conditions: desolvation gas flow = 700 L h−1, desolvation temperature = 500 °C, cone gas flow = 10 L h−1, source temperature = 150 °C, capillary voltage = 700 V, cone voltage = 30 V, and collision energy = 20 eV. The ions were scanned from m/z 100 to m/z 1200. The most significant values found in the mass spectra of each of the four flavonols were compared with those found in the literature.

2.5. Experimental Design

The extraction of phenolic compounds by means of microwave-assisted extraction was carried out under different extraction conditions according to the experimental design shown in Table 1. A preliminary test allowed for the selection of the two solvents producing the higher recoveries (Section 3.1); therefore, only methanol/water mixtures were used in the experimental design. Each experiment in the experimental design was run in duplicate. The variables studied were solvent (35–65% MeOH in water), ratio sample to solvent volume (10–50 mg mL−1), microwave power (100–500 W), and magnetic stirring (0–100%).
The 27 extractions carried out with their distinct extraction variables (each variable having three levels: low, medium, and high) can be seen along with the respective responses. As the response variable, the standardized chromatographic area of the compounds detected was used, i.e., the signal from each of the seven compounds detected was standardized (average = 0 and standard deviation = 1) and the arithmetic average of these was determined.
The responses obtained from the various extractions were put into to a second-order polynomial equation into which each of the various parameters was introduced. The polynomial Equation (1) is as follows:
Y = β0 + β1X1 + β2X2 + β3X3 + β4X4 + β12X1X2 + β13X1X3 + β14X1X4 + β23X2X3 + β24X2X4 + β34X3X4 + β11 X1 2 + β22 X2 2 + β33 X3 2 + β44 X4 2
In this equation, Y is the aforementioned response; β0 is the ordinate at the origin; X1 (percentage of methanol in water), X2 (sample-solvent ratio), X3 (power), and X4 (stirring) are the independent variables; β1, β2, β3, and β4 are the lineal coefficients; β13, β14, β23, β24, β34, and β12 are the cross-product coefficients; and β11, β22, β33, and β44 are the quadratic coefficients. The analysis of data for the Box–Behnken design was carried out using Minitab statistical software (Minitab, Inc. State Collage, PA, USA). This was used to obtain an estimation of the effects of the variables in the final response, the variance analysis, the second-order mathematical model, the optimum levels of the significant variables, and the surface graphs.

3. Results and Discussion

One of the advantages of MAE is the use of high temperatures to increase and accelerate the efficiency of extraction of the compounds of interest from the sample. It has previously been found that a large proportion of the phenolic compounds are stable at up to temperatures of 100 °C in the extraction conditions applied in this study [30]. For this reason, the working temperature was fixed at this value to minimize the extraction time necessary for recovery of the phenolic compounds.

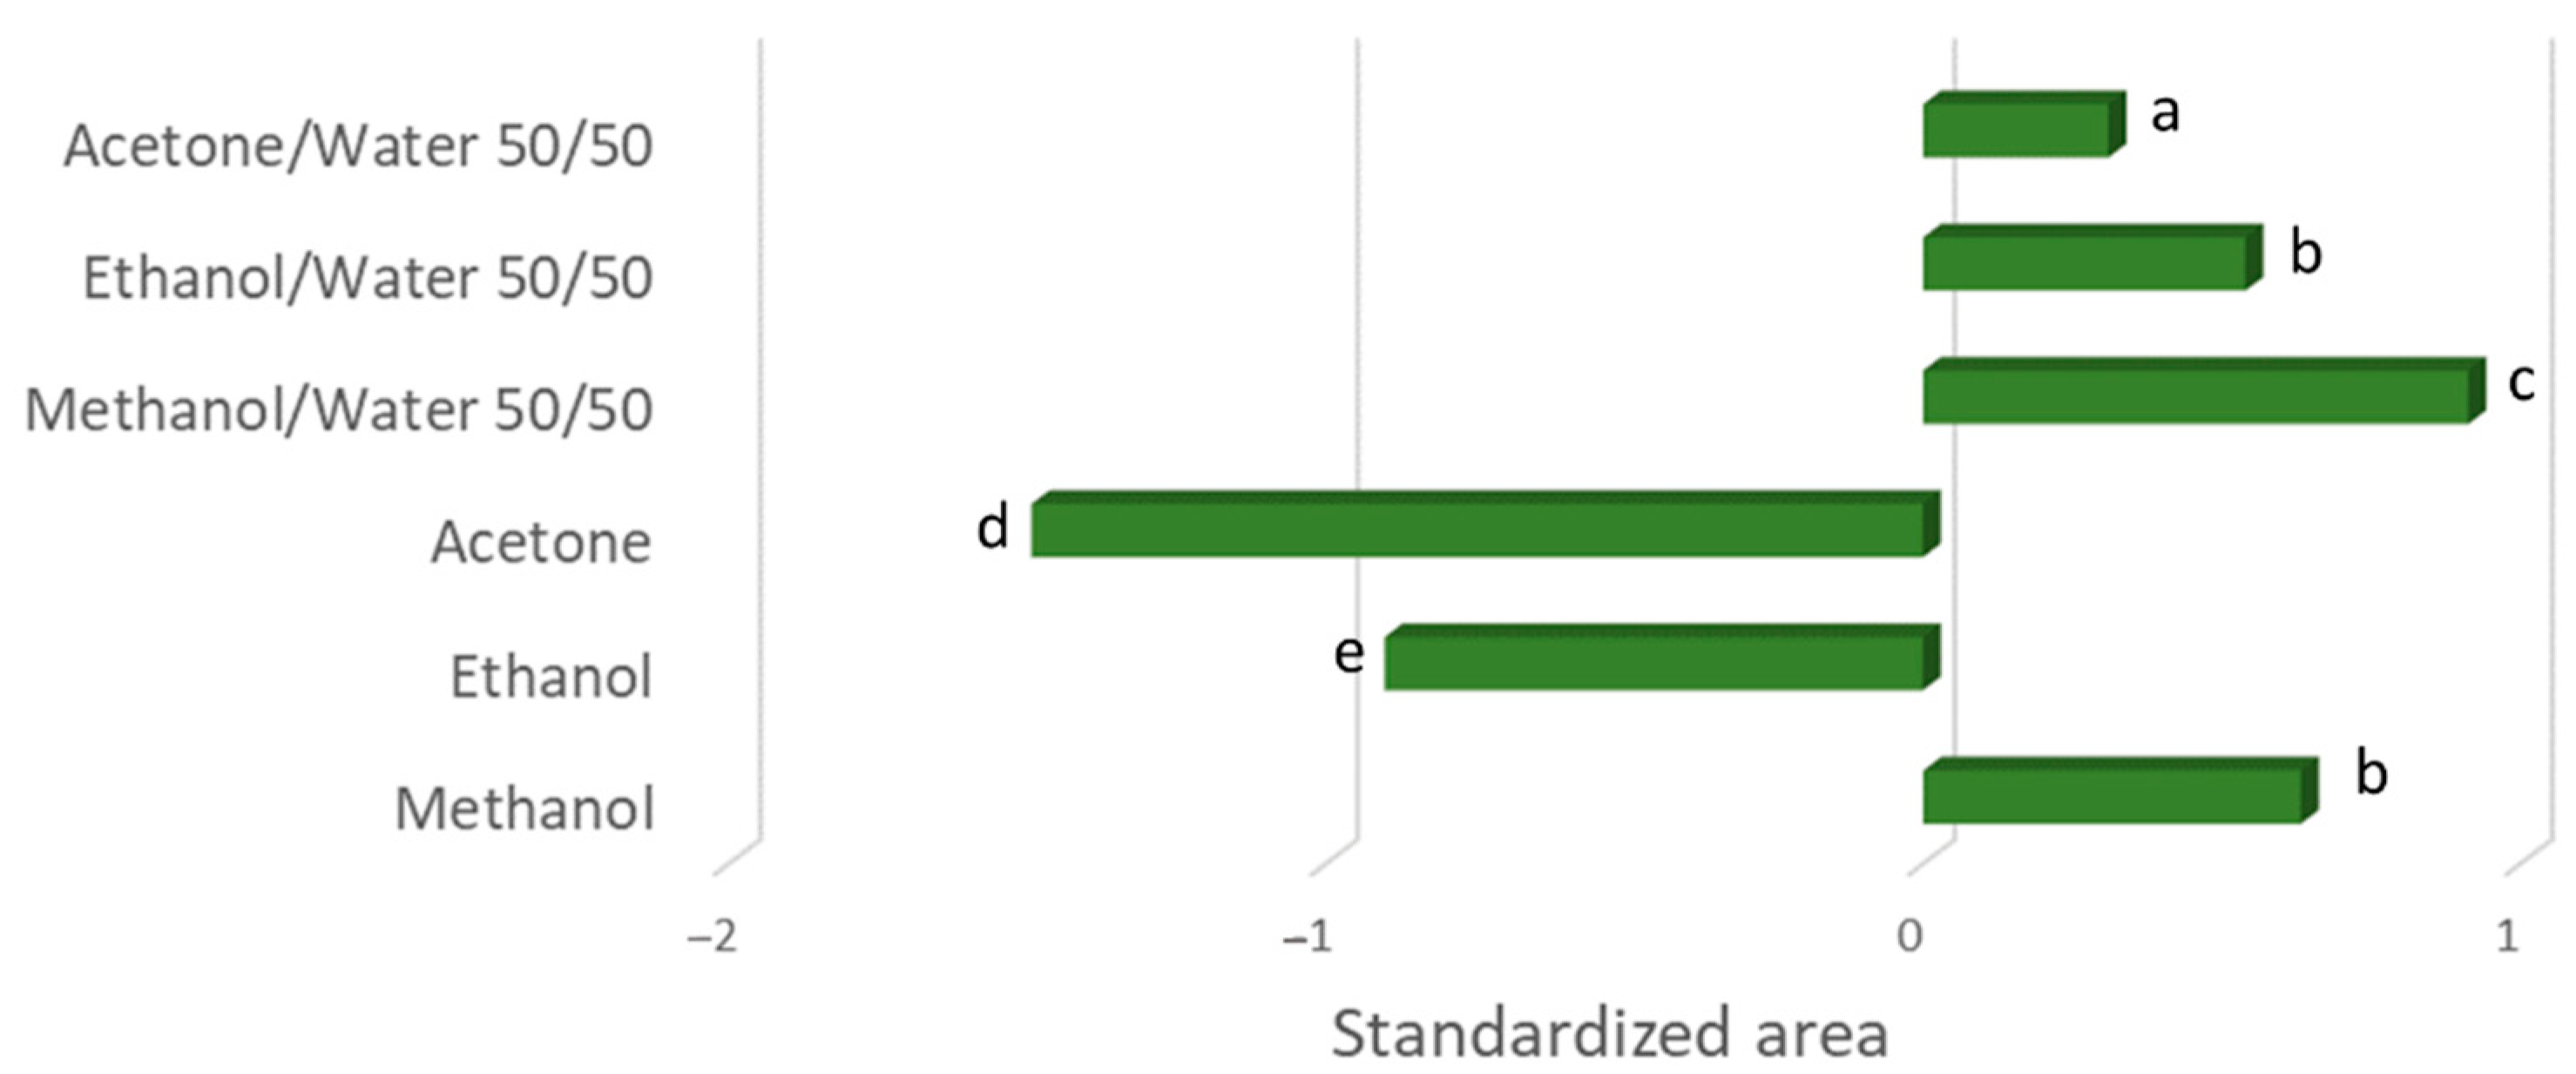
3.1. Preliminary Test to Evaluate the Best Solvent

The selection of the most appropriate solvent when extracting the analytes of interest from the matrix of the sample is a fundamental step when carrying out any extraction method [31]. In the case of MAE, the influence of this is greater, given that the capacity at which the extraction solvent must absorb and transmit the microwave energy must be taken into account. Furthermore, the phenolic compounds, obviously, must be soluble in the solvent that is being used for the extraction.
Due to its importance, different mixtures were checked before planning the design of the experiments for the optimization. The solvents that were used to extract the phenolic compounds from the matrix of the sample were methanol, ethanol, and acetone, plus mixtures of 50% of each of these solvents with water [32]. Methanol, ethanol, and acetone are solvents that are normally used for the extraction of phenolic compounds in various extraction techniques, such as in Soxhlet extraction and ultrasound-assisted extraction [33,34,35]. The extractions were carried out with a sample of skins and seeds of around 0.5 g, in 25 mL of the three solvents, both pure and mixed with water, at a temperature of 100 °C and 500 W of power for 5 min of extraction. Each assay was carried out three times. The average areas of the chromatographic peaks were standardized to enable a comparison of results. The areas from the following compounds were used: Catechin, Epicatechin, Caftaric acid, Dihydrokaempferol-glycoside, Quercetin-3-glucuronide, Quercetin-3-glucoside, and Kaempferol-3-glucoside, because they were the identified compounds showing the highest chromatographic areas. The areas were standardized so that all the compounds analyzed would contribute equally to the result of the extraction. Therefore, the average chromatographic areas were centered to 0 with a SD of 1. Positive values in the bar graphic mean higher recoveries than the average recovery (0) and negative values mean lower recoveries than the average one.
The results obtained in Figure 1 show that in the three extraction solvents, methanol, ethanol, and acetone, the best pure solvent is methanol, whilst acetone is the pure solvent that shows the lowest capacity for extraction of phenolic compounds from skins. In Figure 1, it can be seen that mixing these solvents in water significantly increases the recovery of phenolic compounds. This effect is more significant the less polar the organic solvent used, whilst the increase is much more moderate when using methanol. In any case, it was the mixture of methanol/water that obtained the highest recovery of phenolic compounds. In view of these results, we decided to continue the study by evaluating mixtures of methanol/water in different proportions as the extraction solvent.

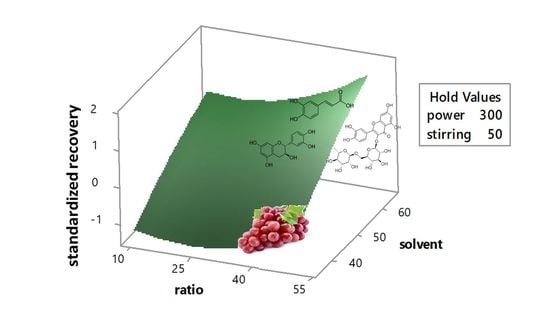
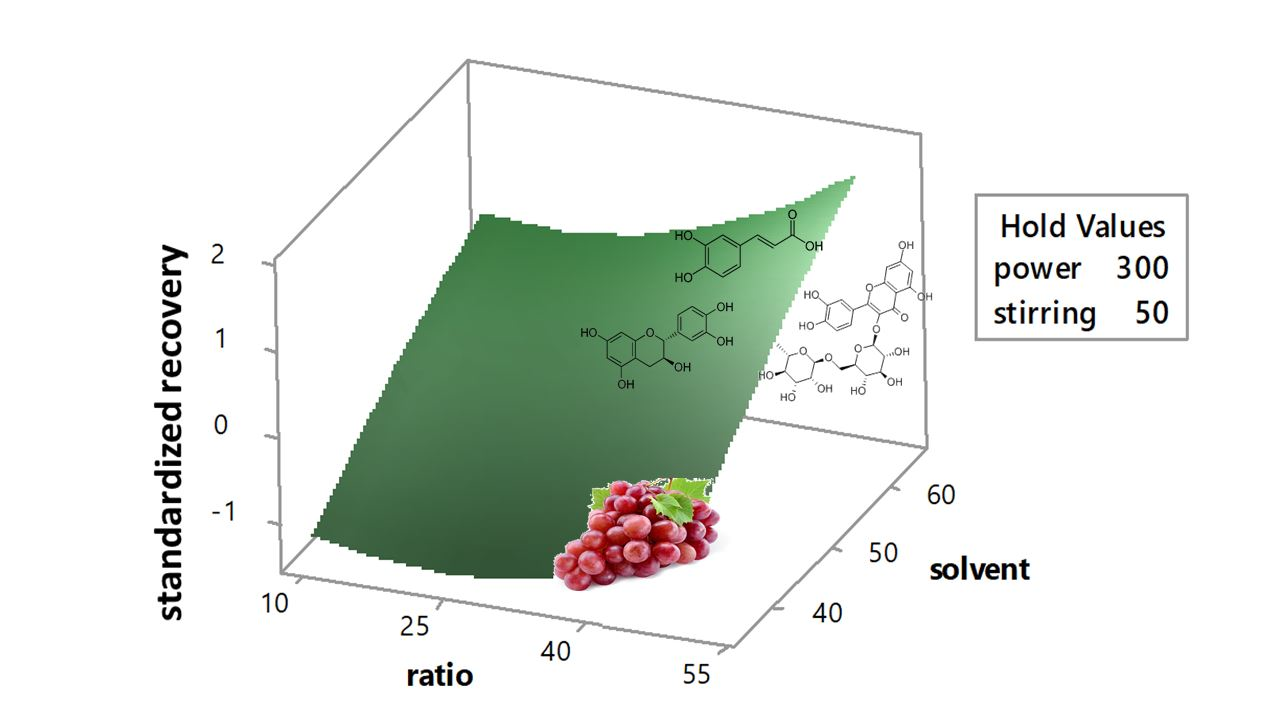
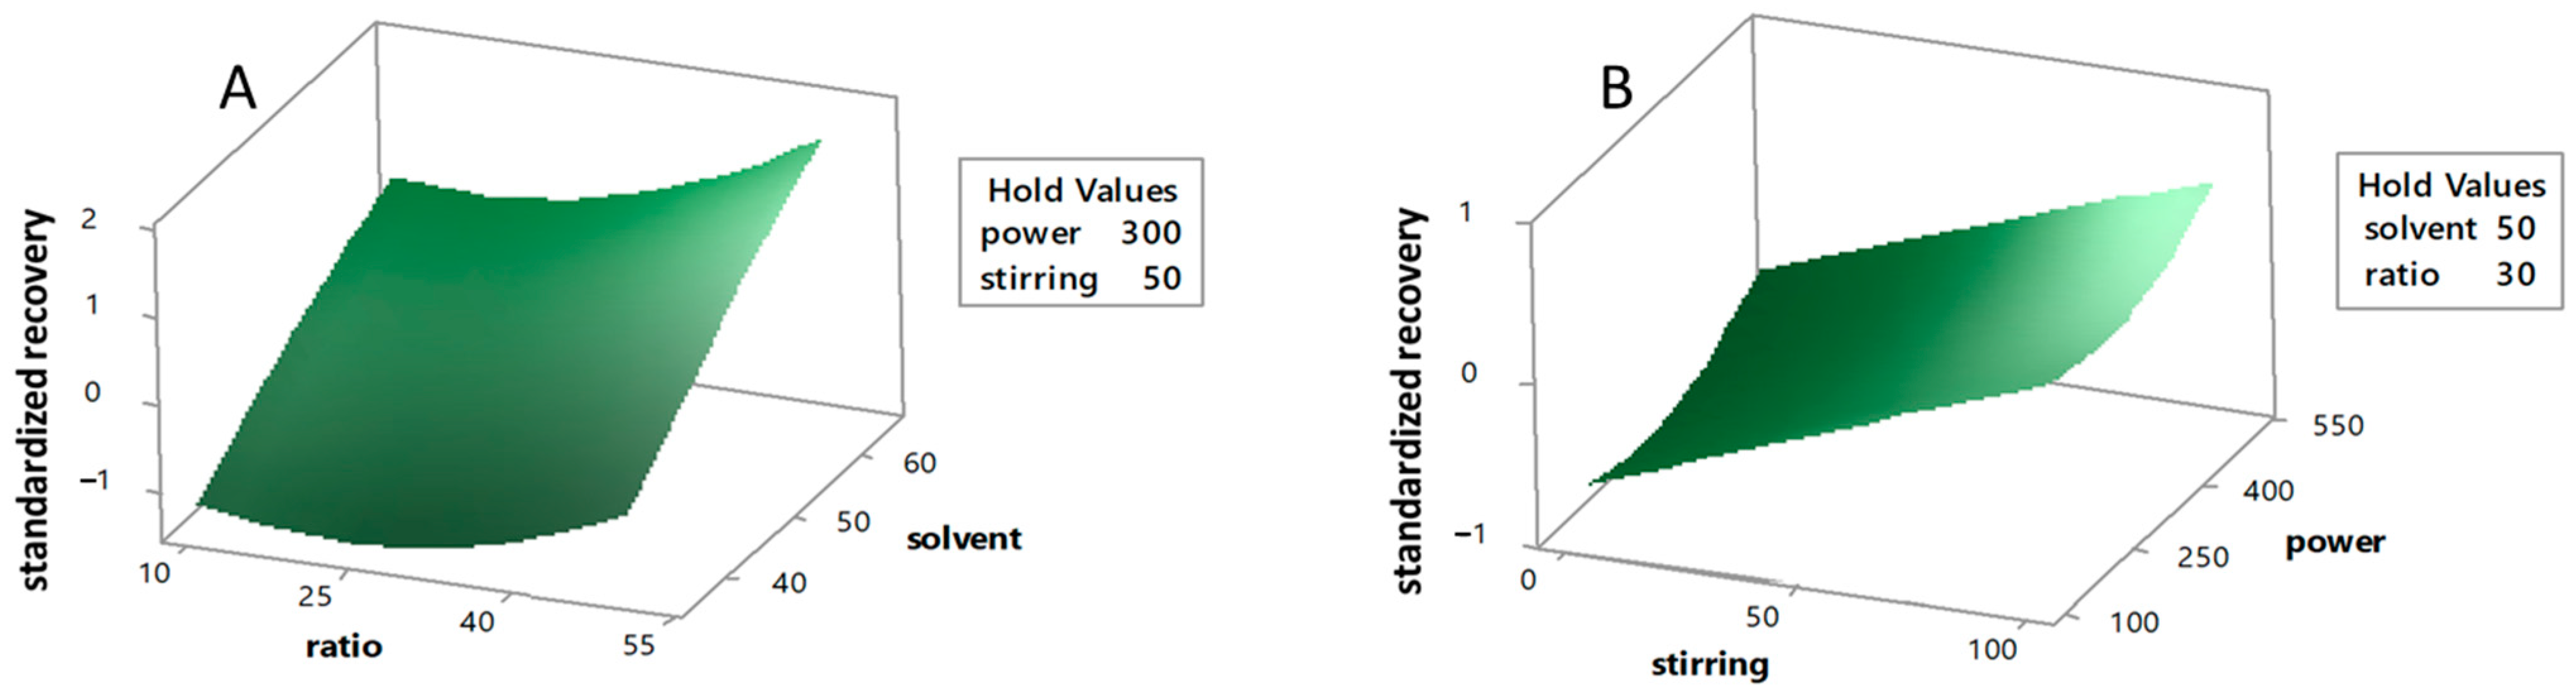
3.2. Analysis of Response Surface

Firstly, in order to minimize the number of assays, and secondly to derive mathematical models for describing the optimizations of the results of the extraction, a statistical methodology for the surface response experimental design was selected, specifically that of Box–Behnken [36], taking into account the following variables: percentage of methanol in water, samples–solvent ratio, microwave power, and stirring speed.
Table 1 shows the values of each variable used in the different assays. Table 1 also shows the mean of the standardized areas. The data in Table 1 were used to create the response surfaces shown in Figure 2. Figure 2A shows the results of the response surface created by the variables of sample–solvent ratio and solvent (percentage of methanol in water). It can be seen how the influence of the percentage of solvent is substantially greater than the influence of the ratio between the weight of solid sample and the volume of solvent. In fact, the maximum recovery on changing the percentage of methanol in water was not reached within the interval analyzed and must be determined with additional experiments. Similarly, it appears that weight/volume (mg mL−1) ratios above those tested in the design could produce greater recoveries of phenolic compounds.
Figure 2B shows the results of the response surface created by the variables stirring speed and power. It can be seen how the best results are obtained with high stirring speeds (100%) and higher values cannot be used. With respect to the influence of power, this is not clear, but slightly higher recoveries were found at high powers, for which reason this variable was fixed at 500 W.
As regards the coefficients and p-values obtained in the adjustment of the model (Table 2), it can be seen that the variables producing significant effects proved to be the percentage of methanol in water, the ratio, and the stirring speed, with a greater percentage of methanol, a higher ratio, and faster stirring having a positive influence on recovery. The microwave power proved to be less influential. As regards the interactions, these all proved to be of little importance, from which it can be concluded that the influence of variation in the variables analyzed can be carried out independently from the other three and that their effect can be calculated on the basis of the coefficients obtained in the model, without the need to take into account interactions with the other variables. This facilitated later optimization of the extraction conditions.

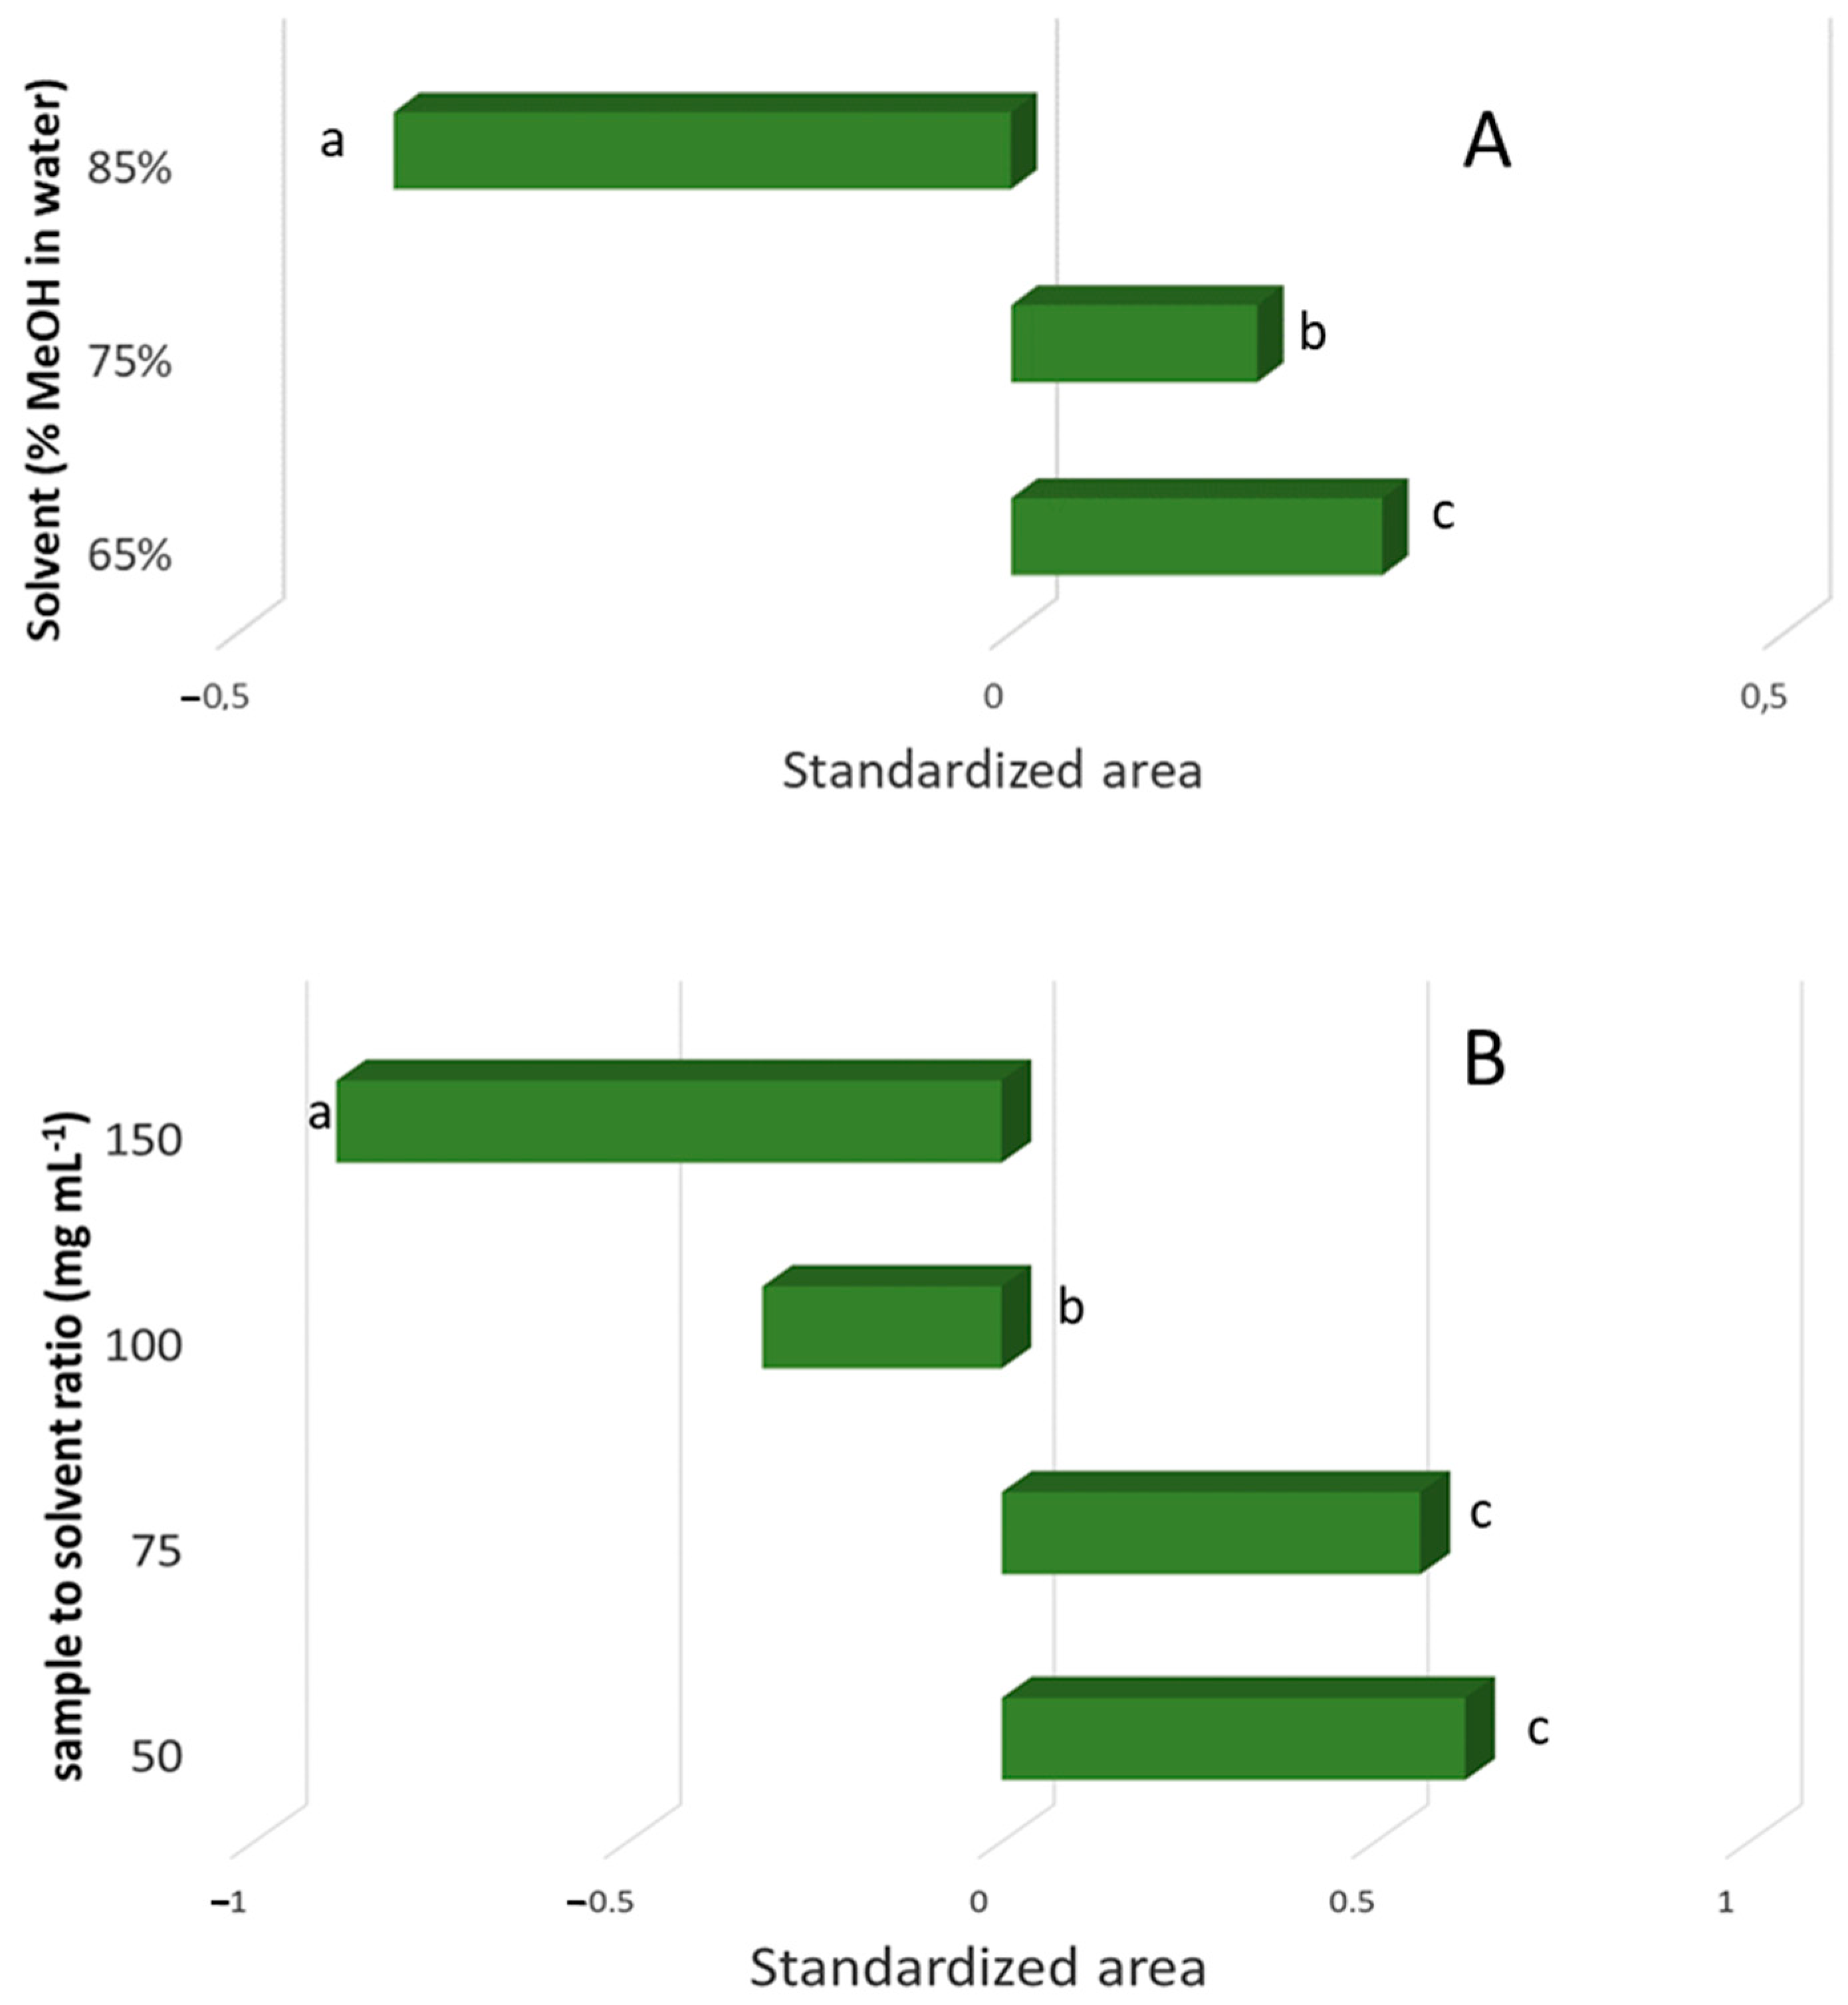
3.3. Effects by the Significant Extraction Variables on the Recovery

With the results obtained using the Box–Behnken experimental design, it can be deduced that there is a need to carry out a study on the optimum solvent for extraction and the sample to solvent ratio. It has previously been observed that increasing the percentage of methanol in the extraction solvent from 35% to 65% produces an increase in the recovery of phenolic compounds. It is therefore necessary to carry out a study of percentages of methanol–water of the optimum solvent for extraction in order to discover the percentage at which the maximum recovery of phenolic compounds is achieved. In order to find this out, percentages of 65, 75, and 85 were studied as shown in Figure 3A. The previously selected extraction variables were set to 50 mg mL−1 for ratio, 500 watts for microwave power, and 100% stirring speed and extractions of 5 min were carried out. All the analyses were carried out in triplicate. Figure 3A shows that percentages of methanol above 65% produced a decrease in the recovery of phenolic compounds. Therefore, 65% methanol in water is the percentage that must be used in the method.
Regarding the sample to solvent ratio, the results in the experimental design suggested that we check higher values; therefore, sample to solvent ratios of 50, 75, 100, and 150 were studied as shown in Figure 3B. The previously selected extraction variables were set to 65% methanol in water, 500 watts for microwave power, and 100% stirring speed and extractions of 5 min were carried out. All the analyses were carried out in triplicate. Sample to solvent ratios higher than 50 produced non-significant differences or a decrease in the recovery of phenolic compounds. Therefore, 50 mg mL−1 for ratio is the value that must be used in the microwave-assisted extraction-based method.

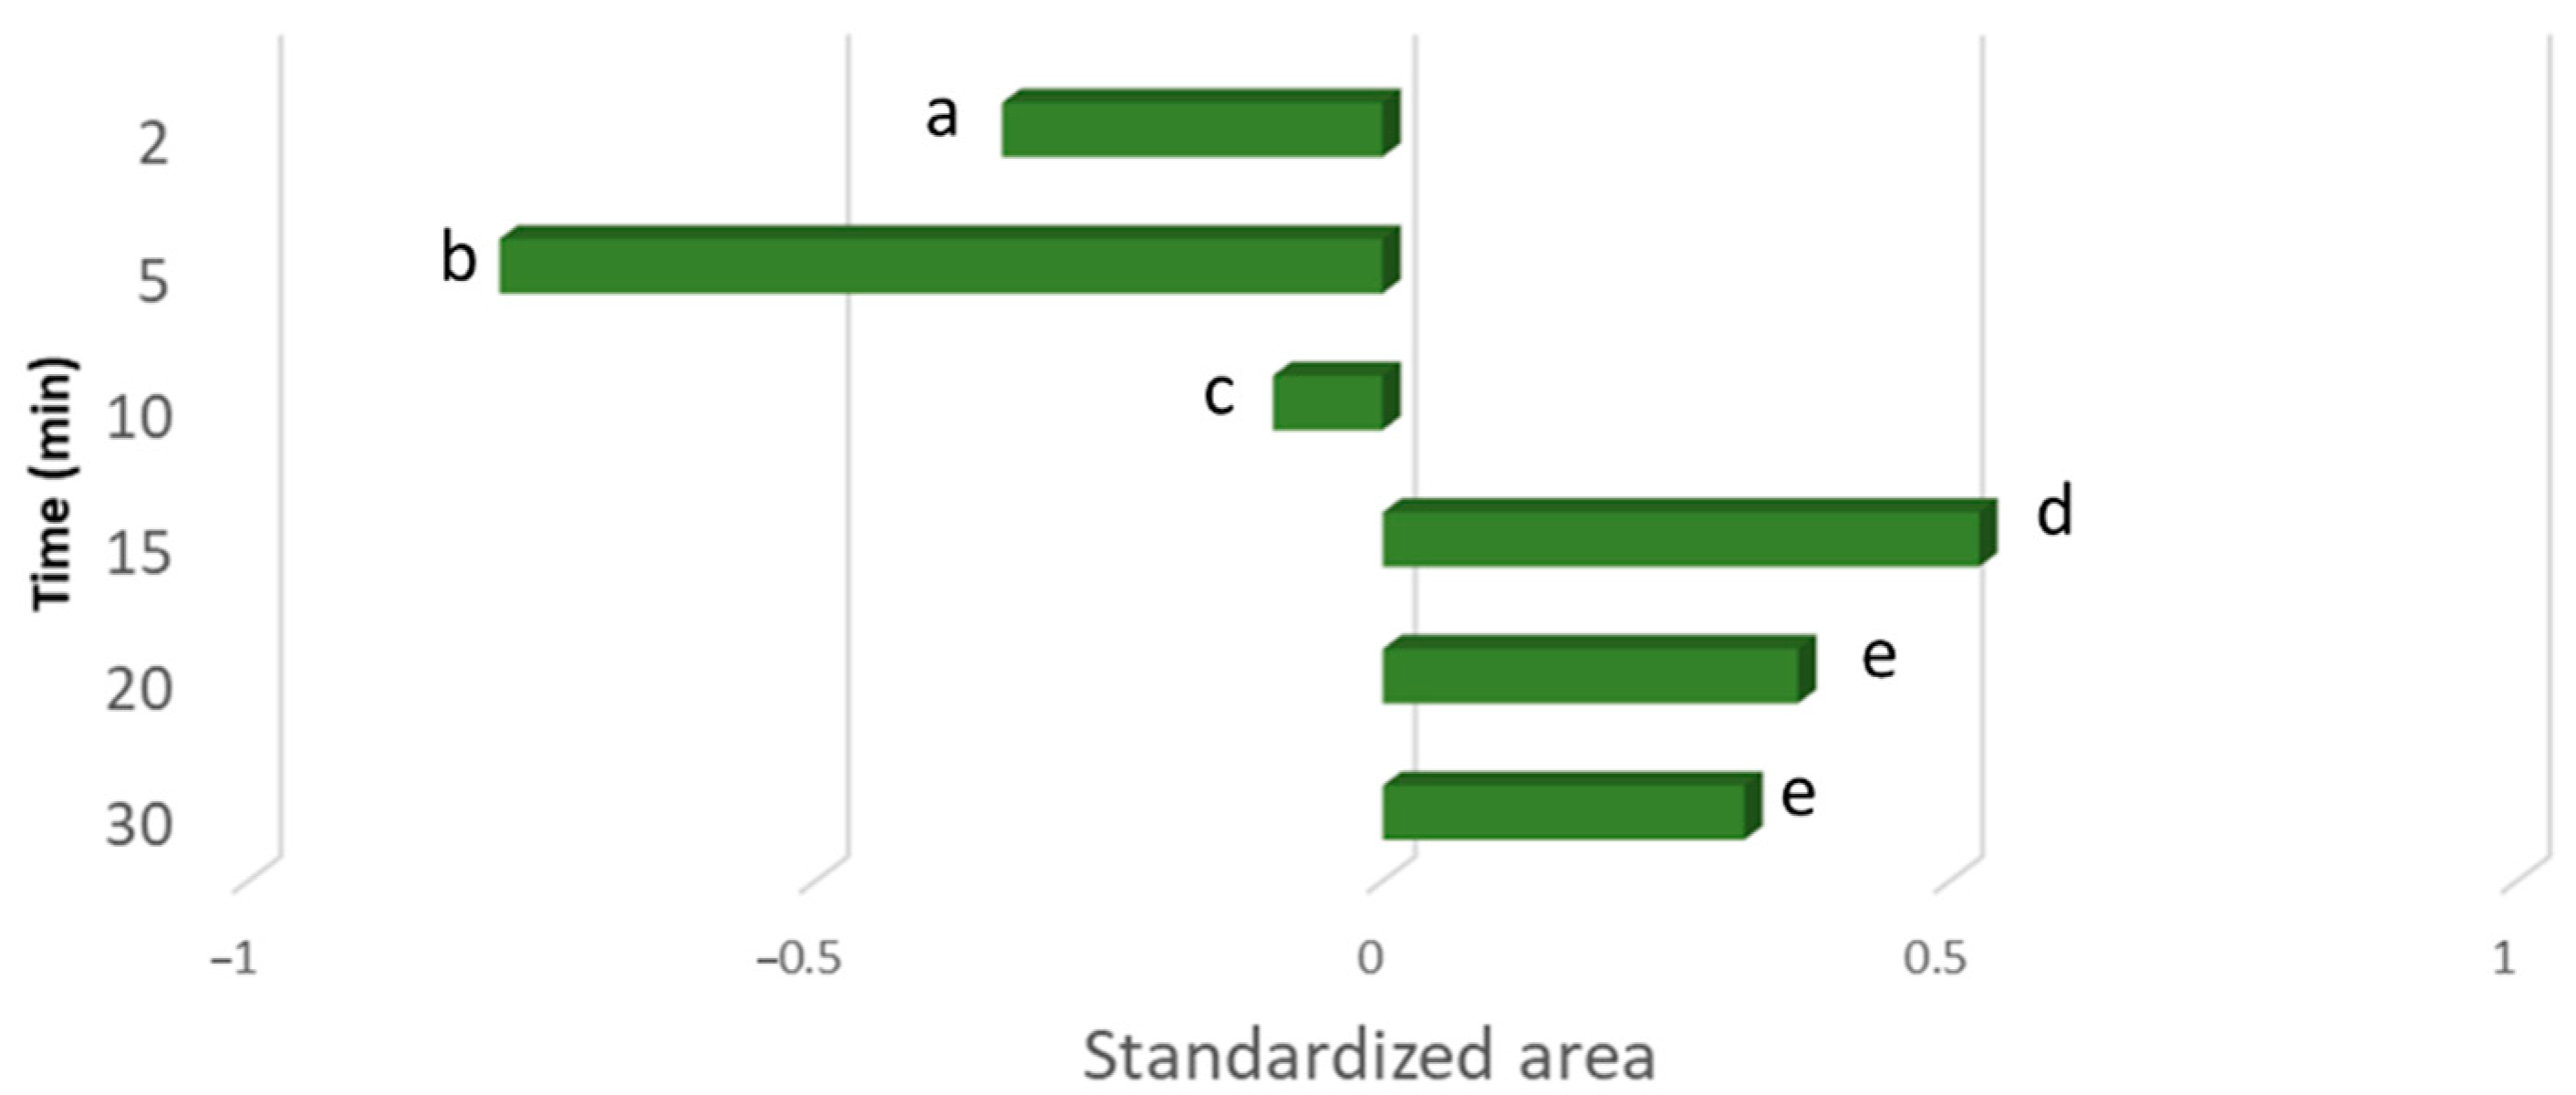
3.4. Extraction Time

The next parameter that was studied for carrying out the method was the extraction time. In general, increasing the extraction time increases the quantity of analytes extracted, but degradation can occur. Two phenomena can therefore be found with opposite effects on the recovery. Extraction times were studied between 2 and 30 min, maintaining the remaining variables established in the preceding experiments. All the analyses were carried out in triplicate. The results are shown in Figure 4.
It can be seen that the largest quantity of phenolic compounds is extracted with an extraction time of 15 min. If the extraction time is increased to 20 min, a decrease in the extracted phenolic compounds can be observed, which could be due to degradation of the same. Times of less than 15 min also achieve a lower recovery due, in this case, to the time not being long enough for the maximum amount of phenolic compounds to be extracted.

3.5. Repeatability and Intermediate Precision

The repeatability and intermediate precision of the optimized method using MAE for the peak area of the phenolic compounds analyzed were studied. To do this, a total of 15 analyses of the same sample were carried out over three days as follows: 9 analyses were carried out on the first day of the study and 3 further analyses on each of the following two days. The results obtained are expressed as a percentage of relative standard deviation for both repeatability and intermediate precision in respect of the peak area. As shown in Table 3, the greater values of standard deviation are lower than 7%, both in intra-day and inter-day analyses.

4. Conclusions

The extraction method developed enables extracts to be obtained from grape skin and seeds in a faster (15 min) and more reproducible manner for determination of phenolic compounds by means of HPLC. The use of methanol–water mixtures (65%) for the extraction of phenolic compounds has proven to be the best option in terms of solvents for MAE. Relevant interactions between the extraction variables analyzed were not found and, as such, the method can be adapted to new sample types with adjustments made independently of each of these variables. After the optimization step, the final values for the extraction variables were 50 mg mL−1 for ratio, 500 watts for microwave power, and 100% stirring speed. Finally, the intermediate precision of the method was determined for individual phenolics, and values of RSD below 7% were found for all compounds.

Author Contributions

Conceptualization, M.P. and G.F.B.; methodology, J.B., A.R.-R. and M.P.; validation, L.A. and A.L.; investigation, A.L., F.E.M. and L.A.; writing—original draft preparation, L.A., G.F.B. and A.L.; writing—review and editing, A.R.-R. and A.L.; supervision, J.B. and G.F.B.; project administration, M.P.; funding acquisition, A.R.-R. and M.P. All authors have read and agreed to the published version of the manuscript.

Funding

This research was co-financed by the 2014–2020 ERDF Operational Programme and by the Department of Economy, Knowledge, and Business at the University of the Regional Government of Andalusia. Project reference: FEDER-UCA18-108366.

Institutional Review Board Statement

Not applicable.

Informed Consent Statement

Not applicable.

Data Availability Statement

All data are included in the manuscript.

Conflicts of Interest

The authors declare no conflict of interest.

References

  1. Tsao, R. Chemistry and biochemistry of dietary polyphenols. Nutrients 2010, 2, 1231–1246. [Google Scholar] [CrossRef]
  2. Nayak, B.; Liu, R.H.; Tang, J. Effect of processing on phenolic antioxidants of fruits, vegetables, and grains—A review. Crit. Rev. Food Sci. Nutr. 2015, 55, 887–919. [Google Scholar] [CrossRef] [PubMed]
  3. Cory, H.; Passarelli, S.; Szeto, J.; Tamez, M.; Mattei, J. The Role of Polyphenols in Human Health and Food Systems: A Mini-Review. Front. Nutr. 2018, 5, 87. [Google Scholar] [CrossRef] [PubMed] [Green Version]
  4. Unterkofler, J.; Muhlack, R.A.; Jeffery, D.W. Processes and purposes of extraction of grape components during winemaking: Current state and perspectives. Appl. Microbiol. Biotechnol. 2020, 104, 4737–4755. [Google Scholar] [CrossRef]
  5. Flamini, R.; Mattivi, F.; De Rosso, M.; Arapitsas, P.; Bavaresco, L. Advanced knowledge of three important classes of grape phenolics: Anthocyanins, stilbenes and flavonols. Int. J. Mol. Sci. 2013, 14, 19651–19669. [Google Scholar] [CrossRef]
  6. Beres, C.; Costa, G.N.S.; Cabezudo, I.; da Silva-James, N.K.; Teles, A.S.C.; Cruz, A.P.G.; Mellinger-Silva, C.; Tonon, R.V.; Cabral, L.M.C.; Freitas, S.P. Towards integral utilization of grape pomace from winemaking process: A review. Waste Manag. 2017, 68, 581–594. [Google Scholar] [CrossRef] [PubMed]
  7. Kammerer, D.R.; Schieber, A.; Carle, R. Characterization and recovery of phenolic compounds from grape pomace—A review. J. Appl. Bot. Food Qual. 2005, 79, 189–196. [Google Scholar]
  8. Gutiérrez-Escobar, R.; Aliaño-González, M.J.; Cantos-Villar, E. Wine polyphenol content and its influence on wine quality and properties: A review. Molecules 2021, 26, 718. [Google Scholar] [CrossRef]
  9. Del Fresno, J.M.; Morata, A.; Loira, I.; Escott, C.; Suárez Lepe, J.A. Evolution of the Phenolic Fraction and Aromatic Profile of Red Wines Aged in Oak Barrels. ACS Omega 2020, 5, 7235–7243. [Google Scholar] [CrossRef] [Green Version]
  10. Pecyna, P.; Wargula, J.; Murias, M.; Kucinska, M. More than resveratrol: New insights into stilbene-based compounds. Biomolecules 2020, 10, 1111. [Google Scholar] [CrossRef]
  11. Fiod Riccio, B.V.; Fonseca-Santos, B.; Colerato Ferrari, P.; Chorilli, M. Characteristics, Biological Properties and Analytical Methods of Trans-Resveratrol: A Review. Crit. Rev. Anal. Chem. 2020, 50, 339–358. [Google Scholar] [CrossRef] [PubMed]
  12. Jackson, R. Wine Science; Academic Press: Cambridge, MA, USA, 2008; ISBN 9780123736468. [Google Scholar]
  13. Pedroza, M.A.; Salinas, M.R.; Alonso, G.L.; Zalacain, A. Oenological Applications of Winemaking By-Products; Academic Press: Cambridge, MA, USA, 2017; ISBN 9780128098714. [Google Scholar]
  14. Dwyer, K.; Hosseinian, F.; Rod, M. The Market Potential of Grape Waste Alternatives. J. Food Res. 2014, 3, 91. [Google Scholar] [CrossRef]
  15. Soceanu, A.; Dobrinas, S.; Sirbu, A.; Manea, N.; Popescu, V. Economic aspects of waste recovery in the wine industry. A multidisciplinary approach. Sci. Total Environ. 2021, 759. [Google Scholar] [CrossRef] [PubMed]
  16. Xavier Machado, T.D.O.; Portugal, I.B.M.; Padilha, C.V.D.S.; Ferreira Padilha, F.; dos Santos Lima, M. New trends in the use of enzymes for the recovery of polyphenols in grape byproducts. J. Food Biochem. 2021, 45. [Google Scholar] [CrossRef] [PubMed]
  17. Allcca-Alca, E.E.; León-Calvo, N.C.; Luque-Vilca, O.M.; Martínez-Cifuentes, M.; Pérez-Correa, J.R.; Mariotti-Celis, M.S.; Huamán-Castilla, N.L. Hot pressurized liquid extraction of polyphenols from the skin and seeds of vitis vinifera L. Cv. negra criolla pomace a peruvian native pisco industry waste. Agronomy 2021, 11, 866. [Google Scholar] [CrossRef]
  18. Pedroza, M.A.; Amendola, D.; Maggi, L.; Zalacain, A.; De Faveri, D.M.; Spigno, G. Microwave-Assisted Extraction of Phenolic Compounds from Dried Waste Grape Skins. Int. J. Food Eng. 2015, 11, 359–370. [Google Scholar] [CrossRef]
  19. Hong, N.; Yaylayan, V.A.; Vijaya Raghavan, G.S.; Paré, J.R.J.; Bélanger, J.M.R. Microwave-assisted Extraction of Phenolic Compounds from Grape Seed. Nat. Prod. Lett. 2001, 15, 197–204. [Google Scholar] [CrossRef] [PubMed]
  20. Jia, M.Z.; Fu, X.Q.; Deng, L.; Li, Z.L.; Dang, Y.Y. Phenolic extraction from grape (Vitis vinifera) seed via enzyme and microwave co-assisted salting-out extraction. Food Biosci. 2021, 40, 100919. [Google Scholar] [CrossRef]
  21. Krishnaswamy, K.; Orsat, V.; Gariépy, Y.; Thangavel, K. Optimization of Microwave-Assisted Extraction of Phenolic Antioxidants from Grape Seeds (Vitis vinifera). Food Bioprocess Technol. 2013, 6, 441–455. [Google Scholar] [CrossRef]
  22. Liazid, A.; Guerrero, R.F.; Cantos, E.; Palma, M.; Barroso, C.G. Microwave assisted extraction of anthocyanins from grape skins. Food Chem. 2011, 124, 1238–1243. [Google Scholar] [CrossRef]
  23. Belwal, T.; Ezzat, S.M.; Rastrelli, L.; Bhatt, I.D.; Daglia, M.; Baldi, A.; Devkota, H.P.; Orhan, I.E.; Patra, J.K.; Das, G.; et al. A critical analysis of extraction techniques used for botanicals: Trends, priorities, industrial uses and optimization strategies. TrAC Trends Anal. Chem. 2018, 100, 82–102. [Google Scholar] [CrossRef]
  24. Raks, V.; Al-Suod, H.; Buszewski, B. Isolation, Separation, and Preconcentration of Biologically Active Compounds from Plant Matrices by Extraction Techniques. Chromatographia 2018, 81, 189–202. [Google Scholar] [CrossRef] [PubMed]
  25. Sammani, M.S.; Clavijo, S.; Cerdà, V. Recent, advanced sample pretreatments and analytical methods for flavonoids determination in different samples. TrAC Trends Anal. Chem. 2021, 138. [Google Scholar] [CrossRef]
  26. Aliaño-González, M.J.; Ferreiro-González, M.; Espada-Bellido, E.; Carrera, C.; Palma, M.; Ayuso, J.; Barbero, G.F.; Álvarez, J.Á. Extraction of anthocyanins and total phenolic compounds from açai (Euterpe oleracea Mart.) using an experimental design methodology. part 3: Microwave-assisted extraction. Agronomy 2020, 10, 179. [Google Scholar] [CrossRef] [Green Version]
  27. Setyaningsih, W.; Saputro, I.E.; Carrera, C.A.; Palma, M.; Barroso, C.G. Multiresponse optimization of a UPLC method for the simultaneous determination of tryptophan and 15 tryptophan-derived compounds using a Box-Behnken design with a desirability function. Food Chem. 2017, 225, 1–9. [Google Scholar] [CrossRef] [PubMed]
  28. Setyaningsih, W.; Duros, E.; Palma, M.; Barroso, C.G. Optimization of the ultrasound-assisted extraction of melatonin from red rice (Oryza sativa) grains through a response surface methodology. Appl. Acoust. 2016, 103, 129–135. [Google Scholar] [CrossRef]
  29. Capriotti, A.L.; Cavaliere, C.; Foglia, P.; Piovesana, S.; Ventura, S. Chromatographic methods coupled to mass spectrometry detection for the determination of phenolic acids in plants and fruits. J. Liq. Chromatogr. Relat. Technol. 2015, 38, 353–370. [Google Scholar] [CrossRef]
  30. Liazid, A.; Barbero, G.F.; Azaroual, L.; Palma, M.; Barroso, C.G. Stability of anthocyanins from red grape skins under pressurized liquid extraction and ultrasound-assisted extraction conditions. Molecules 2014, 19, 21034–21043. [Google Scholar] [CrossRef] [PubMed] [Green Version]
  31. Liazid, A.; Schwarz, M.; Varela, R.M.; Palma, M.; Guillén, D.A.; Brigui, J.; Macías, F.A.; Barroso, C.G. Evaluation of various extraction techniques for obtaining bioactive extracts from pine seeds. Food Bioprod. Process. 2010, 88, 247–252. [Google Scholar] [CrossRef]
  32. Rostagno, M.A.; Palma, M.; Barroso, C.G. Pressurized liquid extraction of isoflavones from soybeans. Anal. Chim. Acta 2004, 522, 169–177. [Google Scholar] [CrossRef]
  33. Aliaño-González, M.J.; Espada-Bellido, E.; Ferreiro-González, M.; Carrera, C.; Palma, M.; Ayuso, J.; Álvarez, J.Á.; Barbero, G.F. Extraction of anthocyanins and total phenolic compounds from açai (Euterpe oleracea Mart.) using an experimental design methodology. part 2: Ultrasound-assisted extraction. Agronomy 2020, 10, 326. [Google Scholar] [CrossRef] [Green Version]
  34. Fernández-Marín, R.; Fernandes, S.C.M.; Andrés, M.A.; Labidi, J. Microwave-assisted extraction of curcuma longa l. Oil: Optimization, chemical structure and composition, antioxidant activity and comparison with conventional soxhlet extraction. Molecules 2021, 26, 1516. [Google Scholar] [CrossRef] [PubMed]
  35. Chmelová, D.; Škulcová, D.; Legerská, B.; Horník, M.; Ondrejovič, M. Ultrasonic-assisted extraction of polyphenols and antioxidants from Picea abies bark. J. Biotechnol. 2020, 314–315, 25–33. [Google Scholar] [CrossRef] [PubMed]
  36. Katsampa, P.; Valsamedou, E.; Grigorakis, S.; Makris, D.P. A green ultrasound-assisted extraction process for the recovery of antioxidant polyphenols and pigments from onion solid wastes using Box-Behnken experimental design and kinetics. Ind. Crops Prod. 2015, 77, 535–543. [Google Scholar] [CrossRef]
Figure 1. Mean (n = 3) of the standardized areas of chromatographic peaks for the extraction process using different solvents. Bars with different letters indicate significant differences (p < 0.05).
Agronomy 11 01527 g001
Figure 2. Estimated response surfaces for the total chromatographic area of phenolic compounds using the Box–Behnken central composite experimental design to represent the weight/volume ratio (mg/mL) compared to solvent (percentage of methanol in water) (A) and the effect of stirring speed compared to power (B).
Agronomy 11 01527 g002
Figure 3. Effect of extraction solvent (percentage of methanol in water) (A) and sample to solvent ratio (mg of sample mL−1 of solvent) (B) on the average (n = 3) standardized recovery of phenolic compounds. Bars with different letters indicate significant differences (p < 0.05).
Agronomy 11 01527 g003
Figure 4. Effect of extraction time (2–30 min) on the mean (n = 3) standardized recovery of phenolic compounds. Bars with different letters indicate significant differences (p < 0.05).
Agronomy 11 01527 g004
Table 1. Conditions used and results for the extractions in the experimental design.
ExperimentMethanol in Water (%)Ratio (mg mL−1)Power (W)Stirring (%)Standardized Average Area
16530500501.489
26530100500.758
33530300100−0.797
450301001000.680
5505030000.676
65010500500.379
7353010050−0.766
850305001000.895
935303000−1.287
105050500501.082
115030300500.613
1265303000−0.046
1350305000−1.059
14353050050−1.514
15501010050−0.118
1650301000−1.325
17503030050−0.752
186550300501.537
19355030050−0.8667
20351030050−1.462
21503030050−0.608
226510300500.382
235010300100−0.005
245050100500.578
2550503001001.049
2650103000−0.425
2765303001000.811
Table 2. Estimated regression coefficients and p-values for variables in the standardized area.
TermCoefficientp-Value
solvent0.9690.001
ratio0.4420.016
power0.1220.453
stirring0.5080.007
solvent*solvent−0.1230.613
ratio*ratio0.4480.082
power*power0.2320.345
stirring*stirring−0.0070.978
solvent*ratio0.1400.617
solvent*power0.3700.202
solvent*stirring0.0920.743
ratio*power0.0020.994
ratio*stirring−0.0120.967
power*stirring−0.0130.964
Table 3. Levels (mg Kg−1 dw), intra-day (n = 9) standard deviations, and inter-day (n = 9) standard deviations for the method carried out for the phenolic compounds analyzed.
Levels (mg kg−1)RepeatabilityIntermediate Precision
(+)-Catechin453.23.52.8
(−)-Epicatechin306.34.73.6
Caftaric acid 122.373.02.8
Dihydrokaempferol-glycoside 211.134.83.4
Quercetin-3-glucuronide 218.286.66.5
Quercetin-3- glucoside 220.093.66.6
Kaempferol-3
-Glucoside 2
11.104.64.8
1 As caffeic acid equivalents; 2 As rutin equivalents.
Publisher’s Note: MDPI stays neutral with regard to jurisdictional claims in published maps and institutional affiliations.

