Article

Producing Superphosphate with Sewage Sludge Ash: Assessment of Phosphorus Availability and Potential Toxic Element Contamination

1
Institute of Crop Science, University of Hohenheim, 70593 Stuttgart, Germany
2
Leitung Fachbereich C—Pflanzliche Erzeugung, Landwirtschaftskammer für das Saarland, 66450 Bexbach, Germany
3
College of Resources and Environment, Academy of Agricultural Sciences, Southwest University, Chongqing 400716, China
4
Interdisciplinary Research Center for Agriculture Green Development in Yangtze River Basin, Southwest University, Chongqing 400716, China
*
Author to whom correspondence should be addressed.
Agronomy 2021, 11(8), 1506; https://doi.org/10.3390/agronomy11081506
Submission received: 29 June 2021 / Revised: 27 July 2021 / Accepted: 27 July 2021 / Published: 29 July 2021

Abstract

:
Recovering and recycling phosphorus (P) from sewage sludge ash (SSA) for the purpose of P fertilizer production contributes to reducing the input of mined phosphate-minerals and closing of the P cycle. However, direct use of SSA as fertilizer is often a questionable strategy due to its low nutrient use efficiency. In addition, the environmental risk potential of utilizing SSA in agriculture is still unclear, in particular potential toxic element (PTE) contamination. In this study, a mixture of SSA and rock phosphate was used at lab-scale superphosphate (SP) production. P availability of the final product and PTE contamination (Cd, Cr, Cu, Zn, Pb, Ni) in soil and crop was investigated through maize (Zea mays L.) cultivation. Results showed that the application of SP that was produced by 25% SSA replacement did not affect the growth, P uptake, and PTE content in aboveground maize compared to the application of SP produced without SSA replacement. However, significant inputs of SP with SSA replacement may decrease the solid-soil solution partitioning of Cu, Ni and Pb in the long-term. Separation of municipal/industrial sludge and PTE removal technology are necessary to be implemented prior to the use of SSA as a secondary raw material in P-fertilizer production.

1. Introduction

Phosphate rock is the primary raw material for producing mineral phosphate fertilizers. Based on its economic importance and supply risk due to its non-substitutable and limited reserves around the world, it is regarded as one of the critical raw materials by the European Commission [1]. Additionally, it is recently identified to have high environmental hazard potential (EHP) concerning its raw material and energy demand [2]. Intrinsic potential toxic elements (PTEs) in phosphate rock also contribute to its high EHP as one of the indicators. In particular, heavy metals like Cadmium (Cd) and Uranium (U) become more bioavailable after the acidification process in the production of superphosphate (SP) or triple superphosphate (TSP) using phosphate rock. An evaluation of the phosphorus (P) fertilizer market in Germany determined that P fertilizers derived from phosphate rock may show Cd concentrations beyond the legal limits [3]. As natural P resources are decreasing, and the remaining resources show reduced quality, alternative P sources are needed to avoid a supply risk and the bioaccumulation of PTEs in humans through the food chain that involves phosphate rock-derived fertilizers and feed-additives.
In Europe, about 35% of total P loss from the consumption sector ends up in communal sewage sludge [4]. Since 2009, Germany has the largest share of annual municipal sewage sludge production in the EU with around 1.8 million tons, of which 60% was incinerated for disposal purposes [5]. The median P concentration of German sewage sludge ash (SSA) was 8%, which offers a great potential for an alternative P source for fertilizers [6]. However, the crystalline form of P in SSA from typical fluidized bed mono-combustion (800–900 °C) is usually a whitlockite-like calcium phosphate (Ca3(PO4)2), which is not immediately plant-available [7]. Several processes have been developed to recover P from SSA, including acid leaching and various thermochemical methods [8,9]. An alternative way without a need for additional equipment is to substitute rock phosphate (RP) by SSA in the production of superphosphate (SP) [10]. The original production process of superphosphate is relatively simple, where finely grounded rock phosphate is acidulated with sulphuric or phosphoric acid [11]. It has raised the possibility of recycling P from SSA via existing equipment and technologies to produce P fertilizers.
A previous study found reduced growth of young maize plants when fertilized with SP that produced from a mixture contained more than 11% of SSA, which may be due to the low P availability of sulphuric acid-treated SSA [10]. To raise the share of SSA in SP while maintaining the maize biomass production, an increased amount of concentrated sulphuric acid (95%) related to the P concentration of SSA is required.
However, recycling P from waste streams in agricultural production could be hazardous to product quality and soil health due to the transfer of PTEs. Although SSA incinerated in Germany show considerably lower Cd and U concentrations than phosphate rock, there is an indication for higher lead (Pb) and mercury (Hg) concentrations [6]. Little is known about the accumulation of these PTEs in plants when fertilizing with SSA or SSA-based products. Therefore, the aim of this work was, firstly, to evaluate the P availability of SP produced from the mixture of SSA and RP and, secondly, to investigate PTE contamination in soil and plants. P use efficiency and PTE accumulation in plant and soil by the application of SP produced from SSA and RP were compared with SP produced from RP and with Struvite (MgNH4PO4 · 6H2O), a sludge-derived precipitated salt with a consistently high P availability [12]. We hypothesized that SP produced from SSA and RP will be as effective as traditional SP at increasing growth and nutrient uptake of maize without enhanced PTE contamination risk to plants and soil.

2. Materials and Methods

2.1. Superphosphate Preparation and Analysis

The rock phosphate (RP) used in the preparation was predominantly fluor- and hydroxyapatite (Origin: Israel) with a P concentration of 11.8%. The sewage sludge ash (SSA) used for the replacement of RP was produced from the gasification process SÜLZLE KOPF Syngas® and had a P concentration of 8.9% [13]. Qualitative analysis of the mineral structure of the ash was determined through X-ray diffraction (XRD, Siemens D5000), where Ca3Mg3(PO4)2 comprised most of the crystalline P compounds [10]. Iron phosphate, hematite, and magnetite may also be present depending on the iron content in the sludge [13]. Two superphosphates (SPs) (SP-0 and SP-25) were produced on a laboratory scale by the method described by [10] with some modifications.
SP-0 was produced solely of RP. SP-25 was produced from a mixture containing 25% SSA and 75% RP. All the raw materials in the two SPs were finely ground using a rotating disc mill before the acid digestion with sulphuric acid (95%) (0.4 mL g−1 RP and 0.5 mL g−1 SSA). The resulting SPs were then dried at 105 °C and ground into fine particles (granule size < 0.5 mm ø).
Total P and PTE concentration (Cd, Cr, Cu, Ni, Pb, Zn) in the tested fertilizers were determined through aqua regia digestion [14] and measured by inductively coupled plasma-mass spectrometry (ICP-MS) (Cd, Cr, Cu, Ni, Pb, Zn) and inductively coupled plasma-optical emission spectrometry (ICP-OES) (P). Since the tested SSA was produced from sludge using an iron compound as a precipitating agent, and the main crystalline P compound of Struvite (STR) is MgNH4PO4 · 6H2O, determination of Fe and Mg concentrations in the fertilizers were also included and measured by ICP-OES.
Extraction of P in the fertilizers with water and neutral ammonium citrate (NAC) followed the method of [15]. P extraction with 2% citric acid followed the method of [16]. All extracted P were determined by ICP-OES. The extraction results were calculated as the ratio of extracted P concentration and total P concentration.

2.2. Greenhouse Experiment

Besides the two SPs, the treatments included a precipitated phosphate salt from sewage sludge Struvite (MgNH4PO4 · 6H2O) [17], RP, the SSA used in SP preparation and a zero P control (Control) (Table 1). In total, there were six fertilizer treatments with four replicates each.
The experiment was conducted in a greenhouse from 21 May to 31 July 2019. The average air temperature during the plant growth period was 30.6 °C at day and 20.2 °C at night. A low-P loamy clay soil (pHCaCl2 5.2, PCAL 10 mg kg−1) was mixed with 50% quartz sand to even further reduce its soil P level. The substrate was fertilized on dry matter basis with 120 mg P kg−1 using the different fertilizers (treatments), 120 mg N kg−1 as Ca(NO3)2 solution, and 150 mg K kg−1 as K2SO4 solution. All nutrients were mixed homogenously into the substrate.
5.5 kg of the prepared substrate was filled into a standard Mitscherlich-pot and brought to 65% of maximum water holding capacity. Three maize seeds (Zea mays var. Ricardinio) were placed 5 cm below the substrate surface and reduced to one plant per pot after emergence.
After ten weeks of growth (at silking stage), aboveground biomass was harvested and dried at 60 °C.

2.3. Plant P Content and P Use Efficiency

Plant dry matter was ground and digested according to the established wet-chemical extraction method [14]. Plant P concentration was determined using vanadate/molybdate as a coloring agent and measured by the spectrophotometer at 436 nm wavelength. Plant element concentrations were analyzed by ICP-OES (Fe, Mg) and ICP-MS (Cd, Cr, Cu, Ni, Pb, Zn) after aqua regia digestion. Plant P content was calculated as the product of plant P concentration and aboveground biomass dry weight.
The P use efficiency (%) of a fertilizer treatment was calculated as the difference of plant P content between the treatment and the No-P control divided by quantity of P applied with the fertilizer, which was 660 mg P per maize plant (Equation (1)):
PUE   ( % ) = Plant   P   content   ( treatment ) Plant   P   content   ( control )   mg   P   plant 1 × 100 %

2.4. Soil Sampling and Analysis

Soil was sampled directly after fertilization (at sowing) and at harvest for the analysis of plant-available P and PTEs concentration. Samples were air-dried and passed through a 2 mm mesh sieve. Soil plant-available P was characterized by Calcium-Acetate-Lactate (CAL) extraction according to the established method [18]. Soil bioavailable Mg, Cu, and Zn was characterized through Calciumchlorid/DTPA (CAT) extraction [19]. The broadly applied EDTA extraction was used to characterize soil bioavailable Cd, Cr, Cu, Fe, Ni, Pb, Zn [20]. After the extraction, the determination of each element was performed by flame atomic absorption spectroscopy (F-AAS).

2.5. Statistical Analysis

Statistical analysis was performed using the R environment for statistical computing and graphical presentation [21]. After verifying the homogeneity of variance, one-way analysis of variance (ANOVA) was conducted to test the effect of the fertilizer treatment. When a significant effect was found, multiple comparisons of treatments were performed using Tukey’s Honestly Significant Difference test.

3. Results

3.1. Phosphorus and PTE Content in Fertilizers

The P concentrations in both superphosphates (SP) were diluted by sulphuric acid. The 25% of rock phosphate (RP) replacement by sewage sludge ash (SSA) in SP-25 decreased its P concentration compared to SP-0 (no RP replacement). SP-25 had a similar Mg concentration as SP-0, but a larger Fe/P ratio (Table 1). The PTE mass concentrations in the tested P fertilizers were shown in Table 2. The maximum limits of PTE concentrations in inorganic fertilizers according to the European Union (EU) and German Fertilizer Ordinance were also listed [22,23]. RP contained the highest Cd concentration (2.0 mg kg−1) among the tested fertilizers. SSA had the highest concentration of Cr, Cu, Ni, Pb, and Zn among the tested fertilizers and was the only fertilizer that exceeded the maximum concentration of Cu, Pb, Zn (EU regulation), and Ni (German Fertilizer Ordinance). The 25% replacement of RP by SSA in SP-25 resulted in significantly higher Cu, Pb, and Zn concentrations than in SP-0. However, Cd and Cr concentrations in SP-25 were less than the one in SP-0. The precipitated salt Struvite had the lowest concentration of all the listed PTEs.
Calculated mean inputs of the PTEs per kg P from the tested fertilizers were shown in Table 3. The RP replacement by 25% SSA in SP-25 production considerably increased Ni, Cu, Pb, and Zn input per kg P compared to SP-0.
The tested fertilizers showed great variations in P extracted with water, 2% citric acid and neutral ammonium citrate (NAC) relative to total P (Figure 1). For SP-0 and SP-25, water extracted more than half of their total P and organic acids extracted more than 75%. Struvite-P was almost fully extractable in citric acid but only a little of it was water-extractable. P in RP and SSA were not extractable in water, while SSA had higher P fractions that were extractable in organic acids than RP.

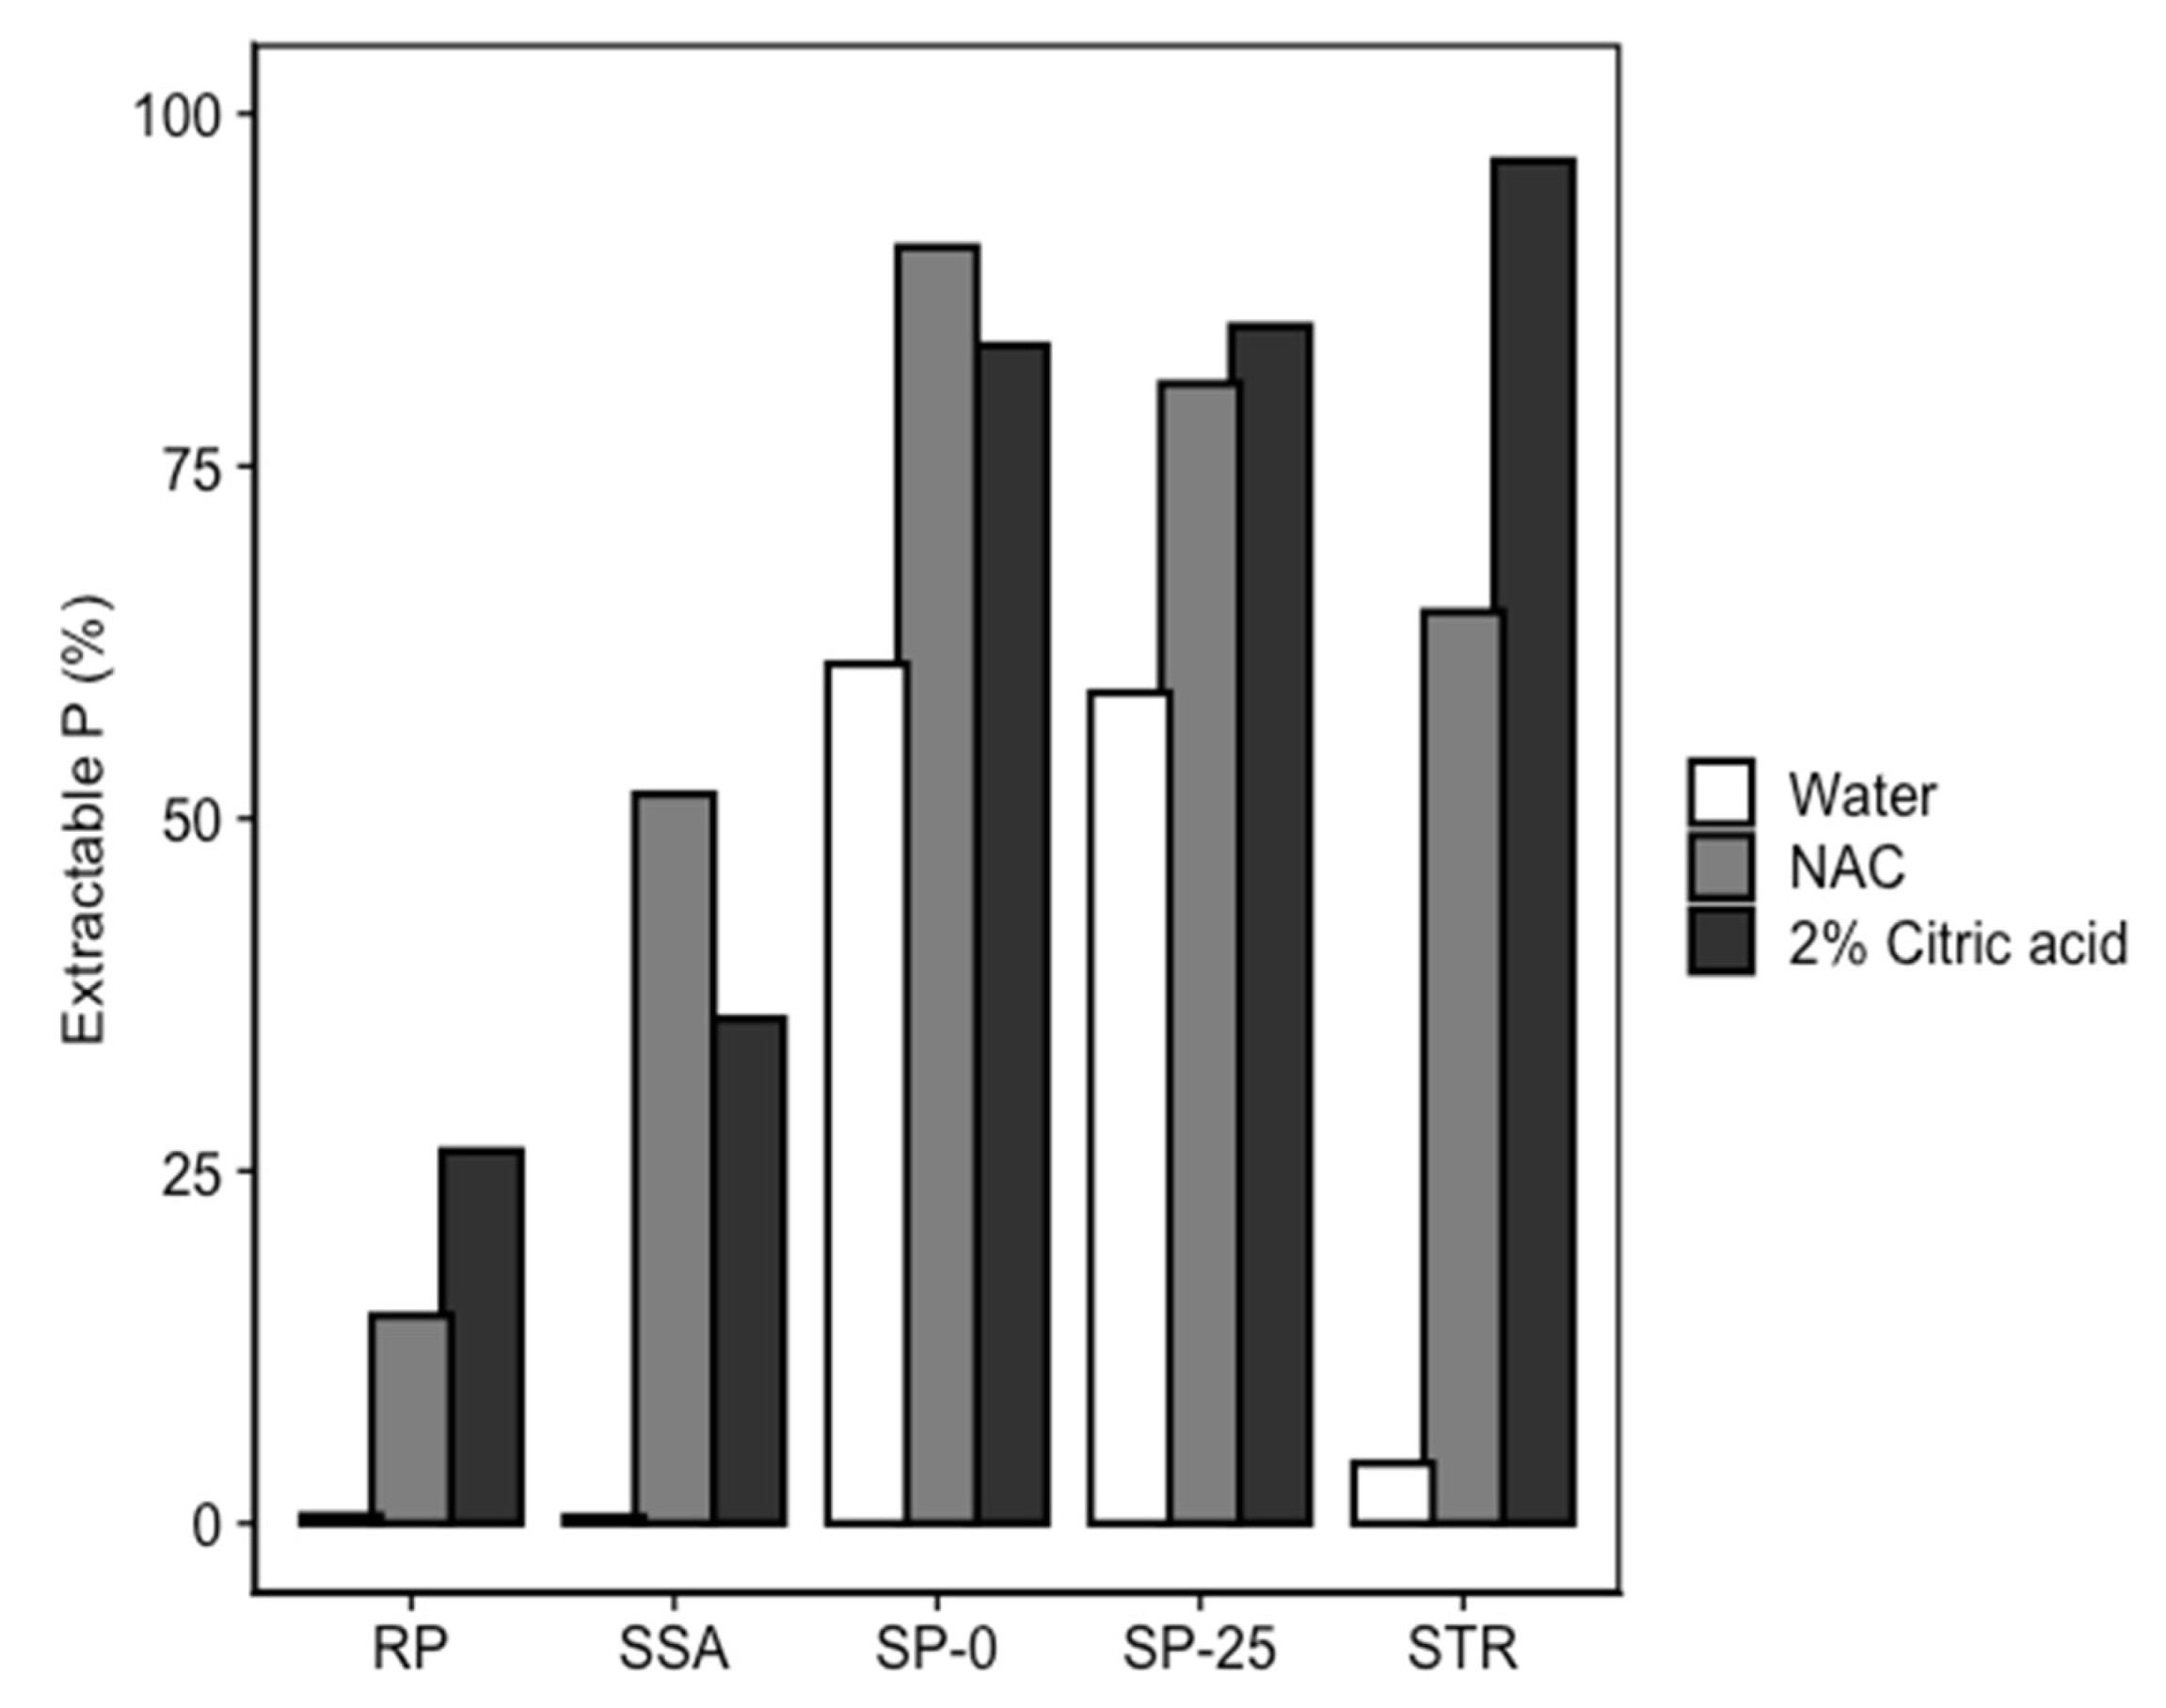
3.2. Bioavailability of P and PTEs in Fertilized Soil

Soil plant-available P characterized by CAL extraction at sowing varied under different fertilizer treatments (Figure 2). At sowing, STR had the highest value (44.6 mg kg−1), followed by SP-25 (34 mg kg−1) and SP-0 (27.1 mg kg−1). At harvest, soil plant-available P in STR, SP-25, and SP-0 treatments remained in the P class B (low), indicating elevated soil plant-available P pools after plant removal. In contrast, P input from SSA and RP did not contribute to plant-available P in soil as characterized by CAL extraction in class A (very low) both at sowing and at harvest.
Soil CAT-extractable Cu and Zn concentrations of all treatments were below the detection limit (1 mg kg−1). Soil CAT-extractable Mg concentration was not significantly different between pairs of treatments, where STR had the highest concentration (172.4 mg kg−1) (Table 4).
Only EDTA-extractable Fe concentrations were detectable in the substrate samples (Table 4), where SSA had a significantly higher concentration (220 mg kg−1) than other treatments. The concentration of EDTA-extractable Fe in the SP-25 treatment was not statistically different from that in SP-0.

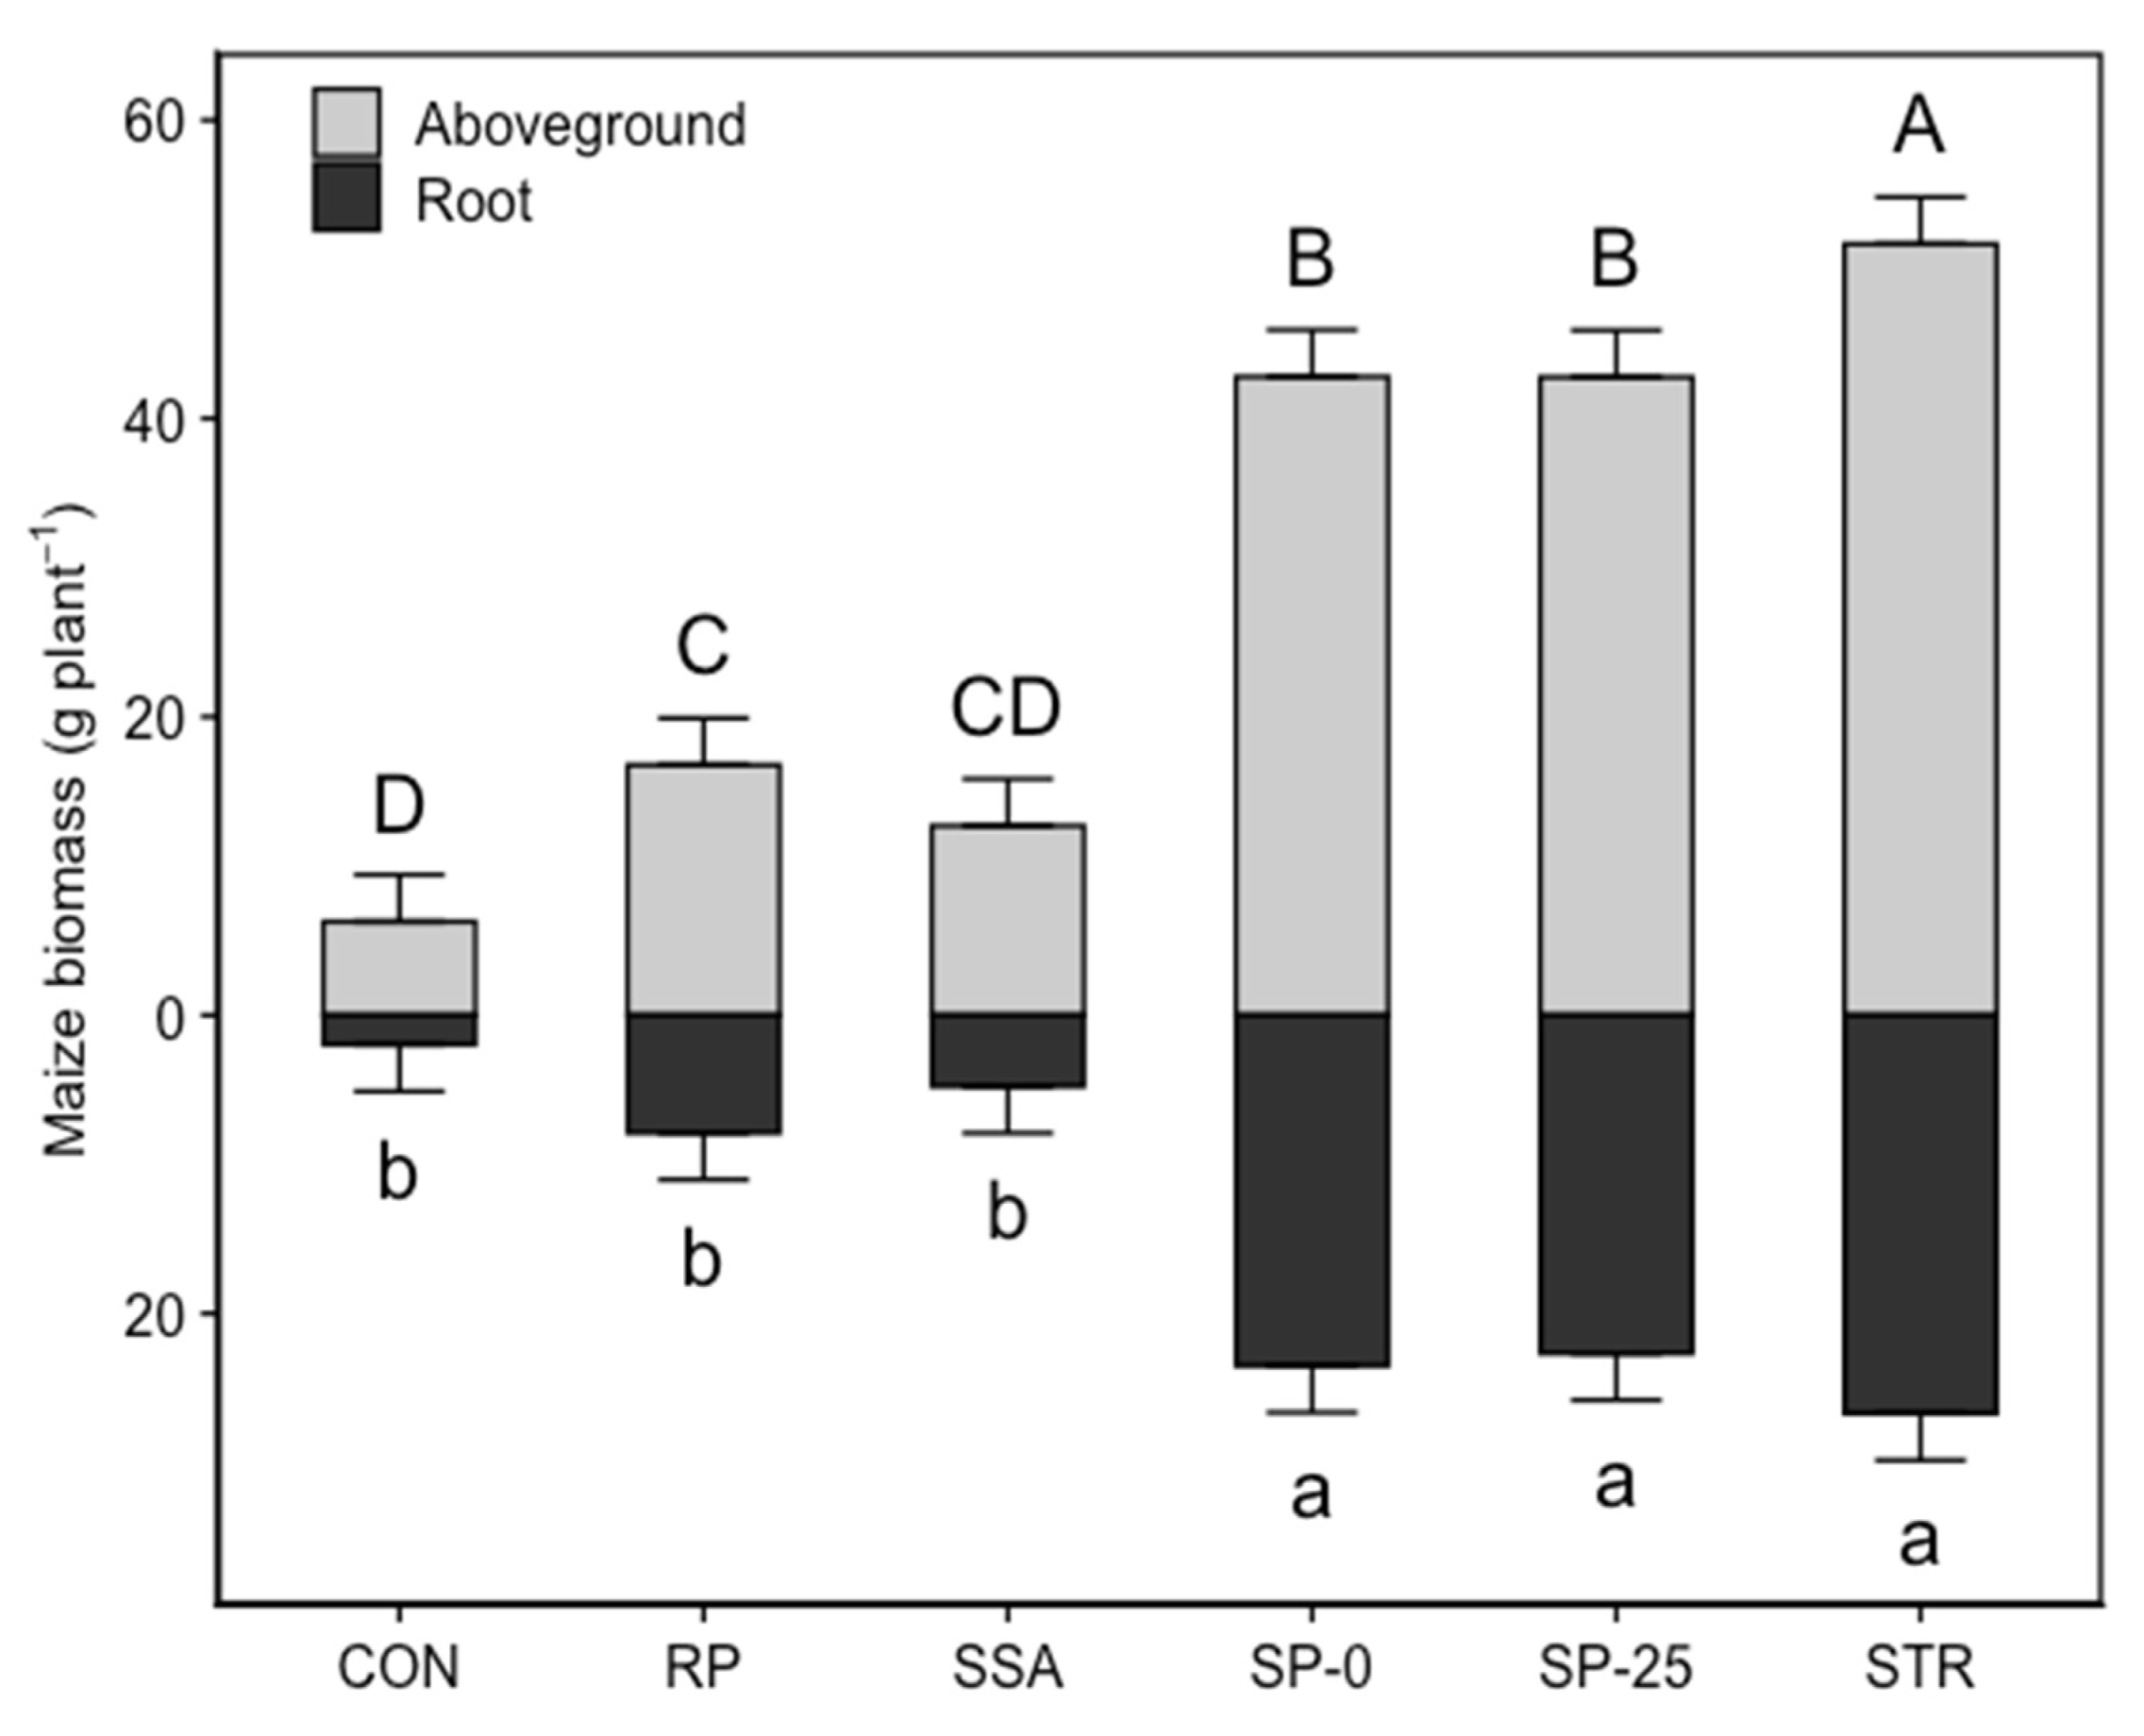
3.3. Maize Growth and Aboveground Biomass Nutrient (P, Mg, Fe) Content

The STR treatment obtained the highest maize aboveground biomass among other treatments (Figure 3). SP-0 and SP-25 had 20% less aboveground biomass and similar root biomass compared to STR. All treatments except SSA had a significantly higher aboveground biomass than No-P control treatment (CON).
The differences in aboveground biomass P concentrations were less pronounced than those in aboveground biomass P content (Table 5). STR had the highest P concentration of 1.1 mg kg−1, which was in the same range as SP-0, SP-25, and CON. In contrast, the aboveground biomass Mg and Fe concentrations indicated a dilution effect where the lowest nutrient concentration was found in the plant with the highest biomass (Table 6).
The aboveground biomass P content showed a similar trend to aboveground biomass (Table 5). The highest P content was found in the STR treatment, followed by SP-0 and SP-25, which generated 37% and 35% less P content, respectively, than STR. There was no significant difference among the P contents in the treatments RP, SSA, and CON. Shoot Mg and Fe contents followed the order of aboveground biomass, where STR had the most contents (Table 6). There was no significant difference between the shoot Mg and Fe contents in SP-0 and SP-25, which had considerably higher levels than in RP, SSA, and CON.
P use efficiency (PUE) of STR was the highest (5.26%) among the treatments (Table 7). Similar PUEs were found between SP-0 and SP-25. RP and SSA had nearly no efficiency on plant P accumulation.

3.4. Aboveground Biomass PTE Content under Different Fertilizer Treatments

In aboveground biomass Cu, Zn, and Ni concentrations, significant differences were found among the treatments (Table 6). STR, SP-0, and SP-25 resulted in less Cu, Zn and Ni concentrations than CON in aboveground maize biomass, indicating a dilution effect due to the relatively larger biomass. SP-0 and SP-25 were in the same range for the selected PTE concentrations. The maximum concentrations of Cd and Pb in animal feed according to the EU directive [25] were also listed in Table 6. The concentrations of Cd and Pb were in compliance to the regulatory limits. Cu and Zn content in aboveground maize biomass for six treatments showed the same trend as aboveground biomass. Cd, Cr, Ni, and Pb accumulation in plants of all treatments were less than 0.01 mg plant−1.

4. Discussion

4.1. Limitation of SSA as a Secondary Raw Material in P Fertilizer Production

The concentrations of Cd, Ni, and Pb in the tested sewage sludge ash (SSA) were greater than the data provided by the SSA producer KOPF SynGas © (Table S1), indicating the inconsistency of the element mass fractions in tested SSA. The PTE concentrations in sewage sludge can show considerable fluctuations with time, especially for Pb and Cd, which are further concentrated in SSAs [9]. It is suggested that monthly or annual mean concentration of PTEs is more suitable than single sampling to evaluate the contamination risk.
According to the current EU Fertilizing Product Regulation and the German Fertilizer Ordinance, only SSA that was used to produce SP-25 exceeded the maximum concentration of Cu, Ni, Pb, and Zn (Table 2). As SSA might be categorized as ‘thermal oxidation materials or derivates’ of the component material in the coming updated EU Fertilizing Product Regulation, the direct use of SSA as a P fertilizer or as a secondary raw material to produce fertilizer may therefore be forbidden. The relatively high Cu, Ni, Pb, and Zn concentrations was also observed in some SSAs produced in Germany due to the input of industrial sludge [6]. For many of the existing mono-incineration plants, further treatment is required to reduce contaminant concentrations before the use of SSAs in fertilizer production.
The precipitating agents used during wastewater treatment may also affect the feasibility of using SSA to produce P fertilizers. Iron or aluminum compounds are often used in the third purification stage of wastewater treatment to remove P by forming water-insoluble compounds, which remains in the sludge and concentrated in SSA. The SSA used in the SP production was from sludge, which was produced using an iron compound as a precipitating agent. A previous study found that, regardless of the acid concentration during acidulation, iron-based SSA yielded less processable products than aluminum-rich SSA on plant scale concerning the physical properties of delivered product [26]. Since SP-25 was produced in a small amount on lab scale, it was easy for the delivered product to be further processed to fine particles. Furthermore, iron-based SSA required less amounts of acid than aluminum-rich SSA for complete extraction of P, which implied less resource consumption to achieve high P availability [27].
Concerning the fertilizer P concentration, the value for SP-25 (61 mg g−1) is barely higher than the required value (52 mg g−1) for straight solid inorganic macronutrient fertilizer in the EU Fertilizing product regulation [23]. The low P content of SP-25 can be attributed to the low P content of SSA (89 mg g−1) and higher sulphuric acid input per unit P for SSA than for RP during the SP production process. One possible solution is partially replacing RP with SSA in triple-superphosphate production where phosphoric acid is used instead of sulphuric acid to reduce the PTE to P ratio. However, the resulting product was found to be difficult to process due to coagulation problems during the acidification of SSA using phosphoric acid [26]. Another possible solution is the separation of industrial and municipal sludge in the incineration plant. In Germany, 52% of SSA was produced from the mixture of municipal and industrial sludge, and most of them were incinerated in large facilities [28]. Mass flow management for separating municipal and industrial sludge in those facilities will increase the P content and reduce heavy metals in their SSA, which enables a wide use of SSA in fertilizer production.

4.2. P Availability of Produced Superphosphates

The soil–sand substrate itself can be categorized as very low in plant-available P according to the German fertilization recommendation (Class A, <10 mg PCAL kg−1) [24]. After fertilizer application at sowing, less than half of the total P input through the fertilizers was able to be extracted from the substrate (Figure 2). Although the P input in this study was extremely high (equivalent to 312 kg P ha−1), only STR and SP-25 built up soil plant-available P concentrations to an optimal level (Class C: 15–30 mg PCAL kg−1 soil) where a field soil does not need additional input from fertilization apart from the amount of P removed by the harvested crop. This increase of the CAL-extractable P fraction of the substrates after SP-0 and SP-25 application compared to the application of RP and SSA is consistent with the assumption that concentrated sulphuric acid enhances the P-availability of RP and SSA. The same range of CAL-extractable P in substrates applied with SP-0 and SP-25 and their extractable P fractions in water and organic acids indicated that two SPs had a similar pattern of P dissolution in the substrate after fertilizer application and after plant uptake.
P use efficiency of the treatments corresponded to the soil CAL-extractable P results. SSA and RP had almost no P use efficiency for plants, as expected from other studies [29,30]. The crystalline P-compounds in the tested SSA are mainly Ca3Mg3(PO4)2 [10], which are not immediately available for plant uptake. Acidulation of SSA with concentrated sulphuric acid may lead to the formation of plant-available mono-calcium phosphate, which shows some similarity to the acidulation of RP. Both SP-0 and SP-25 significantly increased maize biomass yield and P content compared to CON by the same order of magnitude. Hence, the 25% replacement of RP by SSA in SP-25 did not have an adverse impact on its plant-availability. In a previous study using the same SSA, only 11% SSA replacement in SP production achieved the maize biomass and P content to the same level as traditional SP, whereas increased SSA replacement significantly impaired the growth of maize [10]. The higher amount of acid relative to P in SSA (5.6 mL g−1 P) during our SP-25 preparation may have improved the P availability in our SP-25 compared to that SP, where 1.6 mL sulphuric acid was applied per g P of SSA. However, this increased input of sulphuric acid diluted the P content in the resulting product to 6.1%. Therefore, unless an increased P content in SSA is obtained, its application in SP production should be limited to a fraction that enables the required P concentration according to EU regulations to be reached.

4.3. PTE Content in Aboveground Biomass

The growing condition for maize in the greenhouse experiment can be considered as an extreme case for PTE accumulation due to the high fertilization dose (equivalent to 312 kg P ha−1) and the intensive rooting in the pot, especially for Cd, which is relatively mobile in soil compared to the other PTEs. Aboveground maize Cd concentration of the SP-25 treatment was below the detection limit, although its Cd input was the highest among all the treatments (19.3 mg kg−1 P). It is possible that most of the assimilated Cd in maize was concentrated in the root and not translocated to the shoot and grain, which is one of the plant defense mechanisms to prevent injuries induced by heavy metals [31,32]. Furthermore, the low pH of the substrate (pHCaCl2 5.6) may suppress Cd uptake by plants due to competition with other metallic cations and hydrogen ions, even though it favors the mobility of Cd in soil [33,34]. Zn in soil could also affect Cd’s mobility and its uptake by the plant by inhibiting the uptake of Cd by competing with the same membrane transporter [35,36]. In this study, Zn input per unit of P from SP-25 application was 10 times higher than from SP-0 (Table 3). However, EDTA- and CAT-extractable Zn in the substrate fertilized with SP-25 indicated low Zn bioavailability. Relatively low Zn bioavailability to plants and bio-accessibility to humans in ingested soil were also reported in SSA and in the leachate of SSA using 0.5 M sulphuric acid [37,38]. It is possible that, during the gasification of sewage sludge, ZnO was the dominant Zn species under the combustion temperature of 870 °C after desulfurization, which is not immediately available for plants [39]. This assumption needs to be further proved by X-ray diffraction analysis. Nevertheless, our plant and soil extraction results indicated that the excessive input of Zn from SP-25 to soil is unlikely to influence plant Cd uptake.
Pb accumulation in aboveground maize by the application of SP-25 was within the same level as SP-0. The relatively extensive input of Pb from SP-25 (477 mg kg−1 P) compared to SP-0 (157 mg kg−1 P) did not result in greater Pb accumulation in maize shoot, probably due to Pb’s low mobility in soil [34]. Only in severely Pb-contaminated soil Pb was found to be more highly concentrated in maize roots than in other plant parts, where 10–15% of Pb concentration in soil was transported to maize roots [40]. In the greenhouse experiment, the Pb input was much lower than the background value in a heavily contaminated soil. Thus, the Pb accumulation in maize root was of little importance in this study, and it is assumed that most of the Pb from SP-25 was retained in the soil.

4.4. PTE Accumulation in Soil

The accumulation of PTE in the soil is determined by the inputs and outputs via different sources. The anthropogenic input through atmospheric deposition and intensive fertilization in arable land could pose a risk to human health during the bioaccumulation along the food chain. The PTE to P ratio of a fertilizer is considered the main driving factor for contaminant flows in soil [41,42]. Results showed that SP-25 contributed the highest Cd input per unit P due to its relatively low P concentration (61 mg g−1). In the greenhouse experiment, the input of Cd, Cu, Ni, Pb, and Zn from SP-25 was larger than from SP-0. However, PTE solubility and bioavailability rather than the total input in the soil are the key factors in evaluating the potential risk. All of the analyzed PTEs (Cd, Cr, Cu, Pb, Ni, Zn) extracted by the CAT and EDTA method showed concentrations below the detection limit, indicating their low bioavailability in the soil.
The output of soil PTEs includes crop removal, surface runoff, and leaching. Results showed that only a small proportion of PTE output was derived from crop removal. Most of the PTE inputs were retained in soil inactively. Those remaining PTEs could be leached out or lost as runoff from the surface, which potentially may cause contaminations of water bodies. Leaching of PTEs from soil largely depends on its solid-soil solution partitioning, which is often related to soil properties like pH, soil organic matter and clay content, and total element concentration [43]. The low bioavailability of PTEs could result in a gradual accumulation in soil by repeated application of SP-25. It may further change the solid-soil solution partitioning due to enlarged soil total element concentration in the long term. This may be of concern especially for Cu, Ni and Pb, which had much higher inputs with SP-25 application compared to SP-0, but less for Zn. High P application in Zn-deficient soil could induce plant Zn deficiency in association with restricted root Zn uptake and arbuscular mycorrhizal colonization [44,45]. The Zn input from SP-25 may alleviate plant Zn deficiency by gradually increasing the soil solution Zn concentration.
Cd concentration in SP-25 and SP-0 were significantly different from each other, but their input difference was small (1.2 mg kg−1 P). In addition, the mean concentration of Cd in SP-25 (8.6 mg kg−1 P2O5) was much smaller than the concentration in three SPs sold in Germany (105 mg kg−1 P2O5) [3]. Ref. [42] also estimated less Cd input via SSA than via phosphate rock (RP) and triple superphosphate (TSP) after 200 years of fertilization (11 kg P ha−1 year −1) by a mass balance approach. The replacement of SSA in SP production may reduce the Cd contamination risk posed to the soil.

5. Conclusions

Results showed the agronomic potential of using sewage sludge ash (SSA) in superphosphate (SP) production. The application of SP-25 that was produced with a 25% replacement of rock phosphate (RP) by SSA led to a satisfactory aboveground biomass yield and nutrient content while keeping the PTE contamination in maize plants below the EU limit for animal feed. Nonetheless, the Pb, Cu, and Zn concentrations in tested SSA exceeded the maximum limit set by the EU fertilizing Products Regulation, which restricts its use as a secondary raw material in P fertilizer production.
The relatively high inputs of Cu, Ni and Pb by the application of SP-25 may decrease solid-soil solution partitioning and result in accumulation in soil and water bodies. Separation of municipal/industrial sludge may facilitate minimizing the PTE concentration in SSAs. Efficient removal of excessive Pb, Cu, and Zn in tested SSA might be achieved by advanced technology, such as thermochemical process with chlorides or Na/K additives at a temperature over 950 °C [9,46]. Separation of volatile heavy metals like Zn, Pb, Cd, and Hg via gas phase at a high bed temperature during the incineration of sewage sludge or post-treatment of SSA could increase the value and reduce the risk associated with SSA-based fertilizer [9]. In general, the use of SSA in P fertilizer production is promising to achieve a high P recovery from sewage sludge without compromising crop yield. However, long-term studies under field conditions are required to evaluate the P use efficiency and contamination risk of the application of SP-25 to soil and crops.

Supplementary Materials

The following are available online at https://www.mdpi.com/article/10.3390/agronomy11081506/s1, Table S1: Cadmium (Cd), chromium (Cr), nickel (Ni) and lead (Pb) concentration in SSA dry matter (mg kg−1). Data are provided by [13].

Author Contributions

Conceptualization, T.E.H. and Y.Y.; methodology, Y.Y.; formal analysis, J.K. and Y.Y.; investigation, J.K. and Y.Y.; writing—original draft preparation, Y.Y.; writing—review and editing, T.E.H., P.M.N., H.Y., W.Z., and T.M.; visualization, Y.Y.; supervision, X.C., and T.M.; funding acquisition, T.E.H., X.C., and T.M. All authors have read and agreed to the published version of the manuscript.

Funding

This research was funded by the Deutsche Forschungsgemeinschaft (DFG, German Research Foundation) 328017493/GRK 2366 (Sino-German International Research Training Group AMAIZE-P). Yawen You is funded by the Chinese Scholarship Council.

Institutional Review Board Statement

Not applicable.

Informed Consent Statement

Not applicable.

Data Availability Statement

The data presented in this study are available in insert article and Supplementary Material here.

Acknowledgments

The authors thank H. Ochott for assistance with nutrient analysis. This work was supported by the Deutsche Forschungsgemeinschaft (DFG, German Research Foundation) -328017493/GRK 2366 (Sino-German International Research Training Group AMAIZE-P).

Conflicts of Interest

The authors declare no conflict of interest.

References

  1. European Commission. Study on EU’s List of Critical Raw Materials, Factsheets on Critical Raw Materials; European Commission: Luxembourg, 2020. [Google Scholar]
  2. German Environmental Agency. Environmetal Criticality of Raw Materials; German Environmental Agency: Dessau-Roßlau, Germany, 2019.
  3. Kratz, S.; Schick, J.; Schnug, E. Trace Elements in Rock Phosphates and P Containing Mineral and Organo-Mineral Fertilizers Sold in Germany. Sci. Total Environ. 2016, 542, 1013–1019. [Google Scholar] [CrossRef] [PubMed]
  4. Van Dijk, K.C.; Lesschen, J.P.; Oenema, O. Phosphorus Flows and Balances of the European Union Member States. Sci. Total Environ. 2016, 542, 1078–1093. [Google Scholar] [CrossRef]
  5. Eurostat. Sewage Sludge Production and Disposal from Urban Wastewater (in Dry Substance (d.s)); European Commission: Luxembourg, 2021. [Google Scholar]
  6. Krüger, O.; Grabner, A.; Adam, C. Complete Survey of German Sewage Sludge Ash. Environ. Sci. Technol. 2014, 48, 11811–11818. [Google Scholar] [CrossRef]
  7. Donatello, S. Recycling and Recovery Routes for Incinerated Sewage Sludge Ash (ISSA): A Review. Waste Manag. 2013, 33, 2328–2340. [Google Scholar] [CrossRef]
  8. Donatello, S.; Tong, D.; Cheeseman, C.R. Production of Technical Grade Phosphoric Acid from Incinerator Sewage Sludge Ash (ISSA). Waste Manag. 2010, 30, 1634–1642. [Google Scholar] [CrossRef] [PubMed] [Green Version]
  9. Herzel, H.; Krüger, O.; Hermann, L.; Adam, C. Sewage Sludge Ash—A Promising Secondary Phosphorus Source for Fertilizer Production. Sci. Total Environ. 2016, 542, 1136–1143. [Google Scholar] [CrossRef]
  10. Hartmann, T.E.; Möller, K.; Meyer, C.; Müller, T. Partial Replacement of Rock Phosphate by Sewage Sludge Ash for the Production of Superphosphate Fertilizers. J. Plant Nutr. Soil Sci. 2020, 183, 233–237. [Google Scholar] [CrossRef] [Green Version]
  11. Leikam, D.F.; Achorn, F.P. Phosphate Fertilizers: Production, Characteristics, and Technologies. In Agronomy Monographs; Thomas Sims, J., Sharpley, A.N., Eds.; American Society of Agronomy, Crop Science Society of America, and Soil Science Society of America: Madison, WI, USA, 2015; Volume 46, pp. 23–50. ISBN 978-0-89118-269-6. [Google Scholar]
  12. Hertzberger, A.J.; Cusick, R.D.; Margenot, A.J. A Review and Meta-analysis of the Agricultural Potential of Struvite as a Phosphorus Fertilizer. Soil Sci. Soc. Am. J. 2020, 84, 653–671. [Google Scholar] [CrossRef]
  13. KOPF SynGas GmbH & Co. KG. Klärschlammverwertung: Nachhaltige Phosphornutzung Aus Vergasungsaschen; KOPF SynGas GmbH & Co. KG: Sulz am Neckar, Germany, 2018. [Google Scholar]
  14. Aufl. VDLUFA Verlag. VDLUFA Methode 2.1.3: Mikrowellenbeheitzer Druckaufschluss. In Handbuch Der Landwirtschaftlichen Versuchs-Und Untersuchungsmethodik (VDLUFA Methodenbuch); Band VII Umweltanalytik; Aufl. VDLUFA Verlag: Darmstadt, Germany, 2011; Volume 4. [Google Scholar]
  15. Aufl. VDLUFA Verlag. VDLUFA Methode 4.1.4: Bestimmung des wasser-und neutralammoniumcitratlöslichen Phosphats nach FRESENIUS-NEUBAUER, Extraktion. In Handbuch Der Landwirtschaftlichen Versuchs-Und Untersuchungsmethodik (VDLUFA Methodenbuch); Band II Die Untersuchung von Düngemitteln; Aufl. VDLUFA Verlag: Darmstadt, Germany, 1995; Volume 4. [Google Scholar]
  16. Aufl. VDLUFA Verlag. VDLUFA Methode 4.1.3: Bestimmung des citronensäurelöslichen Phosphats, Extraktion. In Handbuch Der Landwirtschaftlichen Versuchs- Und Untersuchungsmethodik (VDLUFA Methodenbuch); Band II Die Untersuchung von Düngemitteln; Aufl. VDLUFA Verlag: Darmstadt, Germany, 1995; Volume 4. [Google Scholar]
  17. Meyer, C.; Preyl, V.; Steinmetz, H.; Maier, W.; Mohn, R.-E.; Schönberger, H. The Stuttgart Process (Germany). In Phosphorus Recovery and Recycling; Ohtake, H., Tsuneda, S., Eds.; Springer: Singapore, 2019; pp. 283–295. ISBN 978-981-10-8031-9. [Google Scholar]
  18. Aufl. VDLUFA Verlag. VDLUFA Methode 6.2.1.1: Bestimmung von Phosphor und Kalium im Calcium-Acetat-Lactat-Auszug. In Handbuch Der Landwirtschaftlichen Versuchs-Und Untersuchungsmethodik (VDLUFA Methodenbuch); Band I Die Untersuchung von Böden; Aufl. VDLUFA Verlag: Darmstadt, Germany, 2012; Volume 4. [Google Scholar]
  19. Aufl. VDLUFA Verlag. VDLUFA Methode 6.4.1: Bestimmung von Magnesium, Natrium und den Spurennährstoffen Kupfer, Mangan, Zink und Bor im Calciumchlorid/DTPA-Auszug. In Handbuch Der Landwirtschaftlichen Versuchs-Und Untersuchungsmethodik (VDLUFA Methodenbuch); Band I Die Untersuchung von Böden; Aufl. VDLUFA Verlag: Darmstadt, Germany, 2002; Volume 4. [Google Scholar]
  20. Aufl. VDLUFA Verlag. VDLUFA Methode 7.6.1: Bestimmung von Spurennährstoffen und von umweltrelevanten Schwermetallen im EDTA-Auszug. In Handbuch Der Landwirtschaftlichen Versuchs-Und Untersuchungsmethodik (VDLUFA Methodenbuch); Band I Die Untersuchung von Böden; Aufl. VDLUFA Verlag: Darmstadt, Germany, 1997; Volume 4. [Google Scholar]
  21. R Core Team. R: A Language and Environment for Statistical Computing; R Foundation for Statistical Computing: Vienna, Austria, 2019. [Google Scholar]
  22. Düngemittelverordnung. Verordnung Über Das Inverkehrbringen von Düngemitteln, Bodenhilfsstoffen, Kultursubstraten Und Pflanzenhilfsmitteln (Düngemittelverordnung—DüMV); Bundesrepublik Deutschland: Berlin, Germany, 2012. [Google Scholar]
  23. European Council. Regulation (EU) 2019/1009 of the European Parliament and of the Council of 5 June 2019 Laying down Rules on the Making Available on the Market of EU Fertilising Products and Amending Regulations (EC) No 1069/2009 and (EC) No 1107/2009 and Repealing Regulation (EC) No 2003/2003; European Council: Brussels, Belgium, 2019; p. 114. [Google Scholar]
  24. Wiesler, F.; Appel, T.; Dittert, K.; Ebertseder, T.; Müller, T.; Nätscher, L.; Olfs, H.-W.; Rex, M.; Schweitzer, K.; Steffens, D.; et al. Phosphordüngung Nach Bodenuntersuchung Und Pflanzenbedarf; VDLUFA: Speyer, Germany, 2018. [Google Scholar]
  25. European Council. Directive 2002/32/EC of the European Parliament and of the Council of 7 May 2002 on Undesirable Substances in Animal Feed; European Council: Brussels, Belgium, 2002. [Google Scholar]
  26. Langeveld, K. Phosphorus Recovery into Fertilizers and Industrial Products by ICL in Europe. In Phosphorus Recovery and Recycling; Ohtake, H., Tsuneda, S., Eds.; Springer: Singapore, 2019; pp. 235–252. ISBN 978-981-10-8031-9. [Google Scholar]
  27. Ottosen, L.M.; Kirkelund, G.M.; Jensen, P.E. Extracting Phosphorous from Incinerated Sewage Sludge Ash Rich in Iron or Aluminum. Chemosphere 2013, 91, 963–969. [Google Scholar] [CrossRef]
  28. Krüger, O.; Adam, C. Recovery Potential of German Sewage Sludge Ash. Waste Manag. 2015, 45, 400–406. [Google Scholar] [CrossRef]
  29. Lemming, C.; Bruun, S.; Jensen, L.S.; Magid, J. Plant Availability of Phosphorus from Dewatered Sewage Sludge, Untreated Incineration Ashes, and Other Products Recovered from a Wastewater Treatment System. J. Plant Nutr. Soil Sci. 2017, 180, 779–787. [Google Scholar] [CrossRef]
  30. Severin, M.; Breuer, J.; Rex, M.; Stemann, J.; Ch, A.; Van den Weghe, H.; Kücke, M. Phosphate Fertilizer Value of Heat Treated Sewage Sludge Ash. Plant Soil Environ. 2014, 60, 555–561. [Google Scholar] [CrossRef]
  31. Fan, Y.; Li, Y.; Li, H.; Cheng, F. Evaluating Heavy Metal Accumulation and Potential Risks in Soil-Plant Systems Applied with Magnesium Slag-Based Fertilizer. Chemosphere 2018, 197, 382–388. [Google Scholar] [CrossRef]
  32. Vatehová, Z.; Malovíková, A.; Kollárová, K.; Kučerová, D.; Lišková, D. Impact of Cadmium Stress on Two Maize Hybrids. Plant Physiol. Biochem. 2016, 108, 90–98. [Google Scholar] [CrossRef] [PubMed]
  33. Hatch, D.J.; Jones, L.H.P.; Burau, R.G. The Effect of PH on the Uptake of Cadmium by Four Plant Species Grown in Flowing Solution Culture. Plant Soil 1988, 105, 121–126. [Google Scholar] [CrossRef]
  34. Nieder, R.; Benbi, D.K.; Reichl, F.X. Role of Potentially Toxic Elements in Soils. In Soil Components and Human Health; Springer: Dordrecht, The Netherlands, 2018; pp. 375–450. ISBN 978-94-024-1221-5. [Google Scholar]
  35. Hart, J.J.; Welch, R.M.; Norvell, W.A.; Kochian, L.V. Transport Interactions between Cadmium and Zinc in Roots of Bread and Durum Wheat Seedlings. Physiol. Plant. 2002, 116, 73–78. [Google Scholar] [CrossRef]
  36. Wiesler, F. Nutrition and Quality. In Marschner’s Mineral Nutrition of Higher Plants; Elsevier: Amsterdam, The Netherlands, 2012; pp. 271–282. ISBN 978-0-12-384905-2. [Google Scholar]
  37. Li, J.; Tsang, D.C.W.; Wang, Q.; Fang, L.; Xue, Q.; Poon, C.S. Fate of Metals before and after Chemical Extraction of Incinerated Sewage Sludge Ash. Chemosphere 2017, 186, 350–359. [Google Scholar] [CrossRef] [PubMed]
  38. Li, J.; Xue, Q.; Fang, L.; Poon, C.S. Characteristics and Metal Leachability of Incinerated Sewage Sludge Ash and Air Pollution Control Residues from Hong Kong Evaluated by Different Methods. Waste Manag. 2017, 64, 161–170. [Google Scholar] [CrossRef] [PubMed]
  39. Donatello, S.; Tyrer, M.; Cheeseman, C.R. EU Landfill Waste Acceptance Criteria and EU Hazardous Waste Directive Compliance Testing of Incinerated Sewage Sludge Ash. Waste Manag. 2010, 30, 63–71. [Google Scholar] [CrossRef]
  40. Armienta, M.A.; Beltrán, M.; Martínez, S.; Labastida, I. Heavy Metal Assimilation in Maize (Zea mays L.) Plants Growing near Mine Tailings. Environ. Geochem. Health 2020, 42, 2361–2375. [Google Scholar] [CrossRef]
  41. Möller, K.; Oberson, A.; Bünemann, E.K.; Cooper, J.; Friedel, J.K.; Glæsner, N.; Hörtenhuber, S.; Løes, A.-K.; Mäder, P.; Meyer, G.; et al. Chapter Four—Improved Phosphorus Recycling in Organic Farming: Navigating between Constraints. In Advances in Agronomy; Sparks, D.L., Ed.; Academic Press: Cambridge, MA, USA, 2018; Volume 147, pp. 159–237. [Google Scholar]
  42. Weissengruber, L.; Möller, K.; Puschenreiter, M.; Friedel, J.K. Long-Term Soil Accumulation of Potentially Toxic Elements and Selected Organic Pollutants through Application of Recycled Phosphorus Fertilizers for Organic Farming Conditions. Nutr. Cycl. Agroecosyst. 2018, 110, 427–449. [Google Scholar] [CrossRef] [Green Version]
  43. Groenenberg, J.E.; Römkens, P.F.A.M.; Comans, R.N.J.; Luster, J.; Pampura, T.; Shotbolt, L.; Tipping, E.; de Vries, W. Transfer Functions for Solid-Solution Partitioning of Cadmium, Copper, Nickel, Lead and Zinc in Soils: Derivation of Relationships for Free Metal Ion Activities and Validation with Independent Data. Eur. J. Soil Sci. 2010, 61, 58–73. [Google Scholar] [CrossRef] [Green Version]
  44. Broadley, M.; Brown, P.; Cakmak, I.; Rengel, Z.; Zhao, F. Function of Nutrients. In Marschner’s Mineral Nutrition of Higher Plants; Elsevier: Amsterdam, The Netherlands, 2012; pp. 191–248. ISBN 978-0-12-384905-2. [Google Scholar]
  45. Zhang, W.; Chen, X.-X.; Liu, Y.-M.; Liu, D.-Y.; Chen, X.-P.; Zou, C.-Q. Zinc Uptake by Roots and Accumulation in Maize Plants as Affected by Phosphorus Application and Arbuscular Mycorrhizal Colonization. Plant Soil 2017, 413, 59–71. [Google Scholar] [CrossRef]
  46. Adam, C.; Peplinski, B.; Michaelis, M.; Kley, G.; Simon, F.-G. Thermochemical Treatment of Sewage Sludge Ashes for Phosphorus Recovery. Waste Manag. 2009, 29, 1122–1128. [Google Scholar] [CrossRef] [PubMed]
Figure 1. Phosphorus (P) extracted (% of total P) with water, 2% citric acid and neutral ammonium citrate (NAC). For fertilizer abbreviations, see Table 1.
Agronomy 11 01506 g001
Figure 2. Mean Calcium-Acetate-Lactate extractable phosphorus (CAL-P) (mg kg−1) at sowing and at harvest. Class A–C are soil plant-available P classifications for fertilization recommendation in Germany (Class A: strong need for fertilizing to Class C; Class B: need for fertilizing to Class C; Class C: only fertilize the P removal by harvest) [24]. The same letters indicate no significant differences between the treatment (n = 4, Tukey’s HSD test (α = 0.05)). SEM = standard error of the mean. For fertilizer abbreviations, see Table 1.
Agronomy 11 01506 g002
Figure 3. Mean values of maize biomass (g plant−1) after 10 weeks of growth. The same letters indicate no significant differences between the treatment (n = 4, Tukey´s HSD test (α = 0.05)). Error bars indicate standard error of the mean. For fertilizer abbreviations, see Table 1.
Agronomy 11 01506 g003
Table 1. Fertilizer treatments and their abbreviations, production processes, and mean concentrations of phosphorus (P), nitrogen (N), magnesium (Mg), and iron to P ratios.
TreatmentAbbreviationProcessPNMgFe/P
mg g−1Molar Ratio
Sewage sludge ashSSAGasification89<1100.53
Rock phosphateRPMining118<1400.07
SP solely from RPSP-0RP digested with 95% H2SO473<1100.12
SP from 75% RP + 25% SSASP-2575% RP and 25% SSA digested with 95% H2SO461<190.34
StruviteSTREnforced P dissolution120521000.04
No P fertilizer additionCON-----
Table 2. Total concentrations of cadmium (Cd), chromium (Cr), copper (Cu), nickel (Ni), lead (Pb), and zinc (Zn) in dry matter (mg kg−1) (unless otherwise noted) of the tested fertilizers and designated maximum concentrations of above-mentioned element in fertilizers according to the EU regulation and German Fertilizer Ordinance [22,23]. The same letters indicate no significant differences between a pair of fertilizers (Tukey’s HSD test (α = 0.05)). Analysis of Variance: ** = p ≤ 0.01, *** = p ≤ 0.001. For fertilizer abbreviations, see Table 1.
FertilizerCdCrCuNiPbZn
(mg kg−1 P2O5)(mg kg−1)(mg kg−1)
SSA3 d0.6 d123 a641 a98.8 a129 a3189 a
RP7.4 c2.0 a45.4 c11.6 c25.5 b20.0 c97.3 c
SP-07.8 b1.3 b75.9 b9.2 c20.7 b11.4 d75.9 cd
SP-258.6 a1.2 c53.7 c104 b31.5 b29.1 b642 b
STR<0.06 1<0.06 18.4 d1.4 c5.0 b<0.06 110.7 d
Analysis of Variance********************
Maximum concentrations
EU regulation60.0 23.0 3 6001001201500
German Fertilizer Ordinance50.0 21.5 3 -80150-
1 below the detection limit; 2 if P2O5 is > 5%; 3 if P2O5 is < 5%.
Table 3. Calculated mean input of the elements cadmium (Cd), chromium (Cr), copper (Cu), nickel (Ni), lead (Pb), and zinc (Zn) per kg phosphorus (P) (mg kg−1 P). For fertilizer abbreviations, see Table 1.
FertilizerCdCrCuNiPbZn
(mg kg−1 P)
SSA7.2 1380 7207 1110 145035,832
RP16.6 382 97 214 168818
SP-018.11040 126 284 1571039
SP-2519.3881 1700 51647710,527
STR-70 11 42-89
Table 4. Mean values of CAT-extractable magnesium (Mg) and EDTA-extractable Iron (Fe) (mg kg−1) after fertilizer application. The same letters indicate no significant differences between the treatment (n = 4, Tukey´s HSD test (α = 0.05)). Analysis of Variance: *** = p ≤ 0.001, ns = not significant (p > 0.05). For fertilizer abbreviations see Table 1.
TreatmentCAT-ExtractionEDTA-Extraction
MgFe
(mg kg−1)
CON139.3137 bc
SSA145.6220 a
RP160.5139 bc
SP-0143.3161 bc
SP-25153.3166 b
STR172.4136 c
Analysis of Variancens***
Table 5. Mean values of maize aboveground biomass P concentration (mg kg−1) and P content (mg P plant−1) after 10 weeks of growth. The same letters indicate no significant differences between the treatments (n = 4, Tukey´s HSD test (α = 0.05)). For fertilizer abbreviations, see Table 1.
P Concentration (mg kg−1)P Content (mg P plant−1)
CON0.94 ab5.87 c
SSA0.82 b10.17 c
RP0.78 b13.06 c
SP-00.98 ab41.87 b
SP-250.99 ab42.44 b
STR1.1 a57.31 a
Table 6. Mean concentration (mg kg−1) and contents (mg plant−1) of magnesium (Mg), iron (Fe), cupper (Cu), zinc (Zn), cadmium (Cd), chromium (Cr), nickel (Ni) and lead (Pb) in maize aboveground biomass. The same letters indicate no significant differences between the treatment (n = 4, Tukey´s HSD test (α = 0.05)). Analysis of Variance (ANOVA): *** = p ≤ 0.001, ns = not significant (p > 0.05). For fertilizer abbreviations, see Table 1.
TreatmentMgFeCuZnCdCrNiPb
Concentration (mg kg−1)
CON2674 a53.61 a3.84 a14.44 a0.100.220.50 a0.32
SSA2055 b45.09 b3.14 b11.83 ab0.080.170.30 b0.23
RP1999 bc44.97 b2.67 bc10.55 bc0.070.280.24 b0.14
SP-01712 bc26.44 c2.06 d6.87 cd<0.050.110.18 b0.34
SP-251681 c27.06 c2.08 d9.36 bcd<0.050.170.25 b0.22
STR1987 bc27.79 c2.24 cd7.17 cd<0.050.280.19 b0.16
Directive 2002/32/EC----0.44--26.4
ANOVA************nsns***ns
Content (mg plant−1)
CON16.78 d0.34 d0.02 d0.09 b<0.01<0.01<0.01<0.01
SSA26.10 cd0.57 c0.04 cd0.15 b<0.01<0.01<0.01<0.01
RP33.53 c0.75 c0.04 c0.18 b<0.01<0.01<0.01<0.01
SP-073.27 b1.13 b0.08 b0.29 a<0.01<0.010.010.01
SP-2571.90 b1.16 b0.08 b0.40 a<0.01<0.010.010.01
STR102.73 a1.44 a0.11 a0.37 a<0.010.010.010.01
ANOVA************----
Table 7. P use efficiency (PUE) means ± standard deviation of different fertilizer treatments. For fertilizer abbreviations see Table 1.
RPSSASP-0SP-25STR
PUE (%)0.63 ± 0.110.38 ± 0.163.57 ± 0.503.47 ± 0.735.26 ± 0.84
Publisher’s Note: MDPI stays neutral with regard to jurisdictional claims in published maps and institutional affiliations.

