1. Introduction
On the light of recent international developments, such as the Sustainable Development Goals (SDGs) of the 2030 Agenda and the Paris Agreement, there is a need to monitor and report accurately any spatial variable with strong implications in food security, water usage and climate change. Rice fields are key for food security, providing staple food for almost half of the world’s population [
1]. They also have strong implications for natural resource management due to the large quantities of water needed in rice cultivation, having important effects in water demand and quality [
2]. In addition, the maintenance of flooded soils constitutes an important source of methane emissions [
3]. Thus, counting on reliable information on rice field distribution is crucial to assess the status of food security and environmental sustainability [
4] at a regional and global scale.
Recently, there have been dramatic changes in rice field distribution as a consequence of agricultural expansion [
5,
6,
7], urban development and shortage of resources due to climate change [
5,
8,
9]. In this sense there is an urgent need to map rice fields, and to develop methods for monitoring and updating rice field maps in order to account for rapid changes on rice fields distribution worldwide [
5,
10].
Traditionally, statistical crop data has been the most extended approach to monitoring rice fields distribution in many regions and at global scale [
11,
12], although they are insufficient in spatial and temporal detail [
13] and the data are rarely available in a timely manner [
14]. In response to this challenge, remote sensing techniques can rapidly provide up-to-date maps of rice areas at large scale [
6,
14,
15,
16]. Remote sensing images have been widely used to map rice fields in the last decades. In regions dominated by cloudy skies, microwave capacity to penetrate through clouds has been crucial to produce good-quality rice maps [
17]. However, their limited availability [
18] and costs [
19] have restricted their large scale usage. Optical remote sensing has been widely applied in numerous studies. The different methodologies developed in the last decades have included the use of several radiometric, spatial and temporal resolutions, combined with different classification schemes, research aims and validation intensities [
13,
20,
21,
22,
23,
24]. Optical remote sensing imagery was firstly applied in rice mapping in the 1980s, with approaches based on the band reflectance of single or multiple Landsat images, using supervised or unsupervised classifiers [
25,
26]. However, the Landsat long revisiting cycle, and consequently the lack of data availability in relation with cloud-induced noises, has limited its use [
27]. In the 2000s, the launching of the MODerate Resolution Imaging Spectroradiometer (MODIS) sensor, with daily revisit frequency and specific bands to detect water and vegetation, led to the development of improved methodologies for rice mapping. Those features were used to develop approaches based on time series and the phenological characteristics of rice [
21,
28]. Among them, threshold-based methodologies, relying on the relations among vegetation indices (VIs) in rice has been applied in multiples studies [
2,
15]. In particular, the substraction-based algorithm (SBA), based on the difference between Normalized Difference Vegetation Index (NDVI), Enhanced Vegetation Index (EVI) and the Land Water Algorithm (LSWI) has been applied for mapping rice fields in Asia [
2,
6,
21]. The best results were achieved in southern regions, with no snow cover that may complicate the classification process [
6]. Although this methodology has proved to be suitable in several regions, there are some limitations in its use, mainly in relation with cloud contamination and extreme rainfall events during planting dates, rice field size and wetland misclassification [
22,
27]. Additionally, its application in the Mediterranean Region showed high commission errors [
29].
Other approaches are based on the assessment of annual profiles of rice VIs with spectral-matching techniques (SMTs) [
13,
14,
30]. In many studies, this type of methodologies has been directly applied through the annual NDVI or EVI time series with meaningful results in South Asia [
28] and Bangladesh [
31]. However, these techniques based on NDVI or EVI annual profile could be potentially difficult to apply extensively due to the diversity in rice cropping systems [
27], and intra-class variability of temporal profiles could induce misclassification [
32]. In this regard, the use of other spectral indices, with potential to discriminate accurately rice phenological patterns from other land use patterns will be extremely advantageous.
Since intermittent flooding, vegetation periods and dry bare soil constitute distinctive phases in rice phenology, spectral indices sensitive to both vegetation and water are crucial for reproducing clearly rice phenological profiles [
33]. Although NDVI has shown sensitivity to soil wetness [
34], there are other indices combining Shortwave Infrared (SWIR) bands that have demonstrated their outstanding capacity to detect rice phenological events and hydroperiod [
4]. Spectral Shape Indices (SSI) combine the angles formed by consecutive bands to reproduce coarsely the behavior of a specific region of the spectrum [
35]. In particular, recent studies have successfully applied SSI combining the angles formed by Near Infrared (NIR) and SWIR bands to reproduce crop phenology and soil water content patterns [
36,
37]. The Shortwave Angle Slope Index (SASI) [
38], based on the angle and slope between NIR, SWIR1 and SWIR2, has showed strong potential to discriminate land cover types as well as soil and vegetation moisture content in laboratory. Murthy et al. [
39], assessed SASI potential to track surface wetness and rice transplantation pattern in irrigated areas and detected that SASI enables higher discrimination of rice classes compared to NDVI and NDWI. Das et al. [
36] studied the potential of SASI to determine soil dryness and wetness in crops through threshold values, and Tornos et al. [
37] demonstrated the utility of this index in determining specific phenological phases in rice, such as flooding and harvesting. Thus, SASI index could potentially show a distinct annual pattern for rice stages, including bare soil and flooded soil phases, which may be used to discriminate rice areas in a categorical manner.
Although many efforts have been made to map rice areas by using different algorithms and data sources, there is no availability of global or regional paddy rice maps produced with enough frequency [
27] to fulfil the monitoring needs at global level. The use of spectral indices time series with high frequency of images and full use of the information contained in annual profiles might overcome existing problems of cloudy images or bad observations [
6]. Additionally, the analysis of new spectral indices more appropriate for rice identification and their application in simple methodologies, with low requirements of field data, may contribute to provide accurate and updated data on rice field distribution and changes with the potential to provide harmonized information at global level for policy makers.
In this study, the main objective was to evaluate a quick, accurate and simple methodology, based on VIs time series, to identify rice fields and develop rice maps that can be timely updated in the long term and be potentially implemented at global level for land use monitoring purposes.
We have explored the potential of SASI annual time series to identify rice patterns and distinguish them from other land uses with similar characteristics, such as wetlands. The SASI performance has been compared with NDVI, a well-known index usually applied in rice mapping approaches, in two coastal locations and an inland location in the Mediterranean Region.
The specific objectives of this study were:
- -
To assess the annual SASI dynamics in rice fields in coastal and inland areas with different flooding management in the temperate region.
- -
Compare the performance of SASI and NDVI in mapping rice areas and discriminate them from other land uses with a quick-mapping method based on spectral indices annual profiles.
2. Materials and Methods
2.1. Study Sites
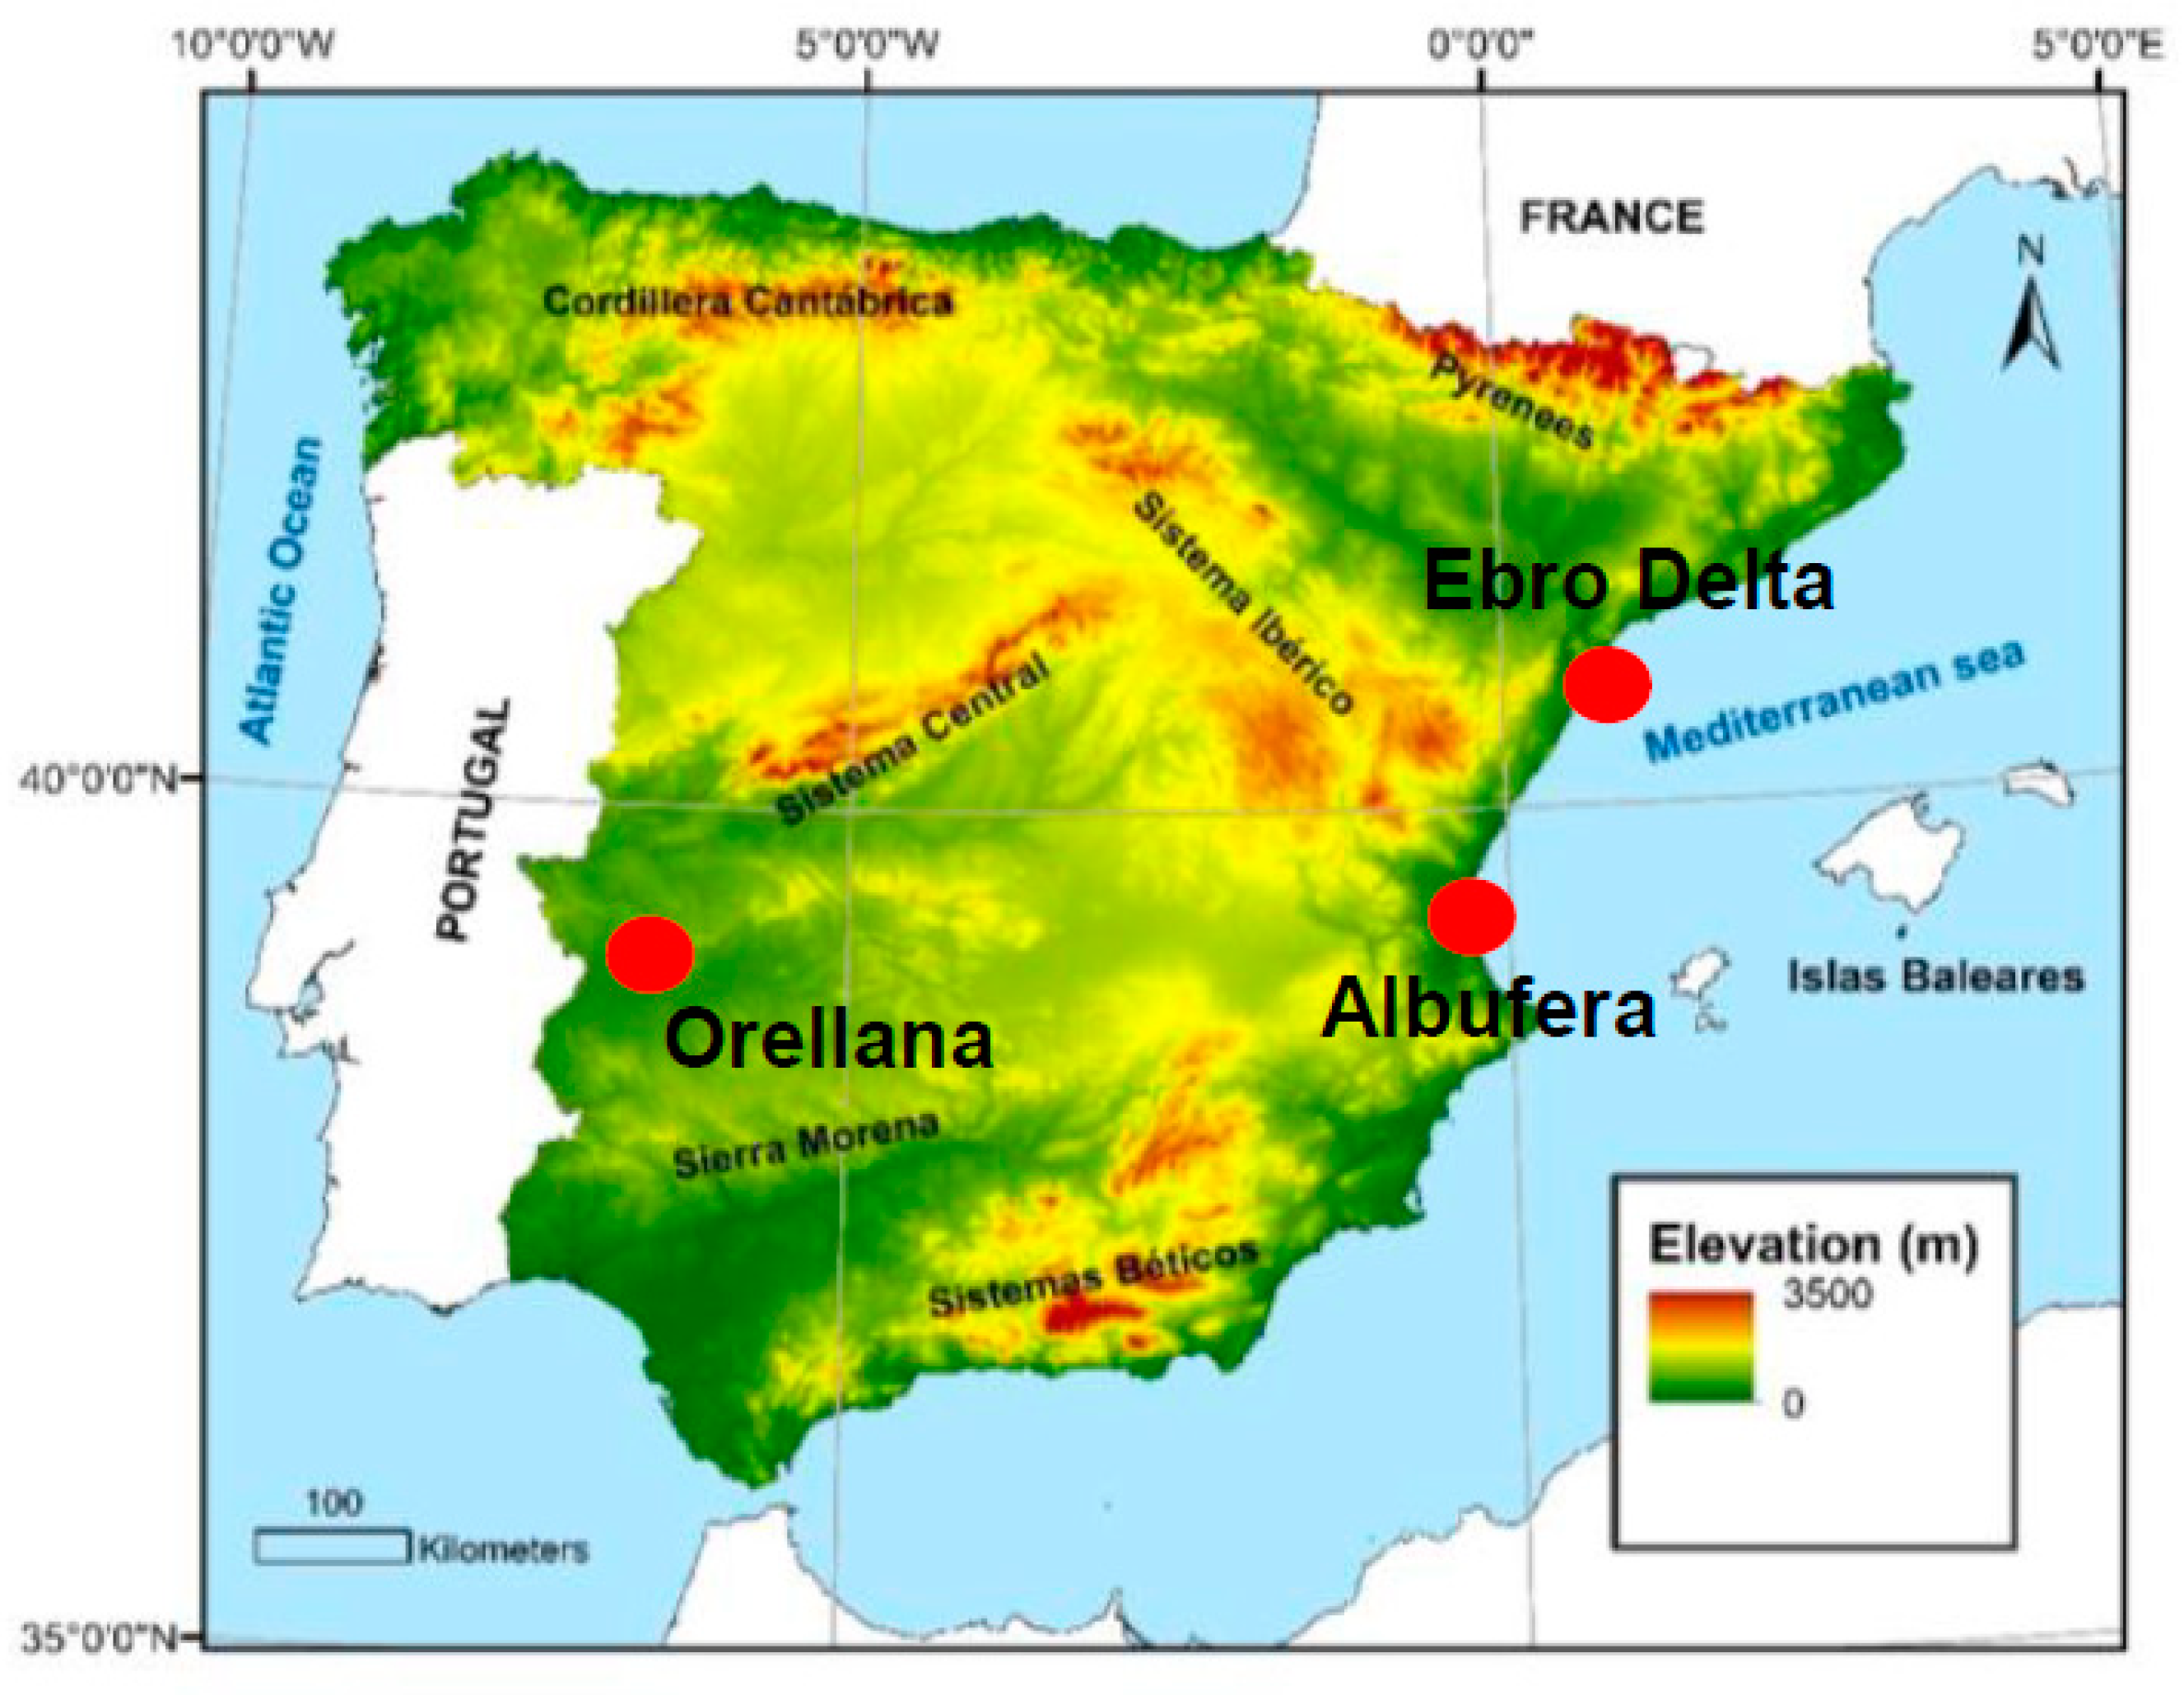
The Ebro Delta and the Albufera Natural Park rice areas are ecosystems with similar natural conditions. They are coastal rice paddies close to lagoons and natural wetlands in the Mediterranean Region. In both areas, the rice fields are kept flooded for most of the year, firstly during the rice growing period and secondly during the winter environmental flooding. The third study area, Orellana, is an inland irrigation district surrounded by other agricultural areas growing different crops, including rice.
The Ebro Delta, located in the northeast of Spain (
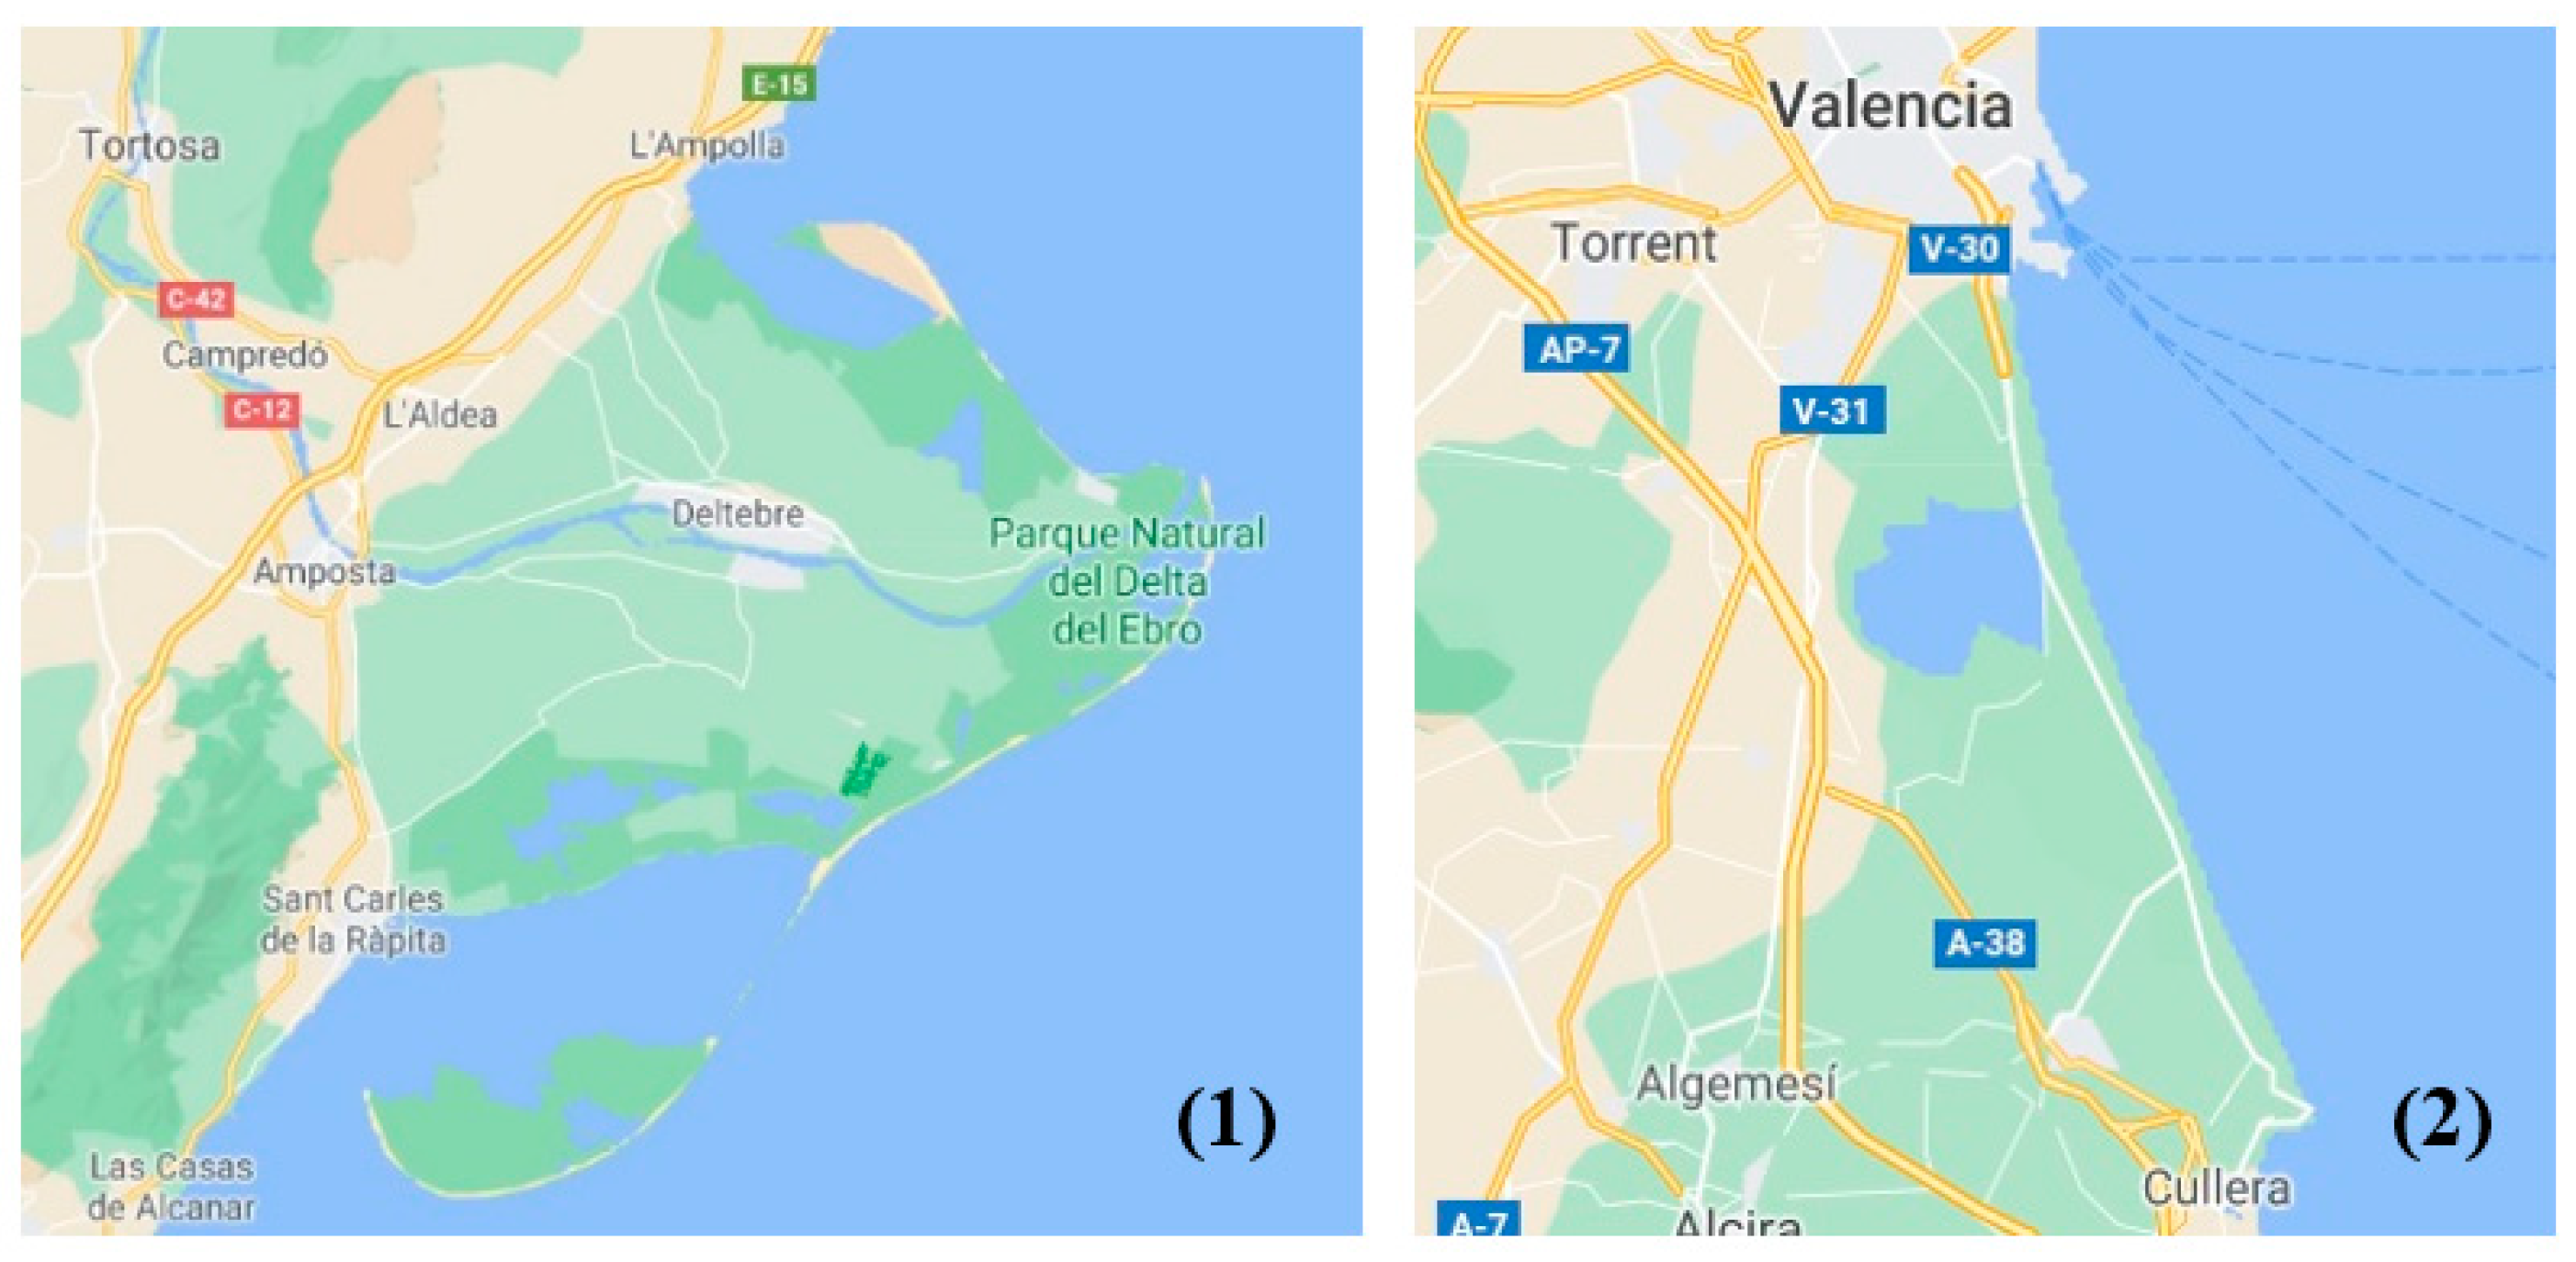
Figure 1), is a coastal region devoted to rice production and wetland protection. The climate is Mediterranean, with annual mean rainfall of 556 mm, an annual mean temperature of 18 °C and a dry summer. The total extension of the Delta is 32,000 ha, being 21,500 ha of them rice fields. Natural wetlands and lagoons cover a considerable area of the Delta, nearly 7700 ha. Two of the main lagoons are placed in the southern part of the Delta, while the other is in the northeastern part. Additionally, some urban areas are located in the Delta, Deltebre, in the middle of the Delta, is the most relevant. The Delta is surrounded by the Mediterranean Sea except for its western border (
Figure 2). This area is mainly devoted to agriculture and forestry.
The Albufera Natural Park is located in the eastern coast of Spain (
Figure 1). It is a 21,000 ha wetland ecosystem, including a mixture of approximately 14,500 ha of rice fields, a 2800 ha lagoon in the northern part and natural areas close to the coastline [
40]. The whole area is surrounded by urban areas and other crops (
Figure 2). The climate is Mediterranean, with similar features than those in the Ebro Delta. The precipitation is normally between 400–500 mm/year, and it is mostly concentrated in autumn and spring.
The rice phenological cycle and cropping system are similar in both areas. Rice fields are kept flooded for most of the year to avoid salinization from a saline aquifer and also to provide an adequate habitat for the protected fauna. The flooding of the fields begins the third week of April, following a strict schedule in the Ebro Delta, and more flexible in Albufera Natural Park. The rice is usually sown during the two first weeks of May, with plant emergence starting at the end of the month and reaching the heading date stage by late July. After this moment, the rice develops panicles while the vegetative growth ceases completely. The harvest takes place the first half of September, and is followed by a new flooding period with environmental purposes, starting the first week of October. The environmental winter flooding period takes place until the end of January and nearly one month is needed to completely dry the paddy fields. After that, the fields remain bare and dry until the beginning of the rice cycle in late April, except for some spring rainfall events.
The Orellana irrigated area is an inland agricultural zone close to Guadiana River, in the southwest of the Iberian Peninsula (
Figure 1). Although several crops are grown, some districts are mainly covered by rice fields with only occasional zones covered by other irrigated crops. The climate is Mediterranean with continental influences, lacking the effect of the coastal influences present in the Ebro Delta and the Albufera Natural Park. The study site is an 8500 ha district mainly covered by rice fields and surrounded by other districts with a variety of crops, including rice. The northern part is close to forests and shrublands. The flooding of the fields takes place between the last week of April and the second week of May, depending on weather conditions. The rice fields are kept flooded with a 5 cm water table for all the rice cycle, until the end of September. The phenological stages and dates are similar to those in the Albufera and the Ebro Delta, with some variations due to climatic differences. In this zone, however, the fields are drained after harvest and the soil is kept bare and dry until the next year.
2.2. Data Sources
This study was based on the MOD09A1 dataset for the year 2012. This product consists of an 8-day MODIS composite at 500-m spatial resolution. Accordingly, the 8-days composite includes the best observation from those taken in an 8-day period. The annual dataset of 46 images includes reflectance values for Bands 1–7: Blue (450 nm), Green (555 nm), Red (645 nm), NIR (860 nm), SWIR1 (1240 nm), SWIR2 (1640 nm) and SWIR3 (2130 nm). It also contains quality control flags, sensor zenith angles and observation dates per pixel. The dataset was downloaded from the NASA website (
https://lpdaac.usgs.gov/, accessed on 4 May 2021) and re-projected using the MODIS re-projection tool [
41] to UTM zone 30. Quality flags were decoded using LDOPE software [
42]. Outlier values from low-quality pixel were eliminated using MODIS quality data bands. Cloud-contaminated pixels were also removed based on the internal cloud algorithm flag of MOD09A1.005 500-m Surface Reflectance Data State QA. An outlier filter was also used to identify and remove values outside the range of the mean plus/minus twice the standard deviation within a five-date period window. Missing data were filled with the average of the previous and subsequent date values in the time series.
Rice masks, crops calendars, as well as descriptions of agricultural and water management practices in the three study areas were provided by water user associations, Centre for Hydrographic Studies (CEH-CEDEX), Confederación Hidrografica del Guadiana (Ministry of Agriculture and Fisheries, Food and Environment) and the Mediterranean Center for Environmental Studies (CEAM).
2.3. Computation of Spectral Indices
The, NDVI (Equation (1)), is a well-known vegetation index, based on the normalized difference between NIR and Red bands:
where
RNIR and
RRED are, respectively, the reflectance in the Near Infrared (860 nm) and Red (645 nm) regions of spectrum. It has been used to detect the heading date in rice [
43] and for monitoring rice phenology.
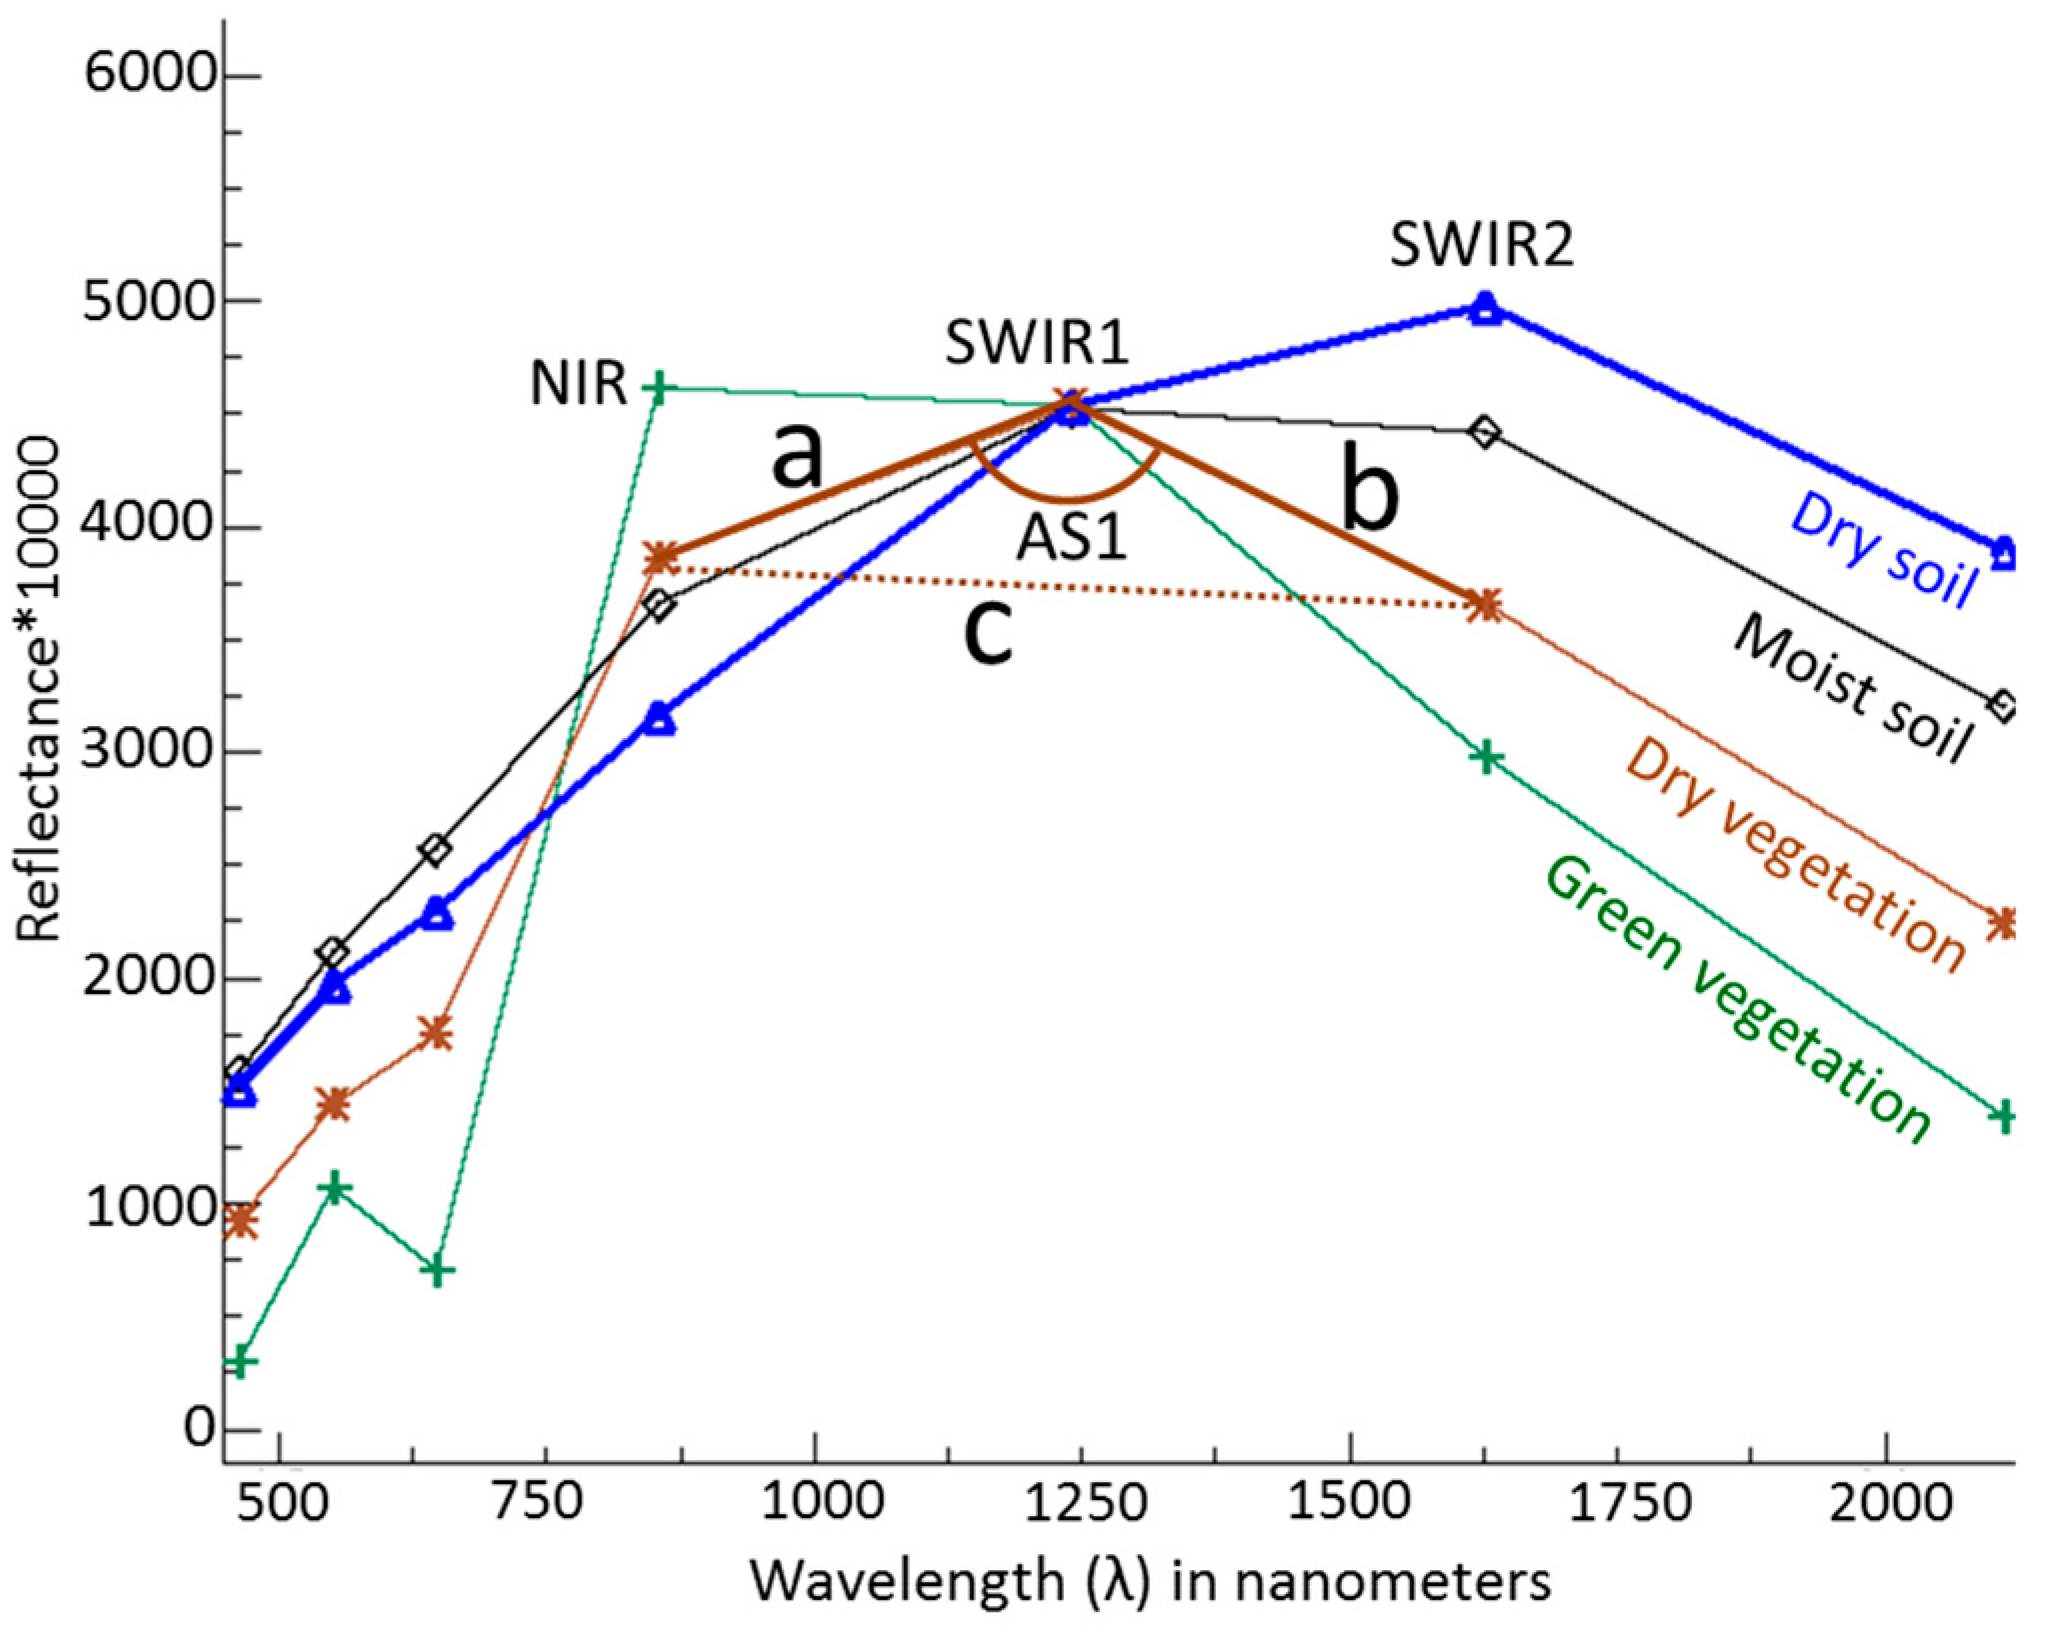
The second index, SASI, is a spectral shape index (SSI) originally developed to discriminate among dry and wet soil, and dry and green vegetation [
38]. It provides information about the spectral shape of the MODIS NIR-SWIR region (i.e., 860–1640 nm) (
Figure 3) by assessing the value of the angle centered at the SWIR1 spectral band (1240 nm). It is defined as the product of the angle at SWIR1 (AS1) [
44] and the slope of the line ‘c’ that links the
RNIR and
RSWIR2 vertices. The equations for calculating SASI are described in Equations (2)–(4):
where
a,
b,
c are the Euclidean distances between
RNIR,
RSWIR1 and
RSWIR2,
d is the difference between λ
SWIR2 and λ
NIR and
AS1 is the angle at the SWIR1 vertex. A more detailed explanation can be found in Khanna et al. (2007).
Slope takes negative values in spectra with high water content such as green vegetation and positive values for dry soils; vegetation residues and dry vegetation hold a slope close to zero. The value of AS1 [
44], is typically large (from 2 to 3.14 rad) for green vegetation and dry soils, and smaller (lower than 2 rad) for wet soils and dry vegetation. In line with this, the product of the angle and slope is large and positive for dry soils, and large and negative for green vegetation. For dry matter, SASI takes values close to zero, as both the angle and the slope are small. In wet soils, the index is positive but small due to a decrease in the value of AS1.
The time series for each reflectance band were compiled, and the indices were calculated for the whole study period using ENVI4.5.
2.4. Data Analysis
The methodology used in this work takes advantage of the specific rice annual dynamics showed in spectral indices time series, with distinct annual patterns in rice areas strongly different from those of any other land use.
A time series from a single typical rice pixel was selected as a reference profile to identify the standard NDVI and SASI intra-annual dynamics in each zone. To map rice fields, a profile similarity comparison method, was accomplished between reference profiles and each of the time series in the study area. In this method the NDVI and SASI time series were considered as vectors with a dimensionality equal to the number of observations, thus the difference in shape between two annual profiles is calculated as the angle between two vectors, i.e., the angular distance. This analysis was performed for the 2012 annual time series. This approach would potentially determine rice areas in a particular year. The angular distances values on a pixel basis were classified in four categories to allow a more comprehensive evaluation of the discrimination potential of each index to distinguish between rice and non-rice spectral profiles. The smaller angular distances indicated a high similarity with the reference profile and thus those pixels in the first category were identified as rice-fields, whereas larger angular distances were classified as non-rice pixels in the other three categories, indicating a different degree of similarity with rice profiles and potential misclassification.
The profile similarity comparison method used was the Spectral Angle Mapper (SAM) [
45] available in ENVI4.5.
2.4.1. Validation in the Ebro Delta
The identification of rice field pixels for the year 2012 was validated using a rice mask provided by the Ebro Delta Water Users Association. The pixels were classified into four categories. The rice mask was used to select the reference pixel and to establish the range of angular distances associated to rice pixels. The values obtained in the mask determined the threshold value of the first category (rice pixel). The other two threshold values for the other three categories, corresponding to non-rice pixels, were established with the same length of the first one. A confusion matrix was accomplished within an area of 1886 pixels (47,150 ha) in which 47.4% was occupied by rice fields. Other land uses in the area were natural wetlands, lagoons, other agricultural land, forest, urban areas and the sea.
2.4.2. Validation in the Albufera Natural Park
In order to assess the effectiveness of this methodology in other rice areas with similar ecological conditions, the same reference indices profiles and angular distances classification categories and threshold values from the Ebro Delta were applied to the Albufera Natural Park. The results of the mapping process were compared with an orthophoto of the Albufera rice paddy area and with crop surface statistics from this zone [
40].
2.4.3. Validation in Orellana
Due to the specific rice annual dynamics in Orellana (lacking the winter flooding period) site-specific reference profiles were selected. A rice mask for this district, provided by the Confederación Hidrográfica del Guadiana, was used for validation. Other rice fields belonging to different irrigation districts have not been included in the validation process. In this case the pixels were also classified into four categories. The first threshold value was also based on the results within the Orellana validation mask and the establishment of the rest of the threshold values followed the same methodology than the one described in the Ebro Delta. This irrigation district shows higher spatial variability, with rice fields intermingled with other irrigated crops.
3. Results
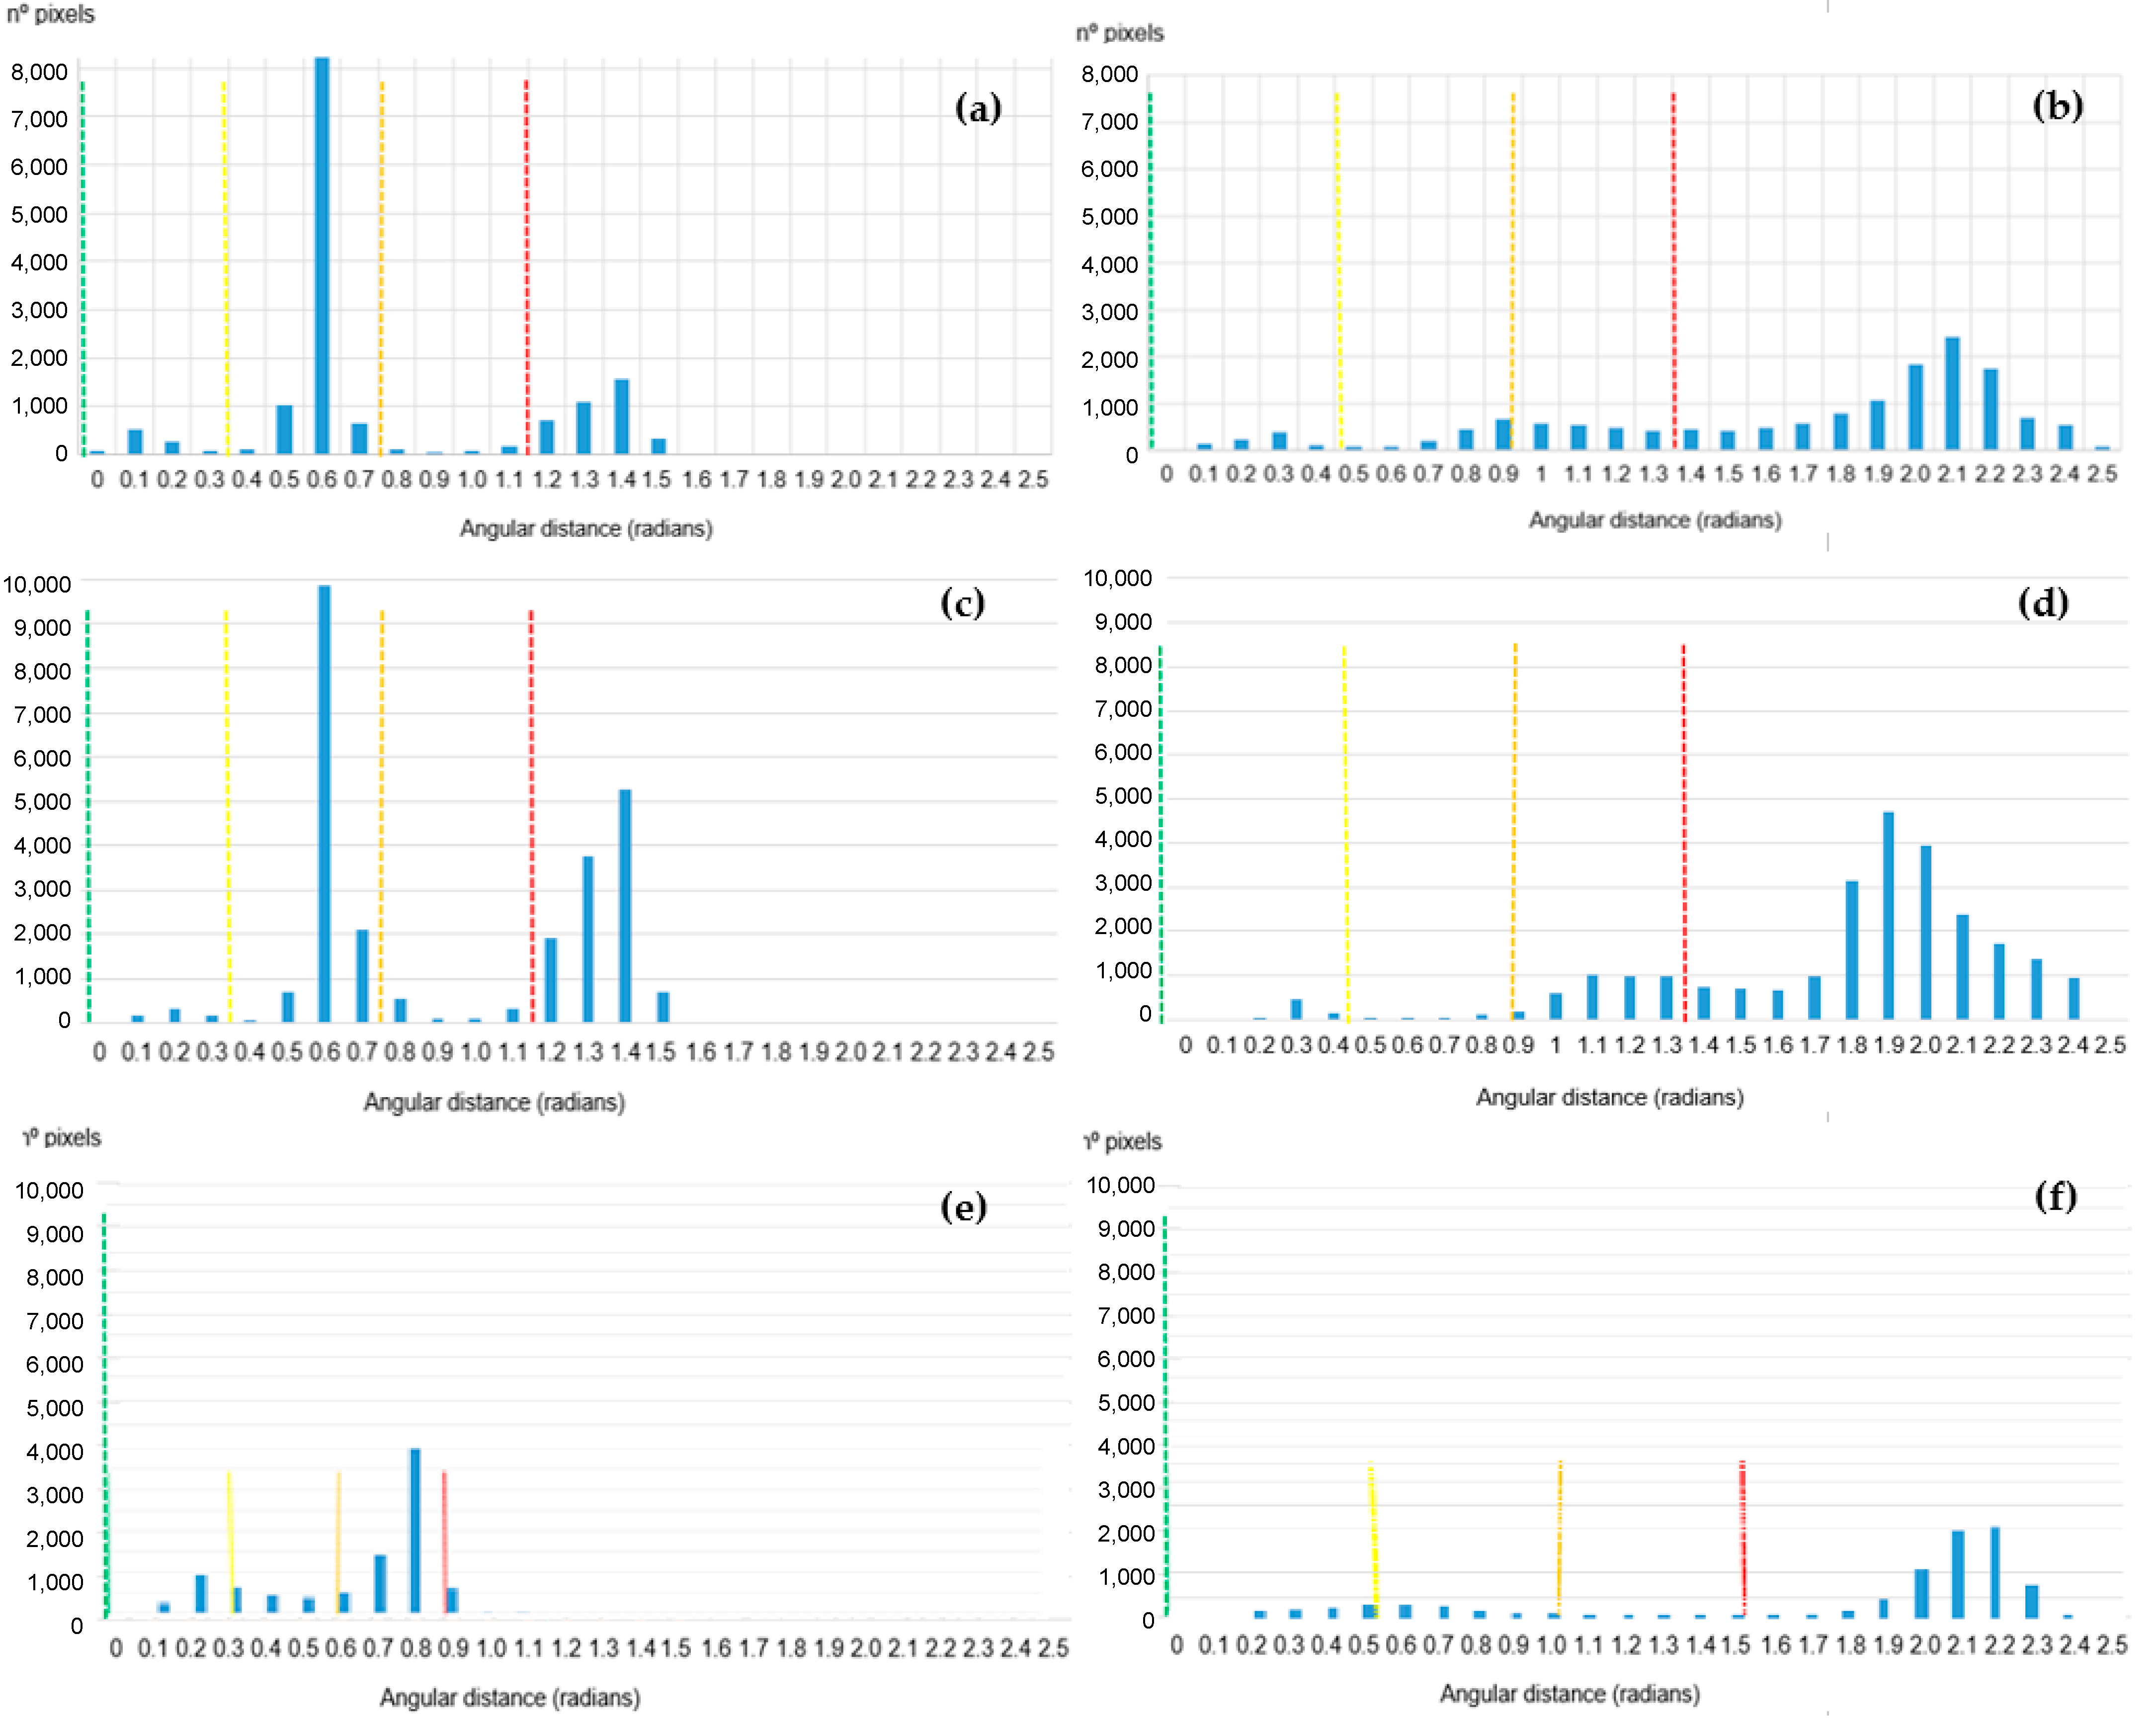
Figure 4 showed the histograms of angular distances between the reference rice profile and each one of the pixel profiles in the study sites. The lower angular distances were classified into three equal categories while large angular values were classified in a wider class.
In the Ebro Delta, the pixels located into the first class, ranging from 0 to 0.35 rad in NDVI (
Figure 4a) and to 0.45 rad in SASI (
Figure 4b), were identified as rice while the rest of the pixels in other categories corresponded to other land uses. The dynamic range of values in SASI was larger than in NDVI (
Figure 4b), with most of the non-rice pixels taking values between 1.4 and 2.5 rad.
The classification methodology developed for the Ebro Delta was applied in the Albufera Natural Park to test the potential of this procedure in other rice areas with similar ecological conditions. The annual time series of NDVI and SASI for 2012 were compared with the annual pattern obtained in a ground truth rice pixel in the Ebro Delta, and classified in the same manner (
Figure 4c,d).
In the Albufera case, the dynamic range of values in SASI was also wider in SASI than in NDVI. The pixels classified in the first category (rice pixels) showed higher angular distance values in comparison with the values obtained in the Delta in both histograms (
Figure 4c,d).
On the other hand, in Orellana, the annual profiles of NDVI and SASI were compared with a reference rice profile from the same area. The pixels were also classified in four categories, based on the results within the Orellana validation mask (
Figure 4e,f). As in the previous cases, angular distances dynamic range was higher in SASI than in NDVI (
Figure 4e,f), even in land uses with patterns similar to those of rice fields, such as irrigated crops.
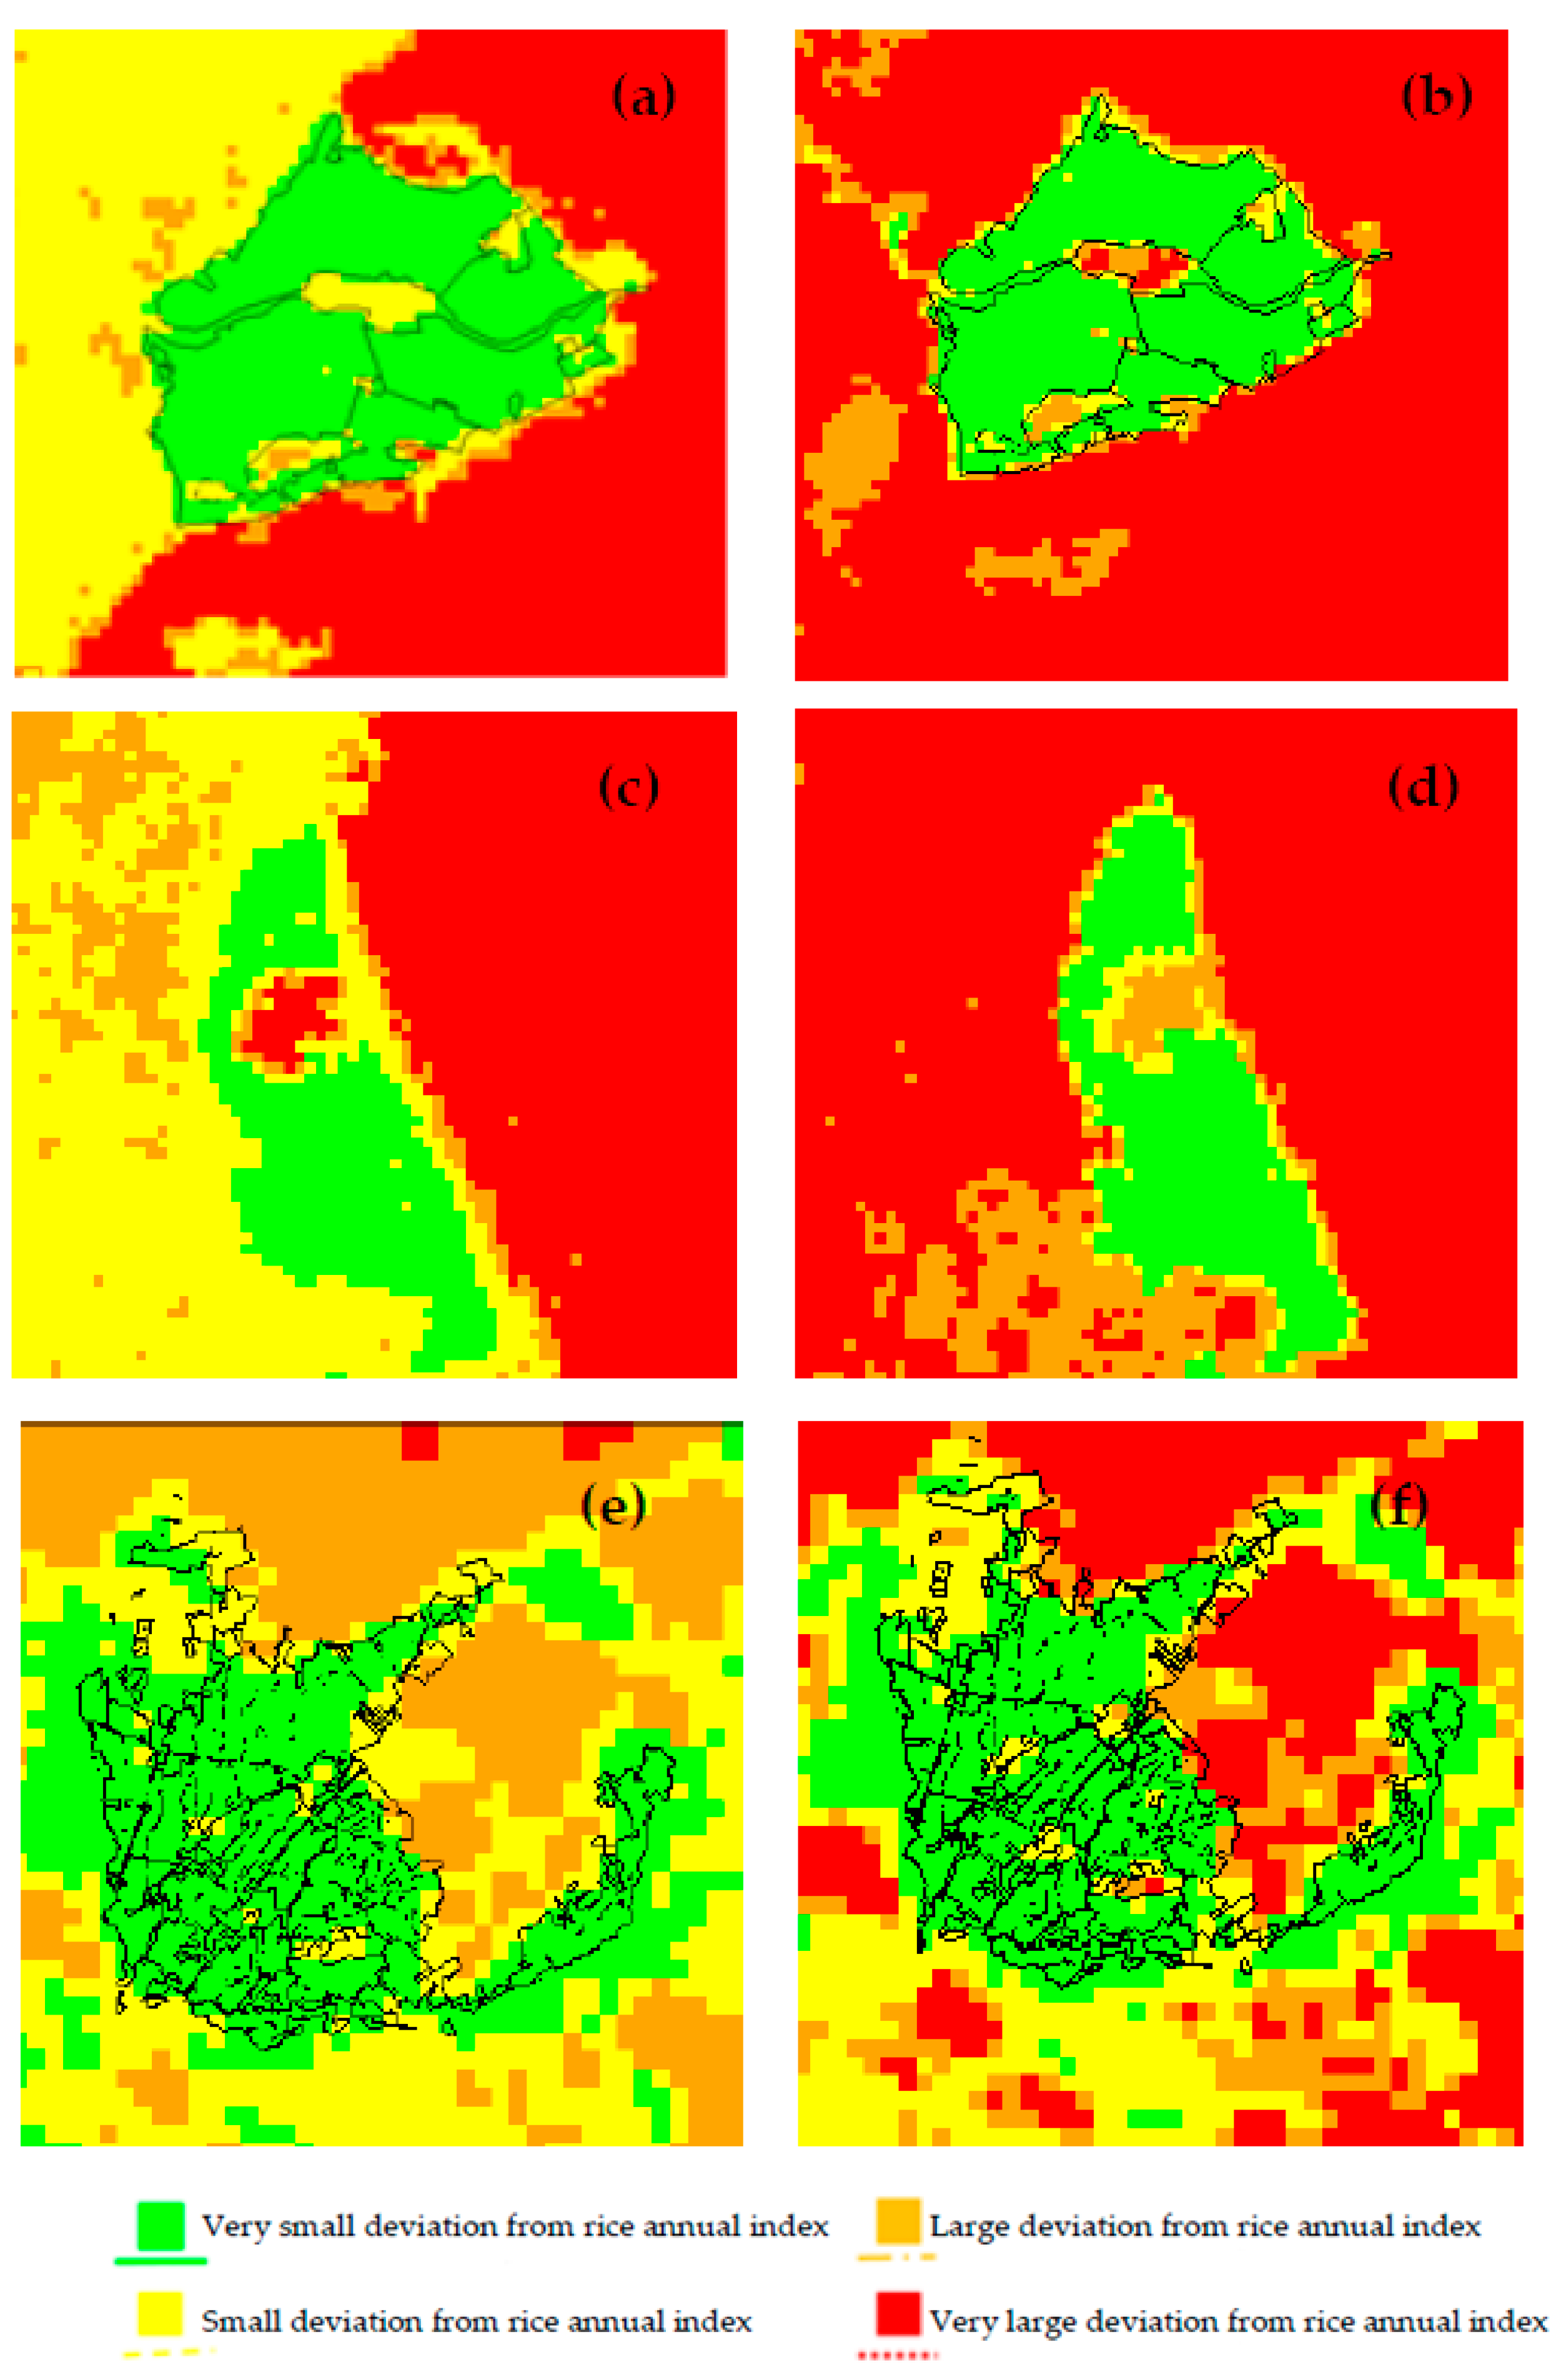
Figure 5 shows a map based on NDVI and SASI angular distances with rice in green (i.e., lower angular distances), and the other three classes in yellow orange and red, respectively.
NDVI angular distances for rice fields (in green) were consistently lower than those for other land uses (in yellow, orange and red). In the map, land uses such as lagoons, urban areas, other agricultural lands and natural areas showed intermediate values being assigned to the yellow category (
Figure 5).
In Ebro Delta (
Figure 5a,b) and Albufera (
Figure 5c,d), sea pixels showed the highest angular values being labelled in red. The SASI index (
Figure 5b,d,f) discriminated more clearly rice pixels from the rest of land uses than NDVI. A large part of the study area, covered by different land uses, showed large angular distances being assigned to the red class. Lagoons were the land use closer to rice fields with values classified in the yellow and orange categories (
Figure 5b,d).
In the Albufera National Park, the results obtained were compared with an ortophoto of the zone where rice fields have been identified by photointerpretation, and also compared with rice field area statistical data. The area occupied by the Albufera Natural Park is clearly identified in the classification process. Additionally, the lagoon, placed in the North of the zone (
Figure 6), was correctly differentiated from rice fields and was classified into other categories (in orange and red, respectively,
Figure 5c,d). When using SASI, a few pixels, in the limits of the rice area and in the lagoon were classified in the yellow class; it is likely that these areas correspond to mixed pixels.
Outside the validation mask, rice pixels were classified in the first category (green), with both indices while pixels corresponding to other crops and natural areas were classified in the second and third categories (yellow and orange,
Figure 5e,f).
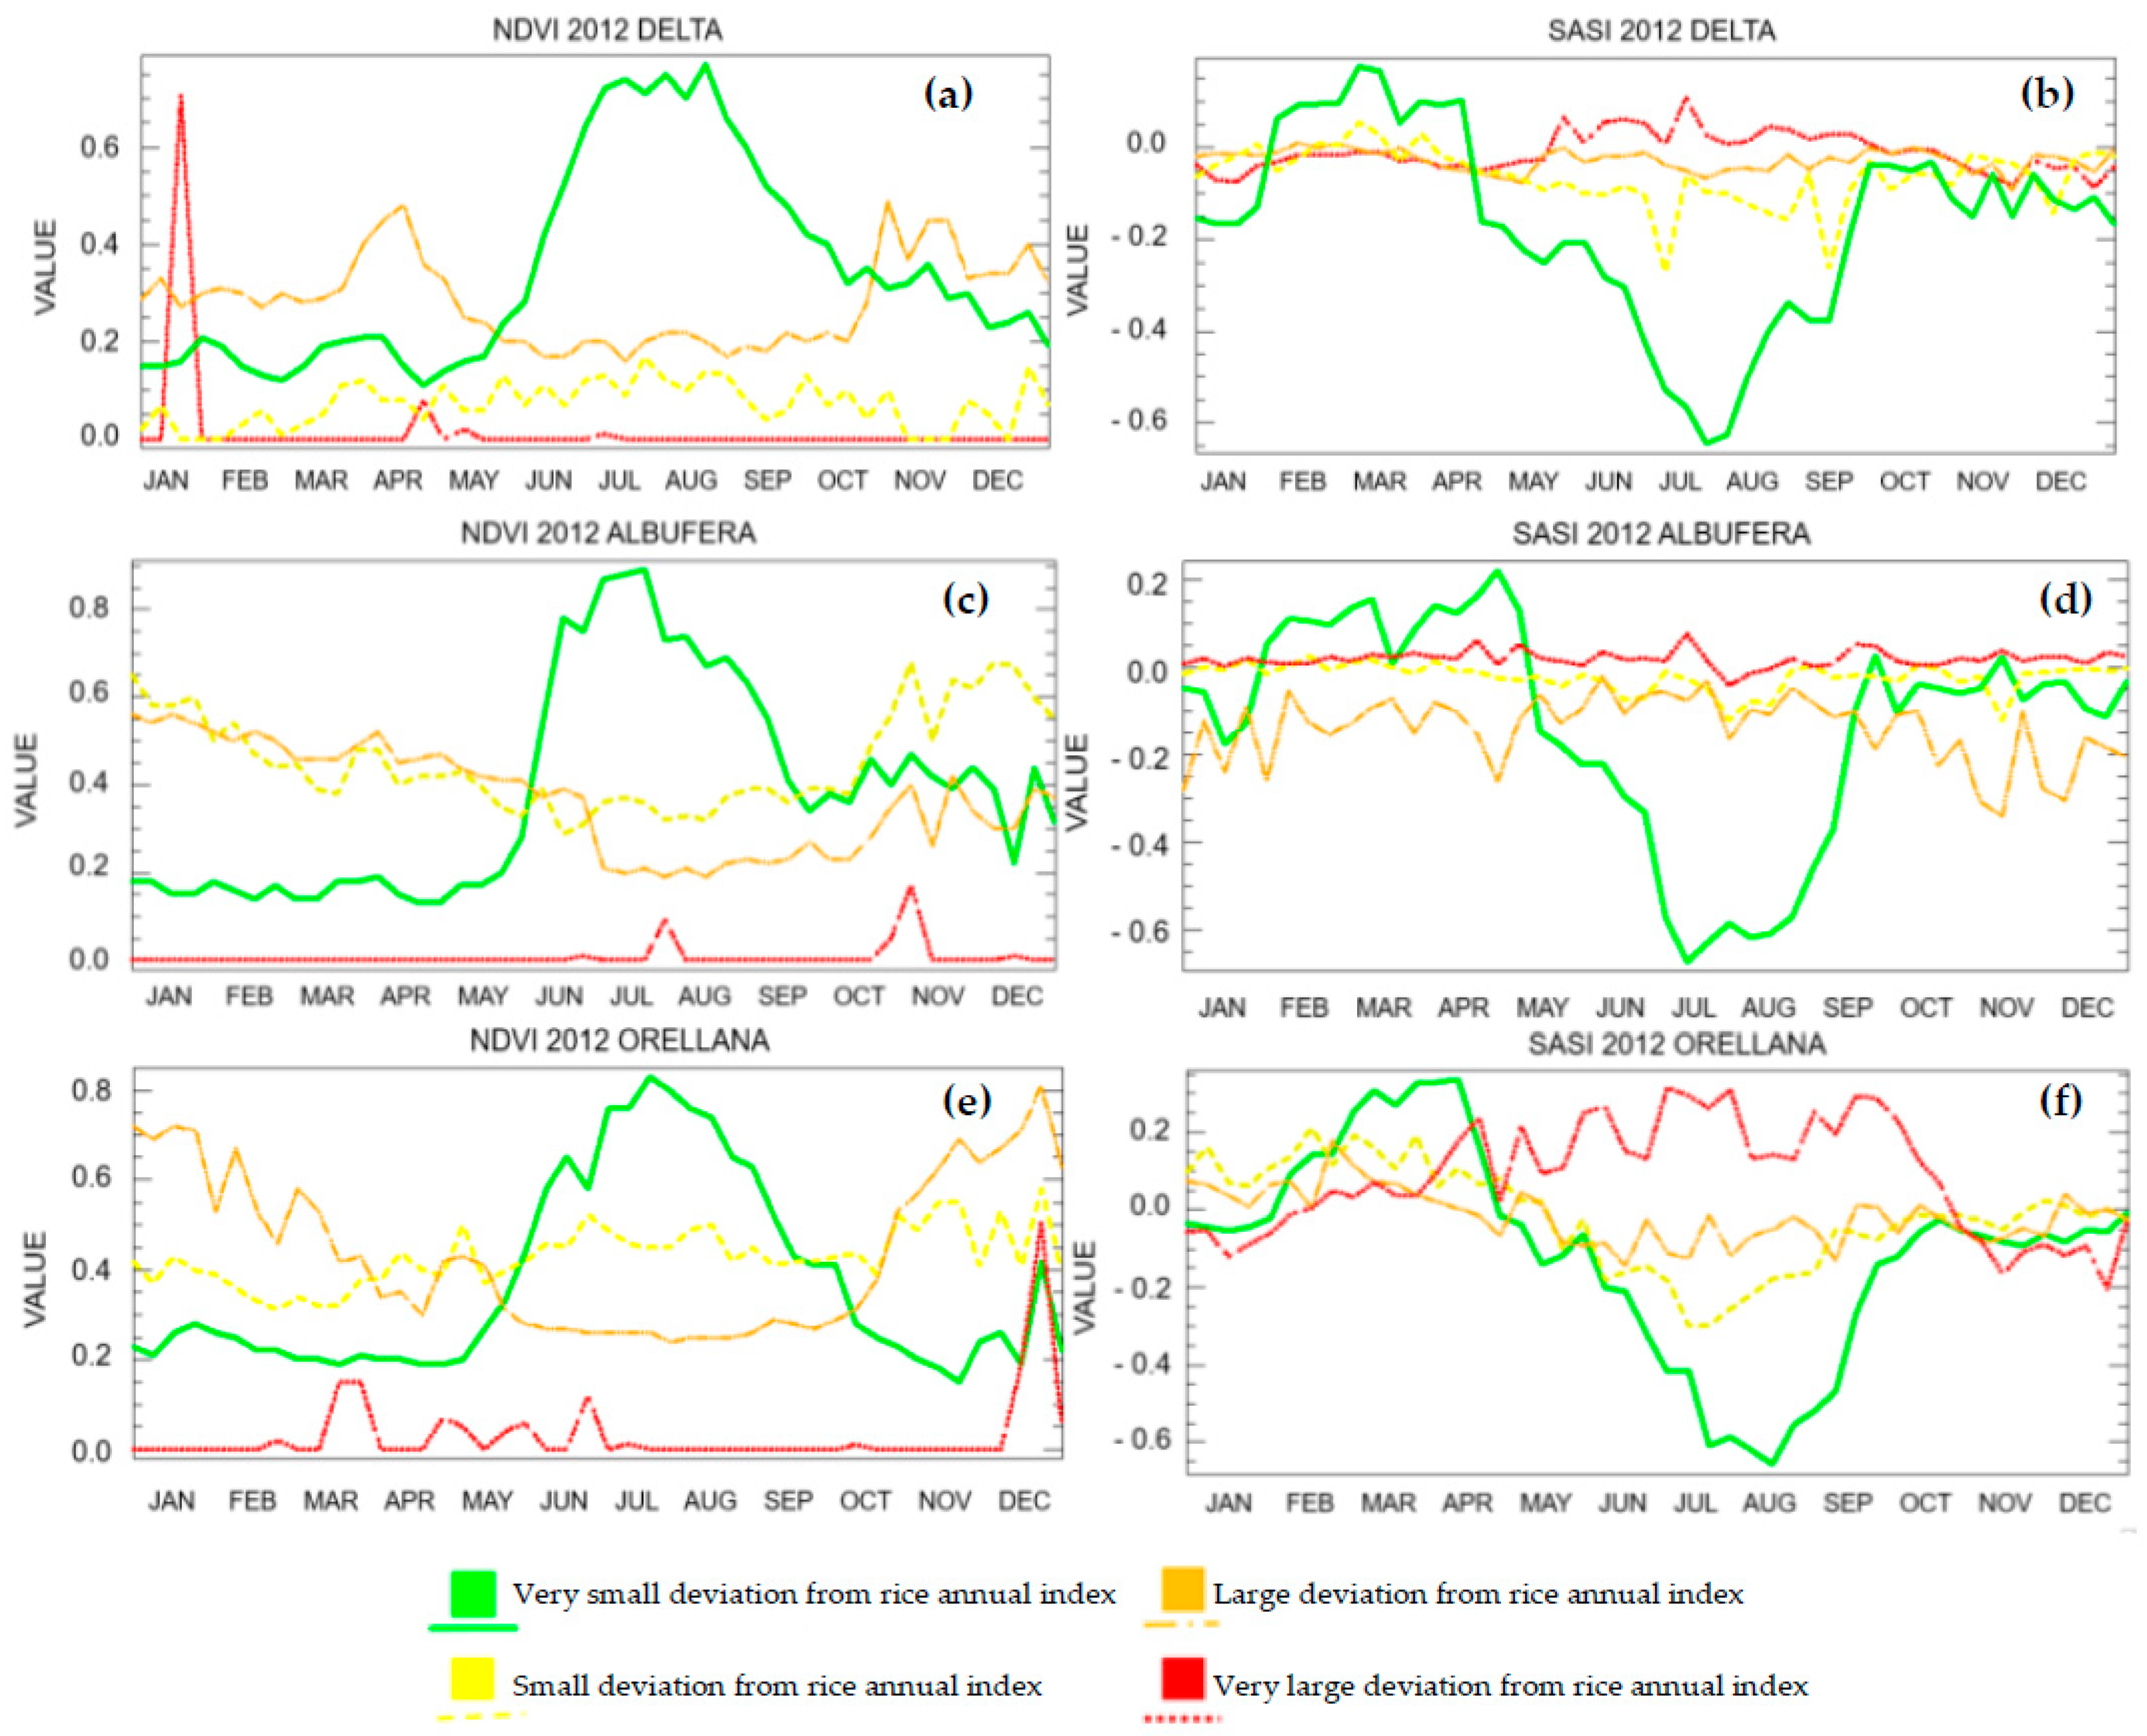
Figure 7 shows an example of the NDVI and SASI annual profiles for each category, with green color associated to the pixels with lower angular distances (rice class).
In Ebro Delta and Albufera, the NDVI increased quickly since flooding (May) until the heading date (end of July), and then decreased until the harvest (middle September). It did not show a distinct trend during the non-growing season, when the soil is flooded first (October) and is drained afterwards (February). On the other hand, SASI (
Figure 7b,d,f) showed an abrupt increase in coincidence with the draining of the fields (at the end of January) after the winter flooding, in both study areas.
In all cases, SASI annual dynamics in rice (
Figure 7b,d,f) showed a period of distinct high values between February and April, when the soil is dry, clearly different from all the other land uses. In Orellana, flooding dynamics are notably different to those in the Ebro Delta and the Albufera, as rice fields are not flooded during winter. Thus, NDVI and SASI annual values presented a different pattern from those of the other two zones (
Figure 7e,f).
In the Ebro Delta study site, a confusion matrix (
Table 1) was constructed for a zone with the same area occupied by rice fields and by other land uses. SASI showed an overall accuracy slightly higher than NDVI, with better identification of the rice fields; on the other hand, both indices showed a similar performance identifying non-rice pixels.
Similar accuracies are obtained in the Albufera Natural Park (98.1% for SASI and 77.24% NDVI) when comparing the total areas covered by rice with statistical data from the study area; and in Orellana (82.77% for NDVI and 90.08% for SASI) within the validation area. This indicates a higher discrimination potential in SASI than NDVI.
4. Discussion
SASI annual profiles capture more accurately rice dynamics than NDVI in the study zones providing better information on transitions in soil and vegetation moisture which is an asset in rice fields as they are a dynamic system of soil, free water and green vegetation. SASI showed an abrupt increase in coincidence with the draining of the fields (at the end of January) after the winter flooding whereas the NDVI did not show a distinct trend during the non-growing season (
Figure 7). This indicates a higher sensitivity of SASI to soil moisture content than NDVI, being able to discriminate bare soil from flooded soil. Other studies have showed similar results in rice fields [
37] as well as in other situations, for example, SASI has shown good performance in discriminating changes in soil moisture to study drought effects in crops [
36]. Furthermore, SASI in combination with other indices, allowed discriminating between bare soil, dry plant matter and green vegetation [
38].
SASI better discrimination potential is also shown in the distribution of the angular distances covering a larger range than NDVI (
Figure 4) indicating a higher variability of SASI annual patterns among different land uses. Moreover, SASI most non-rice pixels were located in the fourth class while NDVI angular values for most of non-rice pixels were close to those from rice pixels allowing a clearer segmentation between land uses. This results in higher accuracies values of rice classification when using this index. Particularly, SASI achieved slightly better results in the Delta and clearly better in the Albufera with 92.8% and 98% of accuracy, respectively, compared with NDVI index. The accuracy of the results was better or similar to those found in other works [
9,
31], even in those with higher spatial resolution [
5,
9].
SASI annual profiles outperforms in discriminating between rice fields and land uses with similar dynamics (
Figure 5), such as wetlands and irrigated annual crops which presents a temporal profile that can be easily confused with rice profiles in rice mapping procedures [
27]. SASI was less affected by changes in water level or phenological differences between fields than NDVI, resulting in a more accurate identification of rice fields. Accordingly, it can discriminate more clearly rice pixels from other land uses even when some phenological and flooding changes take place. This feature may be useful to identify rice areas with flooding periods out of the growing cycle and different water levels in the rice fields [
46,
47].
The classification errors were mainly due to mixed pixels near the lagoons (Albufera lagoon,
Figure 5c,d) or close to other crops (Orellana,
Figure 5e,f). SASI performed better than NDVI in discriminating rice fields from other irrigated crops (some of them with single-cycle and similar seasonality). This is due to SASI rice annual patterns are highly distinct from those in other land uses, even without winter flooding dynamics. This capability relies on SASI different values in bare soil and wet soil [
38].
Particularly, Orellana results were slightly poorer than in the Ebro Delta and the Albufera, presenting more classification errors. The lack of winter flooding could increase the difficulty to distinguish rice from other crops located in irrigation districts surrounding the study area. However, these results could be considered satisfactory taking into account the high frequency of coexistence of more than one crop within MODIS pixels.
The similarity of NDVI and SASI patterns in the Ebro Delta and the Albufera, as a result of similar phenological and hydrological annual dynamics in rice cultivation, made possible to use the same reference profiles and classification scheme. This indicates that this scheme could be applied to other areas with a similar pattern of phenological and hydrological stages for rice, very common in many Asian countries [
48,
49]. The results in Orellana indicate also a better potential of SASI in areas without winter flooding showing a better capacity to differentiate soil and water dynamics, which is crucial to capture rice field changes through the year. In order to apply this method to other regions with different vegetation and flooding dynamics it is essential to count on a reference rice annual profile within the study area, or from other area with similar annual dynamics.
Although this method based on MODIS images is specially indicated for rice mapping in medium-size rice areas or regional studies, the use of higher spatial resolution sensors should be explored for studies in small-size rice areas. In this regard, the increasing availability of data and resolutions from new sensors, such as the new ESA Sentinel-2 sensors [
50] may provide the opportunity to improve the results obtained [
51,
52,
53].
5. Conclusions
This study compares the potential of SASI and NDVI annual time series to identify rice areas using a profile similarity procedure. The method was tested in two coastal rice areas close to wetlands and in an irrigation district surrounded by other irrigated crops.
The overall accuracy was 92.8%, 98.1% and 90.1% for SASI and 92.4%, 77.24% and 82.8% for NDVI in the Delta, Albufera and Orellana, respectively. In particular, the user accuracy in the Ebro Delta was 88.89% (rice) and 95.73% (non-rice) for NDVI, and 90.05% (rice) and 95.43% (non-rice) for SASI.
The combined use of annual vegetation index time series with a profile similarity method constitute an accurate procedure to map rice areas with different flooding dynamics.
SASI annual profiles capture more accurately rice dynamics than NDVI in the study zones, outperforming in discriminating between rice fields and land uses with similar dynamics, such as wetlands and irrigated annual crops.
The application of this approach based on MODIS time series may provide the opportunity to count on annual rice maps at global level from 2000 to the year in course. The results obtained in this work might be used as a basic first step for other rice studies, such as flooding, phenology or evapotranspiration monitoring in rice fields. In a global context of water scarcity, climate change and land use change, this approach may provide a useful tool for natural resource management, monitoring and planning, especially in countries lacking reliable field or statistical data.


 ,
, 

