Article

Selenium Biofortification of Three Wild Species, Rumex acetosa L., Plantago coronopus L., and Portulaca oleracea L., Grown as Microgreens

by
Martina Puccinelli
1,*,
Beatrice Pezzarossa
2,*,
Lucia Pintimalli
1 and
Fernando Malorgio
1,3
1
Department of Agriculture, Food and Environment, University of Pisa, Via del Borghetto 80, 56124 Pisa, Italy
2
Research Institute on Terrestrial Ecosystems, CNR, Via G. Moruzzi 1, 56124 Pisa, Italy
3
Interdepartmental Research Center “Nutraceuticals and Food for Health”, University of Pisa, Via del Borghetto 80, 56124 Pisa, Italy
*
Authors to whom correspondence should be addressed.
Agronomy 2021, 11(6), 1155; https://doi.org/10.3390/agronomy11061155
Submission received: 10 May 2021 / Revised: 1 June 2021 / Accepted: 3 June 2021 / Published: 4 June 2021
(This article belongs to the Special Issue Sprouts, Microgreens and Edible Flowers as Novel Functional Foods)

Abstract

:
Microgreens of wild herbs are a source of healthy compounds. Selenium (Se) biofortification of microgreens could help increase the Se content and thus contribute to Se requirements in humans. We evaluated whether three wild herbs, Rumex acetosa L., Plantago coronopus L., and Portulaca oleracea L., were suitable for biofortification in order to obtain products with high nutraceutical value. In the first experiment, the three species were enriched with Na2SeO4 at 0 and 1.5 mg Se L−1, and the effects of Se on the nutraceutical characteristics of microgreens were evaluated. In the second experiment, using P. oleracea enriched with 0, 1.5, 5, and 10 mg Se L−1, we investigated whether there was a relation between the increasing Se concentrations in the nutrient solution and the Se content in microgreens. The Se added was taken up by roots and accumulated in the aerial part. P. coronopus exhibited the highest ability to accumulate selenium, and the Se-enriched microgreens showed the highest chlorophyll and flavonoid content. The strong correlation between the Se concentration in the growth solution and the Se accumulated in P. oleracea may enable the cultivation of microgreens with the targeted Se content. The resulting Se-biofortified microgreens of wild species could represent a new vegetable product with high nutraceutical value also ensuring a sufficient dietary intake of Se.

1. Introduction

In Europe, the consumption of wild edible plants, an integral part of human nutrition since ancient times [1], has recently gained interest due to their micronutrient contents, which tend to be higher than those of domesticated varieties. Wild edible plants are a good source of vitamins, minerals, protein, fat, sugars [2,3], and antioxidant [4] and antimicrobial compounds [5]. Microgreens of wild herbs could represent a source of functional food which might provide health benefits due to their nutraceutical value and could be exploited in new gastronomic trends [6,7].
Microgreens are tender immature greens produced from seedlings [8,9] and have higher levels of phytonutrients and secondary metabolites compared to mature-leaf products [10].
Selenium (Se) has a positive effect on long-term health because of its role in antioxidant defense and in several biological processes [11]. Worldwide, it has been estimated that low dietary Se intake affects up to 1 in 7 people [12].
Heart diseases, cystic fibrosis, cognitive decline, Alzheimer’s, cancer, impairment in immune function, oxidative stress-related disorders, reduced fertility, and hypothyroidism can be correlated with suboptimal Se intake [13,14]. A cardiomyopathy called Keshan disease, and an endemic degenerative osteoarthritis known as Kashin–Beck disease are associated with a Se intake lower than 10 µg Se day−1 [11].
On the other hand, high levels of Se can be toxic for humans. Nausea, vomiting, and diarrhea, as well as a specific disease called selenosis, can be induced by the short-term ingestion of high levels of Se. Damages of cardiovascular, gastrointestinal, neurological, and hematopoietic systems can happen in case of an excessive chronic consumption of Se [15,16].
In plants, Se promotes the growth of seedlings [17], delays senescence, improves the shelf life of products [18], and enhances the activity of antioxidant enzymes. There is a consequent increased synthesis of secondary metabolites, such as carotenoids, phenols, flavonoids, and vitamins [19,20]. The Se biofortification of microgreens has only been studied in a few crop species, such as buckwheat [21], wheat [19], green basil [22,23], coriander, purple basil, and tatsoi [23].
Considering the high efficiency in root-to-shoot translocation paths of wild herbs [24], wild food species might be able to accumulate high levels of Se in the aerial parts.
Our goal was to evaluate three wild herbs, Rumex acetosa L, Plantago coronopus L., and Portulaca oleracea L., as possible candidates for Se biofortification in order to obtain new vegetable products with a high nutraceutical value. R. acetosa is a perennial herb, belonging to the family Polygonaceae, whose leaves are used fresh or cooked in many cultures worldwide [25]. The leaf tissues are characterized by high contents of vitamin C, flavonoids, phenolic acids, and proanthocyanidins, that have an important pharmacological activity [26]. P. coronopus is a perennial herb belonging to the family Plantaginaceae, commonly consumed fresh in mixed salad, and particularly appreciated for its salty taste and high nutritional value [27]. The leaf tissues have a high content of phenolic compounds, amino acids, including essential amino acids, and minerals, such as calcium, magnesium, sodium, and potassium [28]. P. oleracea, one of the green vegetables richest in Omega−3 fatty acids [29,30], is an annual succulent, belonging to the family Portulacaceae and is consumed fresh, as salad, or cooked. Microgreens of the three species were enriched with sodium selenate and the effects of Se treatment on the nutraceutical characteristics of microgreens were evaluated. A possible correlation between the increasing Se concentrations added to the nutrient solution and the Se content in microgreen tissues was investigated in P. oleracea. We then assessed the potential contribution of Se-biofortified microgreens to human Se requirements as well as the health risks.

2. Materials and Methods

2.1. Plant Material and Growth Conditions

Two experiments were conducted at the Department of Agriculture, Food, and Environment of the University of Pisa, Italy (latitude 43°40′ N), during July 2020. In the first experiment, seeds of Rumex acetosa L., Plantago coronopus L., and Portulaca oleracea L. were used as starting material; seeds were purchased from Gargini sementi (Lucca, Italy). In the second experiment, only P. oleracea seeds were used. This weed has uncommon nutritional values, which makes it a potentially important food for the future, and it is characterized by reddish purple stems. Thus, P. oleracea was chosen for the second experiment, and the effect of Se treatments on the anthocyanin content was also investigated.
Seeds were sown in plastic trays (10 × 6.5 cm), on a jute map [31] as substrate (air porosity 87.6%, free porosity at pF1 46.5%, water retention capacity 41.1%). In order to obtain about 5 seeds cm−2, 0.5 g of seeds for each species were sown on each tray, and watered with 50 mL of distilled water containing different concentrations of Se added as Na2SeO4. The concentrations of Se used were 0 and 1.5 mg L−1 in the first experiment and 0, 1.5, 5, and 10 mg L−1 in the second experiment. In both experiments, two replicates, composed of two trays of seedlings, were used for each treatment. After sowing, the trays were relocated in a growth chamber, arranged in a randomized block design, and kept in the dark at 25°C for 72 h. LED lights C-Led Lamp Circular HP 230V 24W NAT Indoor NA 80° (47% red, 33% blue, 20% green) were used to provide 150 PPFD with a photoperiod of 16 h. Trays were watered using Hoagland’s nutrient solution at half strength [32].

2.2. Determinations

In both experiments, microgreens were harvested 14 days after sowing, and the fresh weight (FW) was determined. After drying in a ventilated oven at 50°C to a constant weight, the dry weight (DW) of plant samples was measured. The fresh and dry biomass production was expressed as g FW m−2 and g DW m−2, respectively.
Total phenols, flavonoids, antioxidant capacity, chlorophyll, and carotenoid contents were determined in fresh leaf samples at harvest. An aliquot of 100 mg of vegetable tissues (FW) was extracted with 5 mL methanol 99% v/v. The total content of phenols was measured using the Folin–Ciocalteau reagent [33] and calculated using the calibration curve containing 0, 50, 100, 150, and 250 mg gallic acid L−1. Values were expressed as mg of gallic acid (GAE) g−1 FW. To determine the flavonoid content, 0.06 mL of NaNO2 (5%) and 0.04 mL of AlCl3 (10%) were added to 0.1 mL of the methanol extract, and then after five minutes, 0.4 mL of NaOH and 0.2 mL of H2O were added. The absorbance was read at 510 nm. The results were expressed as mg catechin g−1 FW [34]. The antioxidant capacity was measured using the FRAP method [35]. After mixing the methanol extract and the reagents, the absorbance was read at 593 nm, and the results were expressed as µmol of Fe(II) mg−1 FW. Total chlorophylls, chlorophyll a and b, and carotenoid content were determined according to Lichtenthaler’s method. The concentrations of chlorophyll a and b and carotenoids were calculated using the Welburn and Lichtenthaler equation [36].
In P. oleracea, the total anthocyanin content was assessed. A total of 100 mg of fresh microgreens was extracted using 5 mL of acidified 80% methanol (containing 1% hydrochloric acid). The absorbance of acid extract was read at 530 nm. The results were expressed as mg cyanidin−3-glucoside g−1 FW, using the value 38,000 M−1 cm−1 for the molar absorptivity [37].
The Se content in microgreen tissues was measured according to the UNI EN 13657:2004 [38] and UNI EN ISO 17294−2:2016 [39] methods for the sample digestion and selenium determination, respectively. Three replicates were analyzed for each treatment.

2.3. Contribution to Selenium Dietary Intake and Health Risk Assessment

Data concerning the average amount of daily consumed microgreens are not available in the literature. However, since microgreens are usually consumed in small quantities to garnish and enhance the flavor of dishes, the average daily serving was assumed to be around 10 g FW.
The estimated dietary intake (EDI, µg day−1) of Se was calculated as the amount of Se provided by a supposed portion of 10 g of microgreens. In order to evaluate the contribution of the Se-enriched microgreens to human Se needs, EDI was also expressed as a percentage (EDI%) of the adequate adult intake (AI, 70 µg day−1) of Se [40].
To assess the possible health risk due to the intake of Se provided by the consumption of biofortified microgreens, the health risk index (HRI) was calculated as the ratio between EDI and the tolerable upper intake level [10,41] (UL, i.e., 300 µg day−1 [42]). In general, the UL is the maximum chronic daily intake of a nutrient (from all sources) that is assumed to not have an appreciable risk of adverse health effects in humans [42].

2.4. Statistical Analysis

Data from the first experiment were subjected to two-way ANOVA, with Se treatment and plant species as variables. Data of the second experiment were subjected to one-way ANOVA, with Se treatments as the variable. Mean values were separated by Duncan’s post-hoc test (p < 0.05). Statistical analysis was performed using R Statistical Software.

3. Results and Discussion

3.1. First Experiment

3.1.1. Biomass Production of Microgreens

Of the three investigated species, P. coronopus produced the highest biomass. Fresh and dry biomass, in fact, were 230% and 160%, respectively, higher on average than in P. oleracea, which showed the lowest production of biomass (Table 1). The fresh biomass of microgreens ranged from 0.564 (P. oleracea) to 1.861 kg m−2 (P. coronopus). These data are consistent with the yield exhibited by other wild species, such as Sinapis arvensis and Taraxacum officinalis [10], and by microgreens of several vegetable crops [43,44,45]. The dry matter content of microgreens also significantly differed among the three plant species. On average, the highest value was detected in R. acetosa and was 70.4% higher than the lowest dry matter content detected in P. coronopus (Table 1). In the control microgreens, the dry matter content varied from 5.02% in P. coronopus to 7.95% in R. acetosa. These percentages are consistent with data for the microgreens of basil [23,44], rocket [44], tatsoi [23], chicory, and lettuce [43] but lower than the microgreens of coriander [23].
On average, the Se treatment reduced fresh biomass production (−13.5%), with a consequent increase in dry matter content (+13.4%) in the microgreens of all species (Table 1). An increment in the dry matter content was observed in Se-enriched microgreens of green basil [23]. The non-significant effect of Se addition on dry biomass production is consistent with studies on the microgreens of green basil conducted by Pannico et al. [23] and Puccinelli et al. [22].

3.1.2. Se Concentration in Microgreens

The Se added to the growing medium was taken up and accumulated in the aerial parts of the microgreens (Figure 1). Statistical analysis showed that P. coronopus accumulated the highest amount of Se, which was 92.9% and 265.5% higher than the amount of Se accumulated by P. oleracea and R. acetosa, respectively. The Se content, expressed as mg per kg of fresh weight, of R. acetosa, P. coronopus, and P. oleracea was 1.88, 3.74, and 3.01, respectively. The higher capacity of P. coronopus in accumulating Se could be ascribed to its higher leaves/stem ratio (data not shown), which may have induced higher plant evapotranspiration, and thus a higher transfer of Se from the roots to the shoots via the xylem [46].

3.1.3. Contribution to Se requirement in Humans

The potential contribution of the biofortified microgreens to the Se requirement in humans was statistically different between the three plant species. With reference to a portion of 10 g of biofortified microgreens, the estimated dietary intake (EDI) for Se ranged from 18.8 µg (R. acetosa) to 37.4 µg (P. coronopus) and was 26.9%, 43.05%, and 53.43% of the adequate intake (AI) from microgreens of R. acetosa, P.oleracea, and P. coronopus, respectively (Table 2).
As for the health risk related to the selenium accumulated in biofortified microgreens, all the EDI values were below the tolerable upper intake level (UL), i.e., 300 µg day−1 [42], and the HRIs were far below 1 (Table 2). Thus, for humans, daily exposure to these amounts of Se is not expected to have a negative impact on health over a lifetime [42]. The EDI represented a good Se integration in the diet, without leading to toxicity, for all the microgreen species investigated.

3.1.4. Photosynthetic Pigments

Statistically different contents of total chlorophylls, carotenoids, phenols, and flavonoids were detected among the three species. On average, total chlorophyll and flavonoid contents were highest in P. coronopus, whereas the highest contents of carotenoids were detected in P. oleracea and R. acetosa (Table 3).
To the best of our knowledge, no data on the content of chlorophyll and carotenoids in the microgreen species investigated are available in the literature. Thus, we compared our results with those obtained in other microgreen species. The values of chlorophyll content exhibited by P. coronopus were consistent with values reported for radish [6,47,48], coriander, cress, and kohlrabi microgreens [6]. The total chlorophyll content detected in R. acetosa and P. oleracea agreed with values found in microgreens of broccoli [47,49], beet, mustard, and basil [50] but were lower than for radish [47,51] and parsley microgreens [52].
The carotenoid contents in the three species were lower than in mustard, red pak choi, and tatsoi microgreens, as reported by Brazaityte et al. [53]. P. oleracea microgreens showed carotenoid contents consistent with previous studies conducted on basil [50], mustard, and beet [52]. Instead, the carotenoid contents of R. acetosa and P. coronopus were lower than the values cited above [50,52]. These findings confirm that the photosynthetic pigment content is highly variable in microgreens, especially in relation to the plant species.

3.1.5. Total Phenols, Flavonoids, and Antioxidant Capacity

Regarding the total phenols, the highest content was exhibited by R. acetosa (Table 3). On average, the treatment with Se resulted in a significantly increased antioxidant capacity (+21.4%) and flavonoid content (+21.1%) in the three species (Table 3). The selenium added to the nutrient solution and accumulated in the microgreens may have acted as a pro-oxidant, inducing an increase in reactive oxygen species (ROS) and lipid peroxidation [54,55], thus, leading to the reduction of fresh biomass production in Se-enriched microgreens. On the other hand, the content of total chlorophylls, carotenoids, and total phenols was not affected by selenium application. Contrasting results were reported on the effect of Se on content of photosynthetic pigments. In microgreens of wheat, Se concentrations up to 0.50 mg L−1 increased either the chlorophyll and carotenoid content and the total phenol content [19]. In rice sprouts, a Se concentration lower than 15 mg Se L−1 did not affect the total carotenoid content, whereas a higher Se concentration decreased both total carotenoid and chlorophyll content [56]. The content of β-carotene decreased in green and purple basil but increased in tatsoi and coriander at Se treatments of 0.63 and 1.126 mg L−1 [23].

3.2. Second Experiment

3.2.1. Biomass Production of Microgreens

The addition of increasing amounts of selenium to the growth solution of P. oleracea did not affect the fresh and dry biomass production, or the dry matter content of the microgreens. These results are in agreement with those obtained by Pannico et al. [23] and Puccinelli et al. [22] in basil microgreens. In our study, the Se content in the microgreens increased by increasing the Se doses applied, and the highest Se content was detected at 10 mg Se L−1 added (Table 4).

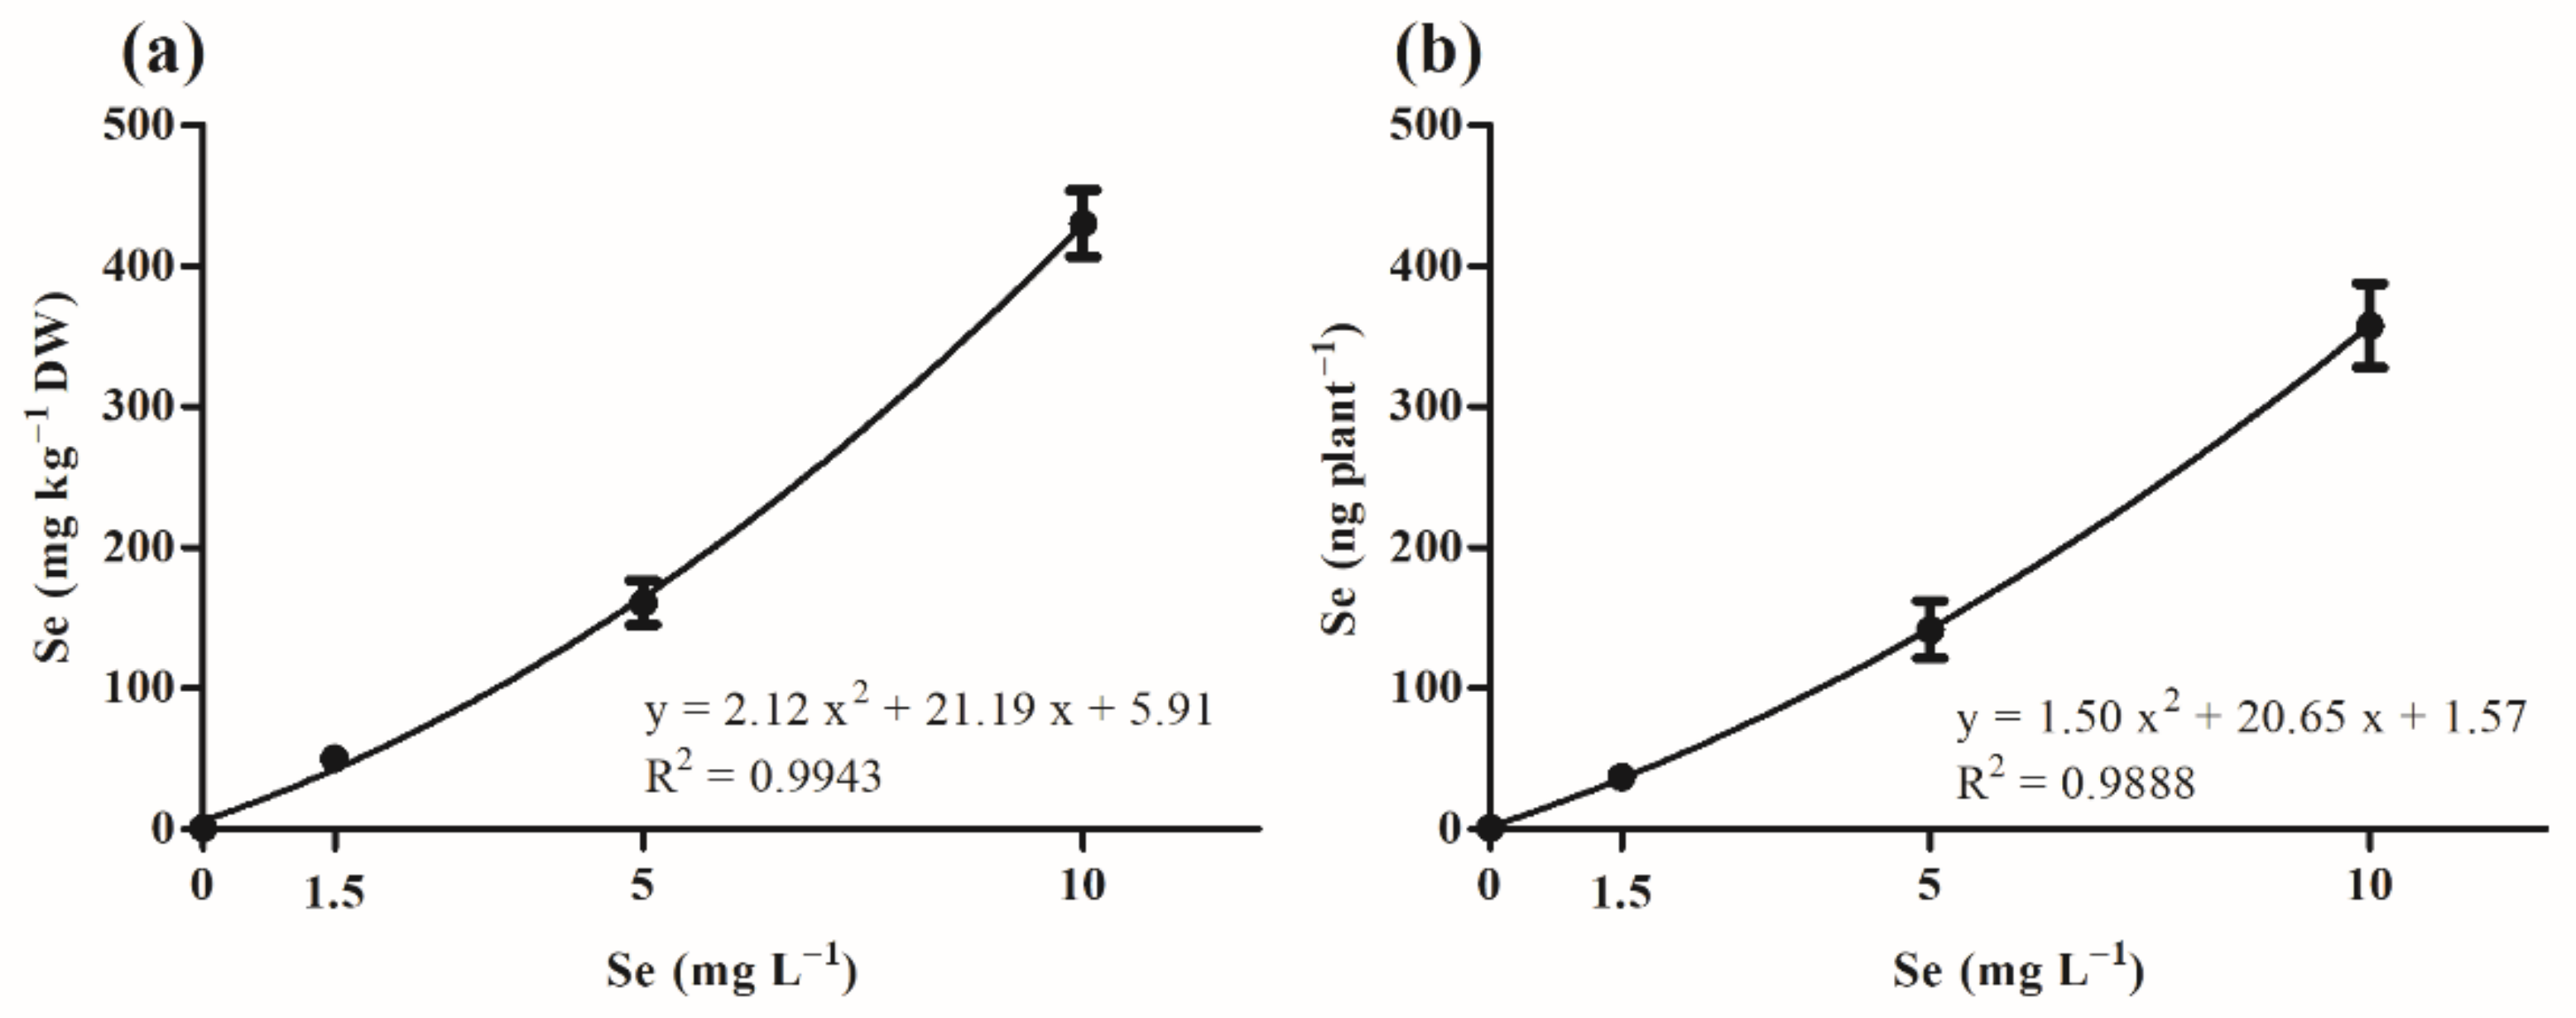
3.2.2. Relationship between Se Concentration in Microgreens and Concentration Applied

The amount of Se accumulated in microgreens and expressed on a dry weight basis (Figure 2a) or per plant (Figure 2b), was correlated with the Se added to the nutrient solution by a non-linear regression (second-order polynomial quadratic) with a determination coefficient (R2) of 0.9943 (Figure 2a) and 0.9888 (Figure 2b), respectively. This strong correlation means that P. oleracea microgreens could be cultivated with a specific Se content by acting on the Se concentration in the growth medium. A quadratic relationship between the micronutrient concentration in the substrate and in the microgreens was already detected for Zn and Fe in microgreens of arugula, red cabbage, and red mustard [57].
The efficacy of achieving Se-biofortified microgreens by adding sodium selenate to the nutrient solution, as demonstrated by our experiments, is consistent with previous studies on the Se biofortification of microgreens of buckwheat [21], green basil, purple basil, coriander, tatsoi [23], and wheat [19]. These findings corroborate the ability of plant roots to take up Se through passive diffusion and sulphate transporters.

3.2.3. Contribution to Se Requirement in Humans

The potential of the biofortified microgreens to contribute to the Se requirement of humans differed in relation to the Se doses used for the treatment (Table 4). With reference to a portion of 10 g of biofortified microgreens, the EDI for Se ranged from 46.7% (from microgreens treated with 1.5 mg Se L−1) to 469.6% (from microgreens treated with 10 mg Se L−1) of the AI.
With regard to the assessment of the health risk related to the Se accumulated in biofortified microgreens, all the EDI values were lower than the UL [42] in treatments with 1.5 and 5 mg L−1 of Se, and higher in treatments with 10 mg L−1 of Se. The HRI was higher than 1 only in microgreens enriched with 10 mg L−1 of Se (Table 4), the long-term consumption of which would thus induce toxicity in humans.

3.2.4. Pigments

Treatments with 10 mg Se L−1 significantly increased the total chlorophyll (+22.3% compared to the control) (Figure 3a) and the carotenoid (+66.7% compared to the control) contents (Figure 3b). In fact, selenium enhances the biosynthesis of photosynthetic pigments in plants, inducing the repair of chloroplast damage due to abiotic stress and ROS [58,59,60]. An increase in photosynthetic pigments was observed in tatsoi and coriander microgreens treated with 0.63 mg L−1 of Se [23] and in wheat microgreens enriched with 0.5 mg Se L−1 (total chlorophylls) or with 0.125 mg Se L−1 (carotenoids) [19].
Treatments with 1.5 and 5 mg Se L−1 increased the anthocyanin content of microgreens by 22.7% and 31.3%, respectively, compared to the control, but no significant differences were observed when 10 mg Se L−1 were applied (Figure 3c). In line with our findings, an increase in anthocyanin content was reported for wheat seedlings [61] and purple-grained wheat plants [62] treated with Se. This increase may be due to a higher expression of the gene of the enzyme involved in the anthocyanin biosynthesis pathways, as reported by Liu et al. [63] in Se-enriched purple lettuce.

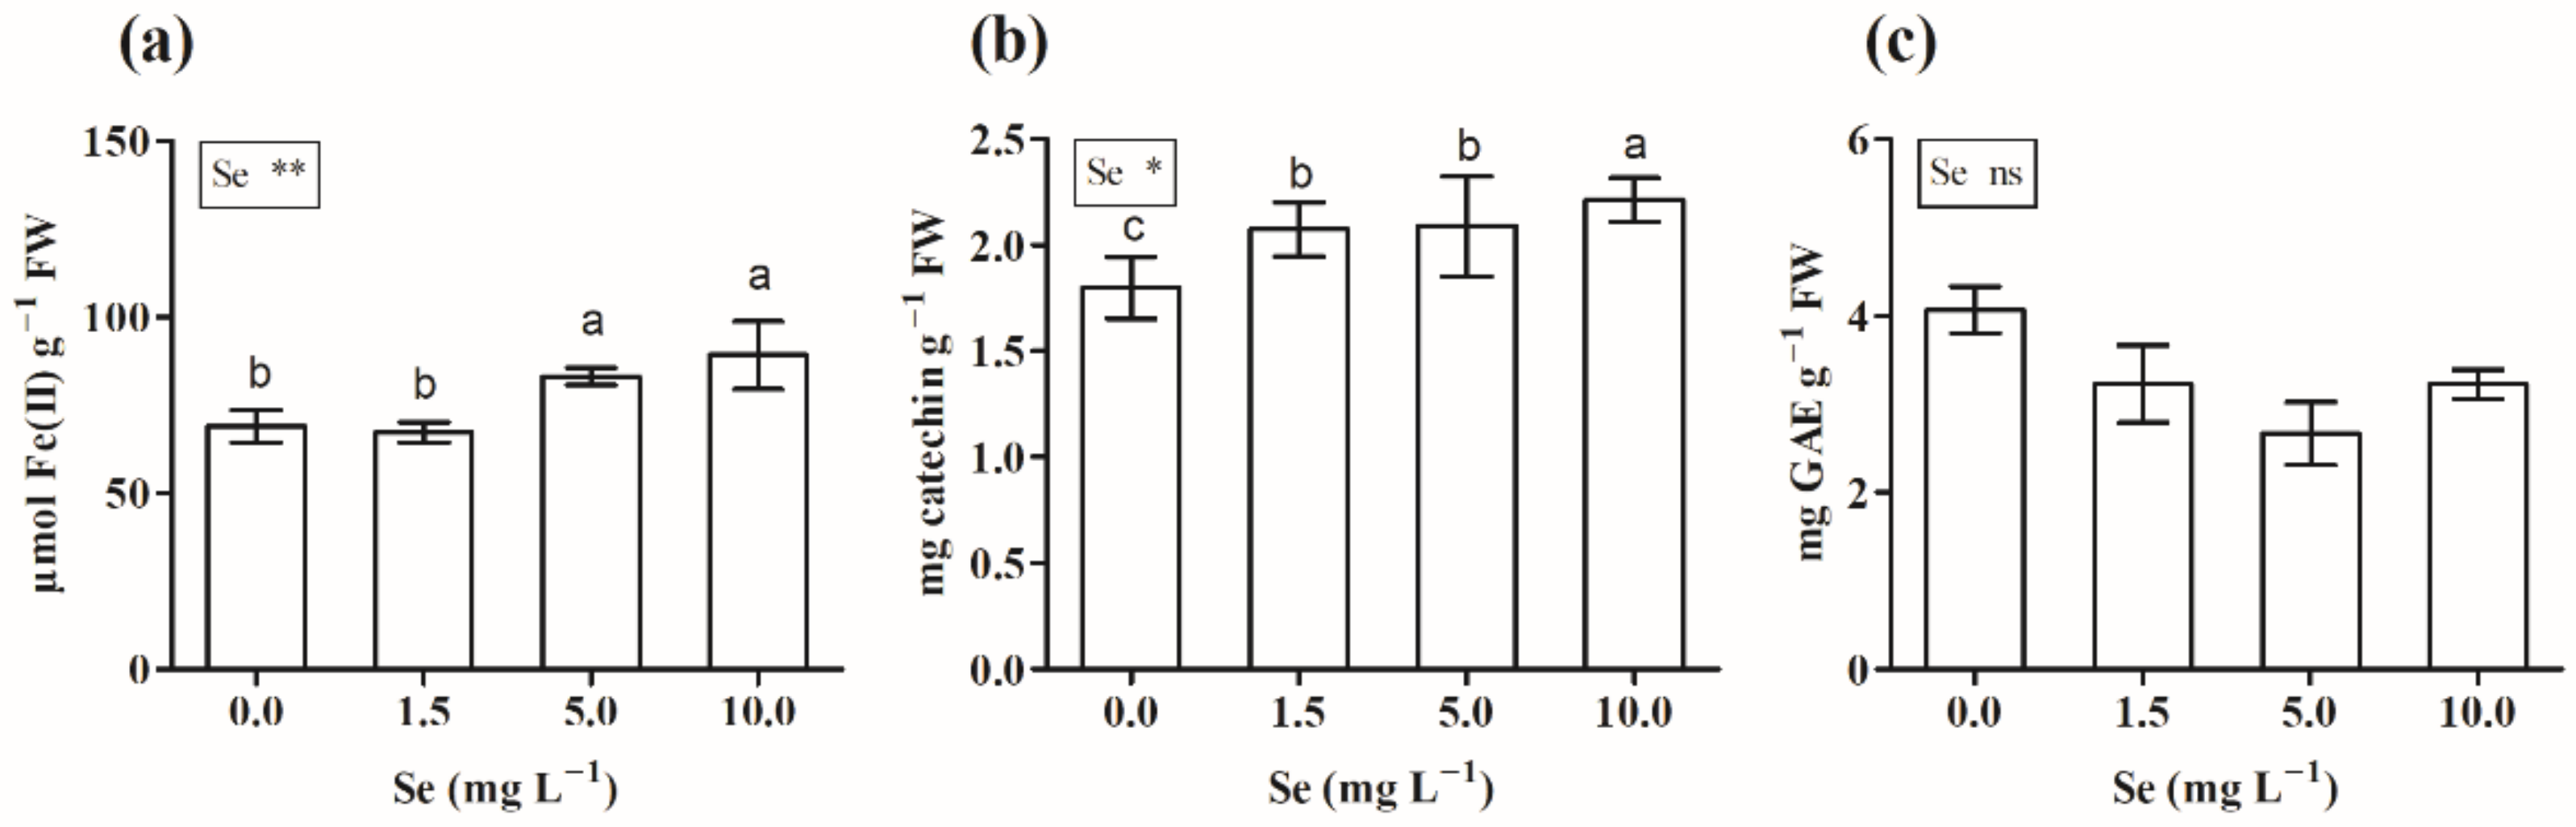
3.2.5. Total Phenols, Flavonoids, and Antioxidant Capacity

In our study, the antioxidant capacity was increased by treatments with 5 mg Se L−1 (+20.6%, compared to the control) and 10 mg Se L−1 (+29.5%, compared to the control) (Figure 4a). The association of Se with antioxidant metabolism [59,64] due to the role of Se as a cofactor of selenoenzymes [65] could explain the higher antioxidant activity in Se-enriched microgreens. The cellular antioxidant activity is associated with an increase in GSH-Px activity which is positively related to the concentration of Se in plant tissues [54]. An increase in antioxidant capacity was detected in Se-biofortified plants of tomato [66], sweet basil [67], and rice [68].
An increase in flavonoid content was also detected in Se-enriched microgreens, which showed the highest content at 10 mg Se L−1 (+22.8% compared to the control) (Figure 4b). On the other hand, the total phenol content of microgreens was not affected by selenium treatments (Figure 4c). Phenols and flavonoids act as reducing agents, hydrogen donors, chelators of metal catalysts, and singlet oxygen quenchers [69]. The increased flavonoid content observed in the Se-enriched microgreens in our study is consistent with results obtained in buckwheat [70], wheat seedings [61], and rice [68] plants treated with Se.

4. Conclusions

R. acetosa, P. coronopus, and P. oleracea seem to be interesting species for the production of Se-biofortified microgreens. The strong correlation between the Se concentration in the growth solution and the Se accumulation found in P. oleracea facilitates the cultivation of microgreens with the targeted content of Se.
P. coronopus exhibited the highest ability to accumulate selenium, and the Se-enriched microgreens showed the highest chlorophyll and flavonoid contents. The biofortified microgreens of wild species could represent a new vegetable product with a high nutraceutical value which could also contribute to the dietary intake of Se.
A daily consumption of 10 g of microgreens enriched with the dose of 1.5 Se L−1 would supply a percentage adequate intake of Se ranging between 27% and 53%. Since the plant response to selenium is both dose- and plant-species-dependent, further studies should focus on the interaction between plant species and Se dose, in order to balance yield and biofortification. The microgreens of all three species tested would have a beneficial effect on human health and also provide pigments and antioxidant compounds.

Author Contributions

Conceptualization, M.P. and F.M.; Data curation, M.P. and L.P.; Formal analysis, M.P. and L.P.; Methodology, M.P., B.P. and F.M.; Supervision, M.P., B.P., and Fernando Malorgio; Writing–original draft, M.P.; Writing—review and editing, M.P. and B.P. All authors have read and agreed to the published version of the manuscript.

Funding

This research received no external funding.

Institutional Review Board Statement

Not applicable.

Informed Consent Statement

Not applicable.

Data Availability Statement

The data presented in this study are available on request from the corresponding author.

Conflicts of Interest

The authors declare no conflict of interest.

References

  1. Carvalho, A.M.; Barata, A.M. The Consumption of Wild Edible Plants. In Wild Plants, Mushrooms and Nuts: Functional Food Properties and Applications; Wiley: Hoboken, NJ, USA, 2016; pp. 159–198. ISBN 9781118944653. [Google Scholar]
  2. De Cortes Sánchez-Mata, M.; Matallana-González, M.C.; Morales, P. The contribution of wild plants to dietary intakes of micronutrients (I): Vitamins. In Mediterranean Wild Edible Plants: Ethnobotany and Food Composition Tables; Springer: New York, NY, USA, 2016; pp. 111–139. ISBN 9781493933297. [Google Scholar]
  3. García-Herrera, P.; de Cortes Sánchez-Mata, M. The contribution of wild plants to dietary intakes of micronutrients (II): Mineral elements. In Mediterranean Wild Edible Plants: Ethnobotany and Food Composition Tables; Springer: New York, NY, USA, 2016; pp. 141–171. ISBN 9781493933297. [Google Scholar]
  4. Barros, L.; Morales, P.; Carvalho, A.M.; Ferreira, I.C.F.R. Antioxidant potential of wild plant foods. In Mediterranean Wild Edible Plants: Ethnobotany and Food Composition Tables; Springer: New York, NY, USA, 2016; pp. 209–232. ISBN 9781493933297. [Google Scholar]
  5. Di Venere, D.; Gatto, M.A.; Ippolito, A.; Bianco, V.V. Antimicrobial potential of wild edible herbaceous species. In Mediterranean Wild Edible Plants: Ethnobotany and Food Composition Tables; Springer: New York, NY, USA, 2016; pp. 233–252. ISBN 9781493933297. [Google Scholar]
  6. Kyriacou, M.C.; El-Nakhel, C.; Graziani, G.; Pannico, A.; Soteriou, G.A.; Giordano, M.; Ritieni, A.; de Pascale, S.; Rouphael, Y. Functional Quality in Novel Food Sources: Genotypic Variation in the Nutritive and Phytochemical Composition of Thirteen Microgreens Species. Food Chem. 2019, 277, 107–118. [Google Scholar] [CrossRef] [PubMed]
  7. Xiao, Z.; Lester, G.E.; Park, E.; Saftner, R.A.; Luo, Y.; Wang, Q. Evaluation and Correlation of Sensory Attributes and Chemical Compositions of Emerging Fresh Produce: Microgreens. Postharvest Biol. Technol. 2015, 110, 140–148. [Google Scholar] [CrossRef]
  8. Di Gioia, F.; Renna, M.; Santamaria, P. Sprouts, Microgreens and “Baby Leaf” Vegetables; Springer: Boston, MA, USA, 2017; pp. 403–432. [Google Scholar]
  9. Kyriacou, M.C.; Rouphael, Y.; di Gioia, F.; Kyratzis, A.; Serio, F.; Renna, M.; de Pascale, S.; Santamaria, P. Micro-Scale Vegetable Production and the Rise of Microgreens. Trends Food Sci. Technol. 2016, 57, 103–115. [Google Scholar] [CrossRef]
  10. Lenzi, A.; Orlandini, A.; Bulgari, R.; Ferrante, A.; Bruschi, P. Antioxidant and Mineral Composition of Three Wild Leafy Species: A Comparison between Microgreens and Baby Greens. Foods 2019, 8, 487. [Google Scholar] [CrossRef] [Green Version]
  11. Birringer, M.; Pilawa, S.; Flohé, L. Trends in Selenium Biochemistry. Nat. Prod. Rep. 2002, 19, 693–718. [Google Scholar] [CrossRef] [PubMed]
  12. Fordyce, F.M. Selenium deficiency and toxicity in the environment. In Essentials of Medical Geology: Revised Edition; Springer: Dordrecht, The Netherlands, 2013; pp. 375–416. ISBN 9789400743755. [Google Scholar]
  13. Rayman, M.P. Selenium and Human Health. Lancet 2012, 379, 1256–1268. [Google Scholar] [CrossRef]
  14. Hamilton, S.J. Review of Selenium Toxicity in the Aquatic Food Chain. Sci. Total Environ. 2004, 326, 1–31. [Google Scholar] [CrossRef] [PubMed]
  15. Yang, G.; Wang, S.; Zhou, R.; Sun, S. Endemic Selenium Intoxication of Humans in China. Am. J. Clin. Nutr. 1983, 37, 872–881. [Google Scholar] [CrossRef] [PubMed]
  16. Raisbeck, M.F. Selenosis. Vet. Clin. N. Am. Food Anim. Pract. 2000, 16, 465–480. [Google Scholar] [CrossRef]
  17. Diao, M.; Ma, L.; Wang, J.; Cui, J.; Fu, A.; Liu, H. Selenium Promotes the Growth and Photosynthesis of Tomato Seedlings Under Salt Stress by Enhancing Chloroplast Antioxidant Defense System. J. Plant Growth Regul. 2014, 33, 1–12. [Google Scholar] [CrossRef]
  18. Malorgio, F.; Diaz, K.E.; Ferrante, A.; Mensuali-Sodi, A.; Pezzarossa, B. Effects of Selenium Addition on Minimally Processed Leafy Vegetables Grown in a Floating System. J. Sci. Food Agric. 2009, 89, 2243–2251. [Google Scholar] [CrossRef]
  19. Islam, M.Z.; Park, B.J.; Kang, H.M.; Lee, Y.T. Influence of Selenium Biofortification on the Bioactive Compounds and Antioxidant Activity of Wheat Microgreen Extract. Food Chem. 2020, 309, 125763. [Google Scholar] [CrossRef]
  20. Skrypnik, L.; Novikova, A.; Tokupova, E. Improvement of Phenolic Compounds, Essential Oil Content and Antioxidant Properties of Sweet Basil (Ocimum basilicum L.) Depending on Type and Concentration of Selenium Application. Plants 2019, 8, 458. [Google Scholar] [CrossRef] [PubMed] [Green Version]
  21. Germ, M.; Stibilj, V.; Šircelj, H.; Jerše, A.; Kroflič, A.; Golob, A.; Maršić, N.K. Biofortification of Common Buckwheat Microgreens and Seeds with Different Forms of Selenium and Iodine. J. Sci. Food Agric. 2019, 99, 4353–4362. [Google Scholar] [CrossRef]
  22. Puccinelli, M.; Malorgio, F.; Rosellini, I.; Pezzarossa, B. Production of Selenium-Biofortified Microgreens from Selenium-Enriched Seeds of Basil. J. Sci. Food Agric. 2019, 99, 4353–4362. [Google Scholar] [CrossRef]
  23. Pannico, A.; El-Nakhel, C.; Graziani, G.; Kyriacou, M.C.; Giordano, M.; Soteriou, G.A.; Zarrelli, A.; Ritieni, A.; de Pascale, S.; Rouphael, Y. Selenium Biofortification Impacts the Nutritive Value, Polyphenolic Content, and Bioactive Constitution of Variable Microgreens Genotypes. Antioxidants 2020, 9, 272. [Google Scholar] [CrossRef] [PubMed] [Green Version]
  24. Bandiera, M.; Dal Cortivo, C.; Barion, G.; Mosca, G.; Vamerali, T. Phytoremediation Opportunities with Alimurgic Species in Metal-Contaminated Environments. Sustainability 2016, 8, 357. [Google Scholar] [CrossRef] [Green Version]
  25. Tardío, J.; de Cortes Sánchez-Mata, M.; Morales, R.; Molina, M.; García-Herrera, P.; Morales, P.; Díez-Marqués, C.; Fernández-Ruiz, V.; Cámara, M.; Pardo-De-Santayana, M.; et al. Ethnobotanical and food composition monographs of selected mediterranean wild edible plants. In Mediterranean Wild Edible Plants: Ethnobotany and Food Composition Tables; Springer: New York, NY, USA, 2016; pp. 273–470. ISBN 9781493933297. [Google Scholar]
  26. Bello, O.M.; Fasinu, P.S.; Bello, O.E.; Ogbesejana, A.B.; Adetunji, C.O.; Dada, A.O.; Ibitoye, O.S.; Aloko, S.; Oguntoye, O.S. Wild Vegetable Rumex Acetosa Linn.: Its Ethnobotany, Pharmacology and Phytochemistry—A Review. S. Afr. J. Bot. 2019, 125, 149–160. [Google Scholar] [CrossRef]
  27. Koyro, H.W. Effect of Salinity on Growth, Photosynthesis, Water Relations and Solute Composition of the Potential Cash Crop Halophyte Plantago coronopus (L.). Environ. Exp. Bot. 2006, 56, 136–146. [Google Scholar] [CrossRef]
  28. Jdey, A.; Falleh, H.; ben Jannet, S.; Mkadmini Hammi, K.; Dauvergne, X.; Ksouri, R.; Magné, C. Phytochemical Investigation and Antioxidant, Antibacterial and Anti-Tyrosinase Performances of Six Medicinal Halophytes. S. Afr. J. Bot. 2017, 112, 508–514. [Google Scholar] [CrossRef]
  29. Liu, L.; Howe, P.; Zhou, Y.F.; Xu, Z.Q.; Hocart, C.; Zhang, R. Fatty Acids and β-Carotene in Australian Purslane (Portulaca oleracea) Varieties. J. Chromatogr. A 2000, 893, 207–213. [Google Scholar] [CrossRef]
  30. Petropoulos, S.; Karkanis, A.; Fernandes, Â.; Barros, L.; Ferreira, I.C.F.R.; Ntatsi, G.; Petrotos, K.; Lykas, C.; Khah, E. Chemical Composition and Yield of Six Genotypes of Common Purslane (Portulaca oleracea L.): An Alternative Source of Omega-3 Fatty Acids. Plant Foods Hum. Nutr. 2015, 70, 420–426. [Google Scholar] [CrossRef]
  31. Nursery | Manifattura_Maiano. Available online: http://www.maiano.it/eng/nursery.html (accessed on 4 April 2021).
  32. Hoagland, D.R.; Arnon, D.I. The Water-Culture Method for Growing Plants without Soil: University of California. Calif. Agric. Exp. Stn. 1938, 347, 36–39. [Google Scholar]
  33. Kang, H.M.; Saltveit, M.E. Antioxidant Capacity of Lettuce Leaf Tissue Increases after Wounding. J. Agric. Food Chem. 2002, 50, 7536–7541. [Google Scholar] [CrossRef]
  34. Kim, D.O.; Chun, O.K.; Kim, Y.J.; Moon, H.Y.; Lee, C.Y. Quantification of Polyphenolics and Their Antioxidant Capacity in Fresh Plums. J. Agric. Food Chem. 2003, 51, 6509–6515. [Google Scholar] [CrossRef]
  35. Benzie, I.F.F.; Strain, J. The Ferric Reducing Ability of Plasma (FRAP) as a Measure of “Antioxidant Power”: The FRAP Assay. Anal. Biochem. 1996, 239, 70–76. [Google Scholar] [CrossRef] [Green Version]
  36. Lichtenthaler, H.K. [34] Chlorophylls and Carotenoids: Pigments of Photosynthetic Biomembranes. Methods Enzymol. 1987, 148, 350–382. [Google Scholar] [CrossRef]
  37. Hrazdina, G.; Marx, G.A.; Hoch, H.C. Distribution of Secondary Plant Metabolites and Their Biosynthetic Enzymes in Pea (Pisum sativum L.) Leaves. Plant Physiol. 1982, 70, 745–748. [Google Scholar] [CrossRef] [Green Version]
  38. UNI EN 13657. Characterization of Waste—Digestion for Subsequent Determination of Aqua Regia Soluble Portion of Elements; International Standard: Geneva, Switzerland, 2004. [Google Scholar]
  39. UNI EN ISO 17294-2. Water Quality—Application of Inductively Coupled Plasma Mass Spectrometry (ICP-MS)—Part 2: Determination of Selected Elements Including Uranium Isotopes; International Standard: Geneva, Switzerland, 2016; p. 31. [Google Scholar]
  40. EFSA. Scientific Opinion on Dietary Reference Values for Selenium. EFSA J. 2014, 12, 3846. [Google Scholar] [CrossRef]
  41. Kumar, M.; Rahman, M.M.; Ramanathan, A.L.; Naidu, R. Arsenic and Other Elements in Drinking Water and Dietary Components from the Middle Gangetic Plain of Bihar, India: Health Risk Index. Sci. Total Environ. 2016, 539, 125–134. [Google Scholar] [CrossRef] [PubMed]
  42. EFSA. Tolerable Upper Intake Levels for Vitamins and Minerals; European Food Safety Authority: Parma, Italy, 2006. [Google Scholar]
  43. Paradiso, V.M.; Castellino, M.; Renna, M.; Gattullo, C.E.; Calasso, M.; Terzano, R.; Allegretta, I.; Leoni, B.; Caponio, F.; Santamaria, P. Nutritional Characterization and Shelf-Life of Packaged Microgreens. Food Funct. 2018, 9, 5629–5640. [Google Scholar] [CrossRef] [Green Version]
  44. Bulgari, R.; Baldi, A.; Ferrante, A.; Lenzi, A. Yield and Quality of Basil, Swiss Chard, and Rocket Microgreens Grown in a Hydroponic System. N. Z. J. Crop Hortic. Sci. 2017, 45, 119–129. [Google Scholar] [CrossRef]
  45. Renna, M.; Castellino, M.; Leoni, B.; Paradiso, V.; Santamaria, P.; Renna, M.; Castellino, M.; Leoni, B.; Paradiso, V.M.; Santamaria, P. Microgreens Production with Low Potassium Content for Patients with Impaired Kidney Function. Nutrients 2018, 10, 675. [Google Scholar] [CrossRef] [PubMed] [Green Version]
  46. Dall’Acqua, S.; Ertani, A.; Pilon-Smits, E.A.H.; Fabrega-Prats, M.; Schiavon, M. Selenium Biofortification Differentially Affects Sulfur Metabolism and Accumulation of Phytochemicals in Two Rocket Species (Eruca sativa Mill. and Diplotaxis tenuifolia) Grown in Hydroponics. Plants 2019, 8, 68. [Google Scholar] [CrossRef] [PubMed] [Green Version]
  47. Paradiso, V.M.; Castellino, M.; Renna, M.; Leoni, B.; Caponio, F.; Santamaria, P. Simple Tools for Monitoring Chlorophyll in Broccoli Raab and Radish Microgreens on Their Growing Medium during Cold Storage. Prog. Nutr. 2018, 20, 415–422. [Google Scholar] [CrossRef]
  48. Xiao, Z.; Luo, Y.; Lester, G.E.; Kou, L.; Yang, T.; Wang, Q. Postharvest Quality and Shelf Life of Radish Microgreens as Impacted by Storage Temperature, Packaging Film, and Chlorine Wash Treatment. LWT Food Sci. Technol. 2014, 55, 551–558. [Google Scholar] [CrossRef]
  49. Tan, L.; Nuffer, H.; Feng, J.; Kwan, S.H.; Chen, H.; Tong, X.; Kong, L. Antioxidant Properties and Sensory Evaluation of Microgreens from Commercial and Local Farms. Food Sci. Hum. Wellness 2020, 9, 45–51. [Google Scholar] [CrossRef]
  50. Lobiuc, A.; Vasilache, V.; Oroian, M.; Stoleru, T.; Burducea, M.; Pintilie, O.; Zamfirache, M.-M.; Lobiuc, A.; Vasilache, V.; Oroian, M.; et al. Blue and Red LED Illumination Improves Growth and Bioactive Compounds Contents in Acyanic and Cyanic Ocimum basilicum L. Microgreens. Molecules 2017, 22, 2111. [Google Scholar] [CrossRef] [Green Version]
  51. Xiao, Z.; Lester, G.E.; Luo, Y.; Xie, Z.; Yu, L.; Wang, Q. Effect of Light Exposure on Sensorial Quality, Concentrations of Bioactive Compounds and Antioxidant Capacity of Radish Microgreens during Low Temperature Storage. Food Chem. 2014, 151, 472–479. [Google Scholar] [CrossRef]
  52. Samuolienė, G.; Viršilė, A.; Brazaitytė, A.; Jankauskienė, J.; Sakalauskienė, S.; Vaštakaitė, V.; Novičkovas, A.; Viškelienė, A.; Sasnauskas, A.; Duchovskis, P. Blue Light Dosage Affects Carotenoids and Tocopherols in Microgreens. Food Chem. 2017, 228, 50–56. [Google Scholar] [CrossRef] [PubMed]
  53. Brazaityte, A.; Sakalauskiene, S.; Samuoliene, G.; Jankauskiene, J.; Viršile, A.; Novičkovas, A.; Sirtautas, R.R.; Miliauskiene, J.; Vaštakaite, V.; Dabašinskas, L.; et al. The Effects of LED Illumination Spectra and Intensity on Carotenoid Content in Brassicaceae Microgreens. Food Chem. 2015, 173, 600–606. [Google Scholar] [CrossRef]
  54. Hartikainen, H.; Xue, T.; Piironen, V. Selenium as an Anti-Oxidant and pro-Oxidant in Ryegrass. Plant Soil 2000, 225, 193–200. [Google Scholar] [CrossRef]
  55. Terry, N.; Zayed, A.M.; de Souza, M.P.; Tarun, A.S. Selenium in Higher Plants. Annu. Rev. Plant Physiol. Plant Mol. Biol. 2000, 51, 401–432. [Google Scholar] [CrossRef] [Green Version]
  56. D’Amato, R.; Fontanella, M.C.; Falcinelli, B.; Beone, G.M.; Bravi, E.; Marconi, O.; Benincasa, P.; Businelli, D. Selenium Biofortification in Rice (Oryza sativa L.) Sprouting: Effects on Se Yield and Nutritional Traits with Focus on Phenolic Acid Profile. J. Agric. Food Chem. 2018, 66, 4082–4090. [Google Scholar] [CrossRef]
  57. Di Gioia, F.; Petropoulos, S.A.; Ozores-Hampton, M.; Morgan, K.; Rosskopf, E.N. Zinc and Iron Agronomic Biofortification of Brassicaceae Microgreens. Agronomy 2019, 9, 677. [Google Scholar] [CrossRef] [Green Version]
  58. Akladious, S.A. Influence of Different Soaking Times with Selenium on Growth, Metabolic Activities of Wheat Seedlings under Low Temperature Stress. Afr. J. Biotechnol. 2012, 11, 14792–14804. [Google Scholar] [CrossRef]
  59. Feng, R.; Wei, C.; Tu, S. The Roles of Selenium in Protecting Plants against Abiotic Stresses. Environ. Exp. Bot. 2013, 87, 58–68. [Google Scholar] [CrossRef]
  60. Jiang, C.; Zu, C.; Shen, J.; Shao, F.; Li, T. Effects of Selenium on the Growth and Photosynthetic Characteristics of Flue-Cured Tobacco (Nicotiana tabacum L.). Acta Soc. Bot. Pol. 2015, 84, 71–77. [Google Scholar] [CrossRef] [Green Version]
  61. Yao, X.; Chu, J.; Ba, C. Antioxidant Responses of Wheat Seedlings to Exogenous Selenium Supply under Enhanced Ultraviolet-B. Biol. Trace Elem. Res. 2010, 136, 96–105. [Google Scholar] [CrossRef]
  62. Xia, Q.; Yang, Z.; Shui, Y.; Liu, X.; Chen, J.; Khan, S.; Wang, J.; Gao, Z. Methods of Selenium Application Differentially Modulate Plant Growth, Selenium Accumulation and Speciation, Protein, Anthocyanins and Concentrations of Mineral Elements in Purple-Grained Wheat. Front. Plant Sci. 2020, 11, 1114. [Google Scholar] [CrossRef]
  63. Liu, D.; Li, H.; Wang, Y.; Ying, Z.; Bian, Z.; Zhu, W.; Liu, W.; Yang, L.; Jiang, D. How Exogenous Selenium Affects Anthocyanin Accumulation and Biosynthesis-Related Gene Expression in Purple Lettuce. Pol. J. Environ. Stud. 2017, 26, 717–722. [Google Scholar] [CrossRef]
  64. Lin, L.; Zhou, W.; Dai, H.; Cao, F.; Zhang, G.; Wu, F. Selenium Reduces Cadmium Uptake and Mitigates Cadmium Toxicity in Rice. J. Hazard. Mater. 2012, 235–236, 343–351. [Google Scholar] [CrossRef]
  65. Combs, G.F. Selenium in Global Food Systems. Br. J. Nutr. 2001, 85, 517–547. [Google Scholar] [CrossRef] [Green Version]
  66. Castillo-Godina, R.G.; Foroughbakhch-Pournavab, R.; Benavides-Mendoza, A. Effect of Selenium on Elemental Concentration and Antioxidant Enzymatic Activity of Tomato Plants. J. Agric. Sci. Technol. 2016, 18, 233–244. [Google Scholar]
  67. Puccinelli, M.; Pezzarossa, B.; Rosellini, I.; Malorgio, F. Selenium Enrichment Enhances the Quality and Shelf Life of Basil Leaves. Plants 2020, 9, 801. [Google Scholar] [CrossRef]
  68. Emam, M.M.; Khattab, H.E.; Helal, N.M.; Deraz, A.E. Effect of Selenium and Silicon on Yield Quality of Rice Plant Grown under Drought Stress. Aust. J. Crop Sci. 2014, 8, 596–605. [Google Scholar]
  69. Shahidi, F.; Janitha, P.K.; Wanasundara, P.D. Phenolic Antioxidants. Crit. Rev. Food Sci. Nutr. 1992, 32, 67–103. [Google Scholar] [CrossRef]
  70. Tian, X.-Y.; Wang, Z.Y. Effects of Selenium Application on Content, Distribution and Accumulation of Selenium, Flavonoids and Rutin in Tartary Buckwheat. Plant Nutr. Fertil. Sci. 2008, 14, 721–727. [Google Scholar]
Figure 1. Se content (mg kg−1 DW) in microgreens of various wild plant species grown indoors under controlled conditions with different concentrations of Se in the substrate. Bars indicated by the same letter are not statistically different for p = 0.05 after Duncan’s test. Significance level: *** p ≤ 0.001.
Agronomy 11 01155 g001
Figure 2. Nonlinear regression of Se concentration (mg kg−1 DW) (a) and content (ng plant) (b) of biofortified microgreens of P. oleracea and Se concentration in the substrate.
Agronomy 11 01155 g002
Figure 3. Total chlorophyll (a), carotenoid (b), and anthocyanin (c) contents in microgreens of P. oleracea grown indoors under controlled conditions with different concentrations of Se in the substrate. Bars indicated by the same letter are not statistically different for p = 0.05 after Duncan’s test. Significance level: ** p ≤ 0.01; * p ≤ 0.05.
Agronomy 11 01155 g003
Figure 4. Antioxidant capacity measured by FRAP assay (a), flavonoid (b), and total phenol (c) contents in microgreens of P. oleracea grown indoors under controlled conditions with different concentrations of Se in the substrate. Bars indicated by the same letter are not statistically different for p = 0.05 after Duncan’s test. Significance level: ** p ≤ 0.01; * p ≤ 0.05; ns = not significant.
Agronomy 11 01155 g004
Table 1. Fresh (FW), dry (DW) biomass, and dry matter content (DW/FW) of microgreens of various wild plant species grown indoors under controlled conditions with different concentrations of Se in the substrate.
Plant SpeciesSe added mg L−1FW
kg m−2
DW
kg m−2
DW/FW
%
R. acetosa00.8740.0717.95
1.50.8520.0779.00
P. coronopus01.9720.0985.02
1.51.7510.0864.92
P. oleracea00.6380.0345.29
1.50.5050.0377.37
MEAN EFFECT
R. acetosa 0.863b0.074b8.47a
P. coronopus 1.861a0.092a4.97c
P. oleracea 0.564c0.036c6.45b
01.199a0.0706.14b
1.51.046b0.0677.09a
ANOVA
Plant Species (PS) *********
Selenium concentration (Se) *ns*
PS x Se nsnsns
Means (n = 3) flanked by the same letter are not statistically different for p = 0.05 after Duncan’s test. Significance level: *** p ≤ 0.001; * p ≤ 0.05; ns = not significant.
Table 2. Selenium estimated daily intake (EDI), selenium estimated dietary intake expressed as percentage of the Se adequate intake (AI), and health risk index (HRI) of Se resulting from the consumption of 10 g per day of microgreens of various wild plant species grown indoors under controlled conditions with different concentrations of Se in the substrate.
Plant SpeciesSe Added
mg L−1
EDI
µg day−1
EDI
%
HRI
R. acetosa00.15d0.21d0.001d
1.518.81c 26.87c0.063c
P. coronopus00.09d0.13d0.0003d
1.537.40a 53.43a0.1247a
P. oleracea00.08d0.11d0.0003d
1.530.14b43.05b0.1005b
MEAN EFFECT
R. acetosa 9.48c13.54c0.0316c
P. coronopus 18.75a26.78a0.0625a
P. oleracea 15.11b21.54b0.0504b
00.105b0.15b0.0004b
1.528.78a41.12a0.0959a
ANOVA
Plant Species (PS) *********
Selenium concentration (Se)*********
PS x Se *********
Means (n = 3) flanked by the same letter are not statistically different for p = 0.05 after Duncan’s test. Significance level: *** p ≤ 0.001.
Table 3. Total chlorophyll (Chls tot) and carotenoid (Car) content, antioxidant capacity (FRAP), total phenols (Phen tot.), and flavonoid (Flav) content, expressed as fresh weight in microgreens of various wild plant species grown indoors under controlled conditions with different concentrations of Se in the substrate.
Plant SpeciesSe added
mg L−1
Chls tot
mg g−1
Car
mg g−1
FRAP
µmol Fe(II)g−1
Phen tot.
mg GAE g−1
Flav
mg catechin g−1
R. acetosa00.5640.09834.33.341.90
1.50.5420.09535.73.432.11
P. coronopus00.7620.08026.32.302.00
1.50.8420.09339.02.902.80
P. oleracea00.6290.10128.02.301.90
1.50.6630.10832.72.601.90
MEAN EFFECT
R. acetosa 0.554c0.096ab35.03.38a2.01ab
P. coronopus 0.802a0.087b32.72.59b2.42a
P. oleracea 0.645b0.104a30.42.42b1.89b
00.6520.09329.5b2.601.90b
1.50.6830.09935.8a3.002.30a
ANOVA
Plant Species (PS)****ns***
Selenium concentration (Se)nsns*ns*
PS x Sensnsnsnsns
Means (n = 3) flanked by the same letter are not statistically different for p = 0.05 after Duncan’s test. Significance level: *** p ≤ 0.001; ** p ≤ 0.01; * p ≤ 0.05; ns = not significant.
Table 4. Fresh (FW) and dry (DW) biomass, dry matter content (DW/FW), Se content, Se estimated daily intake (EDI), Se estimated dietary intake expressed as percentage of the Se adequate intake (AI), and health risk index (HRI) of microgreens of P. oleracea grown indoors under controlled conditions with different concentrations of Se in the substrate.
Se added
mg L−1
FW
kg m−2
DW
kg m−2
DW/FW
%
Se
mg kg−1 DW
EDI
µg day −1
EDI
%
HRI
00.4760.0357.341.2d0.88d1.250d0.003d
1.50.5080.0356.9850.4c32.69c46.70c0.109c
5.00.5180.0397.58160.7b118.51b169.29b0.395b
10.00.4800.0368.01430.3a328.73a469.61a1.096a
ANOVA
Se concentrationnsnsns************
Means (n = 3) flanked by the same letter are not statistically different for p = 0.05 after Duncan’s test. Significance level: *** p ≤ 0.001; ns = not significant.
Publisher’s Note: MDPI stays neutral with regard to jurisdictional claims in published maps and institutional affiliations.

